
Tuesdays Tremors
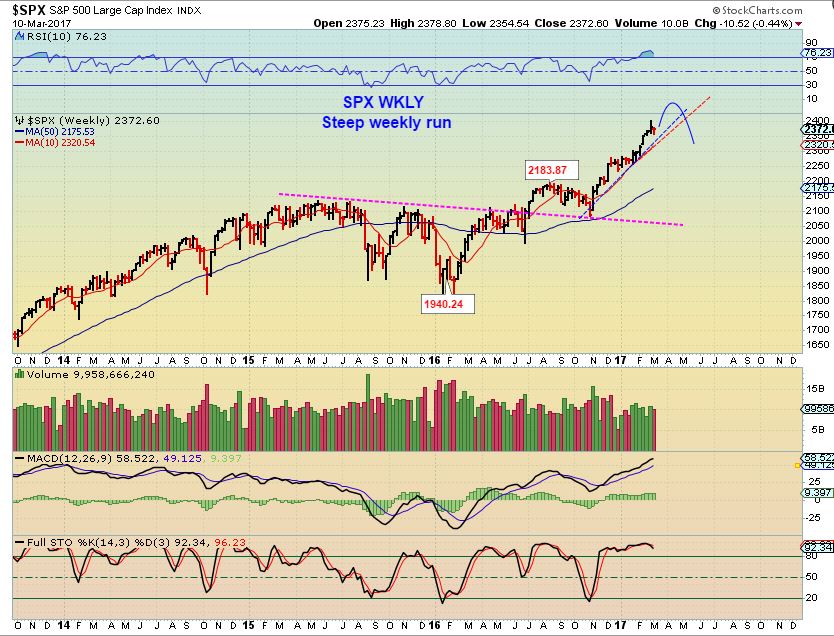
The Markets are basically all over the place since the Fed Rate Hike and Tuesdays drop in some sectors seemed to come out of nowhere. At this point in time, I want to review expectations past and expectations now.
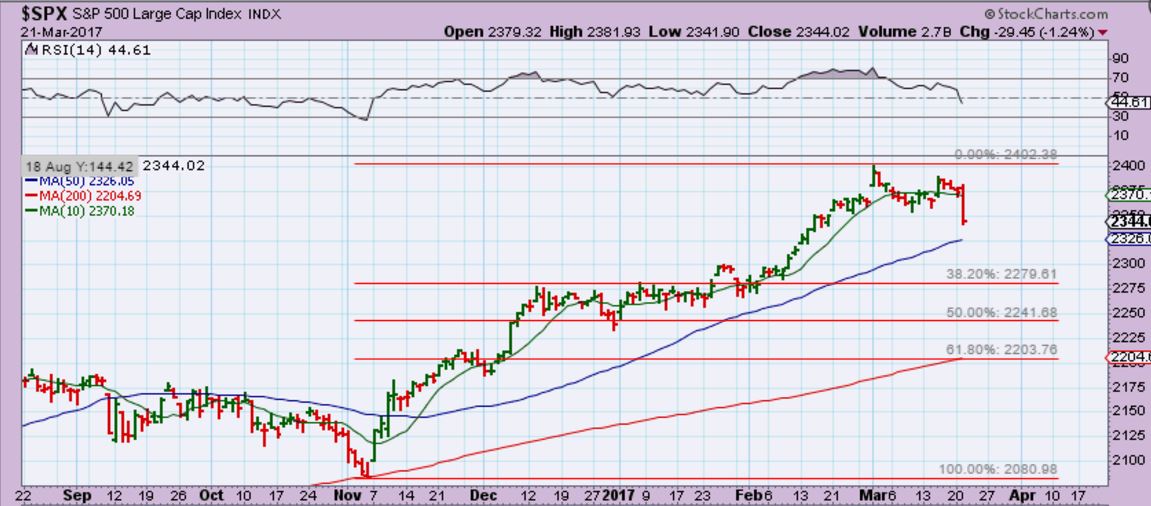
SPX – On March 7th, We were looking at a drop into a dcl. I expected it to possibly tag the 50sma and slightly break the trend line, as shown in this chart.
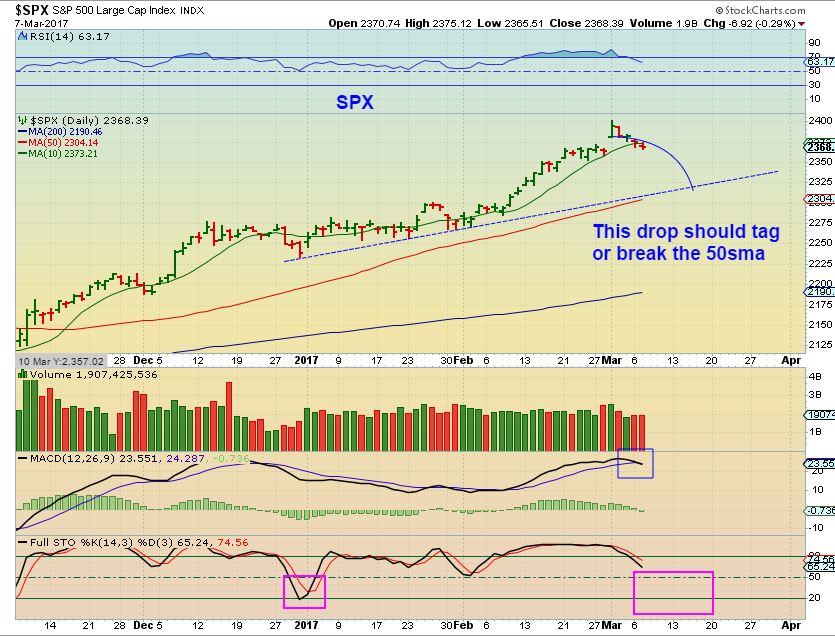
SPX – 1 week later we had a bounce and it looked like the dcl came in and we got our swing low. I still hold to this idea, but when you get a daily cycle as right translated as the last one was, you look for a POP to new highs and then it can roll over. See what I wrote on this chart.
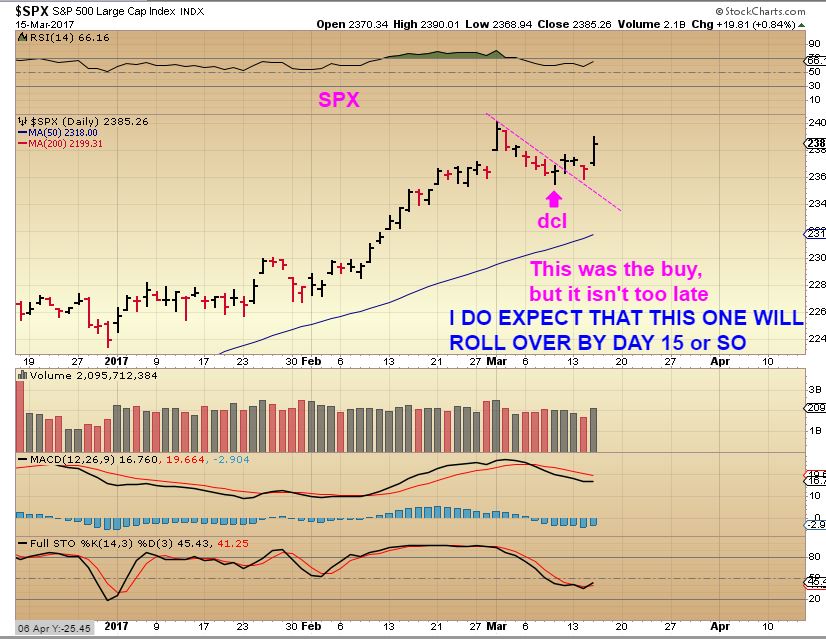
So after a bounce to new highs, we would look for the markets to roll over into an ICL .
SPX MARCH 21- We did not get our push to new highs before the markets just took a sudden plunge. This looks like a drop into an Intermediate cycle low (ICL) has started, the multi-month trend line has been broken. The low that I labelled as a dcl has been broken. It would be best to watch how this drops and see if the next swing low sets up a BUYING opportunity.
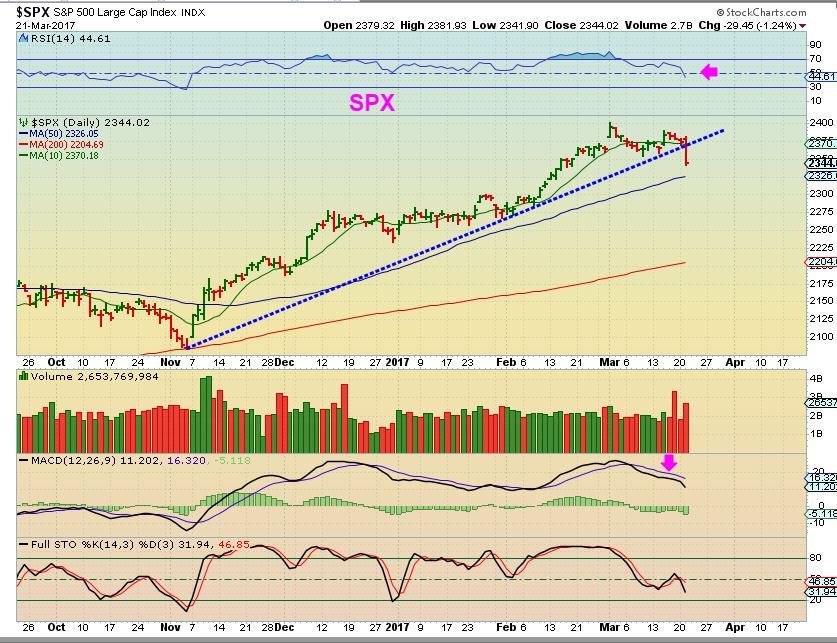
Lets look at a few other things in this area…
SPX POSSIBLE TARGETS – short term for a bounce
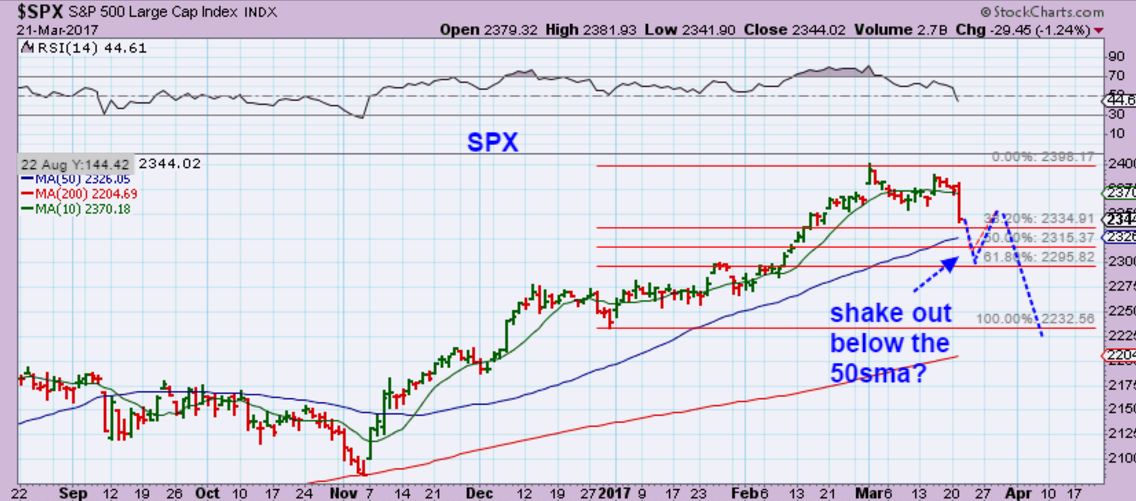
An ICL could hit one of the levels shown here.
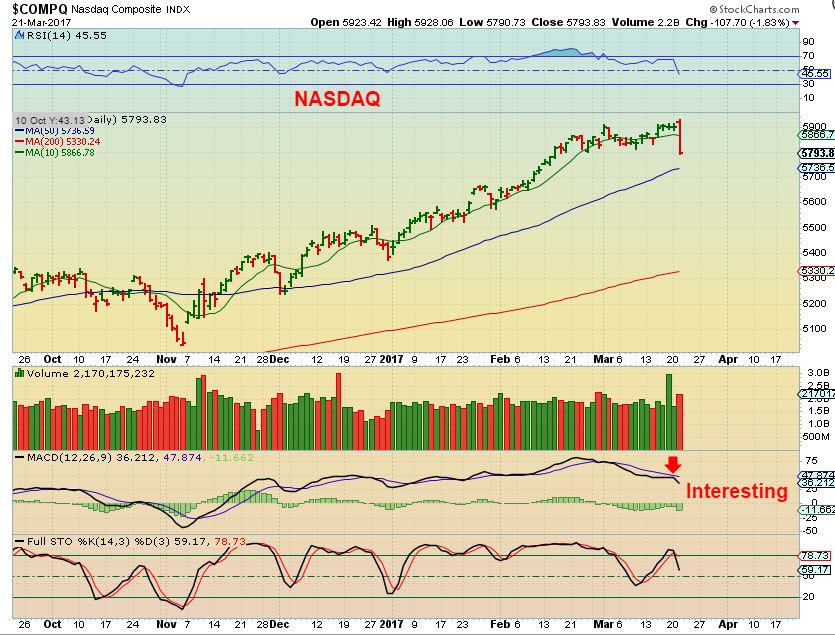
NASDAQ– I just wanted to point out that not only did the SPX drop, but the NASDAQ , which was holding up better, dropped quickly too. RUT, IWM, ETC ETC are similar set ups.
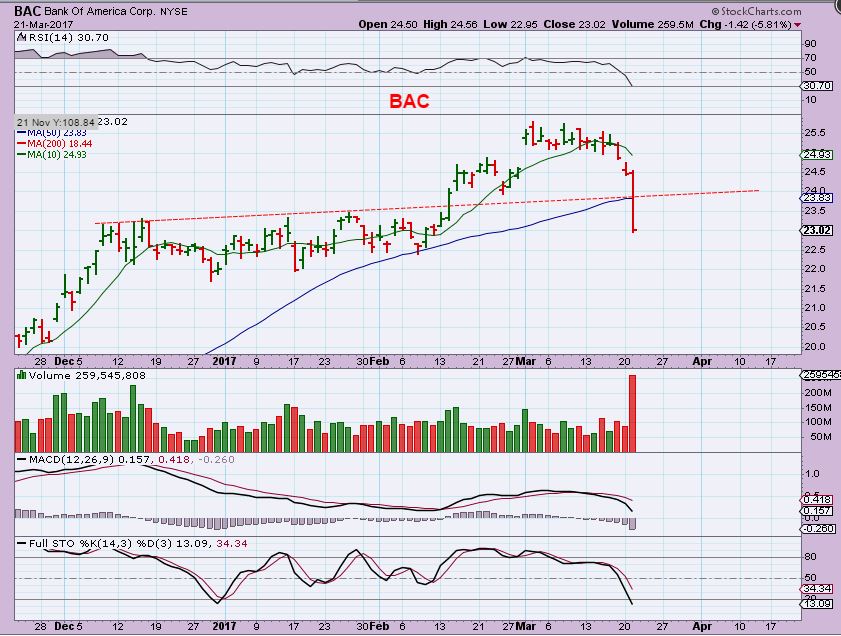
XLF – And the Financials gave it up.
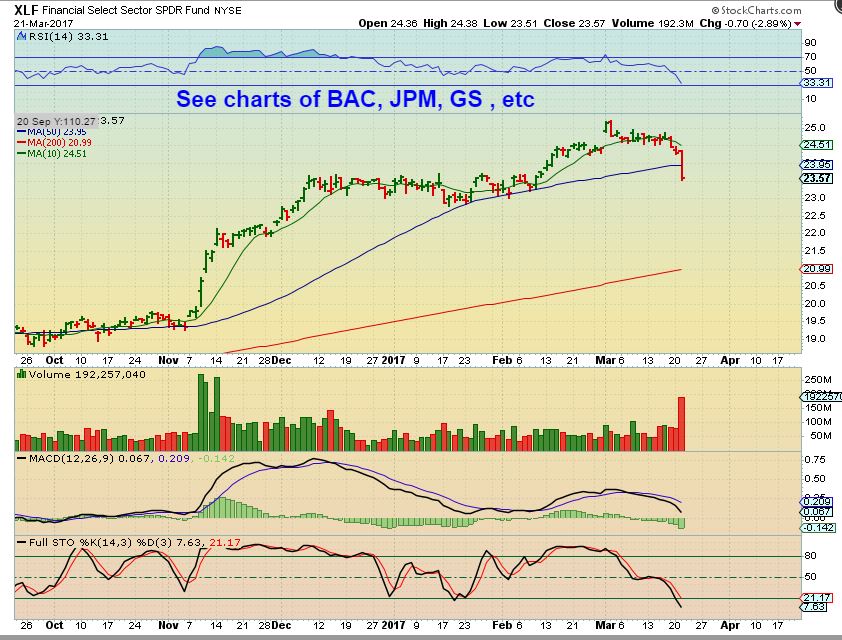
SIDENOTE: Look at March 9 on the XLF chart above. SOME SECTORS like XLF do not really show a MARCH 9th dip into a dcl like we pointed out on SPX & NASDAQ. This raises a question, WAS it the dcl, or is this the real drop into a 2nd dcl? If this is the dcl from Feb 18th to now, the peak was day 29 and this is around day 44, so it could still be a r.t. daily cycle. In all honesty, that really looked like a mild dcl on march 19th in the SPX & NASDAQ, etc.
BAC – Banks like BAC, JPM, GS, and many more individual charts looks pretty serious too.
THOUGHT FOR THE DAY: You have to admit that this type of swift market action since Fed Wednesday has been a bit unpredictable, and I don’t know of any of many that are consistently getting these market moves correct in advance. Moves that I would expect to happen over a few days when the markets roll over are happening in a single afternoon. That alone makes this a VERY difficult environment to trade in with confidence. It really needs to settle down a bit for trade set ups to stabilize. Stops and Honoring stops on any positions is vital to protect funds. I have also been encouraging being LIGHTLY invested, saying that I was mostly in Cash and just trading a few set ups here and there. Golds ICL is the place to go all in. so Position size and stop are a protection in volatile markets. Let’s continue on…
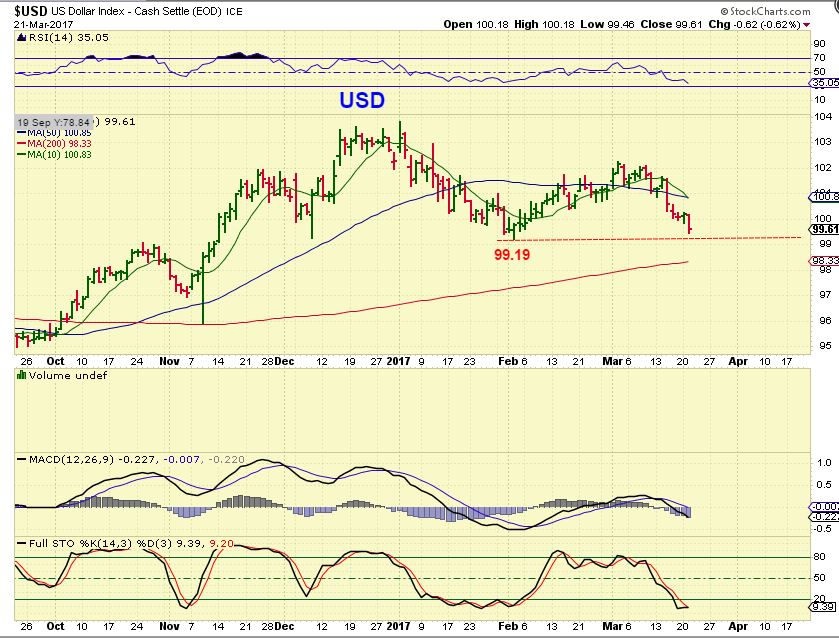
USD – We had a solid reversal in the USD Monday, and the timing is late for a dcl in the USD, but it dropped further on Tuesday too. We are overdue for a DCL. It is also VERY close to breaking the prior dcl, which would be quite bearish for the USD longer term ( And likely Bullish for GOLD). Watch the 99.19 area.
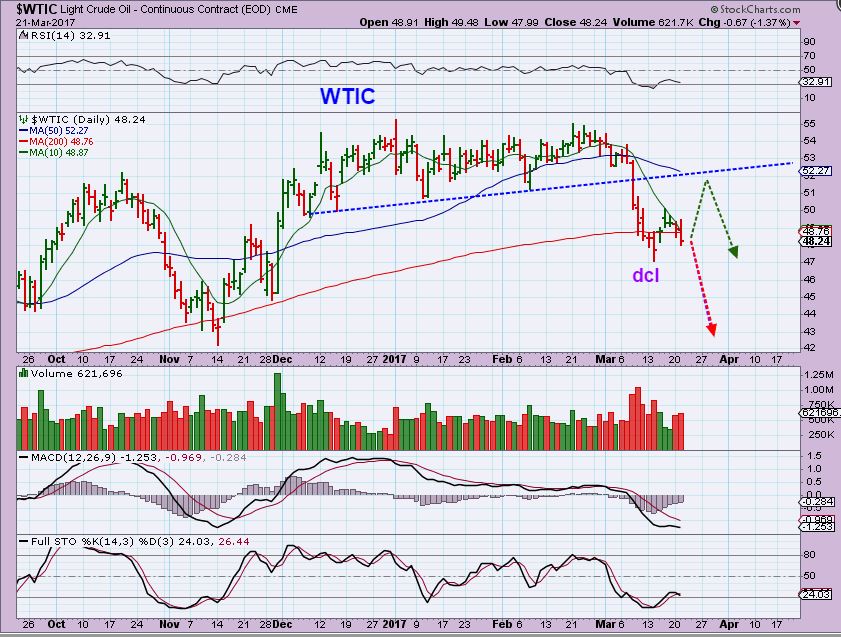
WTIC REVIEW CHART #1– MARCH 17 OIL had plunged lower and was bouncing. I thought that OIL could back test the break down at ‘B’, and I wanted to short it there, because I do NOT think OIL has put in an ICL on this drop.
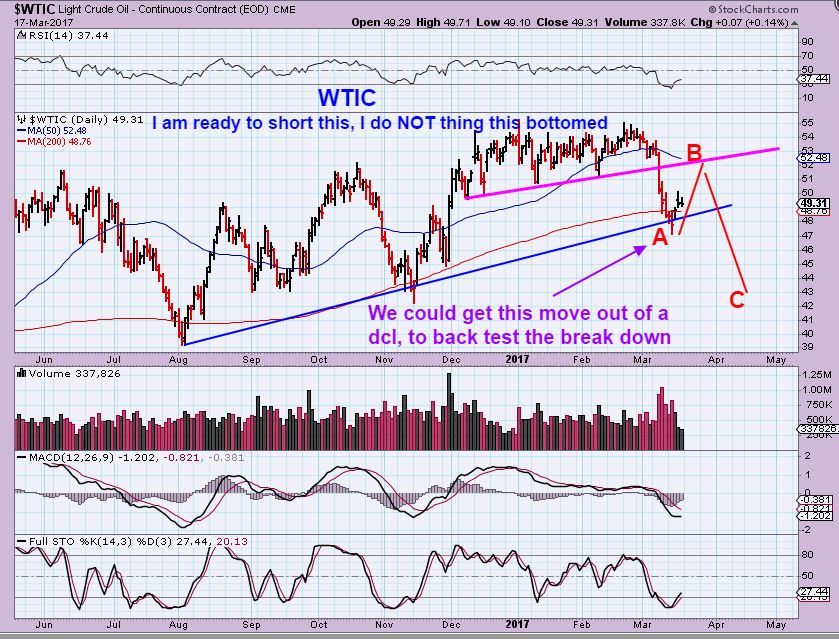
CHART #2 – I also mentioned on March 17th that this is POSSIBLY the extent of the bounce and we could get an a-b-c- type move lower. This is seeming to be the most likely scenario, because Oil looks weak.
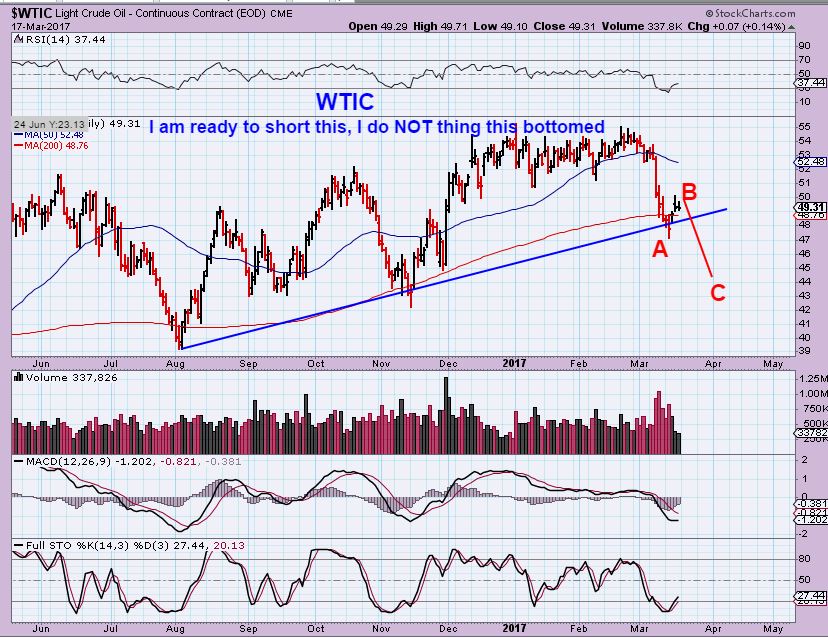
CHART #3 – Tuesday I pointed out that that 10sma is acting as resistance and Oil remains weak.
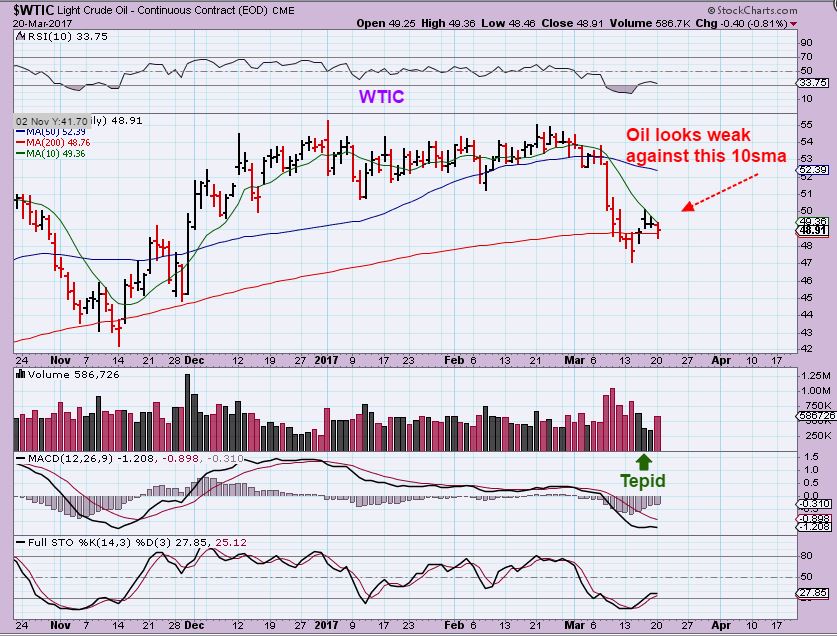
CHART #4– One way or the other, I expect OIL to drop to the lower 40’s. If the ‘DCL’ lows are taken out under 47, I will just have to jump on a short position then. If we get the bounce ( green line), I’ll get a MUCH better entry, but I view this as less likely. ( DUG is an ultra short etf, DWT is a 3x etf short Oil, Drip & ERY cover energy )
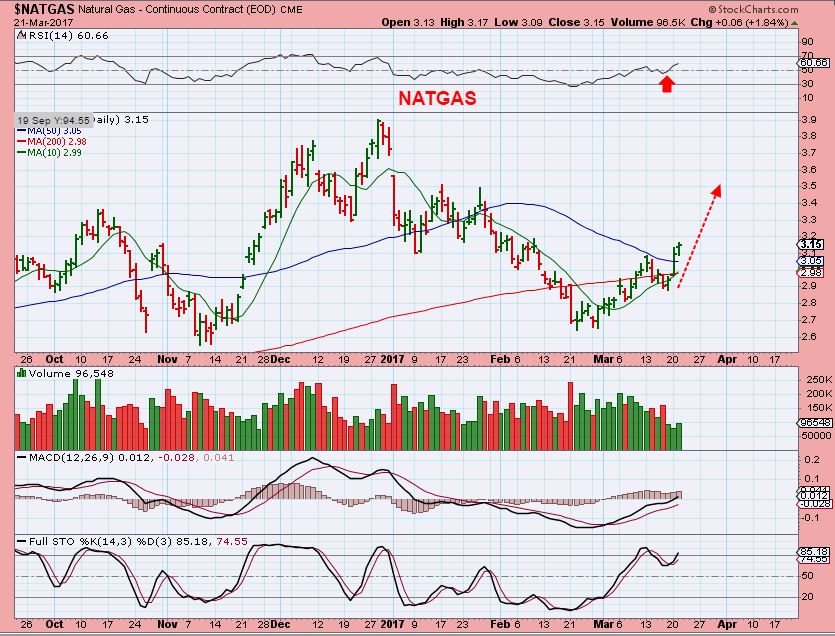
NATGAS – I am in a long natgas position for a while now and added on a recent dip that I think was a dcl. This one is playing out as expected so far and I do expect it to continue higher, but back tests of the 50sma or 200sma are possible. INVENTORY REPORTS ARE RELEASED ON THURSDAY, I WILL LIKELY STOP OUT UNDER THE 200sma or MAYBE NATGAS under the recent dcl.
.
GOLD – This is actually playing out as expected, the problem is that we ( Or I ) am having trouble trusting it day by day with a low due in the USD. I have mentioned repeatedly that GOLD has 2 R.T. daily cycles and expectations are that it should get up to the 200sma. SO far, it is still working its way up there.
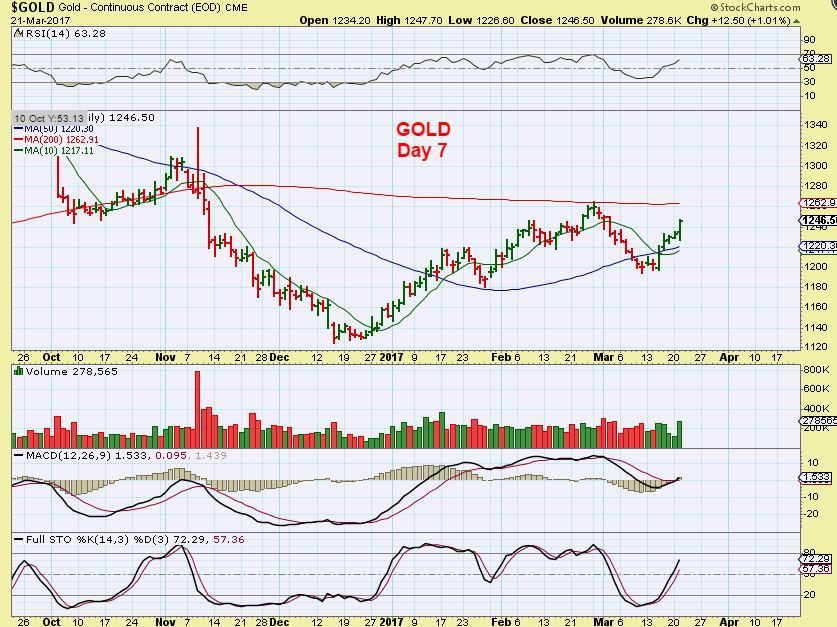
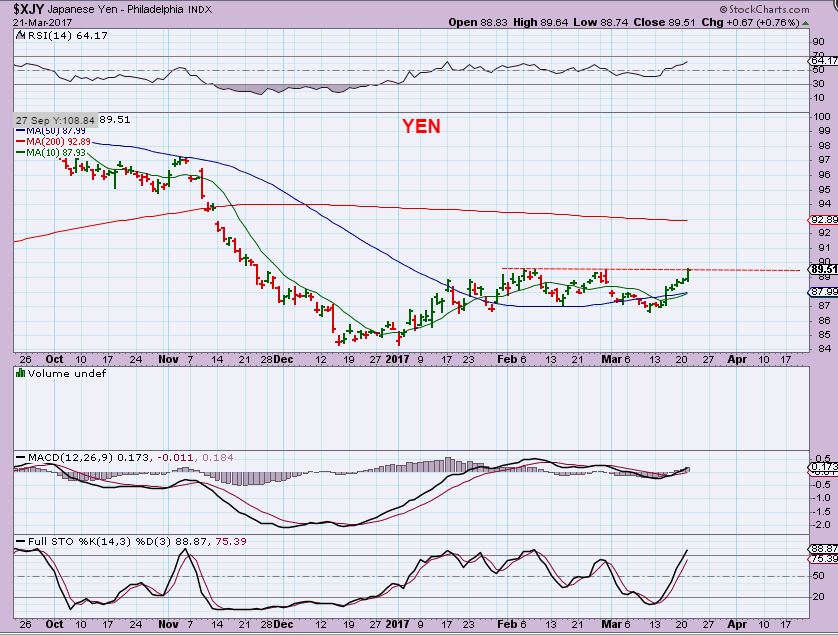
XJY – I did a report months ago on the strong correlation of GOLD & the YEN throughout the years. The YEN is back at the February highs, so this may be telling us that GOLD will follow its lead.
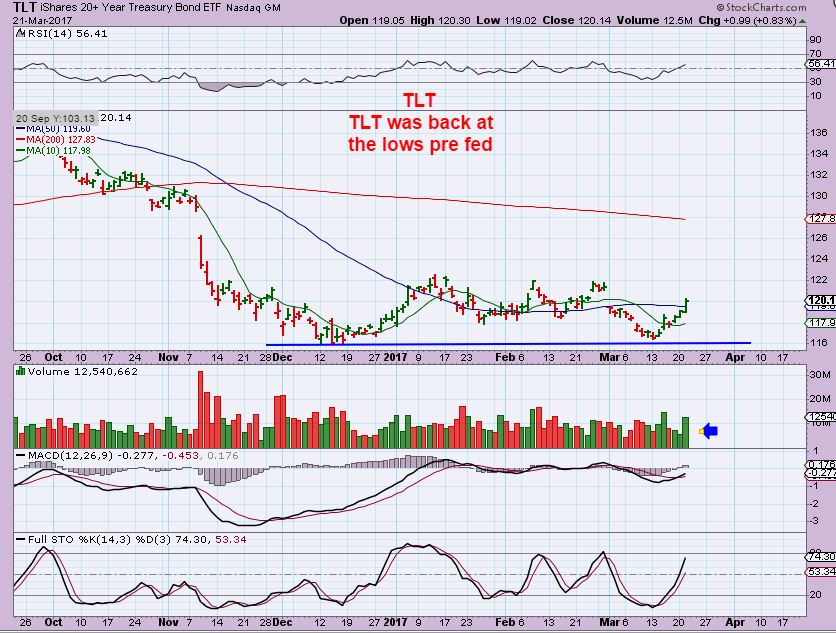
TLT – I never took or recommended the TLT trade, because I did not like the overall chart set up, but some think that it is similar to Gold at times too, so lets take a fresh look. Recently it dropped back to the lows of December, and NOW it looks more healthy to me, with that MACD divergence and other factors. TLT now looks like a proper double bottom. If the YEN breaks out from here, and the TLT breaks out from here, I dont see why GOLD wouldn’t, BUT…. We may need to see the USD put in a dcl first and then run up as these pull back & consolidate further. When the USD rolls over, these can run.
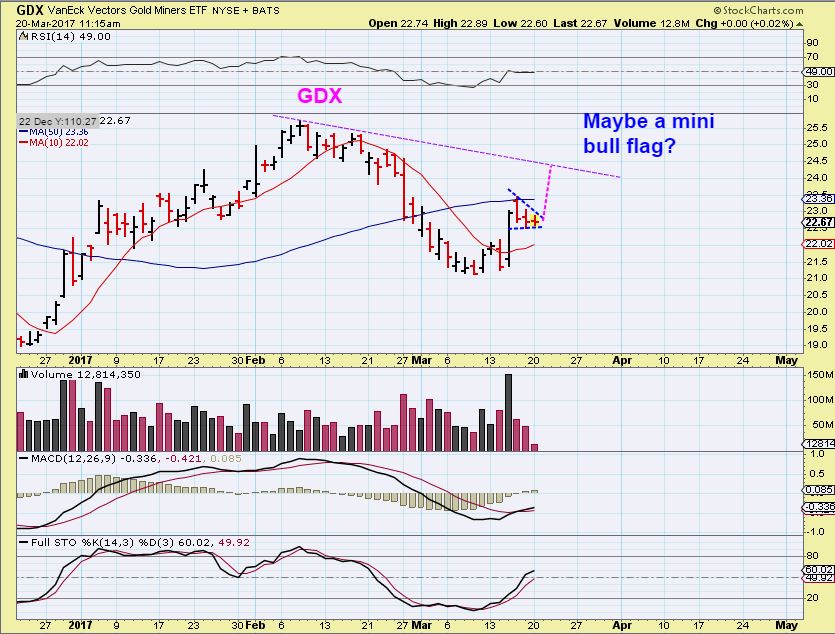
GDX – My thinking on Monday was a possible mini bull flag worth a quick trade. If Gold was to continue higher, this could follow in my opinion.
GDX – So while GOLD did move higher and is nearing the FEB highs, GDX & GDXJ are struggling at the 50sma. I had mentioned taking a leveraged risky trade at the FED POP and seeing how it played out. Then on Monday I mentioned that I added to my risky trade when I saw a bull flag form. Maybe I became leveraged a bit too heavy for comfort, even though the trade was working out, because Miners were stalling at the 50sma.
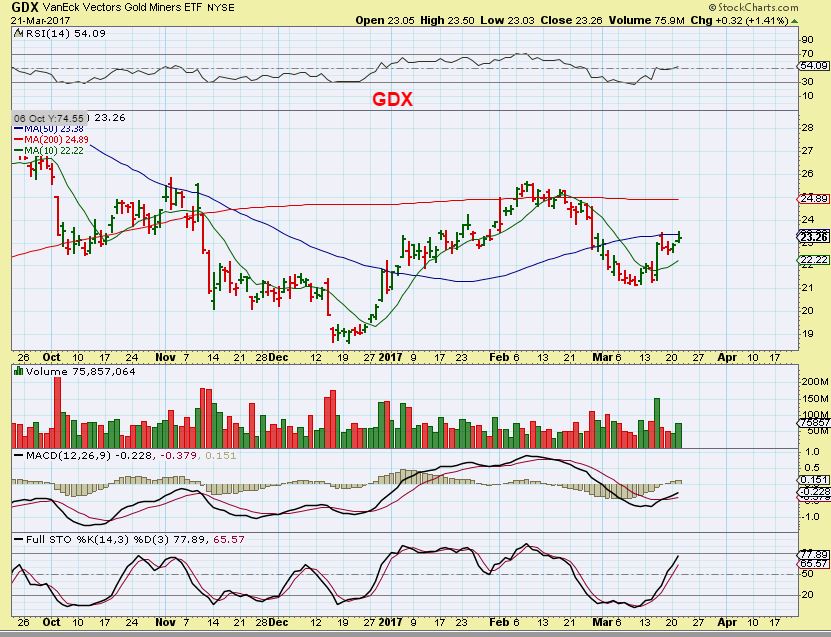
GDX & GDXJ again are still finding resistance at the 50sma while GOLD kept rising to the 200sma. What should I do? I mentioned in the comments section Tuesday morning that I was going to look at things into the close and may sell 1/2 of that position to lock in profit. I posted that I was selling into the close at around 3:45 and sold 1/2. If Gold rises further today and Miners continue to struggle, I am selling the whole position. I even thought of selling it pre-market simply because the USD is due for a low. Honestly, if I was not looking at the USD and I was just looking at this chart, I would think that it could break out higher.

THIS MAY SURPRISE YOU: I have another troubling point.
1.Some MINERS look ‘O.K.’, similar to GDX & GDXJ.
2. Some Miners look weak and are still near their lows.
3.Yet some look quite bullish, and that is just adding to the mixed signals that are EVERYWHERE in the markets today. Let’s take a look at Bullish Miners…
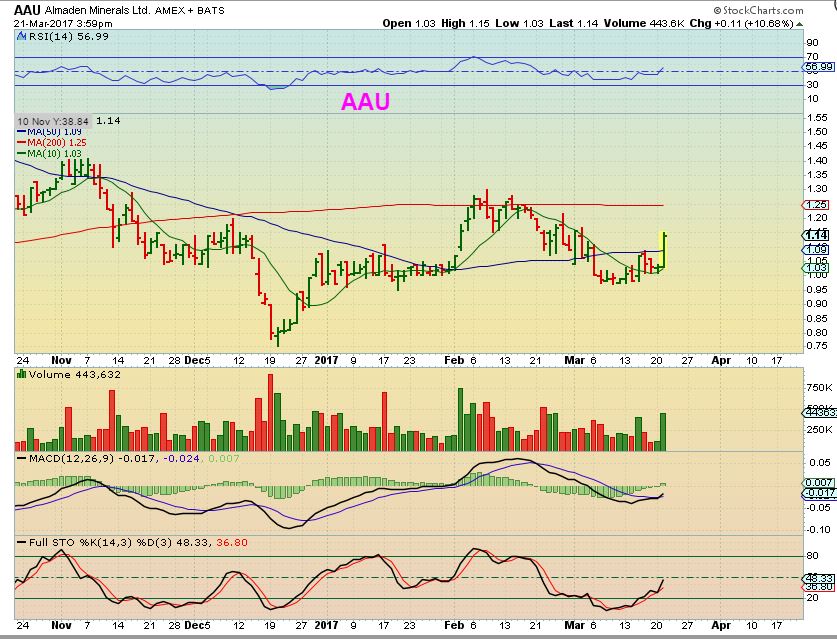
AAU – This was not only a 10.68% POP with good volume today, but it closed near the highs too. So while GDX & GDXJ sold off into the close, AAU was up 10.68%.
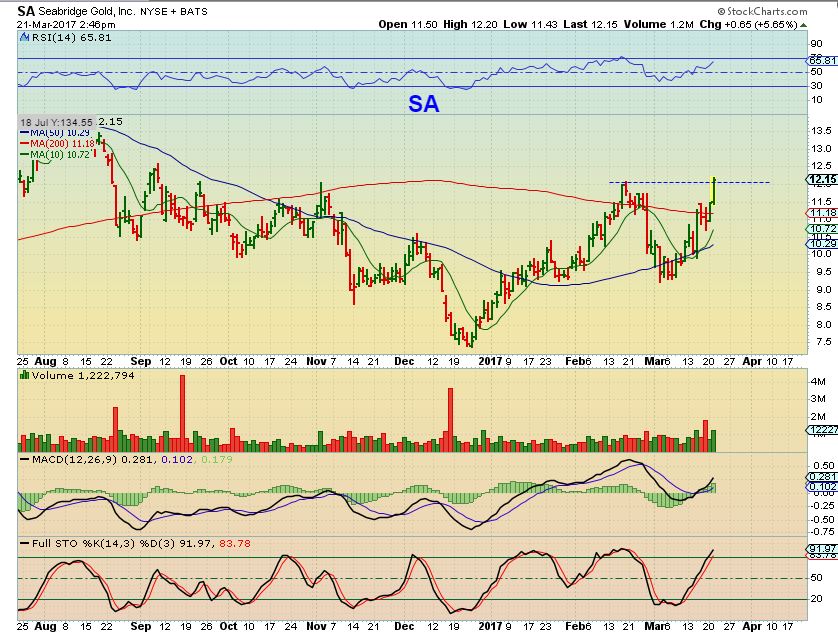
SA– SA is actually breaking the Feb highs and it is acting the way that I expected GOLD itself to. SA Shows 2 daily cycles R.T., and a new high for the 3rd daily cycle. THIS IS WHAT WE EXPECTED GOLD & THE MINERS SECTOR TO DO BACK AT THE DEC LOWS. You buy the ICL ( Dec lows) And sell into the 3rd daily cycle Peak. This was $7.40 to wherever it peaks, but it could be 70-100% by then. SA is playing out exactly the way GOLD & MINERS were supposed to.
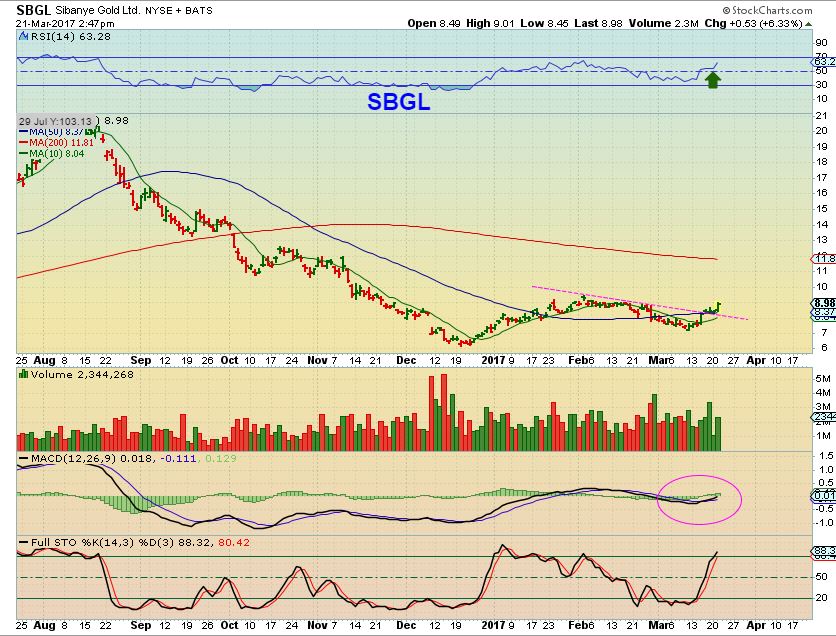
SBGL – This is also looking more bullish than bearish, and looks like it wants to break out too. SBGL is acting correctly with GOLD too.
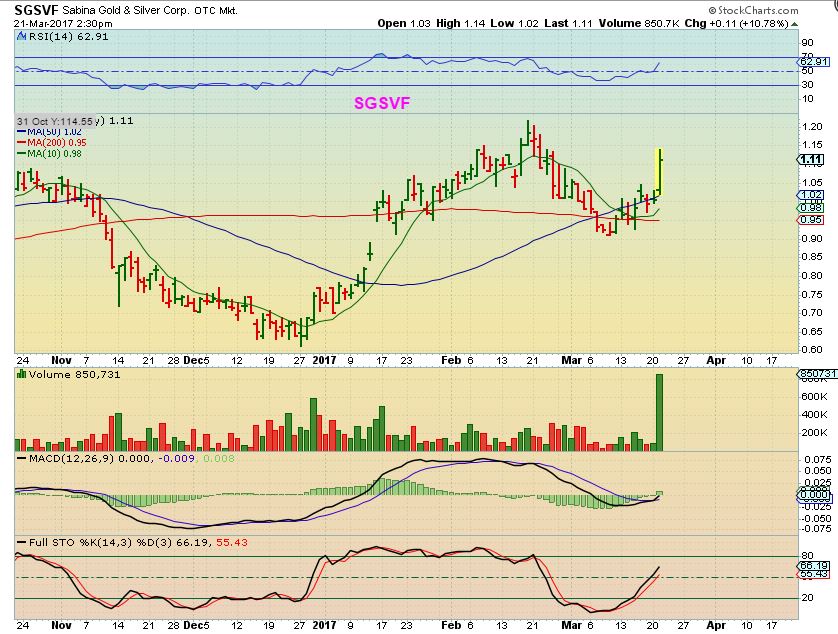
SGSVF– Where did this volume come from? If SGSVF has follow through and continues higher, it is also acting the way we expected MINERS to move coming out of the ICL. SGSVF has 2 daily cycles Right Translated, and the 3rd daily cycle should break to new highs. This one actually ran up 100% from Dec lows to Feb highs.
XRA is another Miner that is near recent highs, but I can’t ‘recommend’ buying the above 4 Miners with their bullish set ups, because the entire sector looks ‘average’ to ‘weak’. It is likely that these will also roll over soon, into the Miners ICL this spring, and THAT will be the next great buying opportunity.
.
So that is the continuing conundrum my friends, Mixed signals in almost every sector. I have to tell you that in the years that I have been doing this, I do not recall seeing this many MIXED SIGNALS in so many different ways and in one sector after another sector, like we are seeing right now. What is causing this mixed action? Could it be the recent TRUMP changes & policies? The RATE HIKE and possibly more this year sinking in? Whatever it is, the uncertainty will shake its way out over time and set ups will become solid again. Right now ‘Volatility’ and ‘Choppiness’ are inside the day to day action. I understand that people want to trade, and some like to trade daily, but please understand the risks in a choppy volatile market. Some trades are winning short term and others are failing or just churning sideways. SMALL POSITIONS AND WILLINGNESS TO HONOR STOPS is importnt in this environment. PATIENCE may also be the best course of action for some. Waiting the for the ‘fat pitch’ ICL in Miners, OIL, or even the General Markets may be the safest way to play this for the conservative ones, but it takes a little time as we monitor the progress of the sell offs. Those ICL trades make very big % gains, even in simple Bear market bounces. Until then, we can just keep watching how these markets play out and wait for some safer set ups to present themselves.
.
~ALEX
.
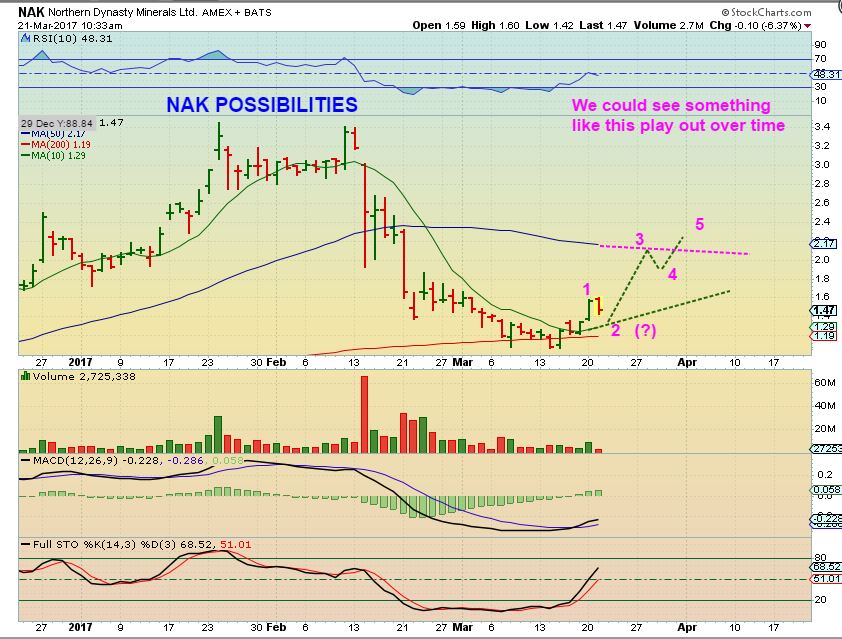
TRADE UPDATE: I will continue to ride NAK, even though I mentioned selling my leveraged miners positions.
NAK – At 10:30 Tuesday morning , when NAK dropped, I just wanted to point out in the comments area that this drop is not necessarily something to fear. It could be a normal dip to the 10sma in a 1-2-3-4-5 move higher.
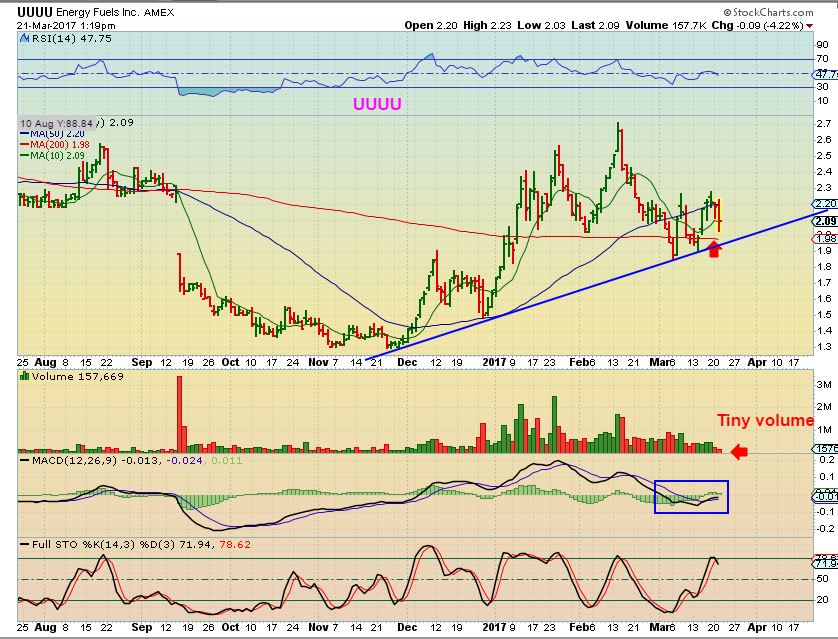
UUUU – This has support at the blue trend line and the 200sma, but some of the other Uranium stocks look like they have more downside, including the Uranium ETF URA, so a warning that these could sell don further.


Alex…what is your opinion on BOIL please. Half my position is in green and half in the red as of the close yesterday. Thanks for your time. I’m going to put mental stops in place as this is very thinly traded.
Boil is NATGAS. My opinion is that natgas is going higher , as mentioned in the reports over the past few days.
Tomorrow i the inventory report, and anything can happen then, but I believe we saw an ICL in feb and went long then, I added after the recent dcl.
Alex, I recommend Chopin wood, and lots of it!
No kidding , right? I feel like I’m writing a weekend report each day, there so much going on, but not a whole lot to do with it at this point.
Akin to putting a blind man in a round room and telling him to go crap in the corner . Just a bad situation.
ha- Never heard of that one 🙂
At least as time goes on, he’ll probably find the door. I’m dying for an ICL , since the lst one got a little stagnant mid stream.
A possible additional headwind not anticipated for OWCP, even though it does not fall into the recreational MJ category, is the rise of the Shekel relative to the USD and other currencies.
http://www.kitco.com/news/2017-03-22/Currency-fallout-seen-as-Israel-closes-in-on-Citi-apos-s-main-bond-index.html
I didn’t research them, so I didnt even realize that they were headquartered in Israel. Good catch
Yesterday when I posted at 3:45 that I was going to go ahead and sell my JNUG, I sold it at $7.62 avg, and some here lamented that they didnt read that post before the close and at that point JNUG was at $7.40.
Gold just popped on that journey to the 200sma , and JNUG In pre-market it is currently $7.60 🙂
You can sell for what I did now, or maybe even better since it has been steadily rising this morning and that may continue.
Hi Alex,
Not considering the dollar….do you have some price projections…measured moves?, or resistance zones for gold?
1265? 1280? 1300?
thx
I would have been selling between 1280 & 1300 in the 3rd daily cycle if the move higher was acting this way, and if it made it through the 200sma
Alex, thoughts on AA
Neutral
Great post Alex. I’m in the “waiting for a fat pitch” camp. Please keep an eye out for a good “safe” entry in TQQQ and other stock indices for those of us who want to play the general markets in addition to the sectors you typically focus on. I had a nice fat pitch in JNUG but I popped it up to the pitcher by making my stops too tight and getting stopped out last Friday. D’oh!
tough trading right now.
What’s up with SLW?
hmm .. how nice if GDX follows suit …
overlayed SLW on GDX …
get a move on gdx
https://www.tradingview.com/x/mitbfx1j/
SLW is in mining, but they are not a miner.
thank u webster… ;o
it’s just a little crazy how similar the candles are … isnt it?
pretty cool stuff….
Way cool except the really big profitable candles……..
Maria, how are you doing those overlays? Which program? TIA
I use TradingView ….
MAria, how do you overlay with each chart having their own specific date? Is that part of their pay service?
i use ‘compare’ it’s right on the main menu bar … what is your username there? I can private message you if you need assistance … 😉
I think I found it..the chart was too big on my screen and was blocking the right sidebar..thx. I will try it now.
let me know how you make out….
Still cant get separate dates…my name is Bcosby
Ahh..Maria, they want my phone numer in order to message..I wont give them that. sorry
Cant you tell me here please?
giggle…ok .. lets say u want to compare GDX and NAK
1. pull up a chart of GDX
2. click “Compare”
3. brings up a dialog box w/ “compare” or “add symbol”
4. click “add symbol”
5. Type “NAK”
6. select “overlay the main chart”
But how do you asign each symbol have a unique time-frame..i.e ung today vs ung 2016 and then overlay??
ohhhhhhhhhhhhhhh
sorry … i misunderstood ….
that is different..
ok .. so .. for UNG today vs 2016 … it’s simple
just pull up UNG
scroll back to the date you are studying .. ie. 2016 ..
select the “candlestick” button … (6th button down on left side menu-pointed to it on linked chart)
now – with the candlestick button selected — click on the 1st and last candlestick in the series you would like to copy .. ie. jan 1 — dec 31. The ‘series’ will be selected.
now – just drag that series and drop it on the series you would Like to compare it to … ie. jan 1 2017
comprende?
Im at work — will talk later tonite if you need more help…. or maybe pecos can offer assistance — he just pretend works .. whereas I actually work ;o)
LOL
https://www.tradingview.com/x/Rzqvttrm/
shoot .. i just looked and it cut off the side menu bar…
do u need to see it? i can screen capture it …
Nice tutorial
Btw.. What’s a numer….?
Declared record revenue & sales volume and a dividend ( And a possible name change)
CF – I mentioned OVAS a few days ago as a start of a breakout… Looks like were getting that follow thru
Big volume, and now over the 200ma. Looks good butI don’t know anything about them.
To be quite honest… Its penny land… I never think of any of these as a real company…. ever… I play the chart and thats it… the only time I view them as a company is before a PR or trial…
Yes you did, actually a couple of times, and yes it is. Looks good.
LOL sorry…..
Alex, just curious if you think CL may bounce here? (looks bit oversold in short term) and if so given it’s weak where would you look to enter short, especially if it doesn’t reach your TL. I Chickened out of my oil shorts before report.:-( Oh well…small amount of dinner money collected.
Alex, just a thought. DUG is in the Oil & Gas sector. So, with Oil going down and Gas going higher, you may not get the move you expect.
Good cal, but so far it is pretty much a twin chart to drip if you compare the 2
I was looking at a few NATGAS stocks and some of the NATGAS stocks are not following NATGAS
Check out XCO .
DRIP is an inverse Oil Services ETF, so it could be involved in both.
Right, thats what I mean, it still has been rising and DUG too, despite NATGAS rising while Oil dropped.
The chart of DUG looks like DRiP
SCO and DWT might be better
For me, that it what I’m leaning toward if I can just get a good read and then pull the trigger.
I seem to find it harder to short than to go long.
I definitely do not hold short trades as long as I hold long trades
For anyone interested, SOXS appears to be neaing a move.
Big 18month indicator coil… faked down thru apex & now coming back up other side (see close up)
..perhaps a 100% rally to the 200sma?
https://uploads.disquscdn.com/images/e3d546664246187dcd3aa56ed5c26142f9ce9f188a620a679c7245ca505723bc.jpg
https://uploads.disquscdn.com/images/258004591b01c109a405e18d3dc40641494ed2e2777440b69b2a6e42ad711403.jpg
That’s it? 100%? I want some action! 🙂
you’ve been too spoiled 🙂
yes, but NOT LATELY : (
Yes I have been following that one. It will have an epic move all signals aligned EW Sentiment etc….
Pretty difficult trade in the miners over the past 6 days. Might be a localized small head and shoulder bottom. Hoping that is the case. This chop has eaten away at my trade. A fail would bring much lower prices IMO
odds appear higher to a downside resolution from what I am seeing.
I am drooling over JDST but I’d like to time it right. IF IF IF Gold burst suddenly above the 200sma, Miners might then fly a bit higher, but right now Gold keeps creeping higher and GDXJ says, “Whatever, I’ve tagged my 50sma and that is all I want to do”
Torn
That’s hilarious … Lol
Stocks like GOLD and RGLD, ABX hit new highs today from the lows last week. I’m more comfortable with the inconsistency in miners pricing here than I was in Feb.
I really like some MIners charts ( SBGL looks great) , but the ETFs look weary
it’s tough to trade against robo-algorythims searching all trades.
Good report doubling Triangle deposit- symbol ICGQF $0.61
Alex what’s your latest target for CGIX? Looks like it is playing out as you expected.
Hard to tell if it will do an A-B-C drop or was that it? The weekly chart is what is looking really good 🙂
So Pat, I just looked at CGIX here and it kind of looks like it may do a bull flag, we’ll see. If it does, that would be a sign that it should continue higher.
Thanks Alex! Took a shot @$2.75 and will just keep a close eye on it.
Alex, nice call @ watching the GDX 50 day yesterday. Notwithstanding the volatility this morning, may prove to be the pivot point for this IC.
So far , yes. I actually called a back test to the 50sma weeks ago, and I said that I would consider shorting it there , after that flash crash monday drop.
I’m not shorting yet, still watching Gold & the USD for now
I am close to getting stopped out of my NG posotion
I got stopped out of UGAZ and UNG.. Luckily with prof but alot less than hoped lol
The problem is that natgas looks fine but all of the trading instruments are absolute crap!! I hate me some UNG AND UGAZ. Don’t get me started!
I’m still in, but mostly because I am using the 200sma or the recent dcl. I dont want to lose it, but if it doesnt run higher soon, there will be no reason to stay onboard 🙁
Natgas itself still looks ok to me
your entry was probably better than mine. the 10sma on natgas is 2.99
Very confusing market for miners … I still have bullish signals on my daily charts for GDXJ/JNUG … BUT their behavior does not “feel” bullish with a sell-off at EOD yesterday and looks like they will sell-off again today. In a BULL market I would expect to see buying at EOD, not selling. Also the USD is SO low it feels like it will bounce as Alex has mentioned. And I have to admit I’m a bit scared of the low wick “signal trade” candles I mentioned yesterday. I actually saw one happen in real time yesterday. I was watching something in the AH, I think it was JNUG, and I saw a “sell” trade of 1700 shares come in and execute WAY below current market, then the next trade was back to “normal.” Who would put in a trade like that other than a professional trader? “Normal” people would not put in a sell order way below market. I continue to find the “signal trade” candles fascinating, especially in a highly manipulated market like metals and miners.
The USD looks to be in a H&S pattern headed lower. It may bounce here enough for your wicks to get filled.
https://www.tradingview.com/x/P3lSCyjV/
I agree with you Bill, the USD is also a “sell” on my daily chart. I see a lot of reasons to be long miners right now … but I also see warning signs. Hard to make a decision here, so I’m staying on the sidelines for now. https://uploads.disquscdn.com/images/5cc31c553b1cec5734b2e3be3b2b6bcfc32a653ca83593cd70da77025e808d31.gif
Nice chart!
Lot of fear in the miners market in general, and especially with a potential imminent bottom in the USD. On the other hand, we could see big moves if the dollar breaks down from here, which I think it might very well do over the next few days.
FYI … I finally got my money back today from Schwab for the trades I could not make last week on 3/14 due to there trading system having technical systems. They put about $18K back into my accounts for the losses I incurred by not being able to sell when I wanted to. So I give Schwab a lot of credit for “making me whole” after that episode. They could have fallen back on the disclaimer that they are “not liable for trades due to technical problems.” I have been a Schwab customer for 18 years. They have lowered their online trading fee to $4.95 per trade which is nice and their service is great!
Thats one of the best fees around
Most online brokers have recently lowered their prices, Schwab is trying to remain competitive. I would not trust my money to any brokerage company other than Schwab or Fidelity because I don’t want to lose my money like the traders who got screwed when MF Global went down. So it’s great to see Schwab match the “discount brokers” fee without sacrificing service or financial stability.
Merrill Edge=free trades
yes…it is really nice.
How does that work? Do you have to keep a certain limit in your account? Does it apply to retirement accounts as well?
Yes, you have to keep a limit in account and it gets you a number of free trades. More $, more trades. At least that is how it was when I was lured over. They also have a nice trading platform called Merrill Edge.
Great, thanks- I will see if Fidelity will match it : ). I am down to 3.95, but free is better!
Yes, both trading and IRA accounts are free. I think you need a certain amount of $$$ to get the free trades.
25K
30 free trades/month IF you keep 25K plus. Had to check, sounds intriguing!
That’s a shitton of JNUG. Glad that they resolved your issue. I haven’t had an issue of that magnitude but have certainly have had trades get screwed up (double entered, etc.)
Heads up : This chart will be in the report tonight as a low risk entry. It hit the 8sma, but also the 10sma and reversed.
https://uploads.disquscdn.com/images/bd4b79dfff0d0675c8f80e98b4cb9c91aec31cdd618815884dfded04cd137434.jpg
If I buy NAK, it is sure to go down, so I will pass and let everyone else make a profit. 🙂
LOL
this thread is great
deal.. ill sell my shares to you at the top…;o)
I prefer being on top anyway. 😉
MeeeeOwwww ;o)
Me2. ::-D
Shazammm…
How’d u makeOut with the candlestick overlay?
Thanks, Rob. Good looking out! 😛
Alex, Could I get you to look at Novo Resources- NSRPF
I have owned a position for years, it hasn’t participated at all in the rally this year, but volume has spiked in the last few days. Any thoughts?
Bob, not sure if you’ll see this reply or not, but I missed this question earlier ( Sometimes I do not make it back here to read comments a night).
I will put it in the report for tomorrow morning.
Alex,
Thanks for that update, really appreciate your insights.
Everyone all selling their JNUG yesterday and talk of secret spike lows to $0 and constant miner of miners crashing got me spooked. So, got stopped out of my position early this morning at 945-950 downdraft. Nothing like selling at the lows of the day. Awesome. 🙁 🙁 🙁
Howdy Cason! Remember keep your chin up! You will prevail! 🙂
The man is trying to keep me down! And people trying to get my shares for cheap, too!
:)Funny man!