SPX from the weekend report, I think we’ll get another run higher soon.
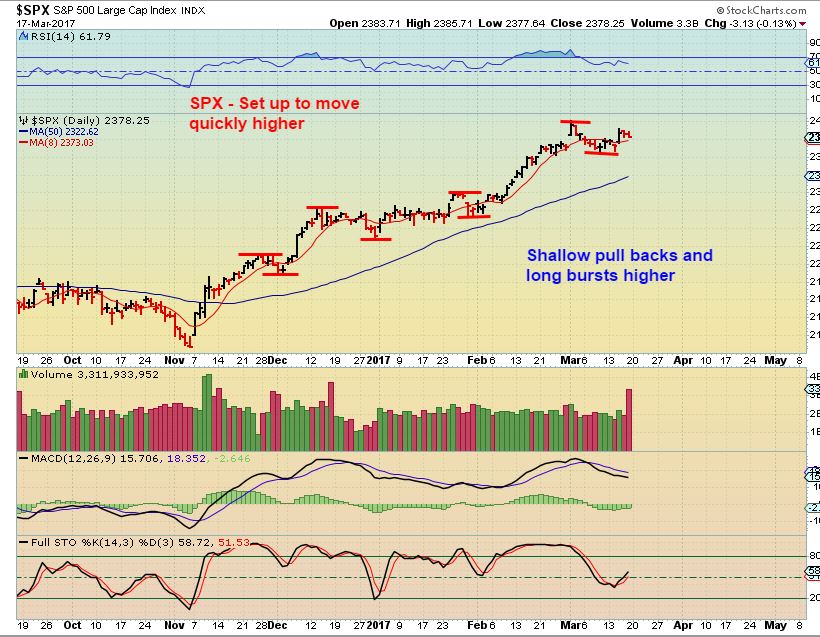
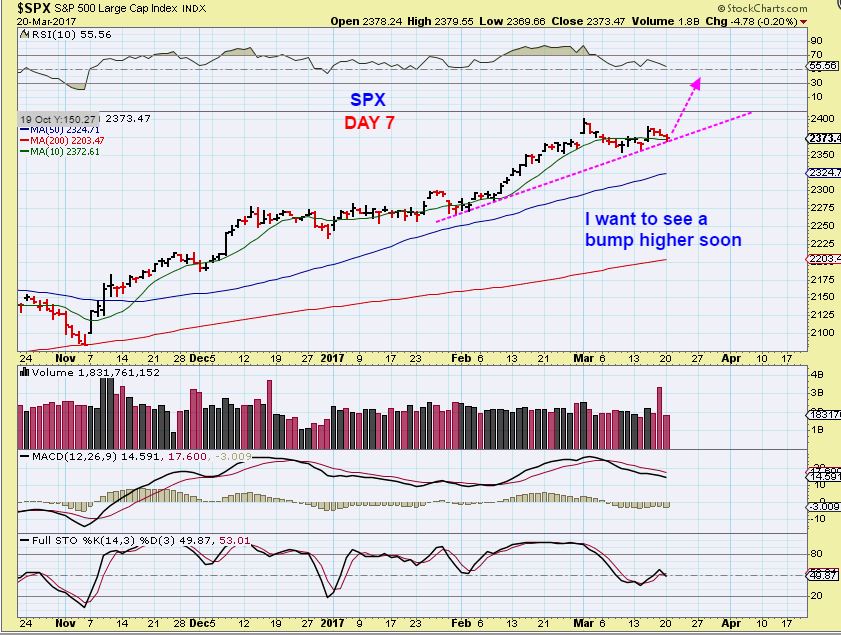
SPX – I’m Still expecting that run higher, and I would have a stop under the dcl at 2350
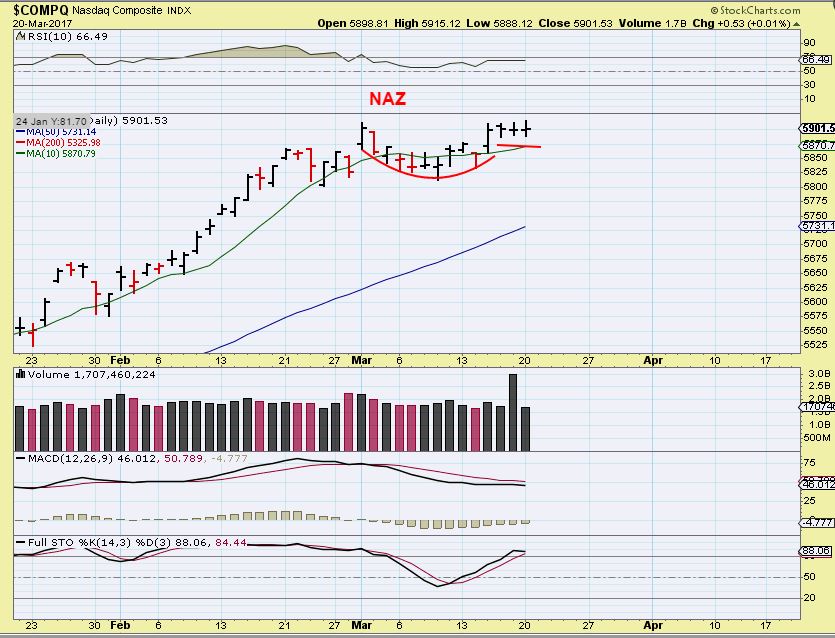
NASDAQ – Also still looks set up to move higher.
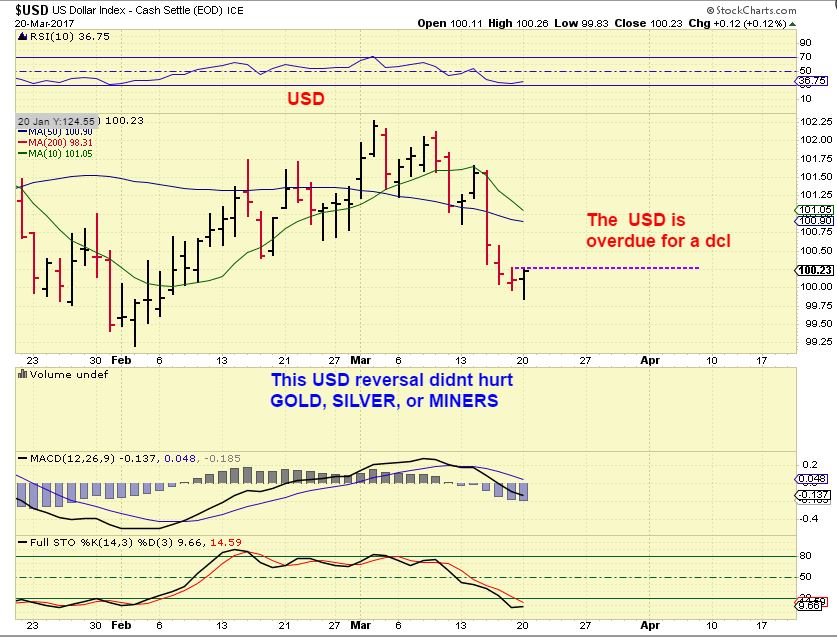
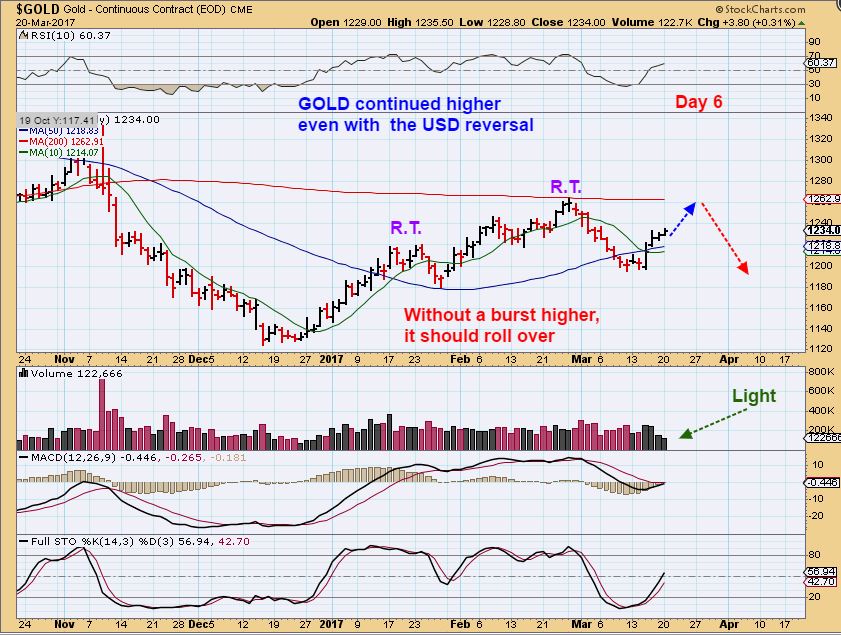
USD – The USD put in a solid reversal , and is overdue for a dcl. A move above Mondays highs will likely be the dcl. It was interesting that GOLD, SILVER, & The MINERS ran higher into the close with the USD moving higher too.
EDIT: I write my reports late at night, so this morning I see the USD dropping as I proof read this. The low was 99.83 , and we just tagged 99.80 ( breaking yesterdays low), so now at this point todays low will be the lowest point. That was quite surprising, because the USD is over due for a dcl and that reversal looked real.
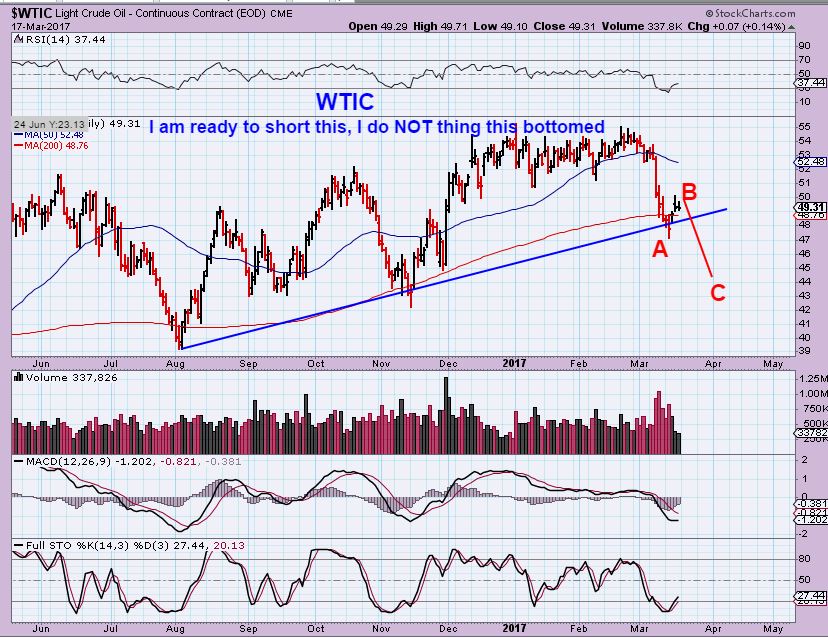
WTIC – Weekend report, I am thinking that OIL can drop to the lower 40s in the next daily cycle, and this is just a bounce.
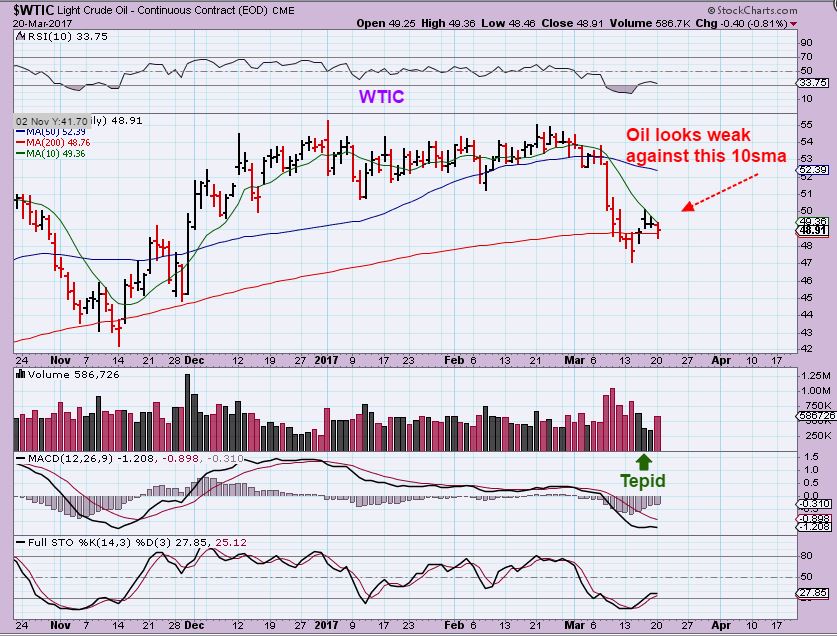
WTIC – Weak and struggling at the 10sma. I thought that we might back test the 50sma, but it may not happen. Another drop below the 200sma could be hte next drop starting for OIL, and I was planning on shorting it at that point.
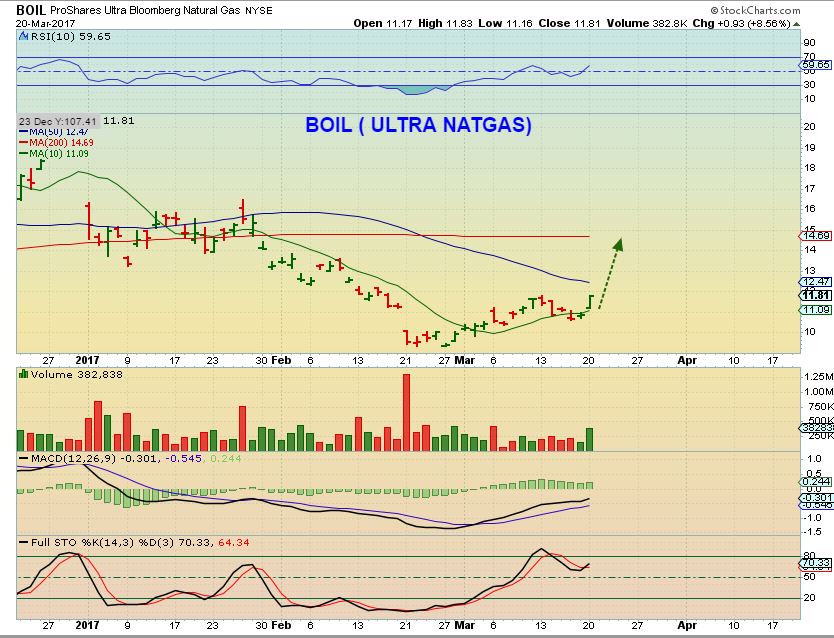
NATGAS is Bullish to me, and I had this in the weekend report. The first entry long was in early March.
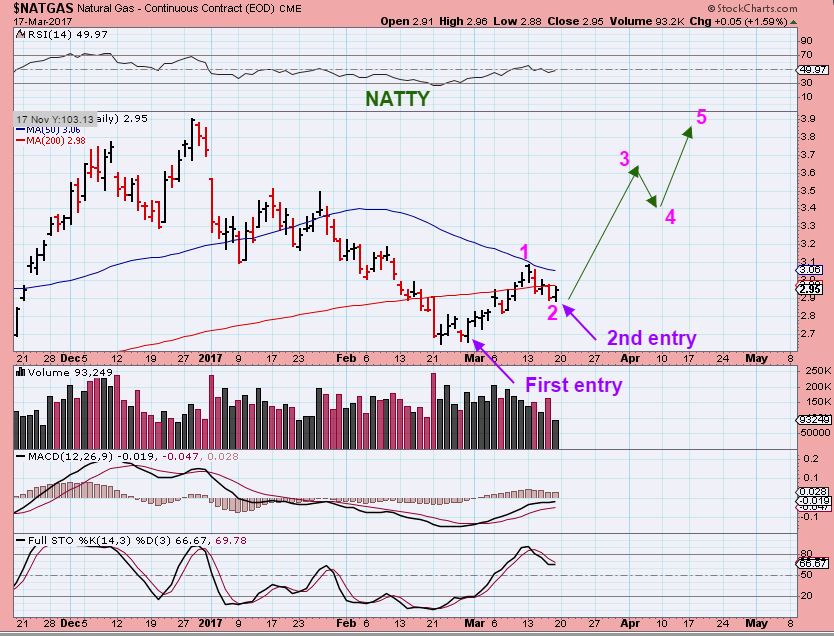
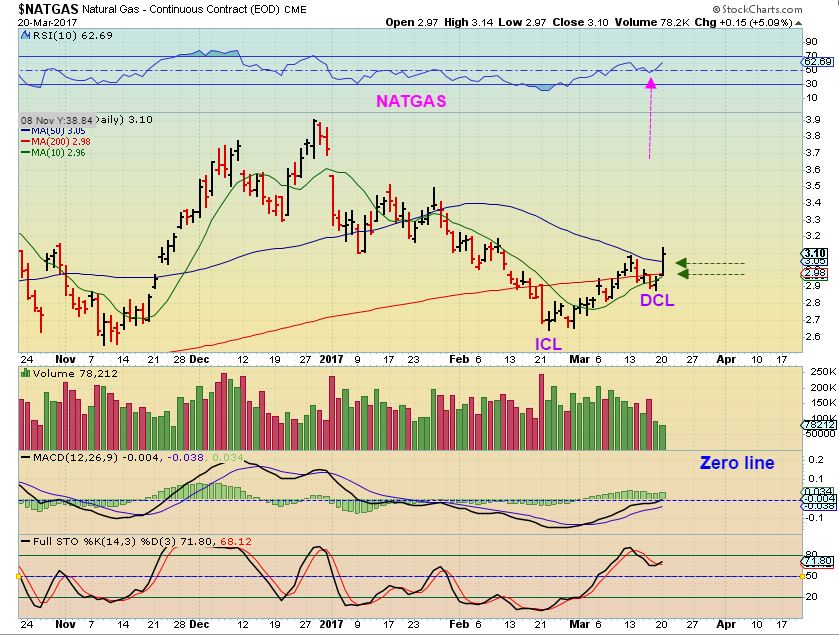
NATGAS – I believe that was a short daily cycle and some consolidation built in after rejection at the 50sma. Monday saw NATGAS break above the 50sma and I think that we are only on day 2 of the 2nd daily cycle. Look at the run in November. Natgas can do that again.
MANY trade a 3xetf known as UGAZ when trading Natgas, I know that, but BOIL is a little tamer and may be better for some. It ran from $9.30 to almost $12 in the first run higher, roughly 30%. I would expect that the next run will do better than 30%.
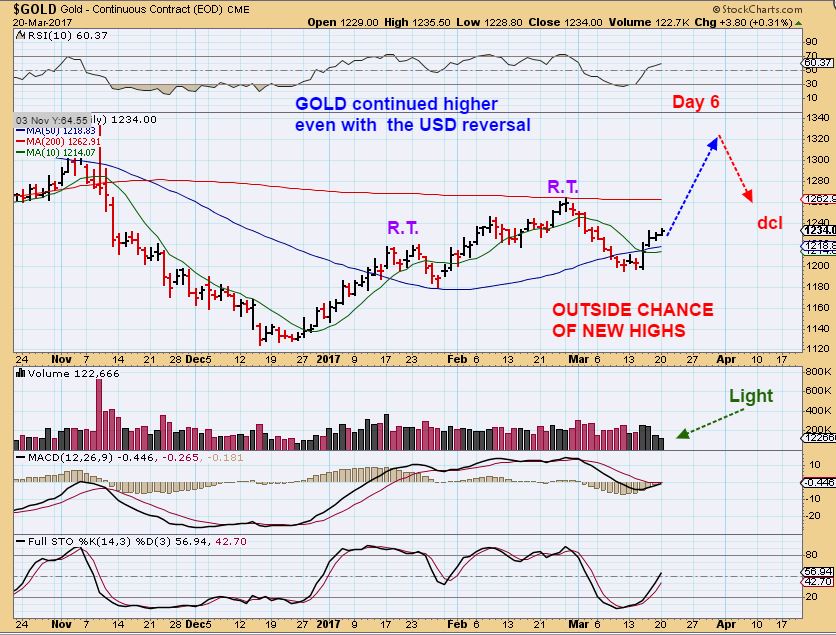
GOLD – Now that the USD is due to put in a dcl, it is hard to imagine Gold doing better than what I have drawn here. It may not even reach the 200sma in this 3rd daily cycle. Tuesday is day 7, and I have seen L.T. daily cycles peak on day 8-12 average. A DROP BELOW THE 50 SMA AT THIS POINT WOULD PROBABLY BE A GOOD WARNING SIGN.
GOLD – Best case scenario is a new high because the first 2 daily cycles were right translated. This is less likely.
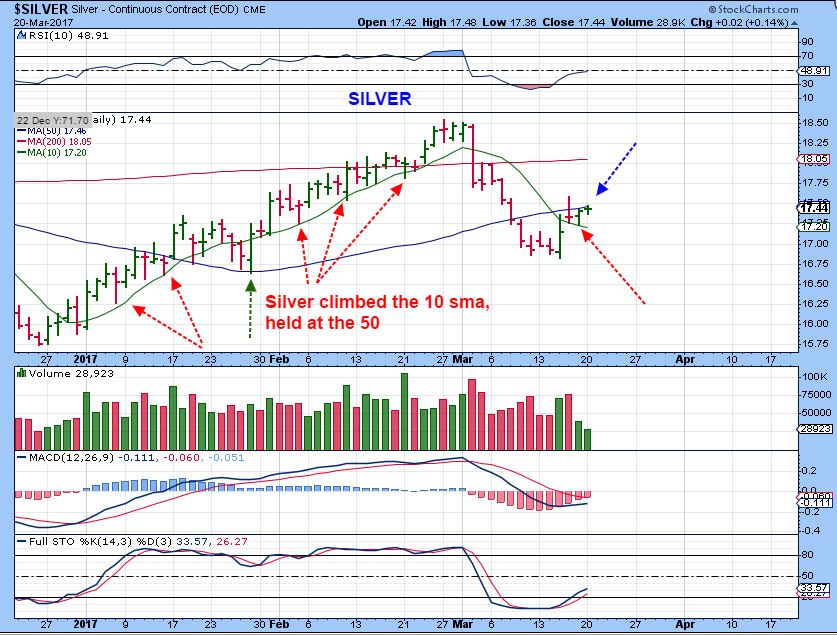
SILVER looks similar to GOLD, but is a bit more entangled in resistance and support. The 50sma is $17.46 if you are watching numbers to see if Silver can break above it.
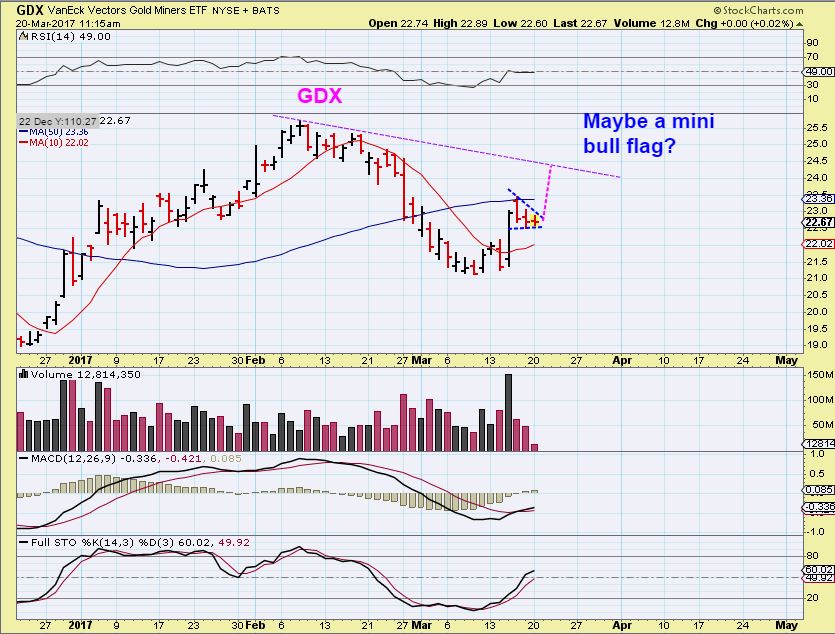
11 a.m. Monday morning – I pointed out that as a possible bull flag, I was going to take a quick ‘trade’. It is risky but this could play out as shown. I am expecting another drop in Miners when this daily cycle peaks and this has to be considered a short term & risky trade at this point.
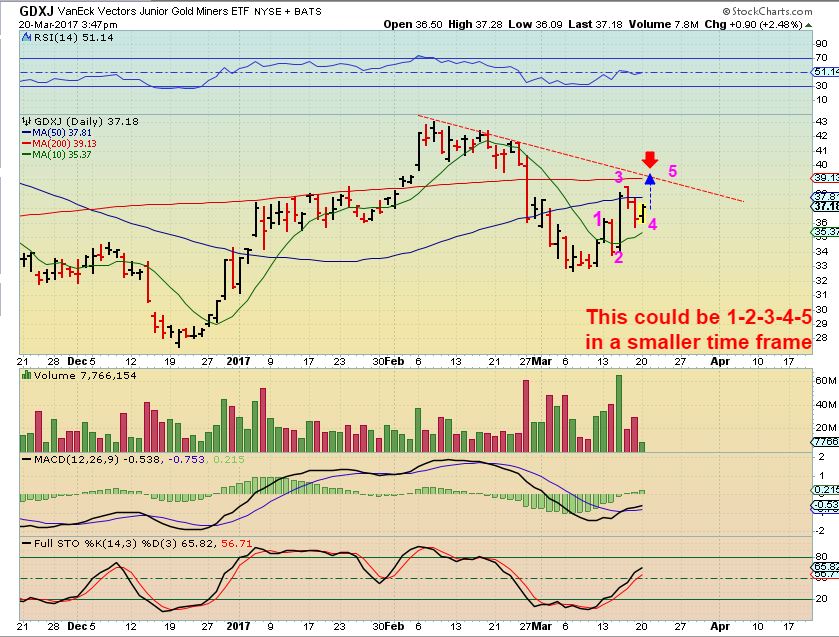
GDXJ – Before the close we did see the buying follow through and I pointed out that the 200sma on GDXJ would be a possible exit if we get more upside Tuesday.
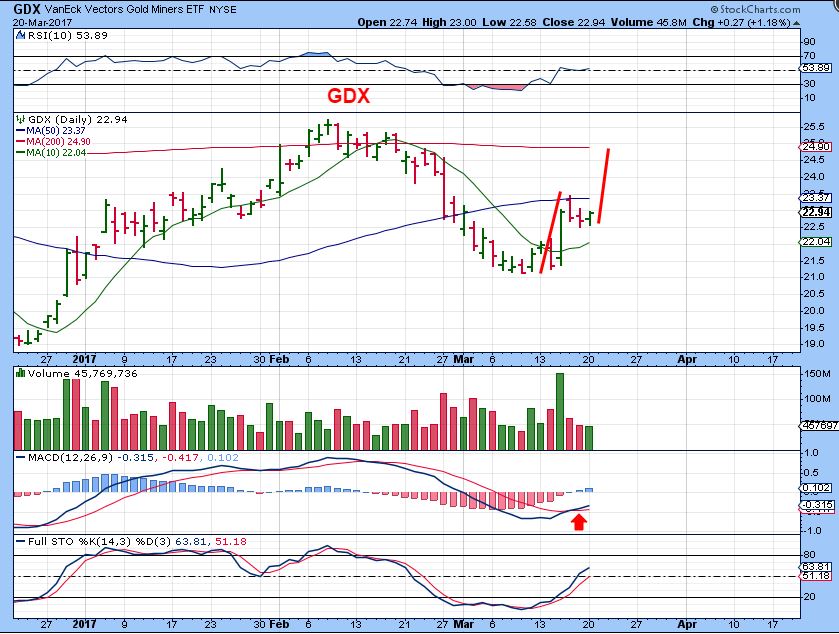
GDX after the close
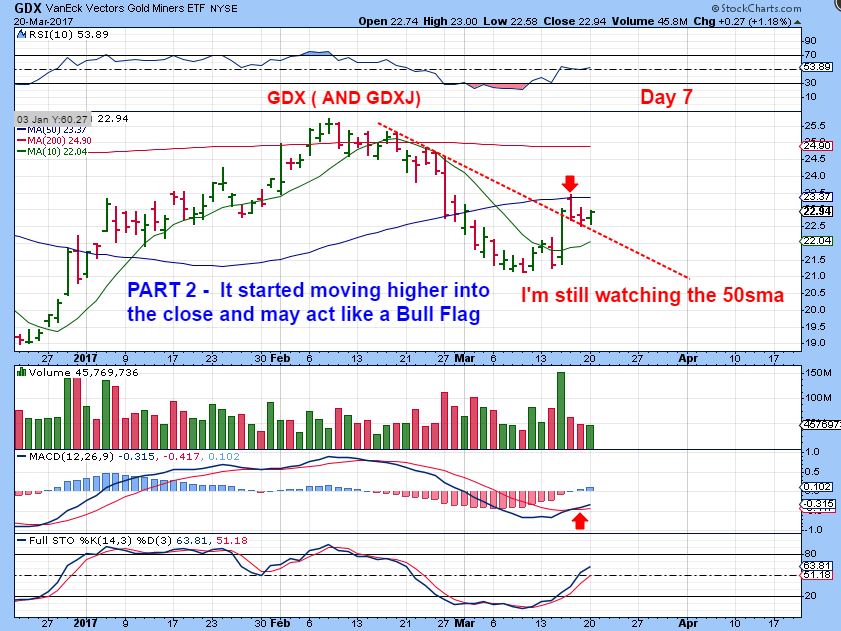
The more Bullish case scenario, but probably not going to happen if the USD is bottoming.
So things are falling into place as time goes on. EDIT: Except for that drop in the USD this a.m. 🙂
The mixed signals that came in around the Fed Rate Hike seem to be clearing up. We were seeing both the USD & GOLD trying to put in a dcl at the same time. Now we’ve had our DCL in GOLD/MINERS for a few days and the USD seems ready to put its dcl in place and run higher now. So maybe things are finally clearing up and we will be able to find more trade set ups as these things play out. I will continue to monitor things as time plays out.
~ALEX
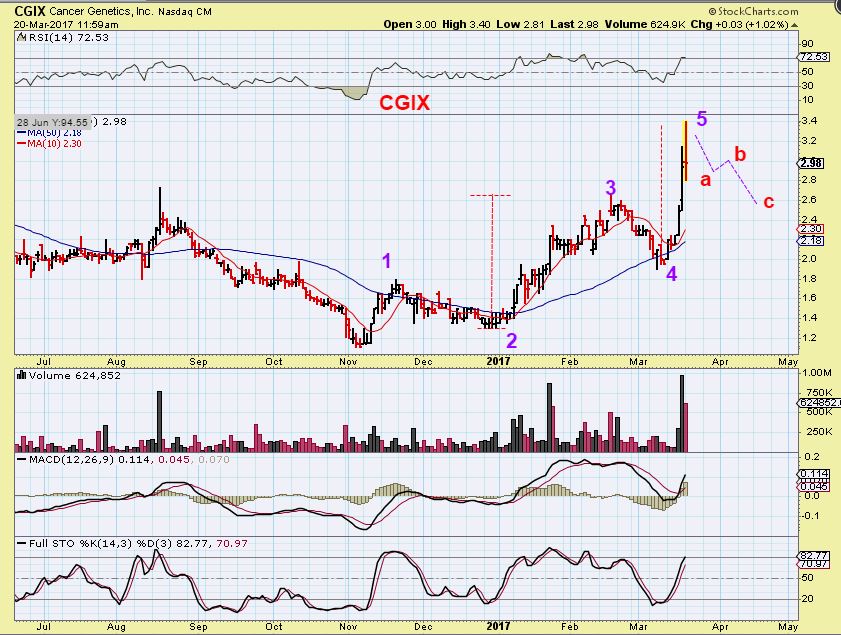
CGIX – I posted this trade last week and took it, and it turned out to be a fast and profitable trade already, but I like the longer term picture too. I had a first upside target at $3.20, and other extended targets, but I didn’t think that it would just rocket up to those targets as quickly as it did on Monday. Since we did see CGIX reach the upside targets and roll back over, it may consolidate in an a-b-c fashion, as shown. I LOVE THE WEEKLY CHART. The weekly chart actually looks like it could go much higher over time.
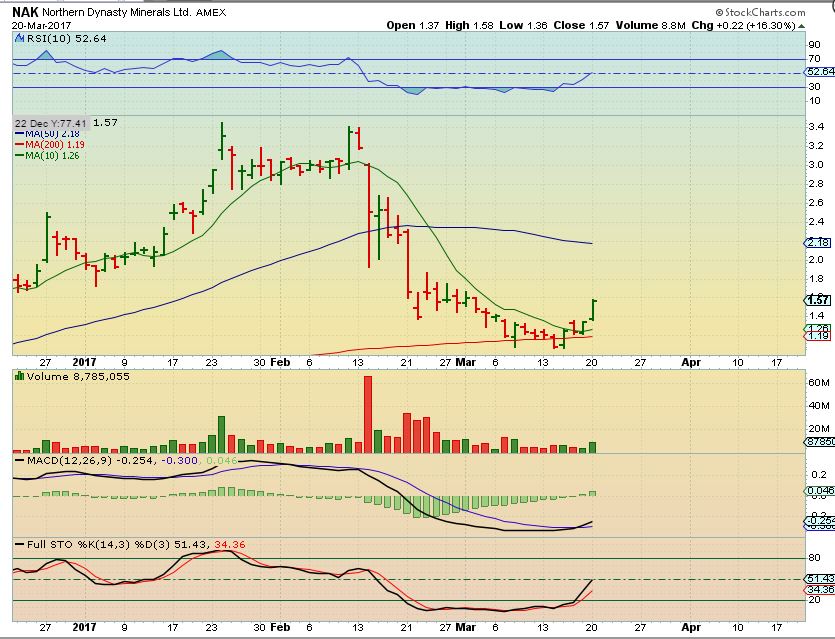
NAK CHART #1 from the weekend report. POSSIBLE run to $2.00 on a bounce.

NAK CHART #2 – We are getting good follow through on this trade, from $1.06 last week to $1.58 Monday. If you are heavily positioned, you can lighten up on the way higher if you wish to lock in some gains, but I am going to just try to ride my positions higher. IT may or may not be straight up, but I want to try to ride it for a bit longer, you can do whatever makes you more comfortable.
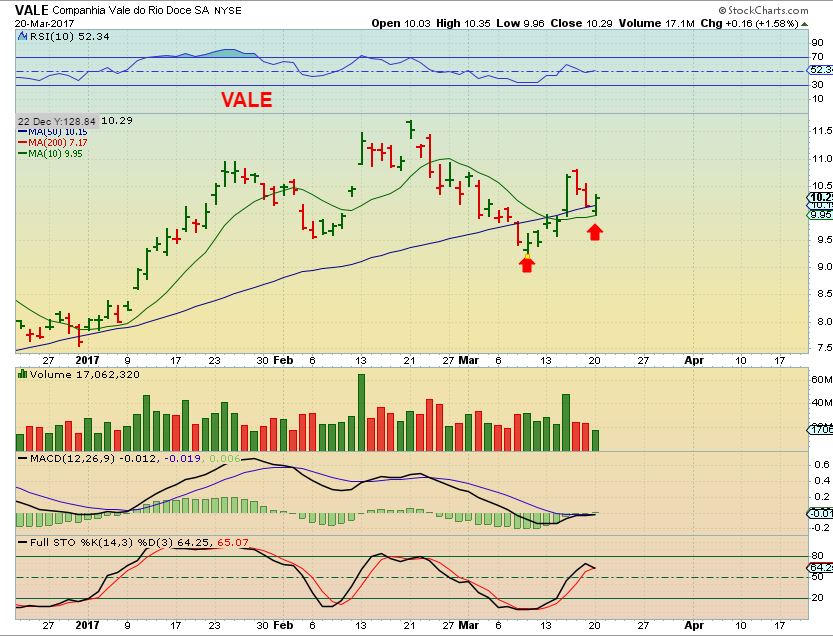
VALE is a buy with a reasonable stop
March 17th Weekend Report- Thinking Out Loud 
 Tuesdays Tremors
Scroll to top

My apologies, I forgot to add one chart to the report, so I added it. It is the very last chart (Vale), easily seen if you just scroll up.
As always – great report cf
Thx BT
well.. it was good .. i wouldnt say GREAT …
Teehee….
;o)
Lol
No it was great. If it had over 10 NEW charts when I could have just thrown up 3 or 4 like many others lettters , its really a great effort. This one had 16 new ones on a Tuesday, that’s great 🙂 LOL
ohhhKayyyyy 😉
jussssst joshhing chartboy…. ;o)
I was just joshin too, it’s not the number of charts, it’s the content or guidance.
Todays was just a refresher 🙂
D. all of the above
Thx CF! I’m assuming TGB could be the same recommendation given it’s similar pattern to VALE?
Refresh – I do like it , it seems to be a break out and back test. We just dont want it to get going to the downside, but it does look bullish and should move higher.
https://uploads.disquscdn.com/images/bb62cc487879f90d86fbfa00a907e0183e062bbc6f83acb70e94d76910446fbf.jpg
Alex- u seem to be putting more emphasis on cycles than maybe you had in the past?
No, I use all things at all times, but there are more important “Times” when you have to be aware of where you are in a cycle
NatGas does seem to be the place to be right now. I bought BOIL Yesterday. Miners getting long in the cycle, I may sell today. OIL not ready to short just yet. Thanks Alex.
I agree, if we are on day 2 of a 2nd daily cycle and the set up looks as it does, I would expect a nice run higher.
I like the BOIL chart too
ugaz is down now
Excellent
I should buy some?
Maybe wait for it to reverse.
Also, I dont know your experience level, but I dont recommend 3xETFs for newer traders or those that cannot watch them constantly. NATGAS inventory reports come out on Thursday and things do get shaky.
3xETFs are really for experienced traders that understand that they exaggerate the moves of the underlying entity. UGAZ can drop $1 or gain $1 in a heart beat.
IF UGAZ drops to the 10sma, it land on $18.30 and it was $20 this morning.
BOIL is another option for less volatility, but it too can drop to the 10sma.
I’ve traded JNUG, NUGT, uslv and sustained the 30% drop, and didn’t go crazy. lol. I missed the 1st entry. will watch.
I’m in TZA now. watch closely and DT mainly.
Yeah, I’m looking to add too.
FAST TRADES in these 3x etfs, so timing is key. Trouble is, I’m not watching things as closely as I should be today… but I will.
I’m boiling also. Just got in today.
ESPR – gapped again
There are actually many Biotech stocks popping higher and moving nicely, but they are tough to buy & hold.
I try to make sure they are not a ‘1 trick pony” with just one drug in trials or promises based on 1 drug. Been there, done that….it is a sector with very real blind sides , for sure.
I see them run higher and then gap down 40% on a FDA trial rejection or something and it is a tough sector, but 1 or 2 in the account might be fine.
Great call on NAK Alex. Downside break turned out to be a trap, now up 40+% and you nailed it. That’s why you’re the man,
Thanks Miller. It is down a bit right now, but on the chart it isnt damaging anything. I’d like to see it reverse & run higher later today or this week.
Nak had good news I posted on yesterday’s thread:
Northern Dynasty Provides Update on EPA Discussions
Files Joint Motion with EPA to Extend Stay of Proceedings to May 4, 2017
VANCOUVER – March 20, 2017 – Northern Dynasty Minerals Ltd. (TSX: NDM; NYSE MKT: NAK) (“Northern Dynasty” or the “Company”) announces that its wholly-owned subsidiary, Alaska-based Pebble Limited Partnership (“Pebble Partnership” or “PLP”) and the US Environmental Protection Agency (“EPA”) have filed a Joint Motion in federal court to extend a stay of proceedings in ongoing litigation under the Federal Advisory Committee Act (“FACA”) to May 4, 2017 in the interest of resolving the matter.
The Company has made substantial progress in recent discussions with the EPA and intends to continue negotiating the matter directly, rather than through mediation. Government representatives are actively engaged in these discussions and, along with the Pebble Partnership, are focused on achieving a resolution that will be agreeable to both parties. In the meantime, the Court’s Preliminary Injunction of November 25, 2014, will remain in effect for the duration of any stay.
Yes, I read it yesterday thanks.
The last sentence may be interpreted as bad to neutral, but the rest is progress.
JNUG moving this morn
Silver broke out above the ‘number’ in my report. The USD fell.
Am I really seeing over 20 million in volume in the first 1/2 hr for JNUG.
That’s pretty strong
*darn
GDXJ trying to break above the 50sma, next stop 200sma,
That would be another nice day for JNUG – adding to prior position during yesterdays trade still working well.
It’s like you have to take these trades day by day.
Hey CF – Take a look at RGSE. LONG base on the daily
Yes, they did a 1 for 20 reverse split too.
Many that do that base out and then pop a while later.
I want to add to my ( Lets say ‘Boil’ for the sake of safety) on this gap fill
LOL – lets say… U mean UGaz
Hey, haven’t you ever seen the movie “The Village”… there are those ‘scary things’ that we dare not say aloud – lol
LOL
That would be $11.80 for BOIL.
Good call on the pullback, now recovered.
chartboy’s InTheZone ;o)
NAKs 15 minute, 30 minute charts do look like they want to pull back from overbought, but the daily still looks fine so far.
It’s just a temporary bummer if it wants to tag that 10sma again.
So the daily chart of NAK using the 10sma…. MIGHT BE…. 1-2-3-4-5 to the 50sma, and we just saw the move to ‘1’ complete. Now a drop to the 10sma could be ‘2’, and you will want to catch the run to 3 if the set up plays out that way.
I will keep an eye on it and post in the reports.
So I post an encouraging chart of VALE regaining the 50sma and it gives it up today. NADAQ is making new all time highs, the DOW is down 70 points.
Tricky tricky markets in this choppy environment.
I own some AKS. I may sell it today for a similar reason as AKS lost the 10 daily SMA this morning. The only factor mitigating my concern is that the weekly is oversold on the slow stochastics.
Refresh: So I just took a look at it , because I liked it too. It broke out recently above the blue line, but it does have those slam down days as it builds this base.
The weekly is oversold, but the daily isnt and the RSI is turning down. No follow through on these commodities for some reason.
I forgot the chart : ) refresh this one
https://uploads.disquscdn.com/images/cafc2f6cd1f6d0e30351daa12b0fa1f1c622b5488c567086ea2f186724fdbfa1.jpg
Thanks Alex, very informative comments and chart. I agree, there’s more downside possible if not likely in my opinion. I’ll probably sell and wait for a better entry point. Seems like these days that the only entry points that work for anything even remotely related to commodities are when there’s a massive selloff. Or just maybe I’ve become jaded by trading gold miners for too long, LOL.
consolidations and bases are the hardest times to trade, because a ‘set up’ is often just more of the same part of the basing process. It is frustrating.
OWCP, CNBX, CBAN, and a few other MJ stock seem to be just about finished consolidating their recent gains after dropping into a new basing area. Maybe they will get some buyers and little more upside volume soon?
I just thought I’d post this for Tammie, she must be busy 🙂
hahaha! Yes, busy watching OWCP and CNBX…..and reading the comments here ….:) 🙂 Yeah, waiting to see if these are real moves or what…..have loss in OWCP because I stupidly held when I should have sold for a nice gain 🙂 🙂 MNTR and CNAB are making moves also…..I really think if the government would give clarity these stocks would be able to do something….until then it’s been really hard to trade these like I was at the beginning….
I typo’ed, I meant CNAB 🙂 Thx, I corrected it
I was wondering what CBAN was..haha 🙂
Just an island Cabana that I wish I was visiting
OWCP came out with good preliminary report on their psoriasis cream today…..
I missed the MNTR move this morning…had it on my list to probably get and got distracted…argghh
it looks to be pulling back now
Yeah….I should have jumped in on that pullback…now it’s back up….
Alex, what is your view of SINO and UUUU…I decided to diversify a few days ago when you posted about them, and it is not going well thus far. Do you still have UUUU?
I do
GDX & GDXJ both stopped at the 50sma again.
you out?
No
So we see the USD dropping, the markets took a good hit, Financials taking a good thump,
I see Gold still rising but the Miners do seem to just be pinned at the 50sma with average volume.
I’m not as eager to short the Miners as I was thinking that I would be, but we might be seeing the end of the rise in the 3rd daily cycle and time to take profits or at least partial.
I am going to come back and decide at the last hr of trading
Thx Alex. I had the same thoughts here. Please keep us posted…
I sold all at the open missing today’s few percent.Something stunk bad premarket with the dollar taking a good hit and gold on hold. Considering the timing cycle that was the last oddity that I could stand. See ya all @ the ICL.
Banks are getting slammed,
Wow, XLF….Wow.
I hadnt noticed Dom, thanks.
What is the ‘short financials? That set up might be nice.
faz. I post last friday for the conspiracy theory. there’s a long bearish tail for XLF, pointing to 22
Alex, Please check TZA’s set up too.
I think that the markets may have just double topped and are done. SPX/SPY already broke the dcl. It has failed in my opinion.
QQQ didnt yet, but it may
and so yes, TZA has a low risk type set up
GS, BAC, JPM… I just saw someone recommending banks and financials on CNBC yesterday.
On TOS, I have a wick candle to 22 on the 17th for XLF. Not sure if it’s a mistake.
People post it on stocktwits. I saw that too. FAZ is the 3X short financials.
Makes perfect sense. Time for Gartman to go long oil here? 😛
Bond yields are down…..related to banks tanking? gold rising…
BOIL
Looking way better than an hour ago…added on the dip then.
Really nice bull flag showing on MNTR on 5 day and 10 dy charts…2 day chart also
UUUU! Falling apart. Everyone stopped out?
You’re joking, right?
I assume you have been stopped out? I asked about this trade 2 hours ago but got no answer.
Attached is a chart. I just dont view this as ‘falling apart’. It is having a down day, but so far it looks like normal movement to me.
https://uploads.disquscdn.com/images/dd61092cbe9f520021611f8924b058236d215cc4bdfd1a276fb55ef283f9e0a9.jpg
Thanks. I am not experienced with uranium stocks.
I’m watching a trend line ( Blue) and the 200sma as possible support areas
I dont know why, but I didnt see your questions below until you mentioned it.
I had to refresh and at times that loses the “new comment’ notification
It dipped below the 200sma 2x and recovered, so thats a bummer because I would use that as my stop, but apparently those have been shake out points. I will be holding this position as long as it closes above the 200sma.
Markets are sliding and volume is pretty heavy in all of the etfs, etc and this isnt a whole big slam down with strong volume at this point.
Thanks for the reasoning.
Sure. I actually thought that you were really just joking, when you said Falling apart, I thought ” oh no, what is this thing down 30 cents with this market sell off ? Then I checked and it was down 8 cents ( but for a $2 stock , that is still 4% and the markets were coming down fast too, so I do see why you were asking).
In that chart above, I’m thinking that the blue line & 200sma intersect at an area that should hold as support.
LABU! Now That fell apart!!
I am looking at some Miners that just look very weak, other look similar to GDX GDXJ, pushing on the 50sma and not busting higher though Gold keeps climbing, and then I see other miners that look pretty healthy.
Such an indecisive market
not sure what to do with my position here
At times, You wont know for sure if this will break out higher or gap down tomorrow, so you have to weigh both sides of what you are willing to do in the trade.
Hold all, hold some, sell all and wait and see.
I actually look at the ones beaten up ( CDE, AG, AUY) and they look like they want to stabilize and move higher off of the 10sma, MACD crossing positive, etc.
USD and BINDS taking a slap down.
GSS, GFI, and ABX above the 50 DSMA, but you are right there are many more stalled there than above it.
Very odd behavior. You think with gold up like it is today that GDX and GDXJ would be up alot higher. I guess USD is key…. breaking lower. Close to DCL…. could be a fake out and miners go higher…. but something is not right.
Maybe the final hour of the day will give us a clue.
Most of the Miners I scrolled through were only up 2-3% all day so far, with GOLD continuing to climb slowly all day.
I want to see if they play catch up with the market selling off and money flowing into miners, or are they GDX GDXJ topping at the 50sma area
bought some natgas this morning, but will use the 10sma as my stop. prices should not violate the 10 if things are healthy. fingers crossed.
Looks like TQQQ is FINALLY setting up a buying opp for me. 🙂
I’ve been waiting a LONG time for nice healthy drop.
Steve, pleased let me know when to load. Thanks.
I don’t know if you want to count on ME to tell you wen to “load up” … I’m sure ALEX will give us some good entry point advice.
I’m looking for another move down of about the same magnitude. Not necessarily all at once. Just over the next couple of weeks. If miners remain week, TQQQ might be the better play. Likely some SPY calls as well.
JNUG IS up
GDX and GLD kind of look like they do want to run up to the 200sma, and GDX may be pushing through the 50sma now.
GDXJ is kind of there, at both the 50 & 200sma, so I may take 1/2 of my JNUG position off of the table and see what tomorrow brings
I must say though, some of these Miners have shaped up a bit and look good.
Take a look at SA & SGBL (And we already know about XRA).
Those 2 charts look very bullish.
NOTE : UUUU is near the 200sma and doesnt look too bad, see my chart below. Looking at URA, UEC, URG , DNN – they do look like they could drop from here, so maybe taking UUUU of the table would save from some pain, if URA is ready to drop.
hows about our buddy urre
Well, There is nothing wrong with UUUU, but what I’m saying is that URA, UEC, URG, DNN look like they could drop, so that is a sector. URA has a weak MACD, UUUU has a good looking MACD.
Basically what I am saying is not sell UUUU because it looks bad, I’m saying if you own a Uranium stock, whether it looks good or bad, the sector and main etf URA look a bit weak.
That may affect whether you hold or not
Ahh.. I was wondering why URA was looking bad and URRE didnt seem to be following the same patterns as any of the others…
Maybe UUUU has something going for it an the holders of the stock are just holding .
It does seem different.
And URRE bouncing off the 200sma seems reliable
61.8% retracement. I’ll hold, price moving higher.
TGB has gone down the tubes this afternoon breaking through the 10SMA and it was already through the 50SMA when Alex posted the chart below.
Not sure if you noticed , but I posted that chart pre-market ( You can scroll over the time on the post). Markets were heading higher this morning, but we are now experiencing a selling off of moost general markets ‘stuff’, including , Financials, USB, , etc etc . so yes, VALE, CLF, TGB, etc etc – they are selling off. THings changed after the open.
Not the time to be long general market ‘stuff’ at the moment, most likely there will be stops run out in market world today , and some are probably closing positions to avoid stopping out. .
Yes, I saw it this morning and that is what I was referring to as “the chart below.” Thanks.
Me too
so what I am saying is that ‘set ups’ from pre-market when the markets looked set to go higher would not be valid now with this market roll over.
I wouldnt be looking at ‘long’ set ups in this market environment until things settle
I had been stalking CLF to go long past 2 weeks and just never pulled the trigger. Glad that I waited now. Once I saw the downdraft this morning I obviously changed my tune.
miners cannot break through
Selling 1/2 of my JNUG into the close . It is still not clear whether or not follow through tomorrow will push GDX GDXJ to their 200sma or not, but I need to be happy with the first 1/2 of those gains . The rest can live the wild life 🙂
Thanks Alex
It actually started going up a bit in the past couple of minutes..
…as if you aren’t watching it yourself….hahaha
He might be having second thoughts though? It is behaving just like it did into the close yesterday.
does look interesting…
I’m out of JNUG
I sold too….got in today too late and so sold at break even…rather do that than risk downside…..can always get back in..
guess I need to check here more often
You and me both, brother. I was unavoidably detained and missed my clean exit. Drat.
Well, I mentioned it earlier today a couple of times too, that I would be checking things out at the end of the day.
FWIW … I know some are tired of me talking about “signal trades” but I feel obligated to mention that there are some massive bearish long tail candles on my charts from yesterday and today showing GDXJ down to $36.08 … GDX down to $21.80 … NUGT down to $8.21. There is no long tail candle for JNUG that I can see, but if the others hit it will likely follow suit. As always, those candles may mean NOTHING and I am NOT predicting they will hit. But they have hit often enough lately to be worth mentioning. For those long miners, I hope none of them hit. Good Trading to All!
Next time mention it before the close……….
I did post that 5 or 6 minutes before the close, I started writing it 10 minutes before the close. I almost didn’t post it, but I figured I would feel bad if miners dropped and I didn’t say anything. Miner started to drop heavy just after I posted it.
Unfortunately I wasn’t sitting in front of the computer.
when do you get the wicks? Late in the day, early…….
They usually appear in the AH and pre-market. Again, I hesitated to even mention this because miners may take off and rally like crazy. Just some “food for thought.”
Steve, I’m your loyal fan. Please post it. Thank you.
I asked you the long bearish tail of XLF last Friday, but you didn’t answer. 🙂
Steve, please see my comment below. XLF got hit today. 22 is the target?
Actually, I see a long tail BULLISH candle for XLF in the AH today with a high (“target”) of $24.26, which is near today’s open price. Please DO NOT “bet the farm” on that … who knows if that will hit or not? I just find these interesting to watch. https://uploads.disquscdn.com/images/b6e7b0d926bb619c0cd4f0fca50a1eeecfb5d4273885b0e834e0cf6b8b5705eb.gif
Steve please explain what you mean? are you talking about wicks? i don’t see any bearish wicks today
Yes, long wicks in the AH yesterday They don’t show up on all charts, only certain trading systems. I avoided posting any “signal trade” charts today because I don’t want to get Maria mad at me. LOL
Dude, GDXJ to $36.09 is a 12% wipeout for JNUG. Hard “no” here. Can’t let that happen.
Thanks Steve. The candles do work pretty good. You keep on posting. We all like it. Thanks again. John
Man, what an absolute craps close. Considering NAZ was down btw 80-100 this afternoon, I was doing alright. Right up until GDXJ gave it up going into the close. Metals barely budged and look alright AH. I think the late day ferocity of the market selloff just got to them. They are still equities after all…
I have S&P in intermediate wave 4 (down). Specifically in ‘C’. A was the move into Alex’s proposed DCL, B was the bounce up all the way to almost retest the recent highs. C is the washout into what I think might be an ICE. That doesn’t really line up with the above report, but if we get SPY oversold at some point in the next couple of weeks, I’ll be going long. Especially if miners and metals have not found proper footing yet.
MNTR is quietly up 9% over the last 4 days. Anyone else in this?
I had it and sold before it started climbing (of course!)….but kept it in a retirement account where it’s been under water….so waiting for that to come up…I did get in again this morning in my trading account…..really mis-timed myself on this one….should have been patient a little longer before selling…hopefully what I bought today will go up…..I had a note to myself to get it this morning but didn’t jump in quite in time….we’ll see….:)
MSRT has been climbing too…I don’t have it….
This one has backtested the 10 twice now. Hmm… a tempting meatball. *bort bort!* https://uploads.disquscdn.com/images/39a07191227164b5878e2f926f16deed865139b02701c396844e99e5b86293f1.jpg
US equity issues spilling over to Asia with Nikkei down 2% already. $ and gold mostly flat right now overnight.