
3-24-17 Sleep And The Shiny Red Apple
There are times when different markets may look ripe for the taking, but we don’t want to fall asleep to the possible warning signs in some market sectors. Lets review the weeks activities…
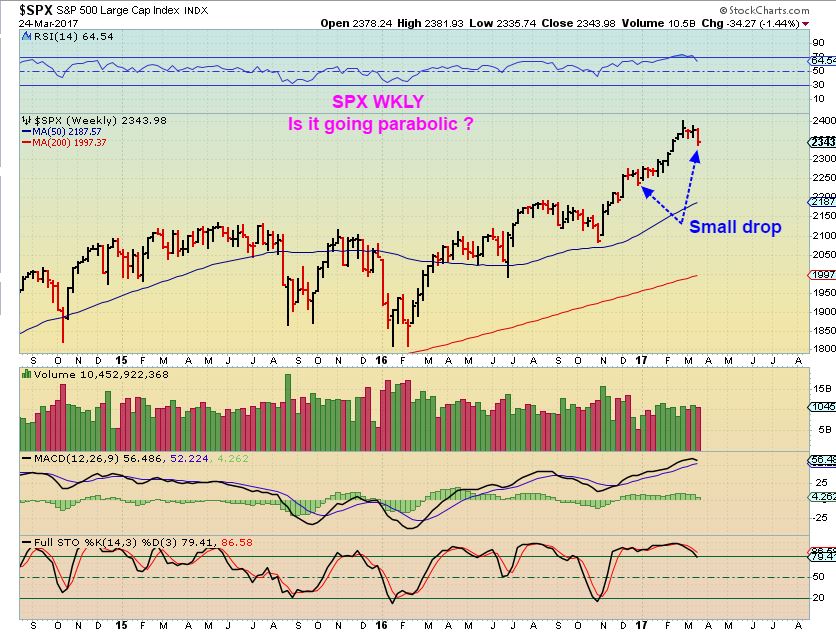
SPX #1 – The drop on the weekly chart isnt drastic, we’ve seen similar drop before. If it just continues up from here, we could be witnessing the beginnings of a parabolic type move.
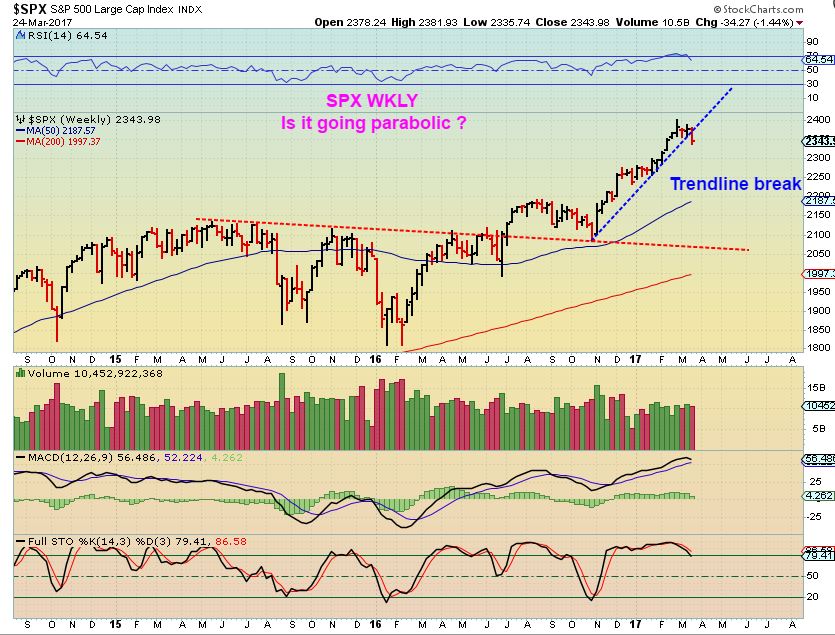
SPX #2 – We do see a trend line break, so the drop can continue lower.
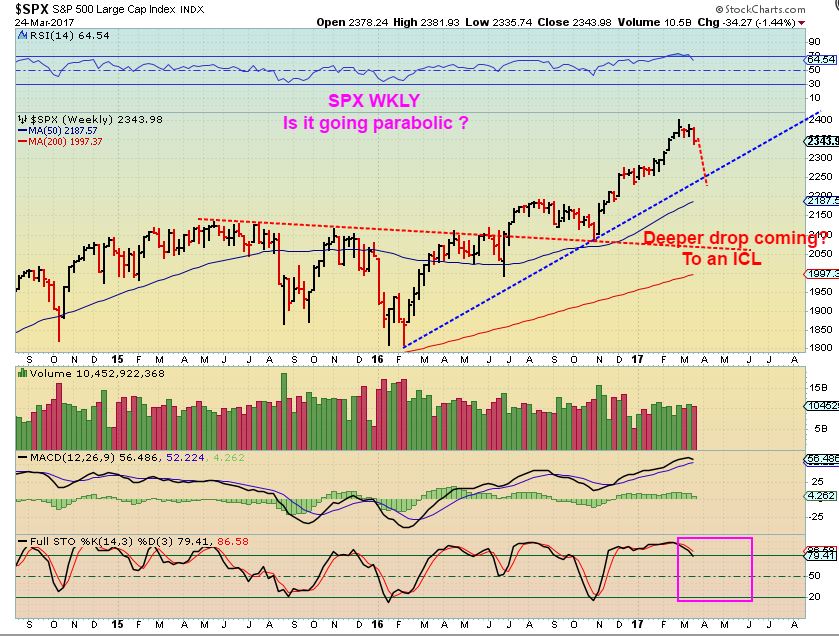
And SPX # 3 …
SPX – I am expecting a drop from here actually, as mentioned in prior reports. You may remember what I mentioned about a few other sectors like the XLF?
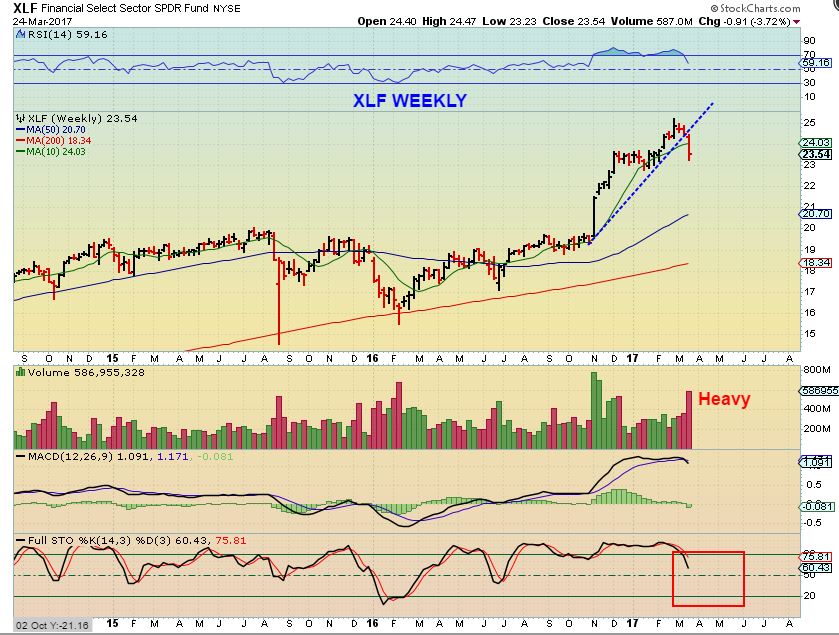
XLF – The Financials dropped on heavy volume and in my opinion this dosn’t look like the end of it.
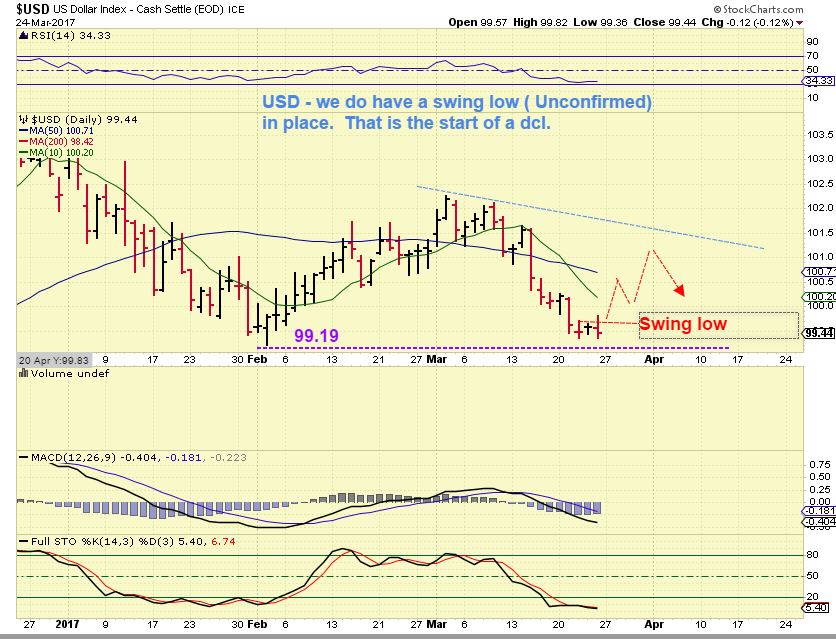
USD – We do have a swing low in the $USD, but it is unconfirmed at this point. This is how a dcl starts. EDIT: The lows of Friday were taken out as I’m writing on Sunday night, so we have a new low. I’m still watching 99.19 as important.
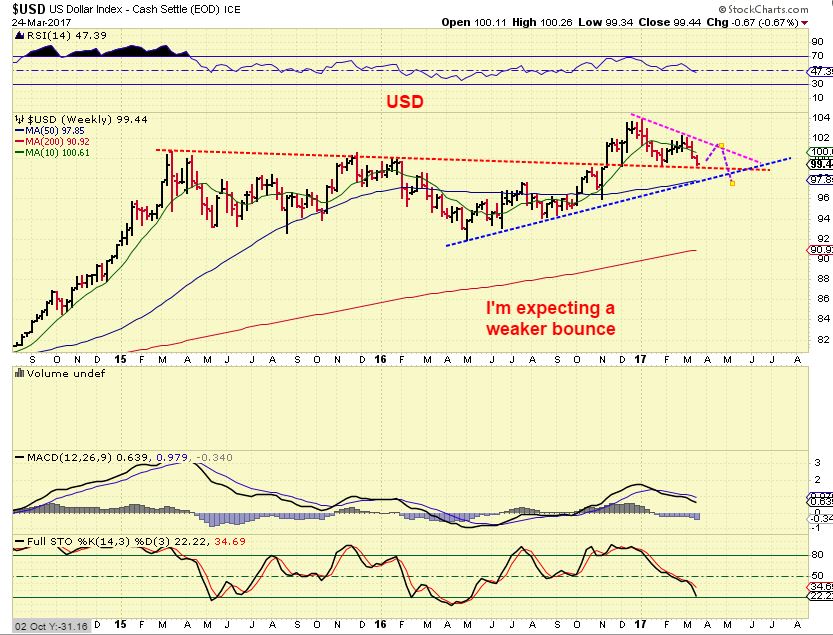
USD WEEKLY – The USD is due for a bounce.
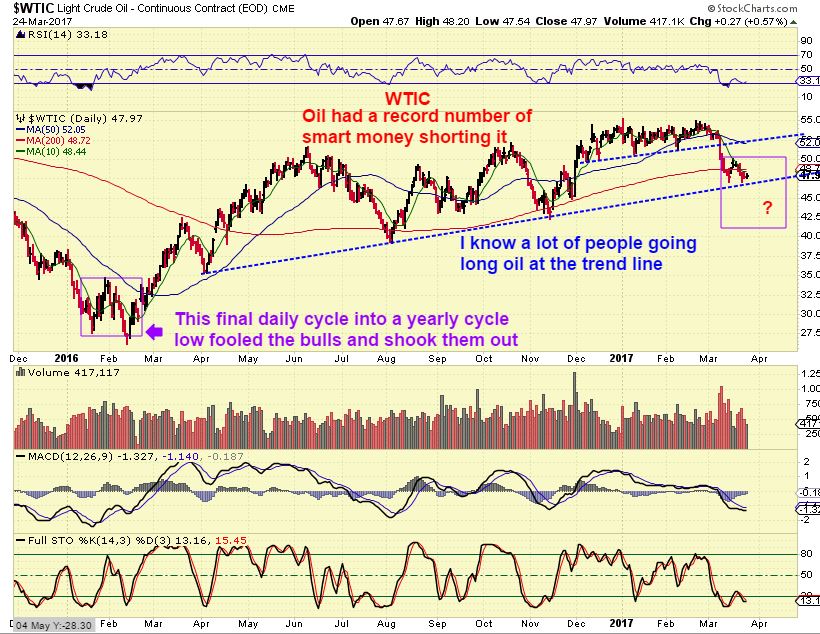
WTIC – Many are going long Oil now, with a trend line tag. I still expect lower oil prices.
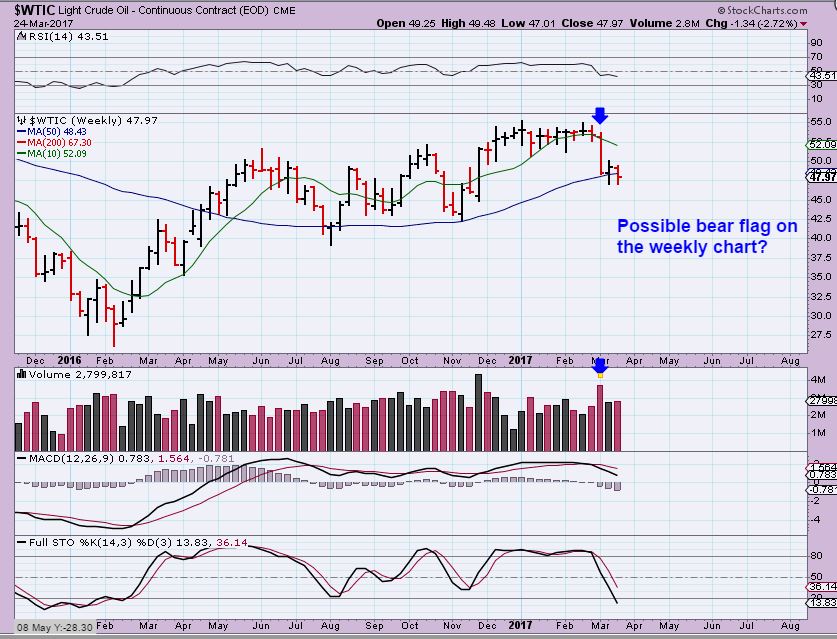
WTIC – OIL WEEKLY shows a pause at support, but will it hold?
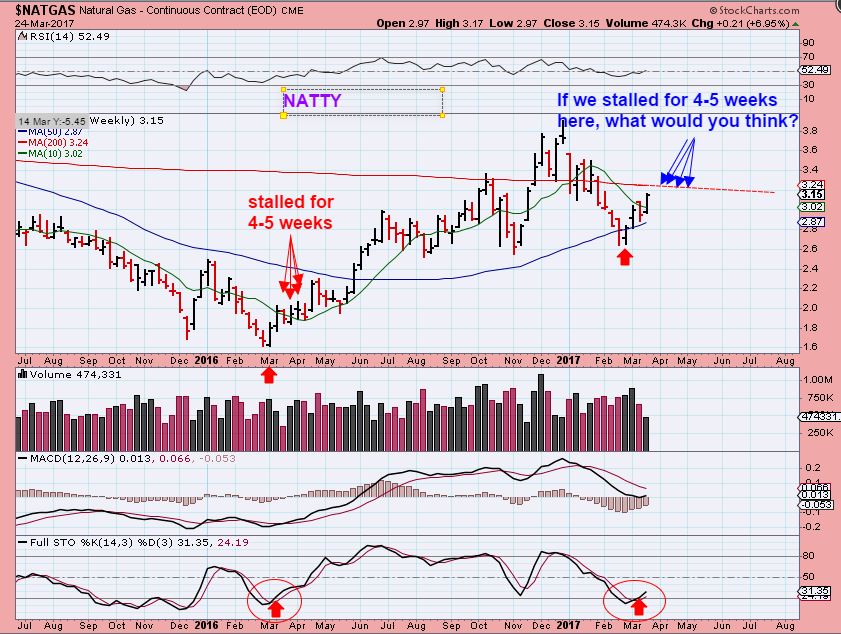
NATTY – I have been long Natgas for a couple of weeks now. As it approaches resistance, it could pause. If you look at last March & April, Natgas paused for 4-5 weeks and went sideways. If it happens, people will automatically start discussing how bad warm weather is for Natgas, and how it cannot go higher in spring & summer months. I was bullish last year and I got many emails telling me that I was wrong because NATGAS will fall in warm weather. DO NOT Trade natgas strictly based on the weather, use charts. LOOK AT NATGAS ON THIS CHART IN JAN, FEB, MARCH of 2016. That is the cold weather and it crashed, warm weather came and it ran higher all summer long. CHARTS DON’T LIE.
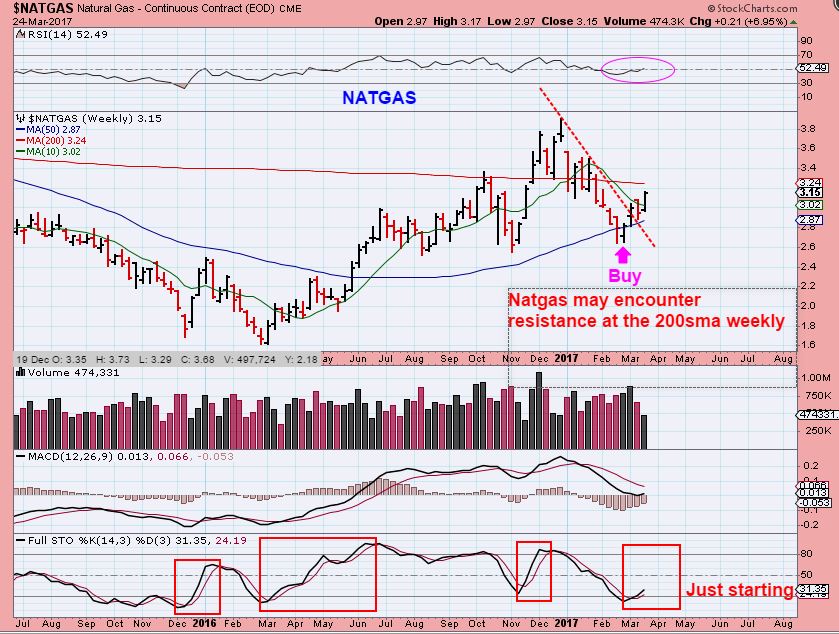
NATGAS – Again, Natgas ran higher all spring and summer in 2016. I’m hoping that it can just move right through resistance.
.
GOLD, SILVER, & MINERS
.
To start, I just want to discuss the daily and weekly charts of Gold, Silver, and GDX and how they look. They do look bullish in many ways, and they may be, but there are reasons to ask ‘Are they as pretty as the Red Shiny apple was to Snow White?’ Are they good looking, but possibly dangerous at the same time? That is what we will discuss after we take a look at how pretty the charts may look.
.
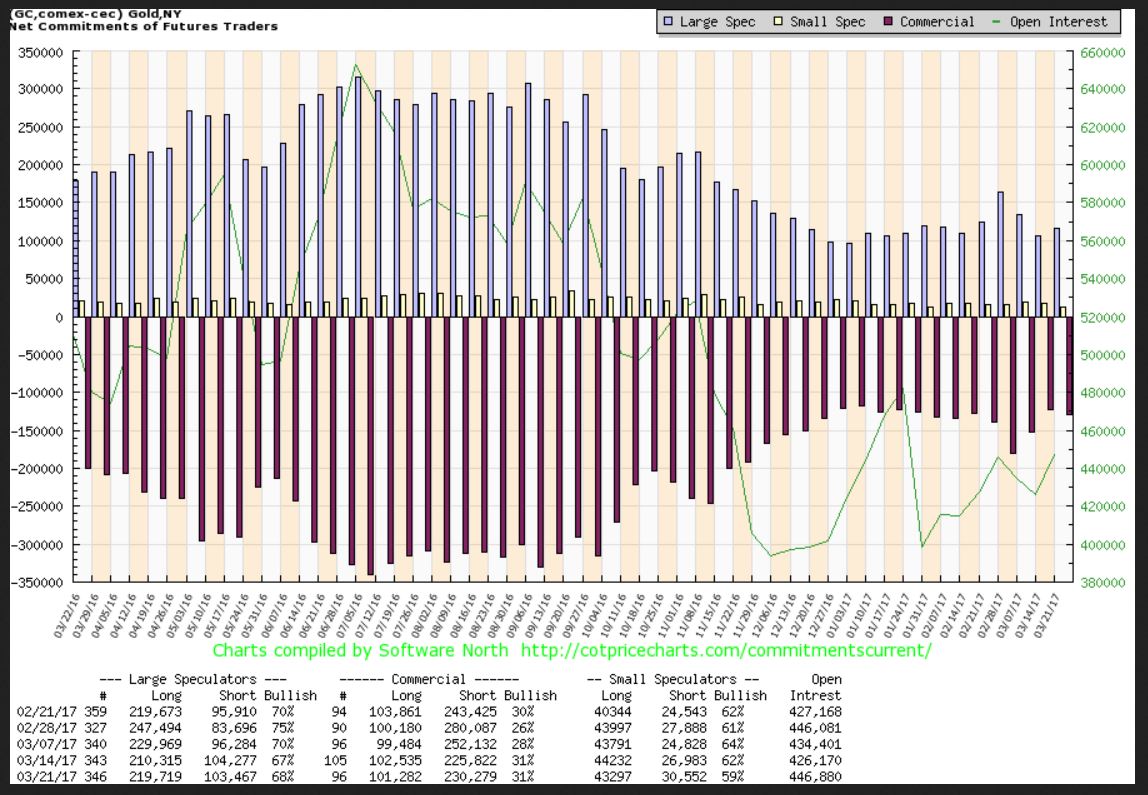
COT – The COT is rather bullish if you ask me.
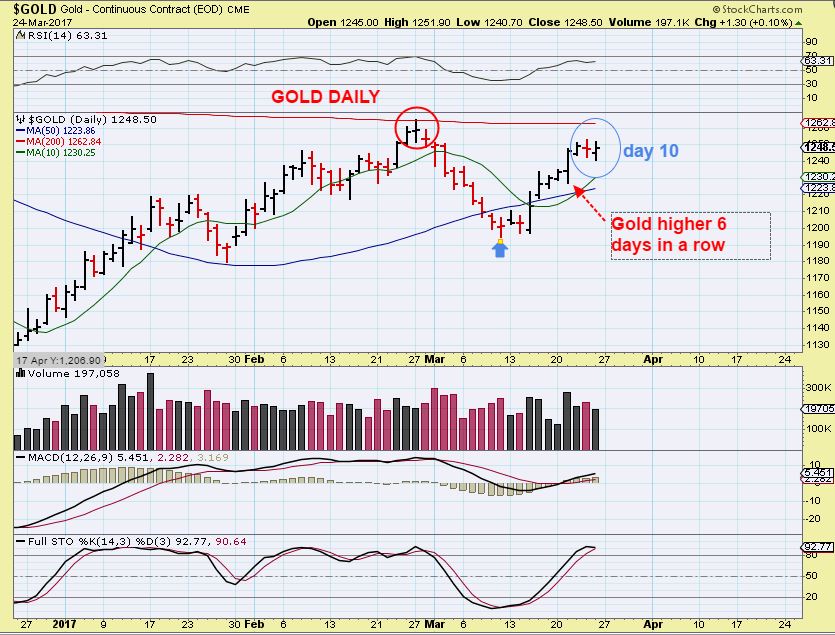
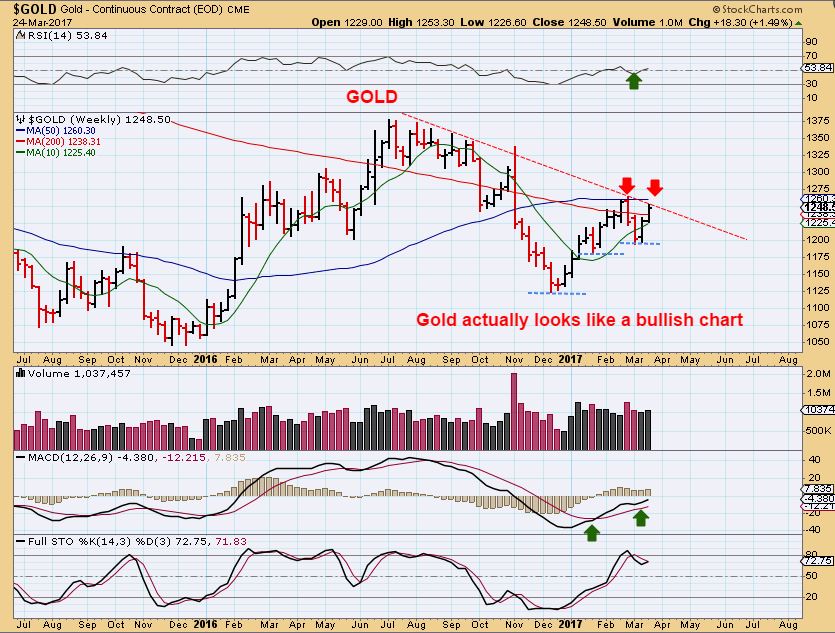
GOLD – Day 10 & ‘Looks’ Bullish at this point. This should still tag or even break out above the 200sma. The 200sma is about $22 higher than current price. $1262.
GOLD WEEKLY – Gold is at a resistance trend line, $20 under the 50 ma , etc. It still looks bullish with higher lows and the daily had 2 r.t. daily cycles. That is why we expected GOLD to possibly break to a new high before stalling.
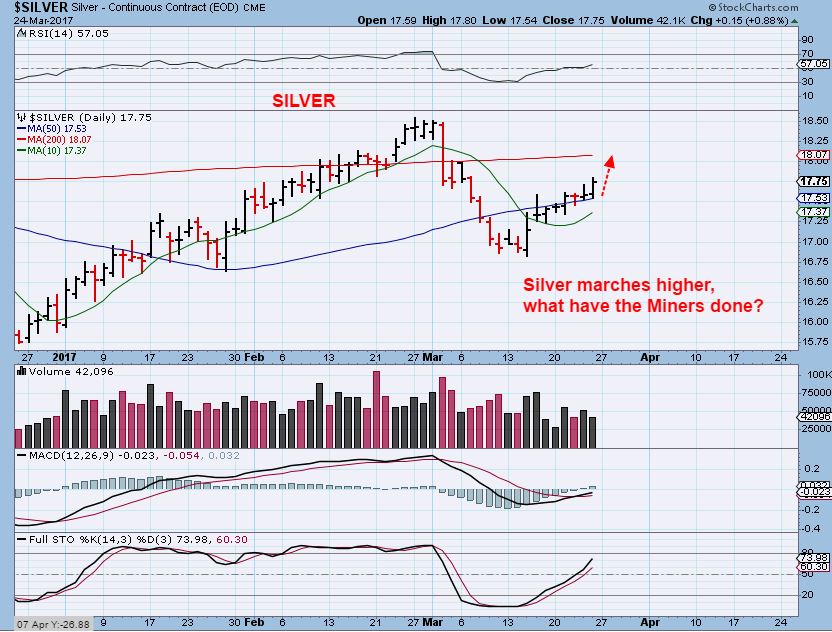
SILVER – Silver has been acting bullishly too. Silver could reach $18+
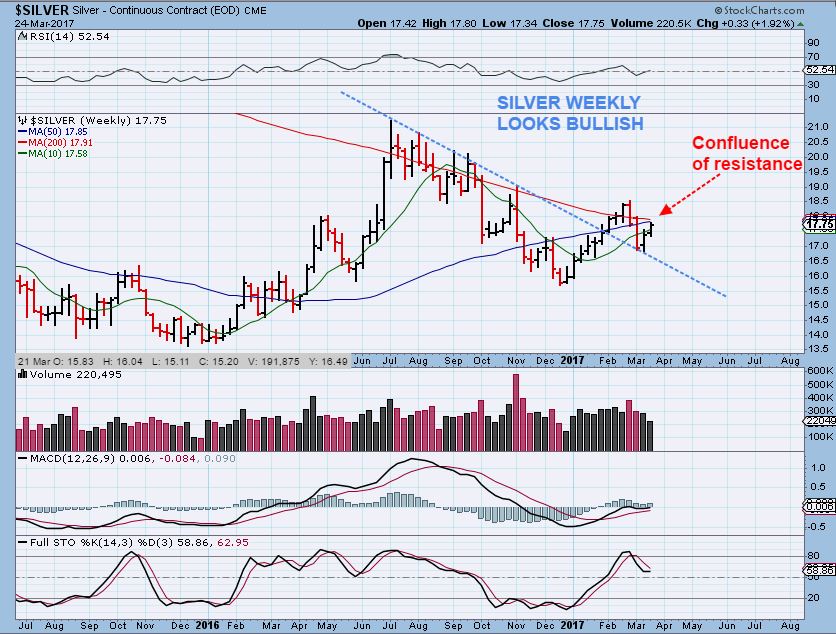
SILVER WEEKLY – This looks like a break out & a back test and would be bullish too. It is at a resistance point too, however.
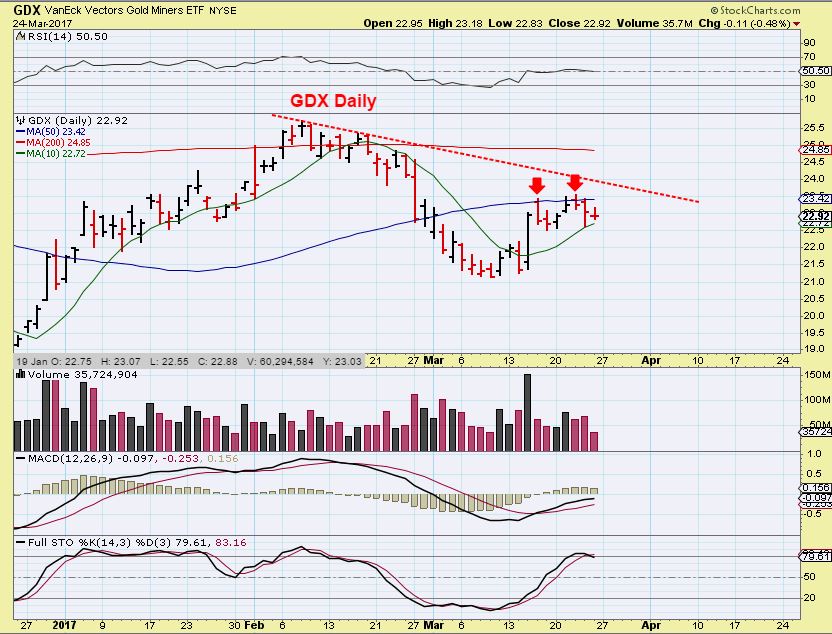
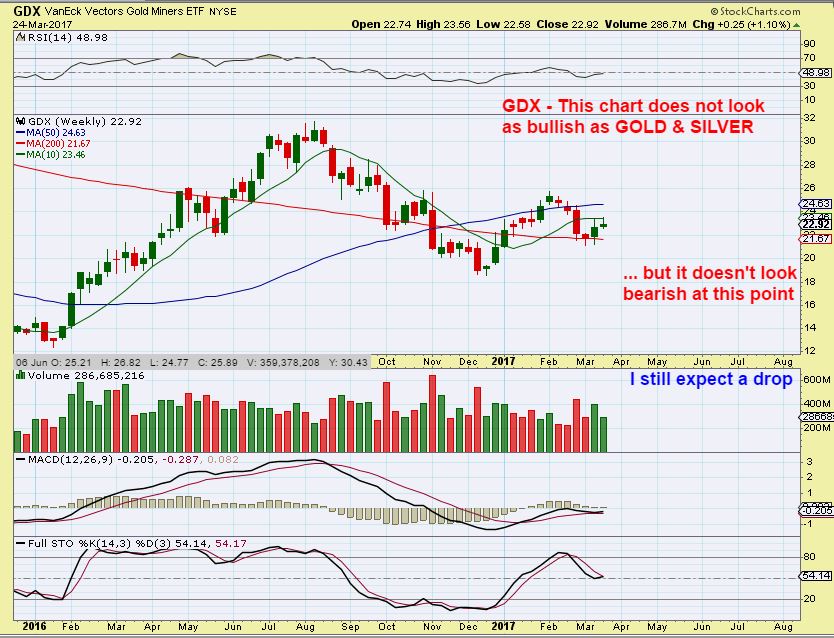
GDX – MINERS are not looking as bullish as the metals. At this point resistance has held it down for 7 weeks and Miners peaked in early February weeks before Gold & Silver. My question is , “If Gold shoots to a new high, will GDX break to the 300sma too? It could, but honestly it has ignored Golds recent progress. Strength or weakness here remains to be seen.
GDX Weekly – $24.63 is the next resistance if this breaks higher with Gold.
So basically, GOLD & SILVER still look Bullish, Miners look mediocre.
.
Now I want to discuss the fact that I am still expecting an eventual dip down into an ICL. GOLD & Silver look quite Bullish, and as mentioned, Golds set up was bullish. The MINERS are rather neutral, struggling at the 50sma and L.T. in their 2nd daily cycle. What does it imply? And WHAT IF the Miners do pop over that 50sma, does that change my mind that they are weak looking? If GOLD breaks above the 200sma, does that means it is just going to keep on running? Good questions to discuss.
.
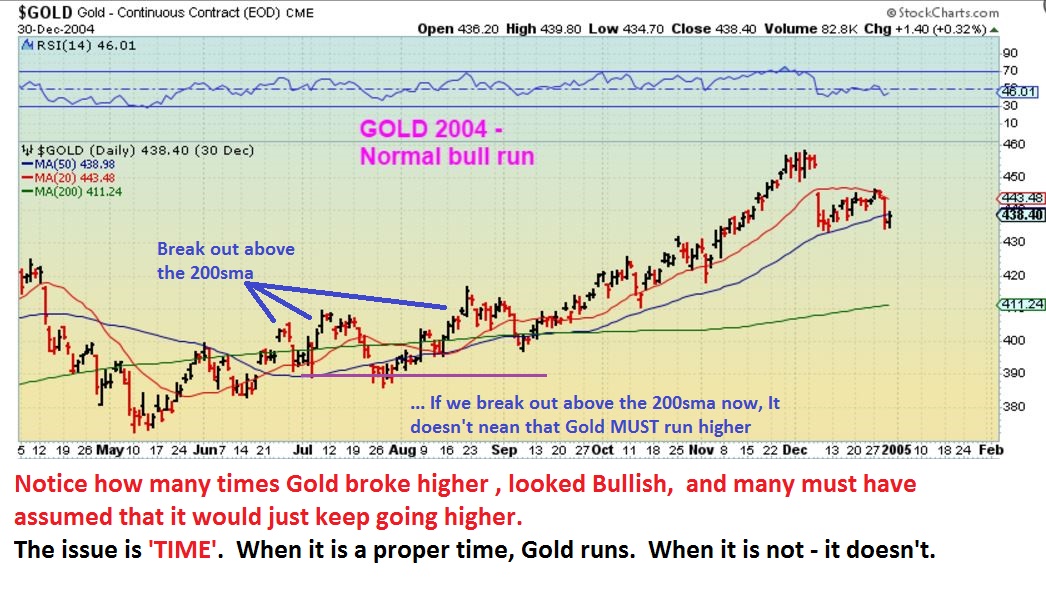
I like to look at the prior bull run for answers, and that way we do not get emotionally biased if Gold does break above the 200 sma.
1. Notice that GOLD can look bullish and break out above the 200sma ( & still drop). And then it can Break out again ( & drop), and again ( And drop) as shown below. A bull market can still whip saw and BUCK bull riders off. The key is to enter at a safe point, a dcl or especially an ICL. Read the chart of GOLD during the Bull Run during the Gold 2004 Bull run.
So if GOLD breaks out above the 200sma, and Miners break out above that 50sma, THAT is going to look very bullish. I know that many would jump right in and get ‘buy’ signals on short term charts and even daily charts. Is that a trap? I think it could be. Let me show you another recent occurrence.
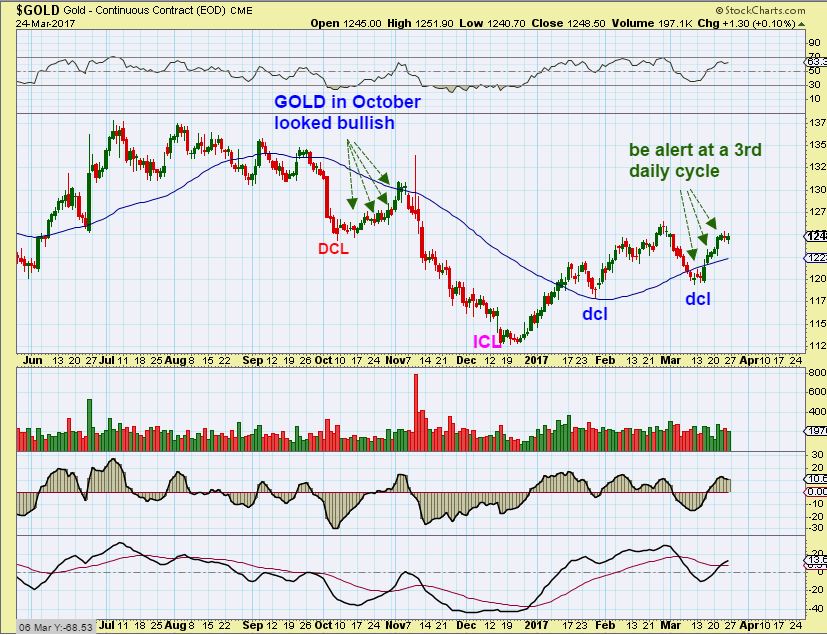
GOLD THOUGHTS – Some are saying that we just saw an ICL in Gold, and honestly the timing isn’t even right according to historical precedence. I admit that Gold looks bullish, but I still look at everything and want to warn…. Please remain cautious. If I were long Gold / Miners, I’d ride it for all it is worth, but I’d use a trailing stop. Why? There was a good chance that OCTOBER 2016 put in an ICL, and the timing was even right. I bought this low as an ICL and rode it successfully for weeks. Look what happened at that time.
Look at that bullish looking October 2016 ramp up in Gold. Weeks of running higher, maybe even better looking than the current run. As it broke out above the blue line, it stalled & failed. In my opinion, GOLD is due for an ICL in April or MAY, and a drop into an ICL is not one that you want to ride out long.
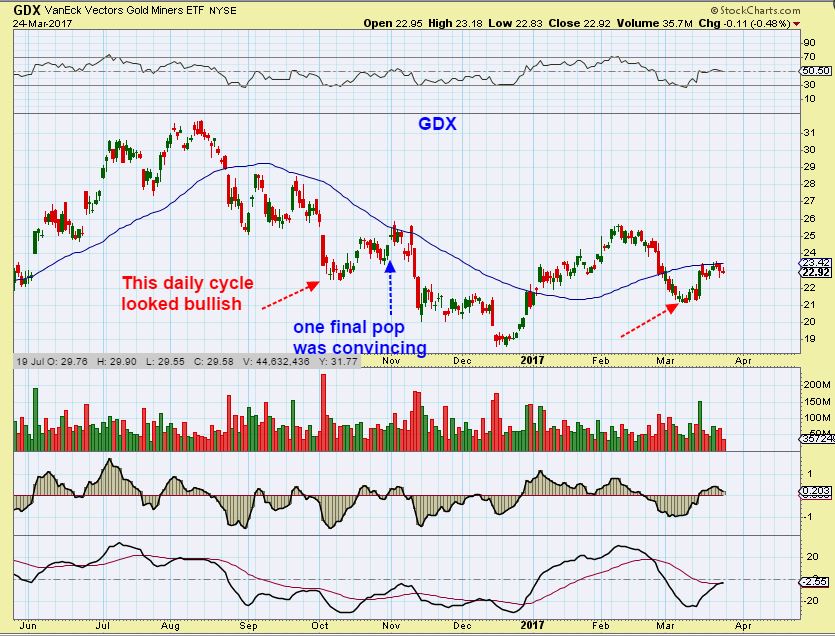
GDX – The same run up in OCTOBER in the miners was not quite as spectacular as Gold, similar to Miners now. A warning? Most are very bullish on Gold & Miners, because they are about to break out. NOTICE THAT October had GDX ‘pause’ and drop & then surge higher in 1 final POP. That sounds like Miners right now too. Look what happened after that 1 final POP.
.
HUI 2004 – I have shared this chart in prior reports, but now it really does look like where we might be in ‘time’. LOOK AT THIS CHART, I have now added some commentary. Do you see where I would place us now? If we get a drop like that, unfortunately you will hear everyone saying why the bull has died. Misinformation. We will be dropping into an ICL, ‘timing’ is approaching for one. Remain calm, stop reading every reason why the bull died, and get ready to buy.
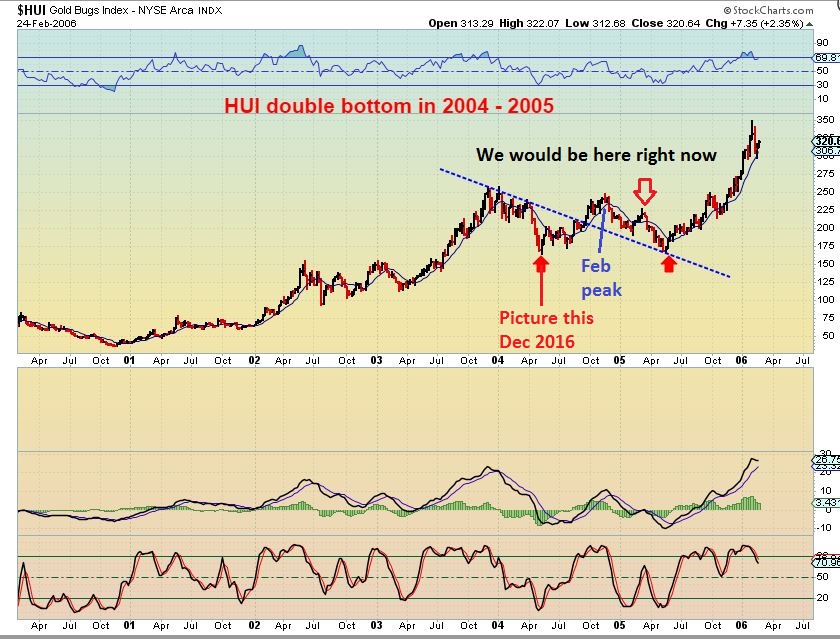
In conclusion, Gold did have a bullish set up, with 2 right translated daily cycles. That USUALLY leads to a higher high and a ‘peak’ during the 3rd daily cycle. We could still see that, and Gold COULD break above the 200sma and run for a bit, but it also can drop back below it when it dips into a DCL. Also I do expect a dip into an ICL sooner than later. The Miners have been weak and struggling under the 50sma, but they CAN break out higher too in the short term. I think that the BIG opportunity is still ahead when they drop into an ICL. We want to be ready mentally to buy that, even though most will turn bearish at that time.
I’m still bullish on Natgas, I still think that Oil will be trading in the lower 40’s again, and the General markets are right in the middle of either a parabolic type run higher or a deeper drop. The XLF and banking stocks do look bearish, but unfortunately the charts for the SPX, RUT, DJIA, and NASDAQ are not clear cut, NASDAQ actually still looks more bullish than the rest. This means that if you are long, you always need to protect yourself and always use stops.
.
EDIT: As I proof read tonight, Gold popped up $10. That is still within the expectations that we had, but did you notice that when you see GOLD up $10, it seems VERY BULLISH. On the charts of this report it still hasn’t reached the 200sma, and Gold is on day 11 of a 3rd daily cycle. The POP in Gold does not change anything in this report, in fact, it was all baked in with a possible run or break of the overhead 200sma. It could be the delicious red apple that sucks in more bulls and lulls them to sleep before dropping into a dcl. Again, if you are long, ride it and use a stop, maybe a trailing stop. We’ll see what the Miners can do on Monday. Have a good Sunday night!
.
~ALEX
.
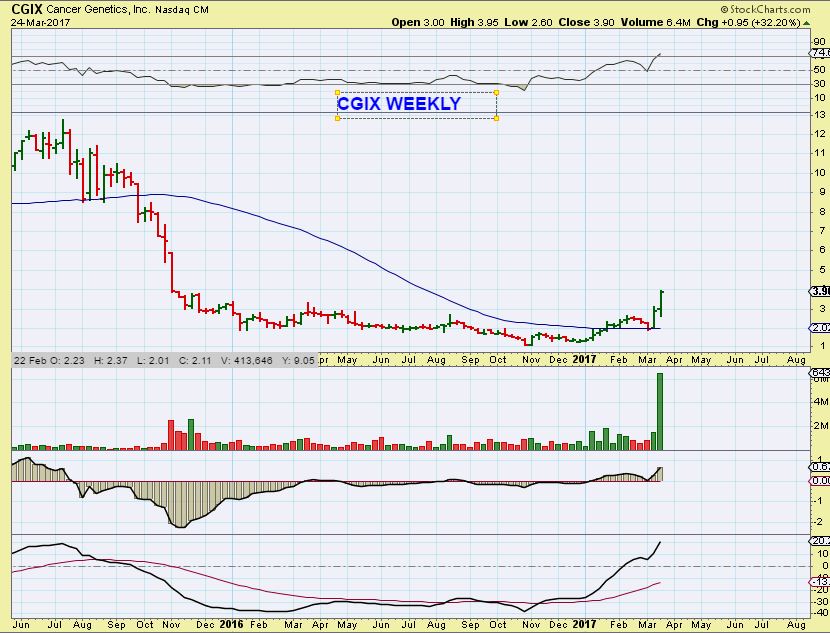
CGIX WEEKLY – This trade is acting like the NAK break from the long base. I pointed this out in fridays report and it closed up higher Friday.
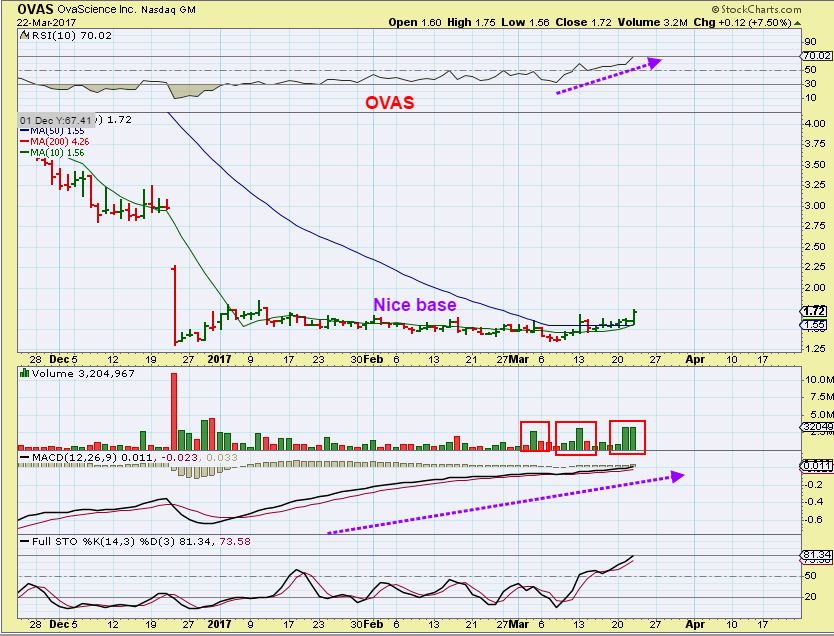
OVAS – I still like this set up too. I bought it last week and am still holding it.
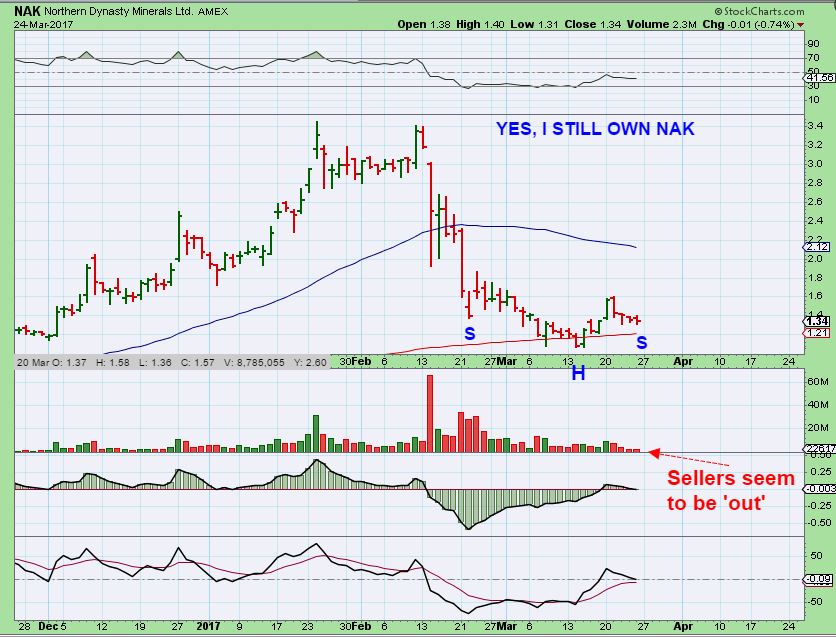
NAK – Yes I still own it. Read this updated chart.


Great report Alex…. ICL due in gold in may .
Thanks David, Such a busy weekend, I had to skim post read it, so I hope it had minimal typos and made sens e 🙂
Yes, in the next month or 2 I would say we get an ICL. Have a good night! 🙂
Thanks for the best weekend reading each week Alex! I get so much more than what I pay for. These ICL’s are really healing my trading and retirement accounts. Just 2 ICL’s a year is a huge compounding effect. Have a great week!
Shermo, Thanks and a I agree.
I wish I could convince newer readers that we can make their accounts experience great gains at the ICL. I’ve had a few write and say that at ICls, they think we are crazy for buying, and once the move has run higher for a few weeks, they are then afraid to enter a trade because it may be too extended…so they miss the move each time.
If they stick with it, they will experience it too, the compounding affect. .
I had done that in the past (too late stuff). But now try to jump in right at the ICL. Of course this time, miners faded way too early, which really hurt my gains, but man I was ROCKING in January. Ready to do it again!
Meant to say helping
Very thorough! Thanks.
A lot to think about in the middle of a move, H50 – that’s for sure.
Right now , Gold is running quickly higher toward that 200sma, up $13 tonight and it looks very bullish. I picture many tomorrow just jumping in feeling that they are missing the next move in Gold.
As shown in that 2004 chart, many that jumped in on break outs without proper ‘timing’, get whip sawed, and I feel that as a 3rd daily cycle – it will peak sooner than later. I just dont feel that this is the time to be jumping in, though that will be the natural reaction emotionally.
Buy the dcl and ride it, but jumping in later can be risky.
We’ll see what Monday brings
Alex, did you buy GEVO? I know it was on your list, but haven’t heard much. Had a good week last week.
No, I didnt. It’s still low risk and could be bought in this area, especially if it pulls back.
I was looking at SOXS and came VERY CLOSE to entering that trade, but I decided to wait for the weekend to go by, and see how the markets look. I expect more downside and the SOXS looks like it hasn’t started the move yet.
Alex, please let me know asap when you’re ready to buy SOXS. I’ve already bought some last week. thanks.
SOXS gapped open and now has closed the gap at 7.80, which I bought. Thanks! *bort*
My GEVO order got filled this morning, too, at $1.10. Not a huge position, but stop is clear so I bought. Hope it runs. Weekly chart says it has rooooooooom to do so.
GEVO now at $1.27!! Bort bort!
Capitulation volume on SOXS last week, doncha think?
https://uploads.disquscdn.com/images/21c3f0e0c7c7b8334d06d7b84f5cb39c9958a557482e2aafd6b4ef233fbcde2d.jpg
Morning Alex! Working OT again:). We are diverging here for the moment: gold up markets down. I know you believe this will be short lived for the miners and they should reverse lower. You think the conventionals and gold both bottom together in April/May and move up together at that point? With the S&P making new highs? And the miners finally exceeding their summer 2016 highs? A test of the breakout at 2100 on the S&P would seem logical.
Hi Mark,
I’m not quite sure if this is a rhetorical review of what I’ve said with those question marks or if there is a question in here – but basically, yes, I do expect precious metals to pull back since this is a 3rd daily cycle. The markets I expect this pullback has further downside, but it is topping or will it continue in an eventual parabolic top? That will be determined over time. It is a bull market until it breaks that run.
Are you kidding me?:) Them were questions. I always have questions. Do you think gold and the S&P move up together or can’t say at this point?I ask because I wonder once the unwind occurs in both the S&P and gold, a declining dollar may actually help gold along with the conventionals. Right now, this seems to be an unwind of the carry trade (Yen) from the November election and once that unwinds a declining dollar can be of help to the markets. Just thought.
I am not kidding you, I had no idea what you were asking 🙂
At times Precious metals and the markets can run together, at times they diverge. Instead of guessing how it will play out side by side months from now, I just have to see how things play out in the big picture. Like I said, the general markets can be topping for a bit, but remain in a bull market. If they are entering a blow of top type parabolic move, they will ignore the USD and GOLD for a while & just do their own thing- it is a sentiment thing and it gets emotionally charged regardless of earnings reports, USD, Precious metals, etc if it enters a parabolic blow off top.
Right now I still see signs of cracks in the general markets near term. I need to see how the recent weakness plays out.
You mentioned that you think that the USD dropping can help the markets. Look at a 5 year chart – Both were running very strongly higher together in 2014. To me a declining Dollar would help precious metals.
Thanks Alex. Of course, my comment was said in jest. Interesting stuff. Actually, I was thinking once the carry trade unwinds and the USDJPY reaches the November levels, should the USD continue its decline it may help all markets. I understand your comment.
/GC making a run for it. But surprisingly I don’t feel even remotely compelled to buy. Job done. 🙂 Thx Alex.
Good Morning Alex, in the report you mention the previous low of 99.19 USD as important. What could the possible scenario be if this level fails? Look at next horizontal lower support? Or since a DCL is expected the turn is imminent?
TIA
Alex- no doubt miners act very lethargic and should be higher which is a clear warning. That being said most all over web are looking lower or waiting for an ICL/pullback.. this would be pretty evil if we just broke out now.
Very contrarian of you! Yes, that would really mess me up for sure!
Right now I see GDX about to gap open around the 50sma, and the charts show that it has been there for weeks, so at this point nothing at all has changed. If You are wishing you were long ‘just in case’ – and if you are thinking that you might be missing a move, you could enter here and it is exactly the same as if you entered at the 50sma last week ot the week before…. and keep a tight stop. My analysis is to show how I am viewing the markets. Even in my reports, I have shown that GDX could break the 50sma and run to the 200sma, so a scalp trade could work out, but I am showing that we should see a drop in the near future and it compares to the bullish looking set up in Oct / Nov.
$$ just keeps dropping this morning, absolutely getting hammered. But that can’t last forever!
The USD broke below the 99.19 area that I have been watching. That is very bullish for gold in the long term in my opinion, and bearish for the USD , because it is a break of the prior dcl.
Thanks Alex.
Next lower low for $USD is around 97; though it had a spike low of 95.90 around Nov 9/10.
That corresponds with gold around 1300ish once it gets through 1265.
Maybe I quit on some of my miners too soon??
Hi Cason,
I think what you thought was a pathetic 1 of 3 was a minor wave 1 of 1 of wave 3.
Time will tell
Makes sense. Next ICL would set up minor 3 of 1 of 3 in that case, eh? Right, if one operates off of the potential theory that we could be in a multi-year PM bull that could test or eclipse prior highs then the waves will need to extend, this would be multiple years, not just a few quick pops. The patience gets hard. We would need to see Primary 3 test the 1500-1550 major breakdown on gold for this theory to hold water.
Btw, it would have been less pathetic if I got out at the top back in Feb!! 🙂
As far as S&P/NAZ, have this as C of Wave 4 (down). Followed by a Major 5 next which would line up with Alex’s potential blowoff top. I’d be ready to buy the upcoming low in the markets. Not today, certainly. And ICL selloffs can go for a bit. But once spotted, I’ll go long.
Big drop for banks again, would like to see how it trades
COD. Oh my. 100% of the blowout Feb earnings has been given back at this point. Trump trade coming off ugly this morning…
CGIX is extending
Oh boy, when Maria sees this comment.
SPX gapped open below the 50sma today. I knew that the XLF was a warning sign that we could sell down further. NYA looked like a bear flag.
I got a few emails where people were telling me that “This is a bull and buyers and the FED will step in, plunge protection team to the rescue and the selling is done. “, but look at the TRAN. It broke to new lows. So I was also watching the NYA, IWM, XLF, TRAN and a few other areas and the TRAN has been lagging, usually a ‘tell’ that a larger pull back is in process.
We can still get a normal pullback ( 10% is normal) and then go higher into eventual blow off top type buying, but for now the markets are taking a rest.
Bios fighting back. Check out SUPN if you have time. Remember this is with S&P gapping down 22 points at the open.
Miners look like a fade to me.
Just not sure how deep the PPT / Fed will let the Market drop……I am seeing five waves down in this wave 4 so maybe this mornings low will be it?
I was thinking close to 2300, but you certainly could be correct.
Yes the late Jan. high….we shall see.
You might be on to something here, Ken – nice recovery in markets overall today!
Added to OVAS
Crap….where was your initial entry ? I missed it…..
Not too far below here,just below $1.60. I waited for it to cross the 50sma, but the base is nice. It is the 2nd to last chart in this report, if you havent had time to see this report yet. So I just added at the open, it was down 3 cents.
Notice the gap to the left on the recent drop …gap fill ? : )
Got it. Thanks.
Been in since 1.55 when I first alerted it in here. Playing out nicely rn
Actually my only green trade in a week or so lol
Yes, I think I bought it shortly after – the weekly chart was a good set up as well as the daily.
I hope that that gap fill on the left is calling it 🙂
Wow, there was no volume in this when I added, and all of a sudden it grew in volume by a large amount right around 10 a.m.
I think it had 50,000 on the morning sell off
Keep us posted, I’m taking a chance here with it.
nice… buy some more …. lots and lots more ;o)
giggle
lol
Woooohooo OVAS kicking but today
I added to natgas on the gap fill this morning too, but today is my last addition to that trade ( I want to see if ti can get above the 200sma from here)
nice…:)
I had mentioned GBR at last Friday’s close but it has just continued to amaze.
GBR is one of those 1mil in float spikers thats gets chat room pumps all the time and crashes… Its a scary play man
Thanks, but I’m out. Held it through the weekend clicked on this morning and knew it was time. (even I knew it was time)Thank you.
Up 100% today, would have ade a good one day trade : )
What is the New Concept ? 😉
I asked that question on Friday but had it on my watch list in energy because of the chart. I still don’t know anything about it other than it is hyped at times.
CNAB just landed on the 50sma and this has acted as decent support through out the consolidation process.
The process of consolidation can go on and on, but I”m just mentioning this because it is a low risk area if you can put a stop below the 50sma ( loose stop ) and let it ride for a while. It may not be a good short term trade or scalp trade.
mornin… aumn tryn to do a lil sumthin sumthin…..?
mornin….BLOZF is also perking up.
perking… as in the coffee u didnt send me? :oD
giggle
MORNING sunshine :o)
lol…the timing was spot on with that term.
Actually the correct term would have been “pressing on”. 😉 (french press….in case it is a little too early in the morning for you) 😉
oh no… it’s never to early for …. pressing… ;o)
anytime is a good time for that …. ‘in my opinion’
#meow
AND…then it dropped 7 cents – lol.
Now 1 penny below the 50sma , but so far light volume selling.
Yes, I own it lower, I am still holding. This was more of a BUY & HOLD and see what happens MJ investent for me.
I sure wished GDX would have broken 23.56…….
CF – thoughts on the MAs starting to curl down on URRE?
No thoughts, and I’m not in Uraniums right now.
I was in UUUU and I do like it above the 200sma with small divergence in the macd, but I am not taking the trade at this point.
I have a couple: 🙂
1) URA currently at it’s 50% Fib.
2) URA currently in a wave c of it’s corrective wave.
Alex, what platform are you using to track natgas? investing.com’s live feed makes little sense to me. Here is a screen shot of the 5 min.Stockcharts has it closing at 3.15 on friday, which is where you grap-fill comment came from, I think? But this chart shows something different.
https://uploads.disquscdn.com/images/1c95abc8c6802b6702d58466256f2a32490cd847239b9ead8f2b1d74e226e17a.jpg
Rob, IMO Alex meant the open gap has been filled this morning 3/27/17. https://uploads.disquscdn.com/images/655b00c566c08864b1dc973e18502181c829a19a852016f0d15ebe6eb3057c9f.png
Thank you, Edward.
I was using the trade itself ( Boil or UGAZ).
I personally dont like the light volume today as Boil and UGAZ climbs toward the 50sma, so I am watching to see if todays addition will just turn out to be a scalp, and hold the rest.
Boil is Proshares I think ….might get a K1 form with that . I use UGAZ which quite volatile. I could be wrong though.
Yep. K-1 on BOIL for sure. 🙁
I sold my BOIL and put proceeds into SWN. Thanks!
NAK has dropped to the 10sma on tiny volume & just sat there for a couple of days.
If we can get some buyers to step in and I’ll be thrilled : )
Good morning ALEX….. are you still in NAK, or do you buy at this level ????
Thanks for your perfect weekend report. Still a lot to learn Alex.
Geurt his last chart above in the report ^^
Sorry my dear….. know I see it what Bay-Trader said.
THANKS Bay.
SPX back above the 50 sma…..ppt working out this mornin.
If she stays above the 50 wave 4 complete ?
Crude Oil (USO)
Possible double bottom today…..long.
Triple on the hourly chart. Having a tough time at $47. If it breaks, watch out below. IMHO
Major TL about 2% below this double bottom so very good rr. still long 🙂
OIH is lookn interesting ………….
https://www.tradingview.com/x/sqLXBRn4/
Indeed.
I am Trying to catch the ICL.
3x OIH is GUSh … correct?
Yes. Although I am playing it with USO Calls. 🙂
GOLD was heading up to the 200sma near 1262 , and then suddenly dropped $10. Silver to $18 ( See charts above for Gold & SIlver) and MIners gapped open to the 50sma, and dropped and now are trading up & down below the 50sma so far.
Kind of gives you an idea that maybe we are looking at this exactly as we should be at Chartfreak.
And then there was SBGL, which I mentioned as one of a few bullish set ups in Miners last week.
FWIW … I have bearish long tail “signal candles” in SLV ($16.81)and GLD ($118.86) that indicate Alex’s bearish case for Silver and Gold may be correct. Also GDX has a bearish long tail candle down to $22.92 … and I still have real low long tail candles for GDX going down to $21.80 from back on March 20. As you may recall, according to the “Mr. Miyagi” study, signal candles typically hit within 10 trading days, or they don’t hit at all. It’s only been 5 trading days since March 20. Hate to be a “Bad News Bear” but just passing this along. I’m sitting in cash waiting for an “ICL” low in miners and/or TQQQ.
I added Jdst about 10 minutes ago. $14.20
I much prefer to be long- but this feels pretty heavy on miners since FOMC
Similar to the way MINERS often lead the way out of a Gold sell off, I think that Energy stocks will lead the way out of Oils sell off.
I do see a few Energy stocks that I like reacting around the 200 sma. Metals stocks too. Look these up with a 200sma.
CRK, CLF, AKS, RIG ( RIG Looks really good tapping the 200sma a few times as the MACD diverges.) etc
SWN is also flat basing with a rising MACD and RSI ( below the 200sma, but seems to be basing).
TGB, WRN, HBM kind of holding up a bit here too.
I am not buying any of the above mentioned stocks for my personal account, but I do like the way some of these are setting up . ( I may try to focus on short for Miners for my personal account. Miners just cannot break this 50sma, even with GOLD up around $20 this a.m. )
OAS on the 200sma too. Some energy stocks may be starting to line up.
Are you shot the miners now or waiting
giggle
Hush you … 🙂
😀
I want to see this into the close.
I traded short the last time it was at the 50sma ( Wednesday) and made money on that pullback, so on this one, I want to be a bit patient, but it is acting as expected. Gold was up around $20, and GDXJ and GDX didn’t really break through the 50sma with any kind of conviction. It is probably just a matter of time before they roll over, but I want to see the final hr of trading.
Buying RIG around 12..what is your target?
It hasnt broken higher and shown what kind of sign of strength it will have, so not target at this point. You can watch the 50sma if it breaks higher as an area of resistance.
Thanks a lot.
You can see that the 50sma is also a 38% bounce – refresh – so it may find resistance there as a first target. The 200sma has been pretty good support.
https://uploads.disquscdn.com/images/6a2e4b2a3b84b1cd276719c41d504a0e1309b322efafa148d4850c54b98d8c8d.jpg
So around 13.55..perfect. Thank you.
Yes, but if it flies up there with strong volume it could break right through. It has this mini base / consolidation and they can add a little push to the price once it gets going. I cut the volume off of this chart, but I’d watch for stronger volume up than we just had down and it can mean follow through.
EDIT: just noticed a down trend line hits that 50sma too. Pretty good resistance there.
Thanks
CGIX, the gift that keeps on giving 🙂
NDEV tagged 200 day and is moving up
Perfect tag Friday , and rocket into the end of the day
Yeah, could kick myself for selling earlier in the day today 🙁 🙁
Nice ramp up…..SOLD 1/2 of my CGIX to lock in gains as it gets a bit extended. Better safe than sorry, though it can keep running.
OUT AT $4.47 the current high at $1.45
Nice trade CF !
Took some off too ….
Yeah, CGIX is kind of trading similar to the way NAK used to.The big runs higher did pull back over time.
It is way outside of the B.B. up here, and I think in time it could drop back to $3, so if it keeps running I win, and if it dips in an orderly manner, I will re-enter. So far, it is a nice weekly chart for sure. I just needed to lock in something.
excellent ammunnndo dude
I do have a super-extended target of $4.80’s , and I’ll probably sell my other 1/2 if it can get that high.
Alex, did you pull the trigger?
Sorry Pat, I don’t understand the question , in harmony with my post?
OOOOH! I DIDNT SEE THAT IT HIT $4.80!!!! Sorry Pat. No….gotta go see if its a sell for me….
So yes, it will be basically almost 100% for me at that point. I see a bull flag right now at $4.80 and I sold that flags ramp up. ( It is 3:13 pm, so I am talking about a bull flag on the 5 minute chart )
I will buy the pullback ( MAN I HOPE THAT PULLS BACK 🙂
Yeah me too! Thanks Alex!
I keep looking at the weekly chart, and I am going to be a whole lot of sad if that just parabolically flies to $12 : (
Just have to Walk away…dont look back 🙂
Keep reminding yourself what happened the last time you traded it :-).
True true- I got cut in half in a short period of time. but it just popped past $5 and I cant stop runner-necking the scene of the accident.
Yeah, I’m stuck right behind you LOL
CWEI!!!
Great trade for me, so big thanks for that!
hmmmmmmmm … repeating pattern??? .. will it go UP …. orrrrrrrr DOWN …?? (insert jaws music) dun dun dun dun….
https://www.tradingview.com/x/pjP5l8sp/
that would be a nice fakeout makeout ….
OVAS 2.05!!
I kind of really like SWN here, but I haven’t bought it because I believe that I read that it is mostly a natgas play, and didn’t react upside, but the chart is low risk and really interesting. I’ll put that one in the next report.
One of our fellow readers here emailed me and pointed out VSTM.
Check out the 2 yr weekly chart
I used to trade ZIOP and IDRA and used to recommend them here.
I was watching IDRA and missed it weeks ago and it has been running nicely.
ZIOP is just freaking out a bit today, but a 2 yr weekly charts looks good. I do not own either and am not buying here, just discussing this sector.
Man, you guys are killing it!
Wow, what happened to CNAB? Been watching other things and just saw this….
I thought Sessions confined his comments to sanctuary cities this afternoon. He might have slurred our stock though.
Ah, yeah, I haven’t had time to go listen to what he said about sanctuary cities…….marijuanas are just tough to trade lately due to all the uncertainty….NDEV and IMLFF are still doing ok….I sold my NDEV a little earlier though..just popped in and out of it today, barely made anything but at least didn’t lose…got nervous when it went down so bailed…I see now it is back up….
For the life of me I can’t understand why medical MJ companies (ie. OWCP)which have so much promise are associated with recreational companies and thus suffer a similar fate.
Me either…..
Well there goes NDEV of course, since I sold earlier….agghhhhh
Really have to start trusting patterns I see and stop the panic that makes me sell….
Apparently NDEV, BLOZF, ACBFF laugh in the face of danger – nice charts today
EDXC tried earlier. Try harder, Endexx!
Yeah, one of only about 3 that I still am holding…waiting…..waiting….
I also have some GBLX and NWGFF. Knew I could never get the timing exact so bought a couple where I could hold for a long time, waiting to see if I could get a big runner. Only 1 needs to really work to make the while endeavor profitable. Have room to add but need to see something from it first!
Alex, do you have a target for NAK?
I have to watch how it acts along the way, but $2.00 isnt out of the question for a basic run higher if it acts correctly.
nick nak patty wack ;o)
Insightful lol.
Reducing more exposure in Miners.
Considering how much they sold down right after the opening, solid afternoon. But yeah, I’m now selling pops instead of buying dips.
I started a position in SWN at $6.64 and drew up this chart
I will have a better chart in the report tonight, but this is a natgas stock and it is set up to break above this downtrend.
As someone trying to protect the readers here and give then a safer trade, you can wait for a break out above that down trend line, but I am in now with a small starter position, I may add on a break out higher.
https://uploads.disquscdn.com/images/7d3f94b340fdde87691ba64355cbb61a3437db2875109932899cd998240b5cc4.jpg
Did you mean 7.64?
you taking the miner short?
I was waiting to see how the close was.
No, not yet
I did. $7.64 avg price.
good one. I’ve started a June 8 calls position, added today. Really like it.
Waiting for the break of the TL….
Hasn’t been that low in a LONG time! Did you mean $7.60 starter position?
Look down : )
OK…so I type slow!
H ..O ..T
Looks good… I just bought soybeans and sugar today….. I mean contracts ….