“Yes, there are two paths you can go by,
But in the long run,
There’s still time to change the road you’re on.”
There are times when various parts of the markets are all falling into place and things are very clear. There are other times that we get some mixed signals, but by using Cycles, Sentiment, Technical Analysis, and a few other methods mixed together, you can easily see what should happen. Probabilities and things lining up that lead me to expect a most likely outcome. Right now, however, it is a very rare time when it comes to the Precious Metals, that I am quite divided by my research results.
There are 2 roads that that sector can easily travel, and it is all based on historical fact and probabilities. Anyone here for the last 2 or 3 years knows that I usually will lean 85 – 90+% in one direction, even when we get mixed signals. That direction right now is that first we’d see a bounce, but then things will turn bearish again. As a bit of a first right now, I feel strongly that we will work our way down into the next ICL over time, but my analysis shows that this could just as easily go full on Bullish after the Fed Decision. As you will see , however, there are also strong reasons to doubt it. Lets tackle that conundrum after a market review.
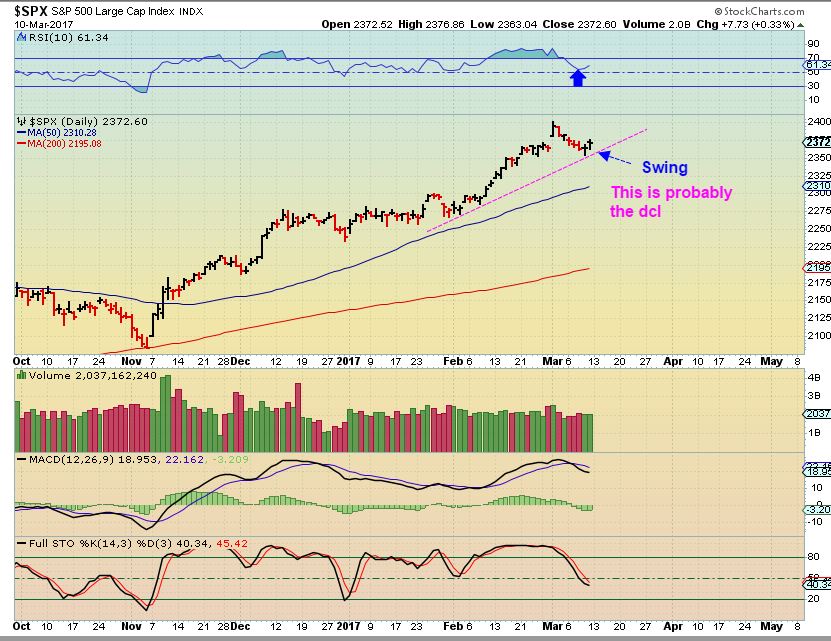
SPX – Bullish. We have a possible DCL in place with that swing. I do not expect that this will drop to the 50sma, instead I am expecting another run higher. This is exuberant and could become a blow off type move.
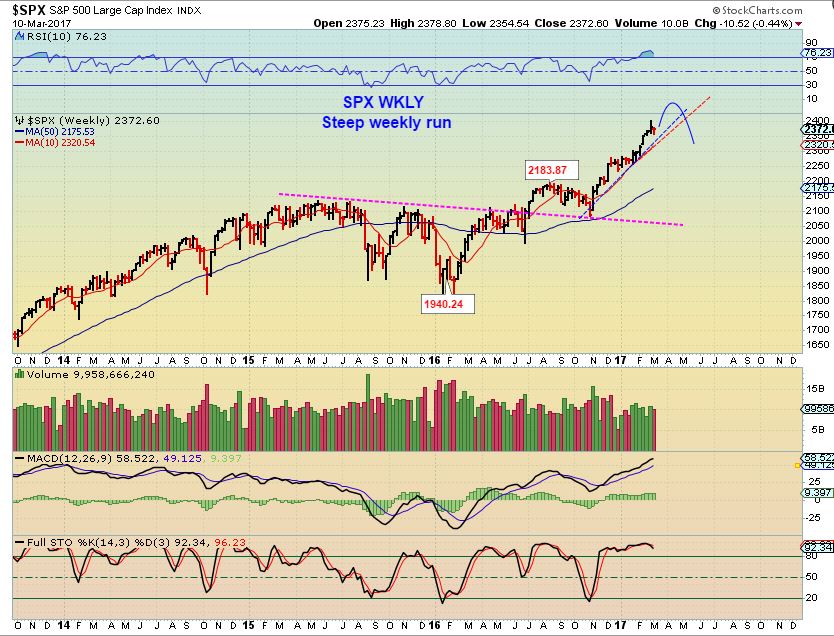
SPX WKLY – The steep incline will eventually roll over into an ICL, but we should have time to run higher first. I will provide targets later.
SIDENOTE FOR SPX: The markets were running higher with Oil at one point. Oil is now dropping, and we have a Fed Mtg Wednesday with an interest rate hike expected, so could that all affect the General Markets? It may, so caution is warranted, since at times ‘anything can happen in the markets’, though the set up is bullish.
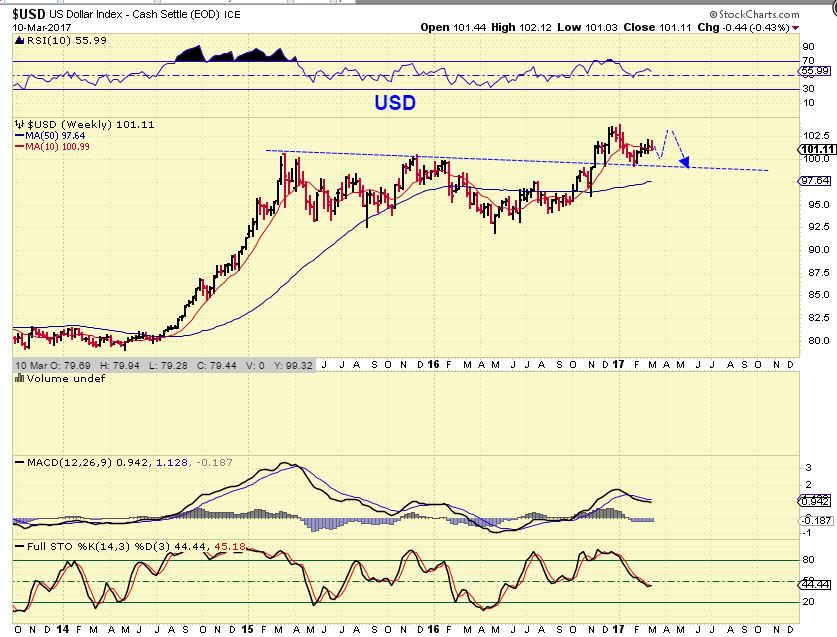
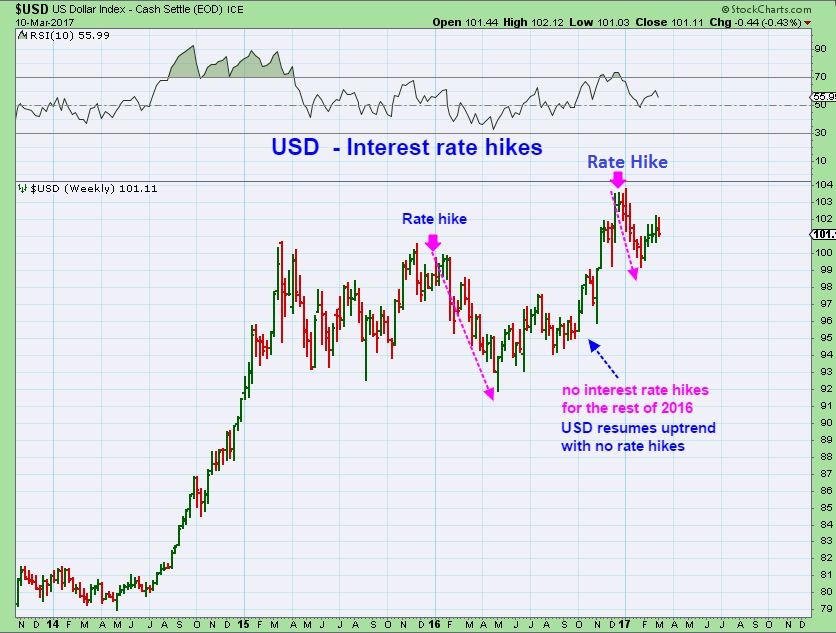
USD WKLY- I’m Expecting a dip short term into a dcl ( Bounce in Gold) , then we should bounce and get a new high on the 2nd daily cycle. With an interest rate hike, I would expect this to roll over as a L.T. 2nd daily cycle, they have in the past ( More on that later in the report).
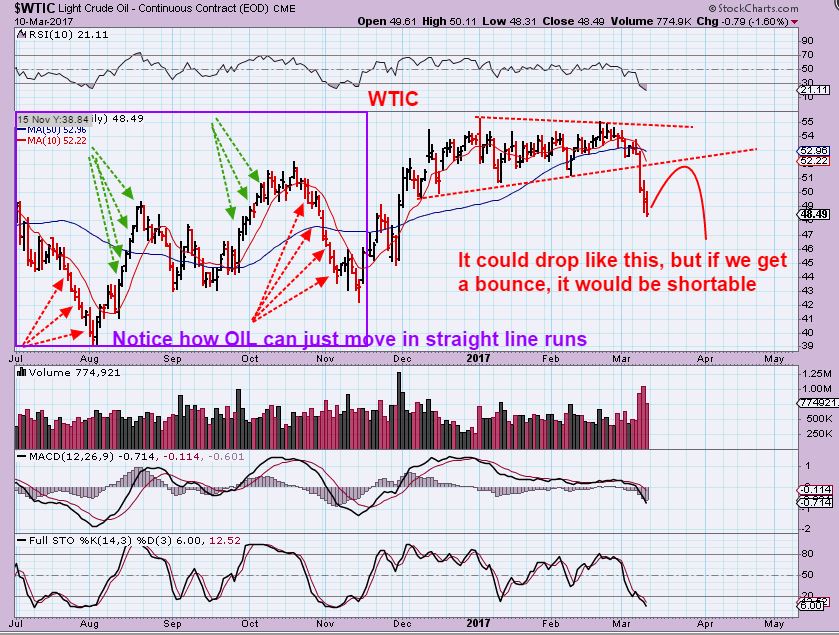
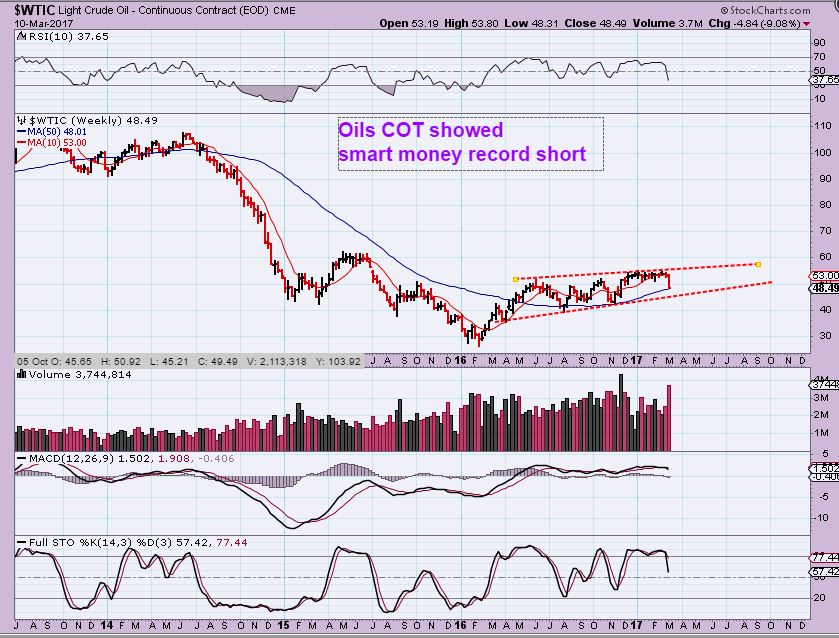
WTIC – Bearish. As mentioned in prior reports, I think Oil could drop a lot from the recent consolidation. IF WE GET AN A-B-C CORRECTION as shown, the next bounce can be shorted. Some use DWT, DRIP, SCO or other methods to trade Oil. I will discuss this if we get a bounce. Jumping in here is a bit risky, since it can bounce and our entry would be in a losing position for a while, but notice on the left of the chart how OIL sometimes does just move swiftly in 1 direction. That is Oils personality and this sell off could also just continue.
WTIC WEEKLY – Oil is dropping into an ICL, and this 50ma and even the triangle pattern can be broken. I can see $40 oil on this chart as attainable. Probable target(s) will become clearer in time.
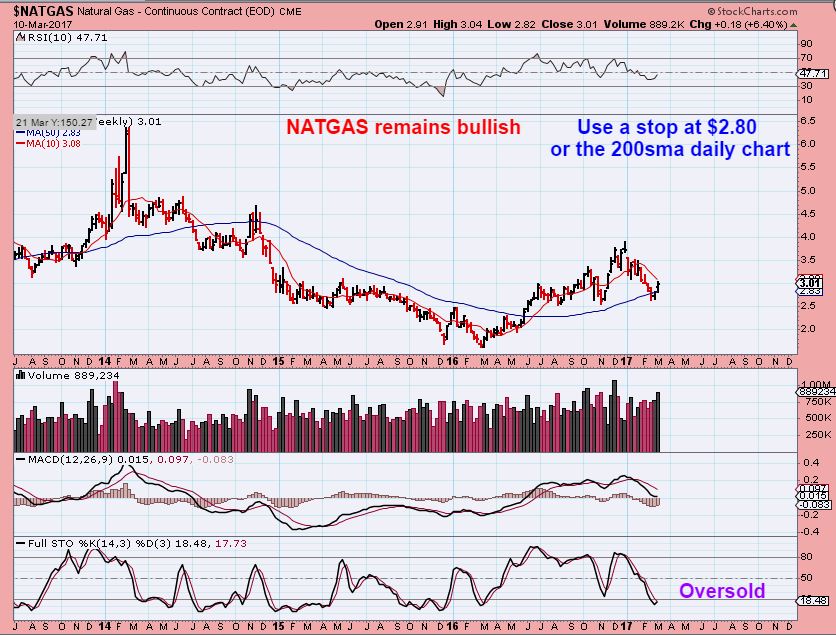
NATGAS WKLY – Bullish – read the chart.
GOLD, SILVER, & MINERS
This is where there are clearly 2 paths being formed. I see reasons to be Bullish with a possible interest rate hike and other things, but also reasons to lean bearish too. That bearish side would mean eventually dropping into the next ICL over time, and we still want to BUY that in a big way. When that time arrives, we at Chartfreak will be fully invested in Miners again.
So for the sake of this section, I hope to be CLEAR and let the charts and lines of reasoning speak for themselves. You will see bearish reasoning and Bullish reasoning. You will see at the end of this section that the Miners started looking bearish for some reasons, but could just as easily flip to bullish with an interest rate hike. I will try to do this in a short clear manner, Fact after Fact.
C.O.T. – FACT : This is more Bullish than bearish, with smart money not positioned as shorting Gold heavily and are even in the process of closing short positions.
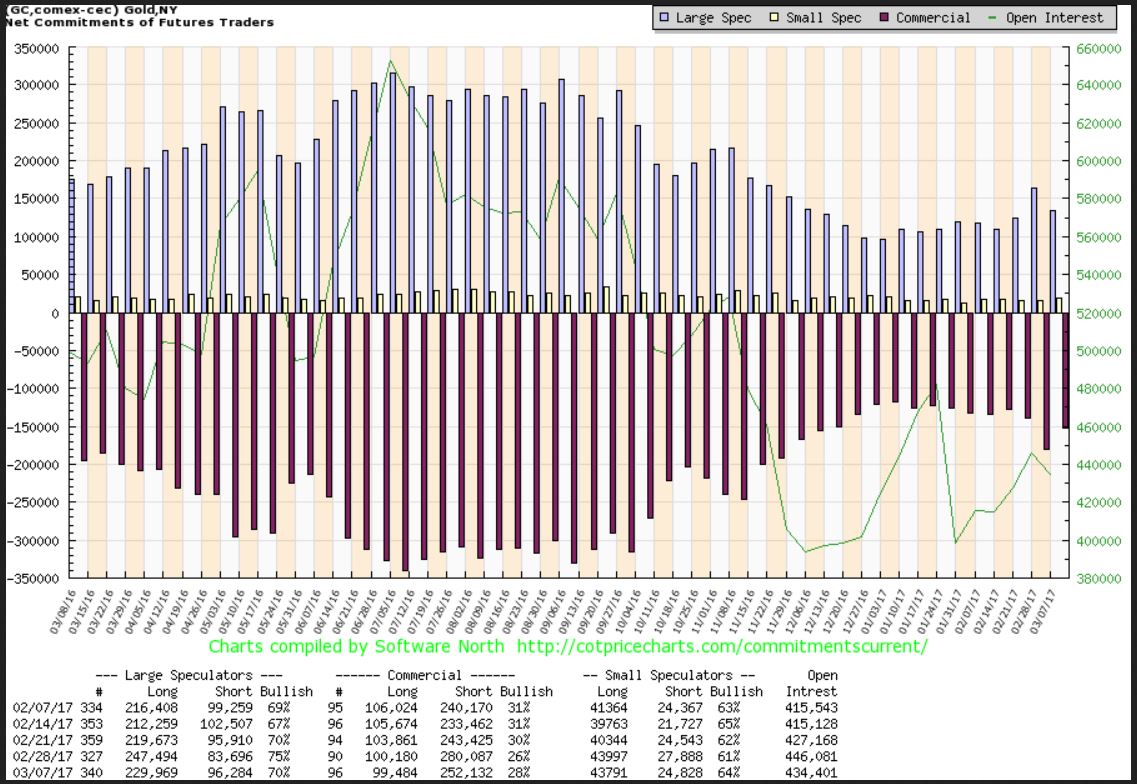
GOLD FOR THE COT CHART ABOVE – The Magenta arrow shows where Smart Money started closing shorts and next weeks COT report should show that that continued, since the selling continued. ISn’t that Bullish? Yes it could be.
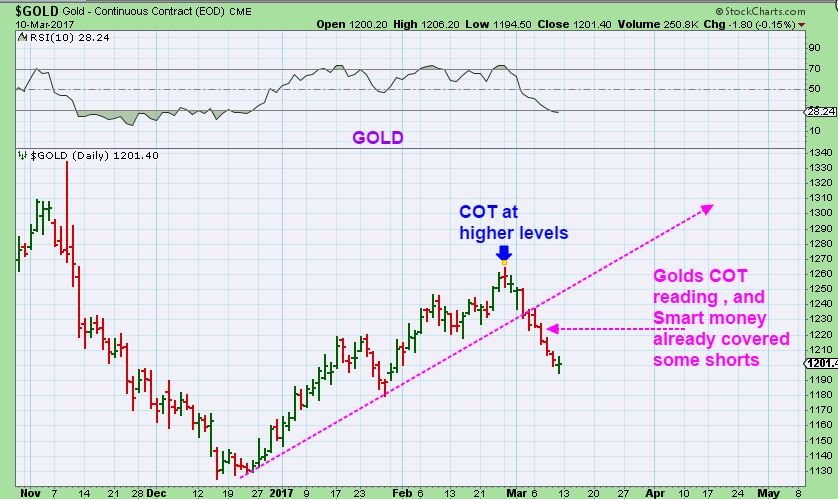
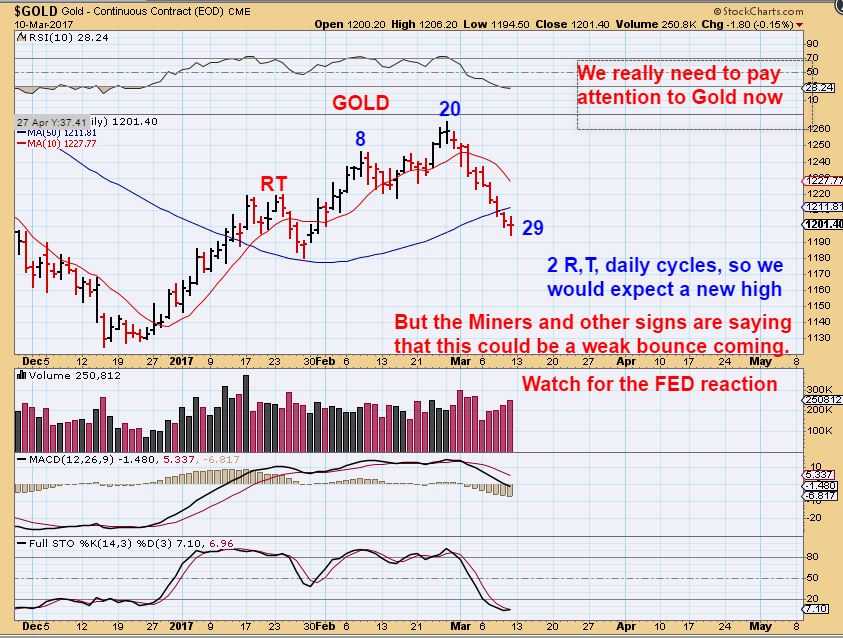
GOLD – Neutral, because it is bullish and bearish.
1. BULLISH : We are expecting a dcl and a bounce here. That is Bullish and with 2 R.T. Daily cycles & Gold oversold, one would normally expect a higher high on the 3rd daily cycle, plus smart money is closing short positions. An interest rate hike is expected, and that has been bullish for Gold too ( More on that later). So wouldn’t this be a bullish set up?
2. It is somewhat bearish with the RSI below 30 on a 2nd daily cycles low and Miners became far more bearish. Selling is now near the first dcl.
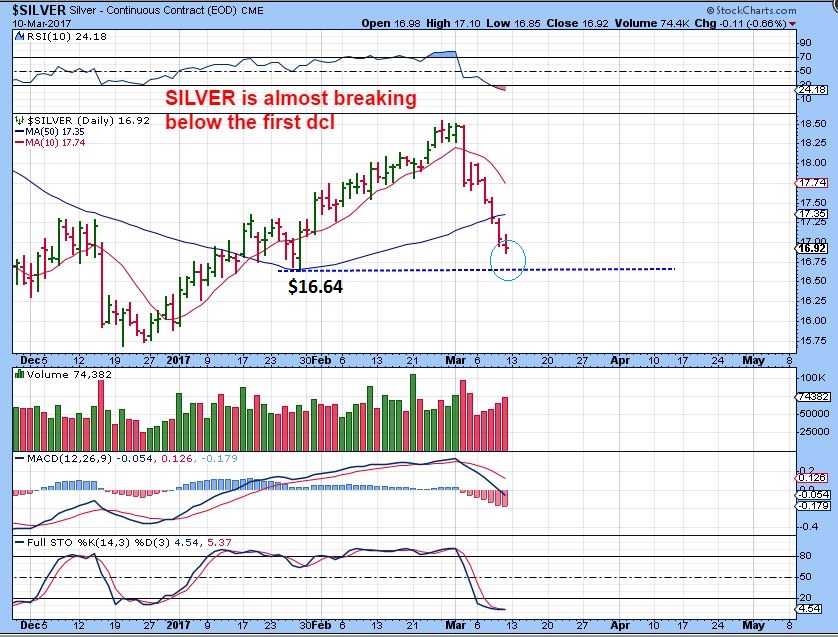
SILVER – Rather bearish to be breaking down this much into a 2nd dcl. A break below $16.64 is actually a ‘failure’.
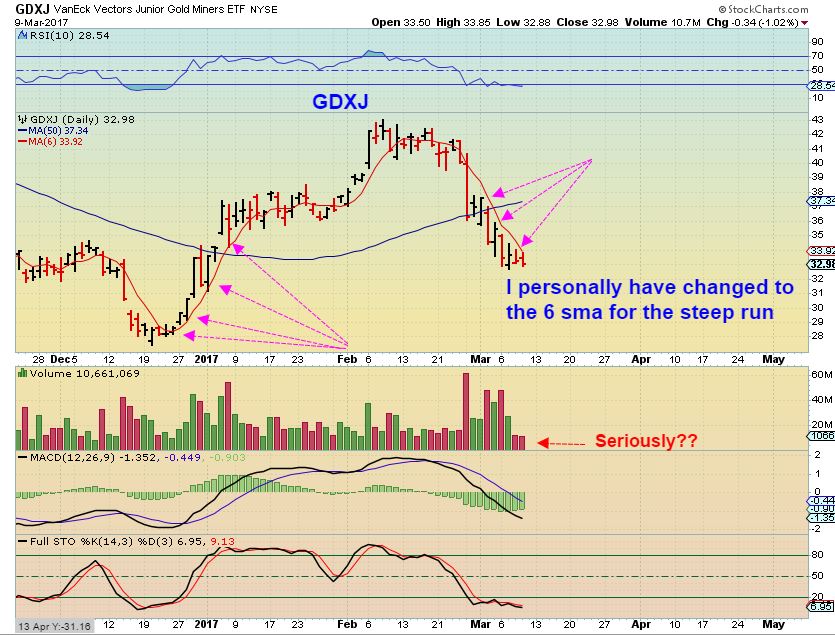
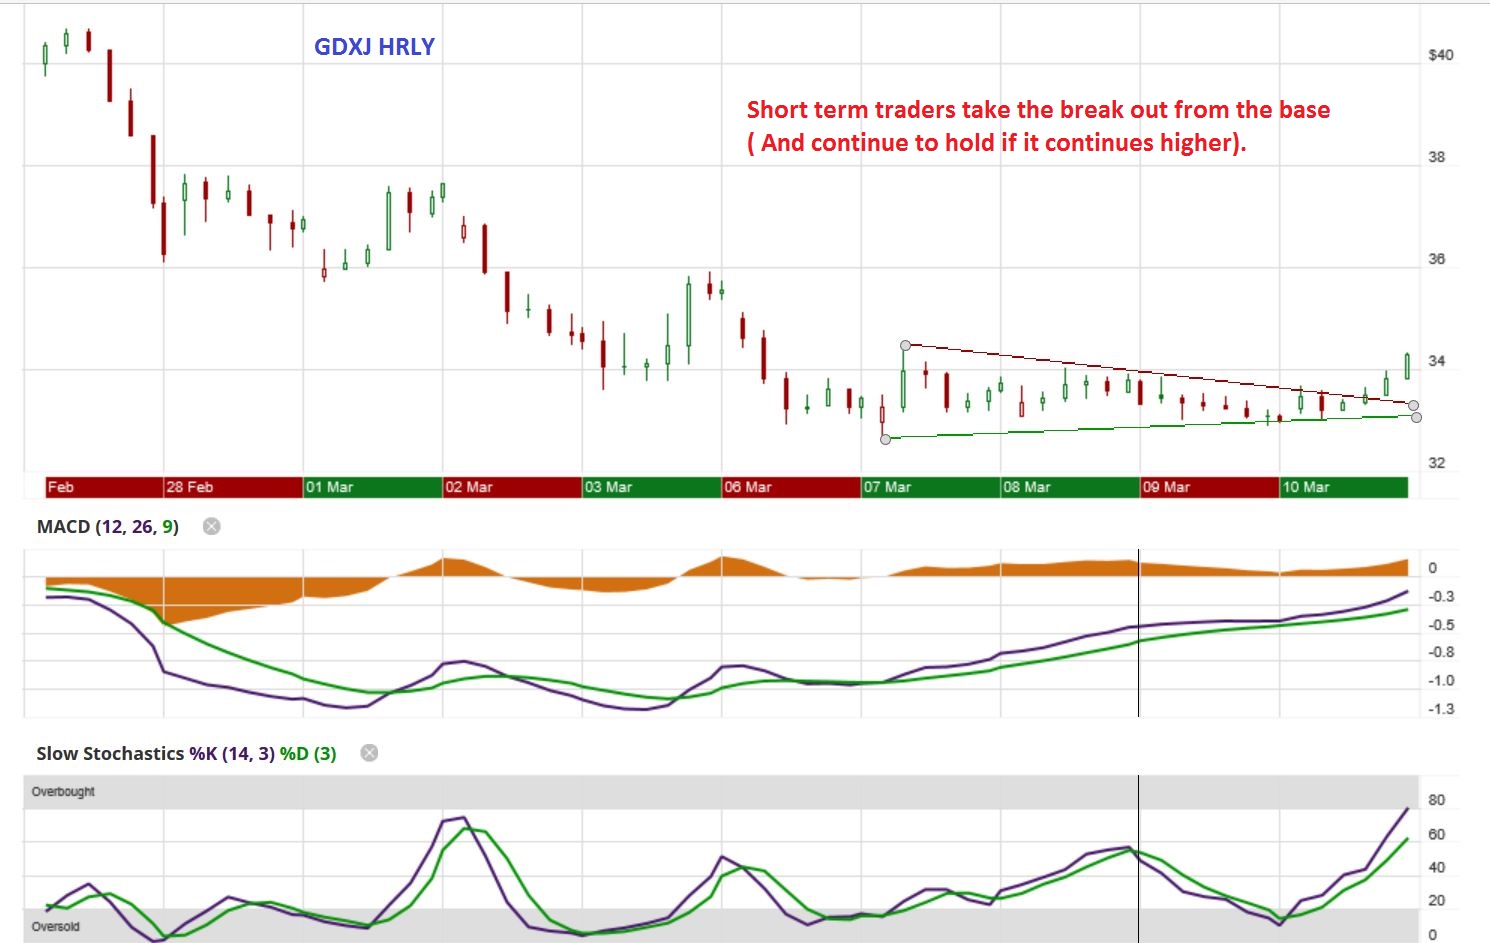
GDXJ – In Fridays report, I said that I would personally be watching for a move above the 6 sma to ‘buy’ into the expected bounce. I also mentioned that that bounce Could back test the 50sma, as we keep in mind that a Fed Decision is coming on Wed of this week.
So this was obviously ‘my buy’ based on that Friday reports thinking. I posted this in the comments at 3:14 p.m., the time stamp is on the chart. It isn’t too late for a quick trade if we are going to tag that 50sma as I expected. It is a trade possibility, not a guarantee 🙂
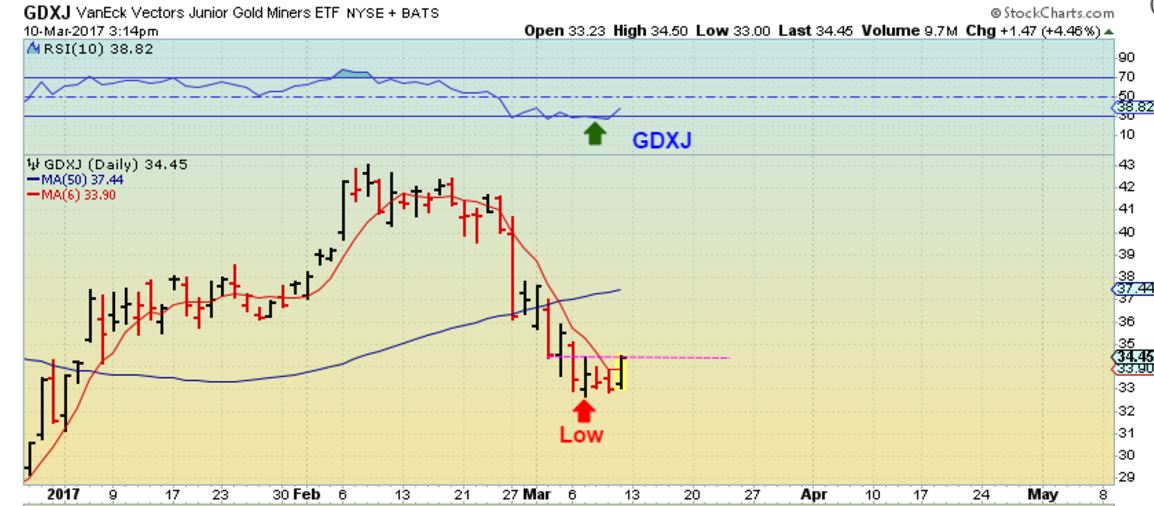
As an intraday trader- I was actually watching a smaller time frame, and was able to buy this pattern break out when it began on a 5 minute and 15 minute chart. GDXJ was at the $34.50 area. I posted this chart in the comments too.
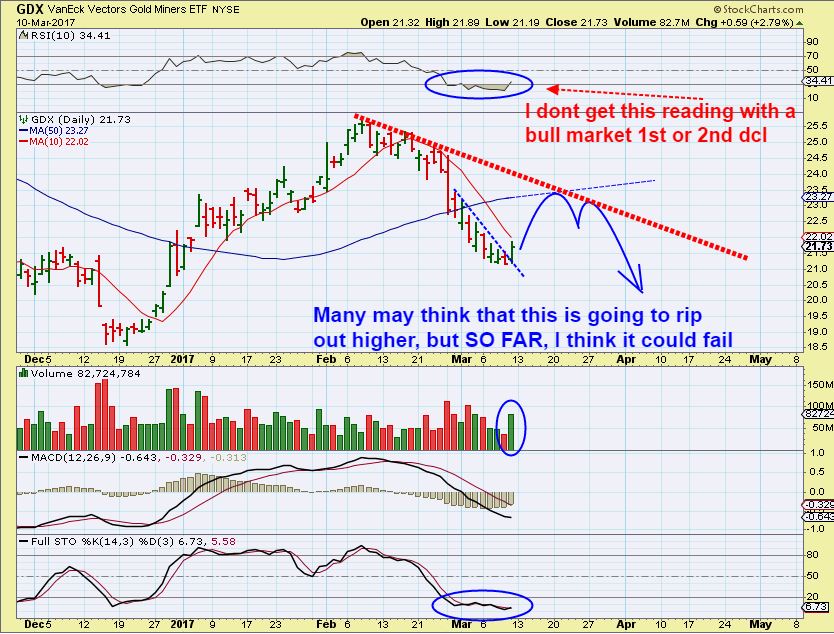
GDX #1 – GDX is oversold and ready to move higher short term BULLISH, but that RSI is abnormal for a BULL MARKET dcl – Bearish in the bigger picture. That RSI is at ICL levels, not 2nd dcl levels.
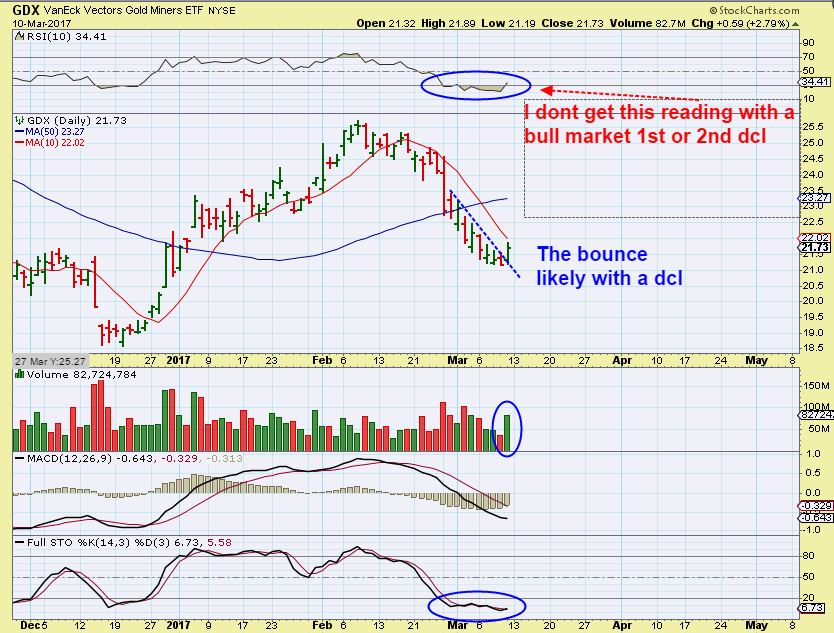
GDX #2 – So short term could be bullish, but is this the path to expect after a Fed decision? We need to be cautious if we are long going into the Fed Mtg. Make up your mind RIGHT NOW how you will be positioned going into WED afternoon at 2 P.M. Repeat, MAKE UP YOUR MIND NOW, before we get there. Play it safe or take a chance?
Remember when Gold looked Bullish above? Smart Money was closing short positions in the C.O.T., we had 2 R.T. Daily Cycles, etc. Now a bearish look has begun to show up like we are seeing with the Miners, let’s examine this.
NEAR TERM BEARISH VIEW EVEN WITH A BOUNCE THIS WEEK #1 : THIS IS GOLD NOW & IN BEAR MARKET SELL OFFs INTO AN ICL. They peak on the 2nd daily cycle as seen in 2014 & 2015 ( We dont get cute in the first 2 daily cycles to avoid losing positions, but the 3rd 4th and 5th daily cycle is not a BUY & HOLD situation). The drop into an ICL is always steep. Please study this chart and compare the 2 daily cycles now with the former bear market rallies shown. Now is Very similar to the bear market rallies and not the Jan 2016 – July 2016 rallies. Please read this Weekly chart.
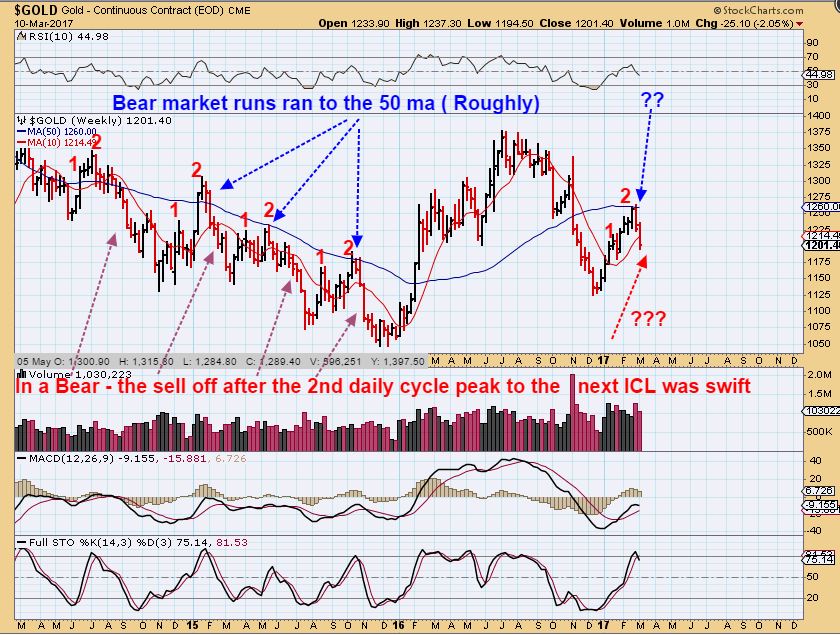
GOLD BEAR MARKET RALLY #2 – Please study the chart & the GREEN BOXES. You’ll see Daily cycle 1 peak, then a drop to the dcl, then daily cycle 2 peak, then a drop to the DCL – then a BOUNCE and drop. We are at the bounce …
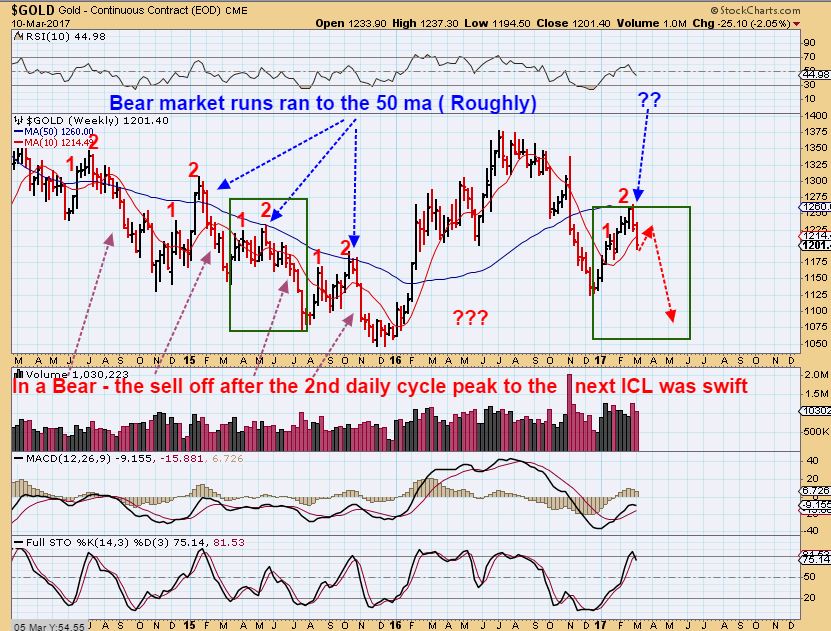
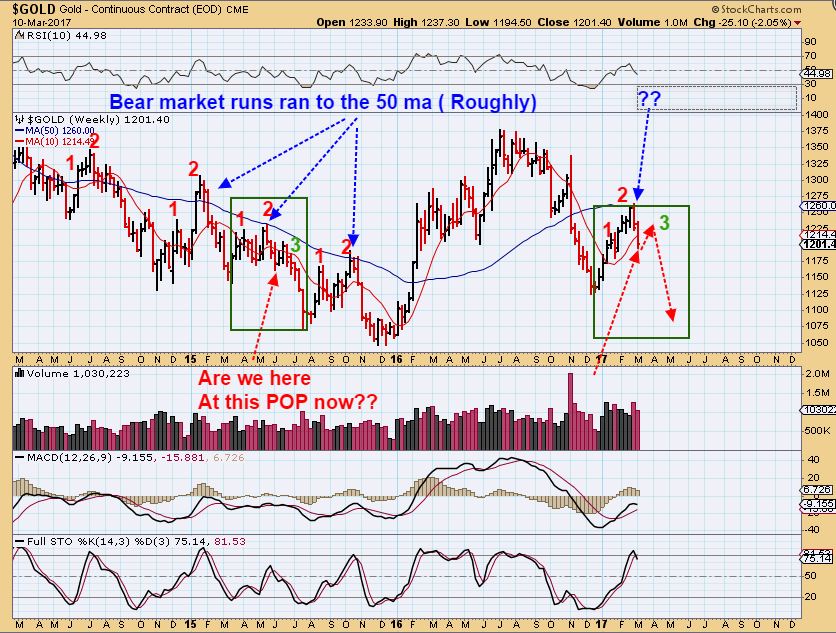
AGAIN for clarity the green box- Daily cycle 1 peak, then a drop to the dcl, then daily cycle 2 peak, then a drop to the DCL – short BOUNCE to 3 peak, and drop to ICL. We are at short bounce to 3, unless the rate hike changes things.
**IMPORTANT – Now that you can all clearly see the Bullish case with a bullish C.O.T., 2 RIGHT TRANSLATED DAILY CYCLES in Gold, etc. and also the bearish case with Weak Miners having similar characteristics to a Bear Market rally in the past, one final chart that really has me puzzled at this point in time. It is the FED RATE HIKE point in time.
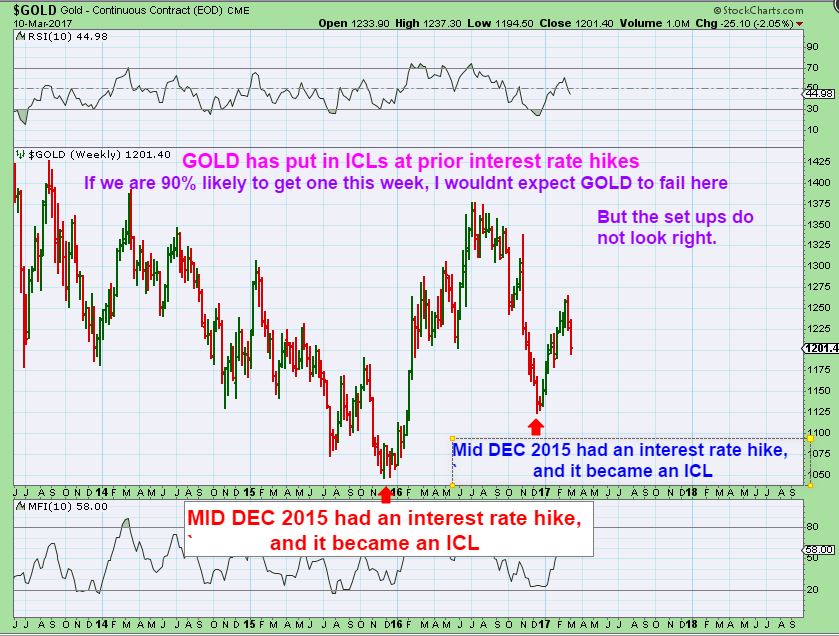
Studies are showing that there is a 95-100% chance that the FED raises rates this Wednesday. I did an in depth study in the past on interest rate hikes and the USD & GOLD, because so many people are saying that an interest rate hike is good for the USD and bad for Gold. My findings were the exact opposite. Interest rate hikes were very Bullish for GOLD, and the USD Popped initially, but then dropped a day or two later and began a long downtrend. So if it is 90+% chance that they ARE going to raise the rates Wednesday, why would it not be very Bullish for Gold and Bearish for the USD this time? THIS IS MY CONUNDRUM.
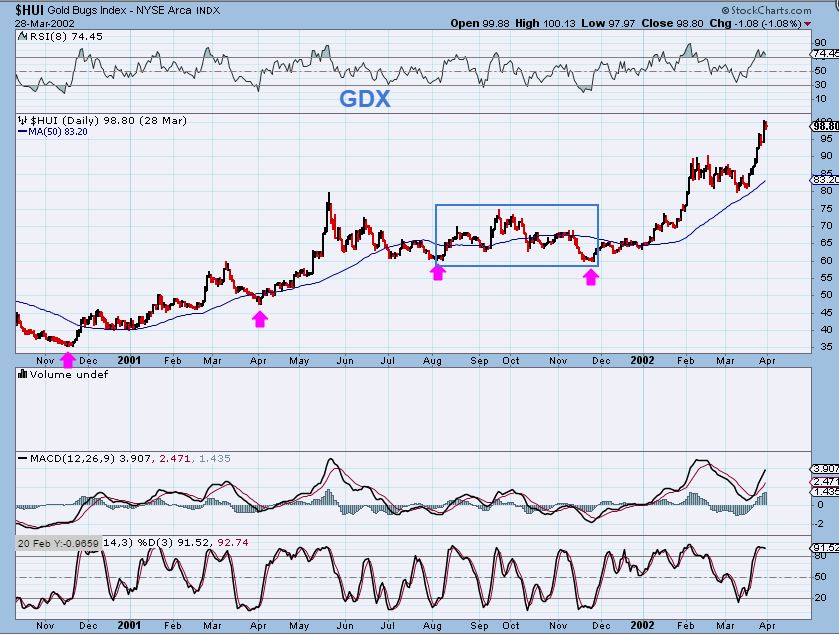
FOR EXAMPLE : You most likely remember the last 2 interest rate hikes were Dec 2015 & Dec 2016. THOSE were our ICL’s in GOLD. It marked The absolute Lows of heavy selling and a strong rally followed after the interest rates were hiked. Read the chart.
USD WEEKLY CHART – Rate hikes in Mid December 2015 & 2016. The dollar bounced sideways for a bit and trended downward for weeks shortly after. That is NOT a bullish trend for the USD after a rate hike.
Again, the set ups seem weaker than normal bull run set ups at this point in time (A second Daily cycle low on Gold), so Precious Metals seem weak and looks similar to a bear market rally. Then we see that Smart Money is not heavily short, we almost have a guarantee of an interest rate on the table for Wednesday which has been bullish for Precious metals in the past, and that seems bullish. Of course things will clear up after Wed, Thurs, and Friday of this week, and all we can do is trade the short term aware of the longer term possibilities. Like I said in the beginning of this report in a quote from a popular Led Zeppelin song, “There are 2 paths you can go by, but in the long run, there’s still time to change the road you’re on.”, or as I like to say, There is always another trade to take when things change. Thanks for being here at Chartfreak as we continue learning from the way these markets ebb & flow. Please read this report at least twice, there is a lot of information to take in here. Enjoy the rest of your weekend, we probably have a big week ahead of us. 🙂
~ALEX
REMINDER NOT TO BE OVERLY LONG-TERM BEARISH: A Sell off into an ICL can still be part of a larger ‘big picture consolidation’like we had in 2001. I have repeatedly pointed this out from the past in the following charts and others It does NOT necessarily flip this to a Long Term Bear Market in the Big picture.
And what I said I can see happening here now in this chart from today report…
Was already revealed here what I drew in this big picture chart last week.
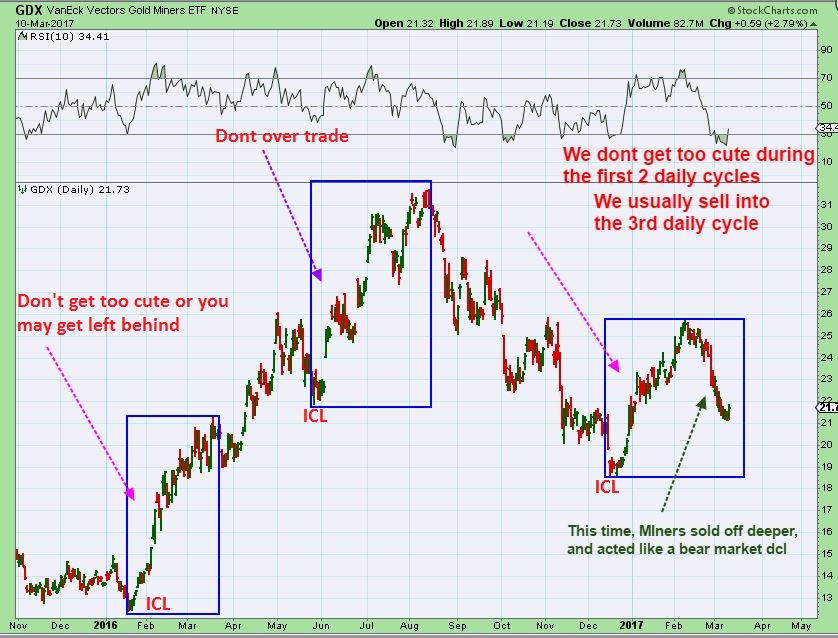
Finally: To clarify a possible misunderstanding of my declaration at the ICL “Not to get too cute” when it came to trading in & out of Miners out of those lows. When I said that it is best that ‘we dont get too cute’ in the first 2 daily cycles, and we dont want to overtrade our positions, because we could lose positions on a ramp up and get left behind, did I mean that we never sell again? No. It was also mentioned in reports through out that time that we often lighten up or sell into the 3rd daily cycle peak. Each of these first 3 daily cycles are expected to peak higher & higher in a BULL market. so…
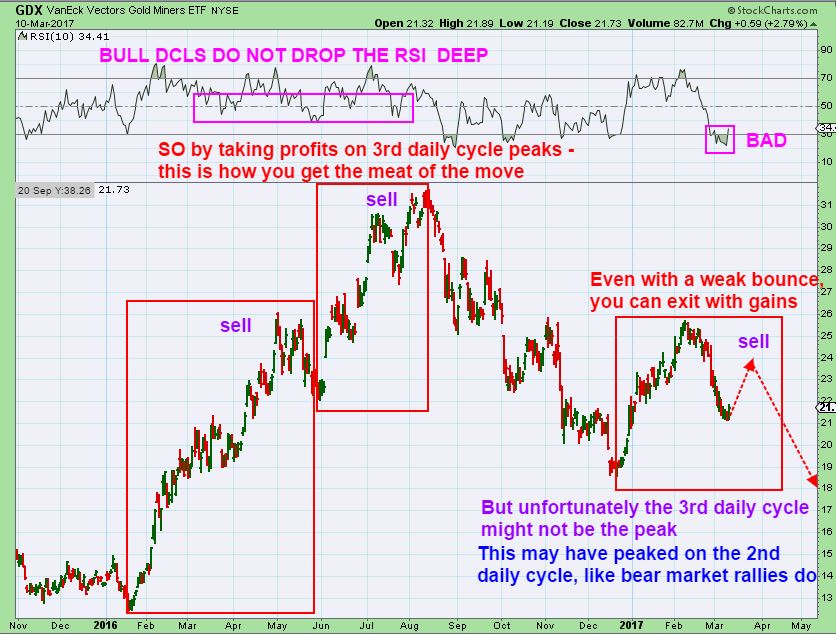
We say “Dont get too cute and over-trade positions in the first 2 or 3 daily cycles coming out of an ICL in bull market. The 3rd daily cycle is expected to ‘peak, so we WOULD sell the 3rd daily cycle in a normal bull run higher too.” At the start of the 3rd daily cycle ( day 8-13ish) is usually where one might start taking profit, because the first 2 daily cycles should be R.T. & the 3rd will be the peak. Over-trading those first 2 months out of an ICL can leave you behind at the lows if they ramp up, as seen here. See JAN ICL 2016, MAY ICL 2016 Dec – Feb 2016-2017. Unfortunately, This last one dipped much further than normal bull runs, but it IS still well above the Dec lows and due for a bounce in the 3rd daily cycle. Do we see how this could be the final chance to sell before dipping into an ICL over time. FED RATE HIKE is possibly a determining factor of how high this bounce does or does not run. Read the chart.
So that saying isn’t telling us ” Don’t get cute forever”, because that would be called BUY & HOLD forever. We dont do ‘BUY & HOLD’ on all positions and hold into an intermediate cycle low ( Unless it was a core position from the 2016 ICL).
Right now, the first 2 daily cycles really should have been R.T. in a BULL and they were for Gold, Miners acted weak toward the end. This run should have peaked on the 3rd daily cycle in a BULL RUN. On this recent run, the 2nd one peaked early for Miners, similar to what I see in Bear Market rallies. That is where my concerns come from. The 3rd daily cycle would be where you trade or sell some at a peak ( or all ) holdings, depending on how things unfold. Study the chart below and you will see all of what I just discussed here in action. Notice that with the SLAM DOWN DAY over a week ago in Miners, things seemed to change character from the 2016 ICL runs.
Look at those 3 daily cycle runs higher in 2016. Great trades that we took advantage of. This run was great too, it really is when you look at it, but the selling took on a new deeper character, and that RSI is not right. Thus my concern.
In any case, it is NEVER buy & hold forever in the sell off down to an ICL’ ( starting with the end of a 3rd daily cycle 4th daily cycle possible 5th daily cycle. ) unless you are holding core positions from the ICL. To be clear, if it is not part of your core position from near the 2016 ICL, We dont hang on in a sell off into an ICL, because they get very deep at times.
Friday March 10th 
 Tuesday 5-14-2017
Scroll to top

“When you come to a fork in the road, take it” Yogi Berra.
I took the fork, now hopefully I dont get the knife in the back with it
:… oohhh… it makes me wonder ….” ;o)
Exactly 🙂
Friends did you get some silver?
Did you get a little gold?
…. I couldn’t get no silver, I couldn’t get no gold
You know that we’re too damn poor ……………
But you warmed my soul!
If you choose not to decide you still have made a choice.
You can choose from phantom fears and kindness that can kill.
I will choose a path that’s clear. I will choose free will.
What a RUSH
😉
Come on man, wrong group. You Geddy Play by the rules.
You got to lose to know how to win
Alex, I have a note that the 17th is “quad witching”..how might that impact things?
Could add higher volume and volatility. Friday is about 4 years off for me right now. 🙂
Wednesday is my next biggest thought.
Hey, You added a pic of the artist at work, Very nice 🙂
I just found out how…but hadn’t tested it yet..thanks for noticing…I will test it now…..I see it did work.
Alex, what do you think of the large SOS numbers for GDX on Friday ($642m, 2nd in the list!). Would we expect that on Day 1 of a new daily cycle, or is that quite normal?
http://www.wsj.com/mdc/public/page/2_3022-mflppg-moneyflow.html
There were several large bow numbers on way down that were very large. I don’t find these particularly helpful as timing tools but maybe other people have better input here?
Hey Dialogue
I dont follow it closely enough to have ant historical input on it.
It often flips back and forth in the very short term ( even day to day).
Thanks, Alex.
Tough spot
Hi Alex: assuming we breakdown at say round 24 GDX and make new 2017 lows from there, where do you expect GDX to run (or what path do you expect GDX to take) after the next ICL in around May?
That would have to be determined later, because this could be a bear market period of time , still within a bull market, or it could be a slight undercut shake out below Dec 2016. It would be a break of the 62% fib level, it could also drop to 2016 lows, but I do not expect that.
I have ideas , and I have pointed a few out in past weekend reports, but again it would depend on if we are doing a normal W pattern, double bottom pattern, or something different.
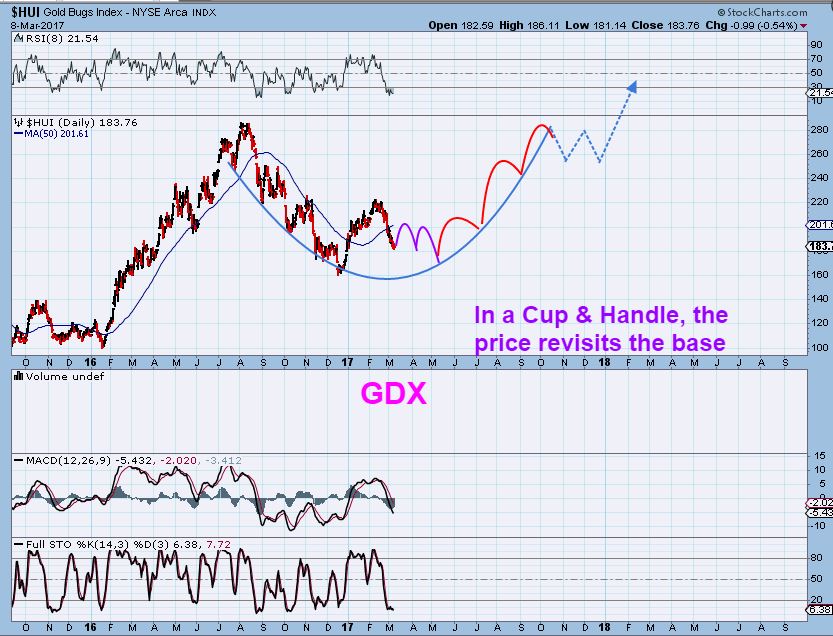
Scroll up to the charts that I posted after I signed my name. The giant cup & handle idea would have huge bullish expectations over time.
Do you see the first chart showing the 2001-2002 double bottom in HUI- that second bottom in November below August lows slightly undercut the prior low and that was it. That was early in the bull run, and no one would have been able to say that HUI right there at $60 was going to be $625 down the road, but it did.
Thanks Alex. I knew that was close to impossible to determine at this point-just looking for your gut:). I appreciate even a gut feel may be premature. I’ve been studying the 2000-2002 structure along with that of 2004-2005. There has never been (to my knowledge) a bottom and subsequent move in the PMs similar to what we’ve experienced in 2016. From limited research, closet was the DOW 1932-33 and maybe corn (can’t remember the year). Using those prior patterns, they eventually broke out strong I suppose when most we not expecting it like the PMs in 2016. In the case of the DOW, after the initial powerful move from the low in 1932 (which would equate to the equally powerful move off the low in January 2016) the DOW retraced most of that move (similar to what we are experiencing in the gold shares now) but then in 1933 moved above the previous high in a matter on of months.
Yes, I’ve found similar cases, and it really is odd when you look at the charts. They look perfectly fine after they rip higher , but you look at the double bottoms and retest of the lows after such a strong run and it is puzzling as to why that would happen. I’d like to see us hold the 2017 lows personally, or even a small undercut and then a recovery as an ICL would be easily identified. As always, time will tell, and then we’ll probably better be in a position to see why it played out that way.
Alex- I will say people are mostly afraid of miners now and being cautious for good reason.. I think continued post hike positive behavior would leave many behind Bc many are scared to be long here. I also think many are short. That being said I have very little left and will wait for the next icl as I gave way to much back and don’t love this setup. I hope I didn’t become a victim of this setup and sentiment esp if rsi gets above 50 I will be kissed as prob means I got scared off.
The ICL is the place that you will easily make the most money, and I think that any chance of this being an ICL is almost next to “no chance”, so you are the best approach for you, and it will pay off. I cant ever recall seeing an ICL quicker than 4 months apart and often 5 or 6 months is the norm. We are at 3 months right now.
I like to trade in and out of good set ups, and I find that I still never make easier money than when I am at an ICL ( Even if I get stopped out a couple of times before the lows are confirmed- the gains erase all mistakes and become solid ) . Even ‘good’ set ups can fail in the 4th daily cycle, but in the move out of an ICL , even in a bear market, you can make good money.
Your decision to ‘wait and see’ can feel like your missing out on something in real time, but a lot of times, you give gains back in a 3rd or 4th daily cycle with quick drops. Like that surprise SLAM DOWN Monday that we had in Miners for no apparent reason. Waiting for the ICL will still make you good money in the future. 🙂
Alex, noticed you used RSI=10. On previous ones you have varied it to 14 and possibly even 8 one time (though can’t remember). When do you decide to change it? Is it when you’re looking closer to the end of an ICL or is it for other reasons? Thx
Hi Deshy
Good catch : ) I actually do change it often for various time frame, but usually by the time I ‘Capture the chart’ and put it in my report, I usually do change it back to standard 14.
I use it at times to get a better ‘feel’ for the shorter term move ( The divergence shows up quicker, but you also need to remember that you’ve changed it to a quicker . I use 5 , 7 or 8 , 10 , 14 , etc and do so on a weekly chart too.
Thanks. This site always helps to keep learning 🙂
Going through Alex’s material, I come away with the feeling I should be adding like crazy to my miners, even if that is not his message or conclusion. To me, his downside seems limited even in the bearish scenario, and unless the bear market returns in earnest, I can live with GDX testing the $20 area as it’s only 5-7% lower, in exchange for all the potential upside.
Perhaps the rate hike sends stocks into a tizzy, dragging gold and miners down for a day or two along with it, before GDX turns higher? In any case, I’m buying weakness in miners heavily, and if they see strength this week instead, I am still going to add to positions but with smaller buys. I think we’re going higher even if we go lower initially.
As long as you understand that cycle-wise, there is a strong possibility that we get a 3rd daily cycle bounce ( lets guess that it takes GDX up to the 50sma) and it eventually sells off into a lower low that where we are now, into the next dcl or future ICL as a lower low .
It doesn’t sound like you mean leverage, so that is good, noone wants to hold leverage down into a lower low.
I use my own charting system that I have developed myself over the past few years. I’ve been sitting in cash since February 24th when I sold all my miner positions. At that time I was pretty much “all in” in JNUG and I sold between $10.50 and $11 because my longer term charts were turning bearish. I had not planned to get back into miners for a few weeks or months, but last Friday I was on the road during market hours driving from Seattle to Vancouver, WA and I noticed that JNUG had turned green and was up about 5-6% so I checked my charts on my iPhone (not easy to do) and I saw that my daily chart of JNUG had a few bullish “buy” signals so I bot JNUG in all of my accounts (trading + 4 retirement accounts)10% invested per account. Now for ME, that is a “small” position. Previously, I was 80-90% in JNUG! The reason I trade JNUG right now is because I personally believe that PM’s are still in a long-term bear trend from the 2011 top and that the stock market will be the place to be for the next 8-10 years. But as Alex has pointed out, you can still get a strong “bounce” in a bear market so that’s what I’m playing. I use highly leveraged trades to get in and get out of swing trades which will last days to weeks, depending on how my charts look. If we get continuation on Monday, I will load up on more JNUG. For me, the key is to load up HEAVY near the “bottom” after I get a buy signal rather than gradually adding over time. I hope to cash in on a quick bounce in PM’s and then go back to cash, I’m not holding any miner positions long term. I may be totally out by Wed, depending on the Fed “news.” I’m NOT recommending anyone follow me, just saying what I am doing. I just want to point out that MY chart signals, which are totally different from Alex’s charts, are currently short-term bullish for PM’s. IMO this may be a good SHORT-term buying opp for miners when I add my perspective to Alex’s charts, so take that for whatever it’s worth. FOLLOW ALEX, check your own charts and make your own trades. As for the longer term, I have no idea where PM’s might be going. I’m personally waiting/looking for a good entry point to get back into TQQQ which has refused to give me a dip into a really safe “buying opp” since the election.
Hi Steve,
Since you posted certain information here publicly in the past, I thought I would ask a question where I am confused.
I either missed something or am remembering it wrong.
So I could be wrong, but I thought that a lot of the readers were asking about your “Daily buy signal” verses your fast changing 15 minute buy and sell, that flips on & off during a day.
When asked, I thought that you said that your daily buy signal was simply a 9 ema that has to cross up over the 10sma ( or something like that) on the daily chart, and you said that it never gets you in at a bottom, because it is a slower safer method. It usually gets you in around 3 days off the lows.
Obviously, I must be wrong, because there is no way that one day pop Friday out of a steep sell off would have triggered a moving average cross intraday on a daily chart. So to help the readers here, you could tell me what I am saying wrong here. Thanks.
I don’t understand why Steve should have to divulge his methods. He is kind enough to share when they change. Folks on this site are sharp enough to decide if they want to follow his lead or not.
Gary, I don’t know why we can’t all share our BUY/SELL systems? Its a fairly small group here, I don’t expect anyone has any sophisticated trading algorithms that are really proprietary! Anyway, I am willing to exchange, if asked. I understand not everyone feels the same way.
Heck, Alex doesn’t share all of his indicators. He has stated that he has some that are extremely reliable, but I am happy to trust him if he says that one of his extremely reliable indicators flashes a buy or sell signal. We all have our methods and may have some that are unique. I recently shared some of mine publicly and privately. But it doesn’t bother me that others don’t share theirs.
True enough Gary. You have been very supportive and sharing, others not so much
Steve is an old friend of mine, and he shared it here before. If you read what I wrote, he had an open discussion about it before, I’m not asking him to share proprietary info.
I was asking HIM if he wanted to repeat it….emphasis on hoping to hear from HIM. 🙂
I remember him from Bull/Bear. Don’t remember you from there…..
I’ve known Steve for probably 10 years or more
To me, Alex has always been “The Mater” when it comes to trading (see my quote on the home page of ChartFreak). I tried to talk Alex into doing a paid trading service many years ago because I knew he would be an awesome teacher, but he turned me down. 🙁 Fortunately another trading friend of ours finally talked Alex into it and now you all get to benefit from Alex’s wisdom here on ChartFreak!
Does this look familiar Bill?
https://uploads.disquscdn.com/images/a9ce6b5cf4de04d0093284aad18ff023780857a1f67cd2ef9faa2734e256eda0.jpg
Yes, of course!
I think Steve does use the 9/10 averages. Must be on a shorter time frame to get the BUY signal.
Alex, I will try to explain, but I’m not as good as you at explaining charts because mine are very cluttered with multiple MA’s and other signals. I can tell you what signals I saw on my daily chart of JNUG to cause me to buy on Friday and add very heavy after the open today. Last Friday, the 5 EMA formed a “V” bottom and angled up. That’s a good early warning sign. That sign was confirmed by MACD improving. TSI (7,4,7) had a bullish cross up (this is one of my favorite signals) and the RSI 5 had a bullish cross up over its 10 EMA. Those are the primary factors that caused me to buy a starter position in JNUG last Friday. If I was a true
“bottom hunter” I would have bot very heavy last Friday. But I wanted to wait for today to see if I would get more confirmation on my daily chart. Today the 5 EMA continued to angle up fairly sharply. The ANGLE of the MA’s is very important to me, not just the raw numbers. When I see MA’s angled up or down sharply I consider that as a “strong” signal. When the market trades sideways and chops up and down, my “trend following” system does not work because there is not “trend” to follow. That’s why I like to wait for a deep slam down and then buy the reverse because there is likely to be a good bounce at the very least. Getting back to today’s action on the daily chart of JNUG, I got a bullish cross of the 9 EMA (bending up) over the 10 SMA which I consider to be a “final confirmation” of a price trend change. So you can see there are a lot of moving parts and I can’t point to ONE thing that tells me when to buy. It’s a combination of following charts for a few years and coming up with a system that works for ME. I learned a lot of lessons the “hard way” and I’ve only recently felt like I have a workable system. So I watch Alex’s charts and commentary and when his outlook matches mine fairly closely I feel very confident to go long. As you can see, I’m a couple days “late” because JNUG bottomed the middle of last week. But I feel I am well positioned to catch most of a strong bounce in JNUG. I use short-term charts like 15-min and shorter to look for entry points … that’s why I loaded up heavy in the first 15 minutes of trading today rather than waiting until later in the day. And I use the daily chart to determine if I have a “trend” going that I stay in for awhile. As I posted yesterday, I’m perfectly willing to sell and go back to cash on Wednesday if that’s what my charts tell me in the wake of the Fed “news.” I hope this makes some sense. It’s not my intention to try and teach others how I read chart, I’m only posting to give a “heads up” when I see a strong “buy” or “sell” on my charts so that others can check their own charts and make their own trading decisions. Keep in mind that the P&F chart of JNUG still has a bearish price target of $0!
http://stockcharts.com/freecharts/pnf.php?c=JNUG,PHTADANRBO
I watch that to keep me “honest.” Personally, I expect to see that chart flip bullish pretty soon.
Nice , Thanks for sharing, because you actually discussed it with some others on here ( I’m thinking that it was over a month ago, but it may have been after hrs and I missed it ) by discussing your daily buy MA cross, and I had someone email me and ask me if you were discussing a 1 day buy & hold, or 2? or 3?
They cannot post here during the day from work, because somehow their work blocks them from commenting here ( The way I understand it. Either that or they just arent allowed to post a comment during work hours).
Your answer above should be helpful.
As for Wednesday, I am thinking of this as a quick scalp trade out of the lows and see what happens with the Fed Mtg too, back to increased cash.
Amazing detail. Excellent Alex!
Thanks Jeff
Figures. Gold looked strong and sells off into the open as usual. So, I’ve been saying that one of the “tells” on the recent ICL is that some of the micro-cap miners failed to participate – like AUMN, TTC just never cared there was a rally. Doesn’t mean none of them did, but some were really sucking. The second is while gold had a solid rally in terms of absolute days up, and the chart was solid through 2 weeks ago, it never has that “big day”. JNUG had a few huge days early; gold never did. Real bullish excitement being at the lows should have incited a bit more buying. Still a great opportunity if you nailed the lows. But overall, certainly a dissapointment.
I have been loading up HEAVY on JNUG this morning. Don’t follow me, risky trade, just posting for info purposes only.
Too late, had already bought more myself!
NAK. Another pro article @ Seeking Alpha by Courage & Conviction
A lot to think about in the report again Alex, thanks for transferring your head ache as only you can do. I’m thinking towards sitting still, wake me up when it’s time to short, otherwise the next ICL will work just fine.
I can’t imagine how much work & thinking went in to this report, thanks again!
Thank You Crawdaddy –
At times like this, I just feel the need to think of as many possibilities as I can, based on history and patterns.
The hard part is that there is compelling evidence for both Bullish and Bearish movement over the next few weeks.
The COT is not alarming at all, but the recent action in Miners has been a bit noteworthy.
We’ll figure it out, and like you said, Maybe it becomes a dust play for some? A wait for the next ICL play for others in this sector? There will be plenty of trades & money to be made when the sectors clarify their pathways. 🙂
I never catch the “bottom” like Alex and other good traders here, but once I see that a bottom is in and MY charting system shows that the price trend has turned UP, I go in very heavy because I want to be “all in” at the lowest average cost possible. With JNUG currently under $7 if it merely goes back up to its 50 day MA a little under $9 I will make more than 25%.
That’s what I was looking at…if GDXJ tags the 50sma…what is the risk reward, and the reward was plenty good enough for the low risk of being stopped out after Fridays reversal
MUX looking splendid the last two days!
Finally!
Very nice Friday and today.
XRA recovered too…it looks like a shake out quickly dipping under the 200sma ( For just a day) and back to the highs again.
MUXIE!!
IPI walmost back to the 200 day MA. Any thoughts, Alex?
I forgot about IPI- It did just land on the 200 sma and seems to be supported there. Oversold too, so I would think that buying it here with a stop a little below the 200sma would be safe.
HUGE volume in JNUG today, 35 million shares in the first hour of trading! JNUG has certainly become the PM traders’ favorite ETF. NUGT has only 12 million shares traded.
Look at the difference btw GDX/J and JNUG/NUGT today. That’s just nuts. GDX has very badly lagged GDXJ this intermediate cycle. That has to be part of the driving factor!
Yeah, that’s why I usually pick the “best” ETF and go “all in” in it rather than trying to play individual miners or other ETF’s like NUGT. The major miners are struggling with massive debt. The smaller guys are more nimble and are not drowning in debt.
RXII finally breaking above .83 and moving with some Vol.
XRA back to 1.19
not bad for a monday
Crude Oil is getting interesting again….imo….atleast a bounce higher short term ? CF?
Watching Closely:
AXAS
PACD
QEP
All trying to bottom…..
I’m not trading anything ‘Oil’ – but I would love a bounce to short
Oil is due for an ICL though correct ?
Yes
I think I will be “playing” this ICL……fwiw. 🙂
Another bullish sign for miners is the GDX:GLD ratio which has been falling steeply since Feb 8. The ratio has reversed and has now been rising for 2 days in a row. Notice that GLD is slightly red right now while JNUG is up more than 12%
Since I trade stocks other than golds and my chart only has so much space for my indicators, I watch GDX:SDS instead. It is amazing how well that also works with golds. It is also amazing to me how radically different JNUG and NUGT are today. Thanks for your posts.
Thanks for the tip on GDX:SDS I will add that to my (long) list of charts.
My guess is GDX:GLD is best for gold, but if you trade others, SDS works well.
What does that mean, GDX:SDS?
Relative strength.
SDS is an indicator?
SDS is a leveraged inverse for the S&P 500. SSO is a leveraged ETF correlated with the S&P.
XRA making new highs here
The XRA chart looks like “what we were expecting for GDX”. It has 2 DCL’s and is now making new highs in its third daily cycle.
Exactly! 2 dcls, and a 3rd that may be the peak. It is acting correctly for some reason.
And also take a look at TKRFF – they appear to be a few of the rare ones that remained bullish overall.
GPL is pushing back above the 50sma, and if it speeds up, maybe it and a few others will make a peak on the 3rd daily cycle too.
Hi,
Does anyone know why AG is lagging? News?
thx
I dont see any new news
Seems like most of the silvers are lagging, e.g. HL, CDE, SLW looks a little stronger.
Possibly play catch-up now?
thx guys…hopefully will play catch up by tomorrow..
AG – Looks like a perfect gap fill from Friday morning. Thursday close was $7.50. Friday low was $7.58. Today’s low was $7.50. Gap filled. Unpleasant.
Hopefully that’s it.
TKRFF is still working it’s way up. Lookin’ good. Wish I had used a smarter stop in UGAZ and was still in the trade. But waiting on PMs to re-enter in earnest.
Bill ( And anyone else in New England or N.Y. / N.J.) – possibility that we are going to lose power into Fed Wednesday with this blizzard coming in Tuesday into Tuesday night.
Even with a generator, I dont have internet, so we may need to plan accordingly for that one.
that actually just happened to me…. lost power and internet… i had to actually dial my cell and call my broker…
#OLDSCHOOL
Yeah, I was thinking that I may still have internet on my phone & I can tether it to my laptop if I need to, but I’m not sure that everyone can use their phones that way, and without a generator, eventually the phone dies and the laptop wont work for long on battery anyway. Also some may not want to trade using their cell wifi , so just thinking about it ahead of time may help.
I’ll have to decide what to do Tuesday morning about current positions. : (
…i did have ‘weak’ cell service – it was bogged down & spotty
AT&T service is terrible in the rural area. I had bad signal in my house, and have to go outside.
I feel your pain – I house sat / pet sat for a friend a few weeks ago and she had the same thing going on. Lives in the woods and Internet and cell service was lagging and off and on
I tried to work from there & had to just travel back & forth
Even my txts would take minutes before they’d send. now I know why they say that it is ‘painfully ‘ slow
Gold sold off overnight and is up only $1…but it actually looks like it may be ready to play catch up right now
cha cha cha cheeetah … CMCM wow
Yeah, Remember trading that one in 2014 and 2015. That was one of my favorite runners.
Nice move the last 2 days ( I didnt even see it till you mentioned it).
yes….
Some “other” cycle analysis are claiming This low in the Miners as an ICL……I am not seeing that imo. …. any way possible CF ?
Anything is possible, but certainly not likely.
Some have asked if it could be one long daily cycle and this will be the 2nd and break the highs.
That would be one HUGE daily cycle, so I dont think that that is likely either, and these are just based on historical precedence .
is everybody gonna get the bull goggles on now, and not sell into the bounce…?
I was wondering the same thing…..?
Good call SOG – I was wondering that too, because it is so easy to do.
That slam down Monday had a lot of pain in the comments section, but you get a few nice days higher and it feels so right – lol
I just checked the 30 min chart and don’t see any sells yet. I am not in either. 🙁
Gman.. i got a 5min trading sell on JNUG at 7.02.. so i sold there.
im trading in & out.. so i dont get caught in any big down swing.
safety first.
No goggles here, aye? : )
call me Mr Frosty… until we get above the bullish side of the MAs 🙂
purely trading JNUG on a tight indicator.. no letting it ‘run’ whilst we are in this territory
I hear ya. I’m hoping for another 20% day if GOLD would get moving higher. A couple of those in a row would be plenty to allow me to step to the sidelines and let Yellen do her thing 🙂
i was over 20% up in JNUG so i figured to book a few profits… still in GDXJ & GDX.
hopefully buy back JNUG at lower levels, but im quite prepared to buy breakouts at higher prices than i sold.
A Man with a plan , as they say
currently working on simple principle that, whilst we are below the thick brown-grey JNUG danger snake, we are in territory that is susceptible to drops.
above thick snake , and i’ll be a happier buyer.
btw.. snake is merely the 4hourly 65ema, with env chn adjusted to the peaks of the bear move last year
https://uploads.disquscdn.com/images/6459322d36694f2a36aa60148cedb87907bbc7188978441bc36ed4603deeabd9.jpg
danger snake? LOL
oh man…. i need another vacation .. all i see is ………………………………………………
LoL is this like another Rorschach test for you.. like your hot tub wood-grain patterns?
what is it exactly that you see? 🙂
nice sog…. ;o)
yes please …
I had 5 min sells at 10:35 and 11:45, but it hasn’t died yet. I thought the 30 min was pretty fast for most.
Maybe Wed. morning…..
Haven’t decided on my individual miners? If we only get a quick slam, I’d hate to take a loss on miners that were WAY in the green just a few weeks ago. 🙁
I’ll be selling JNUG prior and likely taking out a hedge.
Over the weekend I was playing around with weekly charts and trend lines. Although this chart is for HMY it is very similar for many of the other miners. In hindsight it sure seems like there was a confluence of support at the most recent pull back.
http://schrts.co/RwFBlE
This is a slightly simplified version of the above. I can see how someone developed the pitchfork methodology, this looks like an early version.
http://schrts.co/BjEXVW
So I’m still in my CLNE trade ( I’m in the red a bit). And I’m not sure if anyone else jumped in and held on.
Mixed picture here today …it is now looking like a base and higher lows look good. I like it for this base action, but that basing can just continue for a while too.
It lost the 50sma and ‘could’ be ready to try to retake it, but very light volume on the rise here. Pathetic light.
I’m Hanging on for a bit more , but I could almost get out at break even here.
I don’t own it, but my daily, hourly, and 30 min are all on buys.
I got a 30 min sell on JNUG. 60 min may be close behind.
I did not get a 60 min sell on JNUG and the 30 min has gone back to a buy. Such is life when one watches shorter time frames.
Good thing I held on. 🙂
I now have a daily hourly and 30 min sell signal on CLNE
Alex,since you are playing this bounce in miners as a short-term “scalp” (me too), can you please give us an idea of how long you intend to hold? Do you plan to sell Wed before the Fed “news” or just watch to see what happens. I do not normally do short term trades of 2-3 days … but JNUG looked like a “fat pitch” that I could hit for a quick homer. So far so good!
I was going to decide tomorrow whetehr to lighten up, give it up, or what.
The hard part is that often ( if you picture a 1-2-3-4-5 move out of the lows) the drop to 2 could be tomorrow or Wednesday, and the Fed could kill the rest of the 3-4–5 anyway, but just for the sake of a visual, I can see the drop to 2 coming POSSIBLY before the Fed and I did want to avoid that. I went heavy Friday and will likely just sell a good chuck and be happy with that, MAYBE let the rest ride into Wednesday.
I have a weather situation going on here starting tomorrow , and that always affects my trading, because it involves taking time to clean up here and help out my parents, etc.
Ah,see that’s why YOU are “The Master” 🙂 I went light on Friday because I wanted to wait for confirmation today. But as I posted earlier, if I were a real “bottom hunter” I woulda/shoulda gone “all in” last Friday and I would have an even better cost basis in JNUG today.
This can recover, and I’m not trying to alarm anyone ( Short term 5 minute chart attached, 15 minute is similar)
This can be toppy as it drops into the 1-2-3-4-5 on a daily chart, so we would have 1 up complete and down to 2 starting with a right shoulder and could drop down into the 2 .
This IS OVERSOLD, so it can run back up , go sideways and keep going higher too. I’m just noticing this pattern and the MACD does have momentum lacking at this point, so I am just watching to see if a right shoulder forms and peaks or can it continue higher.
I sold a partial with the double top on the head and the macd dropping. Will buy a dip if it forms with divergence, just for another quick trade.
https://uploads.disquscdn.com/images/c520a48e88e4fcf8de3005aad72bb89a96c7b98b7a0a849fba7cf8b70446bc70.jpg
Thanks Alex. Please let us know when you sell it. I bought some on Friday knowing that this would be a shot term trade. Just need to find a good spot to sell it. Thanks
I sold some that I bought on Friday at $5.60 already ( Mentioned that I sold partial) That locks in over $1/share gains, and the rest I will continue to manage , maybe into tomorrow or Wednesday.
how does one f=deal …. exactly ….
I’m doing that right now at the Las Vegas airport
😀 oh carlllll …. 😀
I was in a hurry – I am storm prepping in between visits here .
I dont even know what I was trying to say : )
I’ve been f’ing dealing as well! I think.
I can’t figure out how day 2 of the DCL is gonna work with the Fed on Wednesday. This is sure going to be interesting!
Sorry to be so daft….it is GDX?
GDXJ – sorry about that, I forgot to label it
Hi Alex,
I see impulsive 5 waves up on 10 min chart (HMY) to 2.34
http://schrts.co/qd0pXi
In a 3 minute chart I see A down to 2.30, B up to 2.33; the looking for 5 minor waves down in C; looks like we are in the 5th wave down.
http://schrts.co/aJt83T
“Butt pucker” day in JNUG. More of a roller coaster ride than I expected. I prefer days like last Friday where it just keeps grinder higher all day long. It was a strong buy this morning, flipped to a “sell” on my 15 min chart at 12:30 PM ET and now looks like we may be getting an end of the day rally, JNUG close to flipping back to a “buy” on my 15 min chart.
I actually like the daily chart 2 days of volume out of this low too ( GDXJ )
I agree, my daily chart is strong for GDXJ it looks like it will close above many MA’s today including the 10 day SMA and 13 day SMA. JNUG also looks bullish, of course. I will be happy if/when JNUG closes at or near the HOD. Today’s action is very similar to Dec 27-28 which was the last great buying opp for GDXJ/JNUG. Let’s hope it can keep going … at least for another day or two.
I plan to likely sell out prior to the Fed regardless of next 2 performance. I can always get back in!
Steve, your 15 min chart is faster than my 15 min indicator. My sell hit at 1:00 ET. My 15 min buy hit at 2:30. As I mentioned below, I had a whipsaw on my 30 min. 🙂 I am not playing, but having fun watching. I was close to a 60 min whipsaw, but did stay positive.
Solid day if you’re day-trading (and no I wasn’t either).
OWCP trying to come back today…
Would like to hold.
with Nat Gas strength (not today). SWN is looking really good. Double bottom with second bottom volume much lighter. Classic bottom. https://uploads.disquscdn.com/images/63210a21e63579c3c57d138082156bdb0401995163a6febe441be5e354593f09.png
Watching Crude also …. Real close to a bottom…..
hi frenchie 😉
Hi Maria! How are you doing in these murky markets?
And nice divergence – looks like a good catch
Monsieur LeC, did you take this trade? I did well with this last year about this time.
I did last week. Early as always even though I know my patterns… Working on being patient 🙂
also long SILJ as of Thursday. and holding some calls on various miners. (mainly cadavers at this point)
I’ve done ok with JNUG recently and even some ind miners (not named EXK, CDE). But calls have been an absolutely miserable experience save first 2 week of ICL (Dec-Jan).
I’ll be taking the ride with you! UP UP and AWAY!
those in the path of the storm … stay safe and warm … :o)
hey GF 😉
Ditto what Maria said….and hope everyone keeps their power up and going for FED Wednesday!
Thanks to Alex and everyone on here for sharing your thoughts, charts, tips, etc. – I am learning a lot from everyone 🙂
Hope all you North-Easterners won’t face this: https://uploads.disquscdn.com/images/79de3b5dbfa2c084d5b3b2a7817f75127edfb0db6d79d7c90eebd617361de917.jpg