
March 3 – A Sour Note
I want to share just a few thoughts about the Precious Metals markets today. I’ve actually been doing some extra research all week long, because as I’ve been saying in each report this week, things are a bit out of sync. Some of the things that we are seeing are different from the normal activity that I usually see. Let’s dig it…
In the weekend report, I will discuss the things that we need to watch going forward to see whether or not Golds Bull Market returned for good last year, or are the recent extreme selling periods hinting that we just experienced a bear market rally and we could drop to new bear market lows. There is only 1 trading day left in the week, so this review is all you’ll need for now.
.
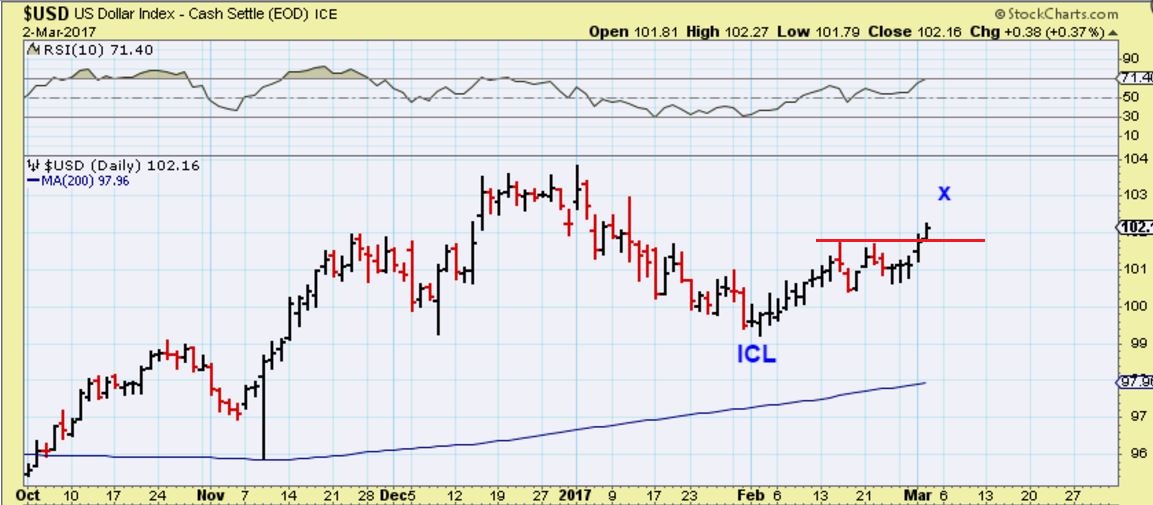
USD – I mentioned that I was concerned that the USD was breaking to a new high on day 18 and 19. This indicates that the USD put in an ICL and that often hurts Precious Metals.
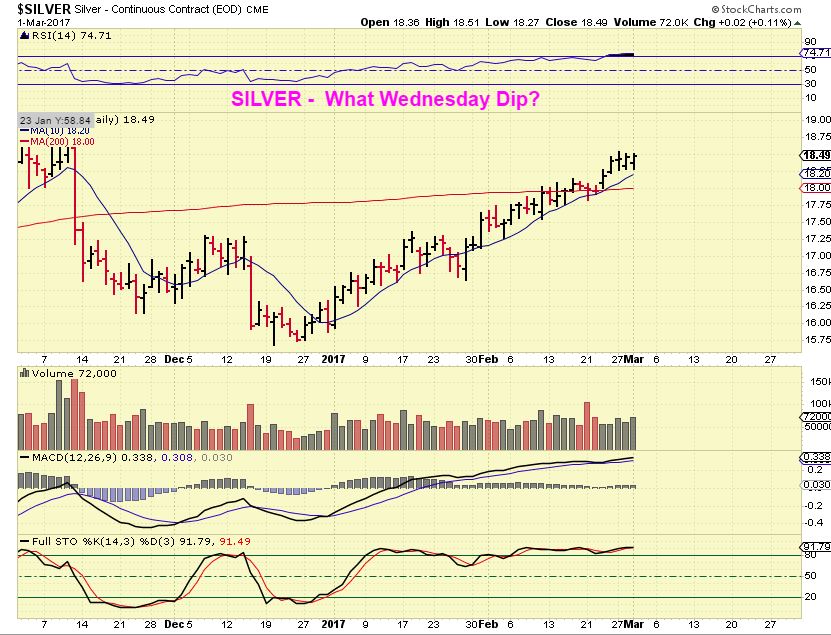
Just yesterday I was mentioning how Gold & Silver were holding up so well despite the USDs progress. They were overbought and due for a dcl however.
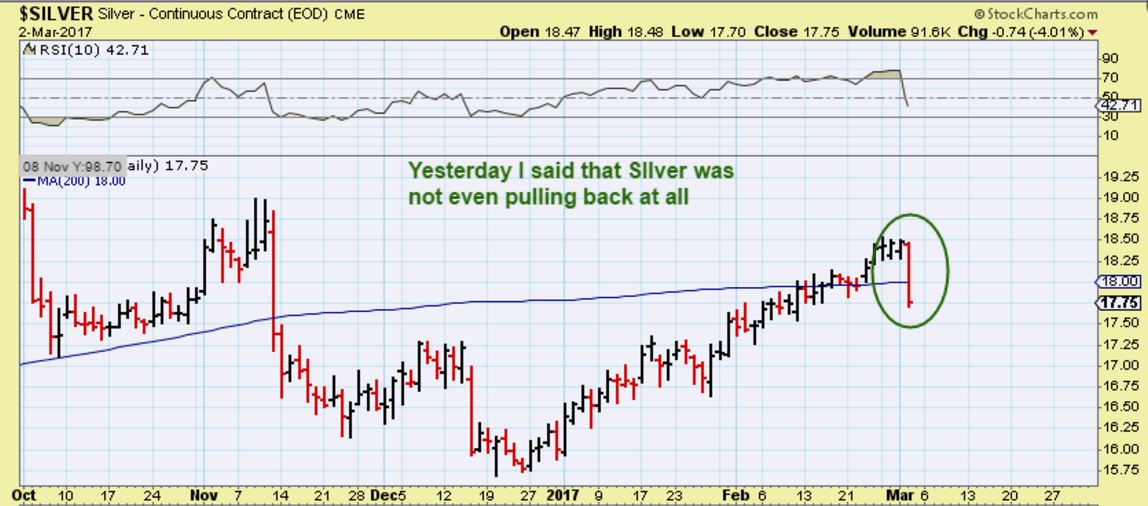
SILVER – 1 day alter, this sell off looks extreme and it is surprising when you consider how nicely it was holding up, but …
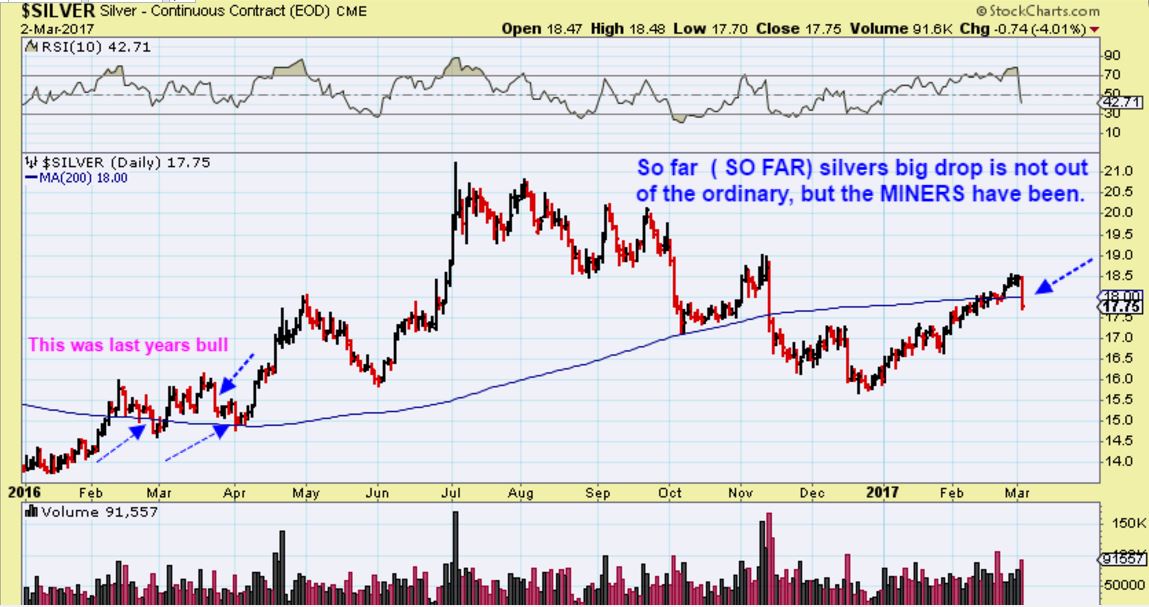
We have seen sharp sell off days like that in Silver in last years Bull run too, so I CANNOT say that it alone is definitely a bearish longer term indicator. We lost the 200sma, and that is bearish too, but we also did that in Feb 2016. We need more evidence.
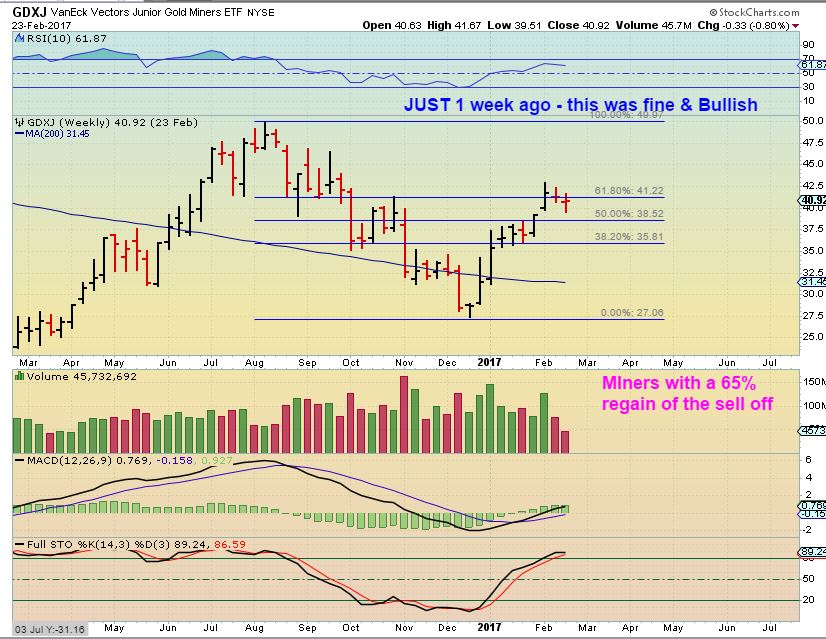
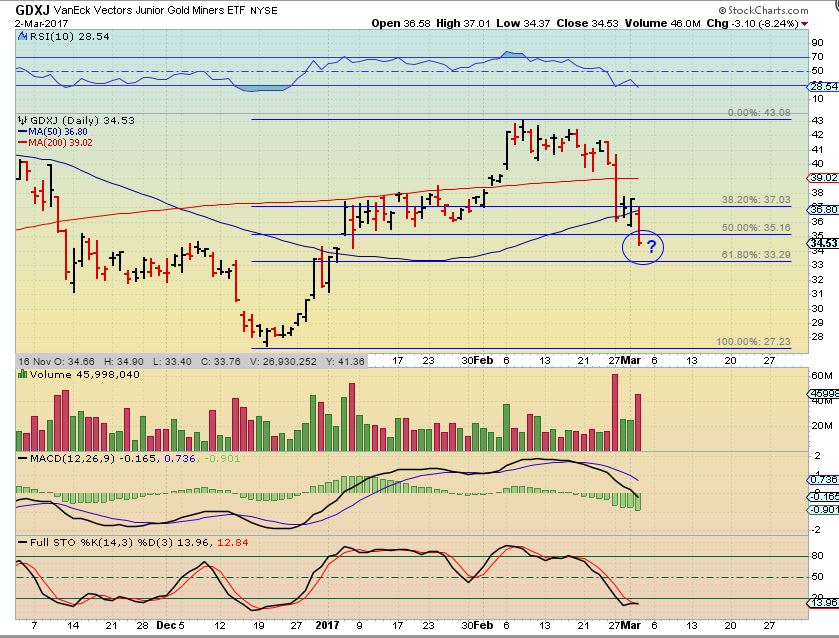
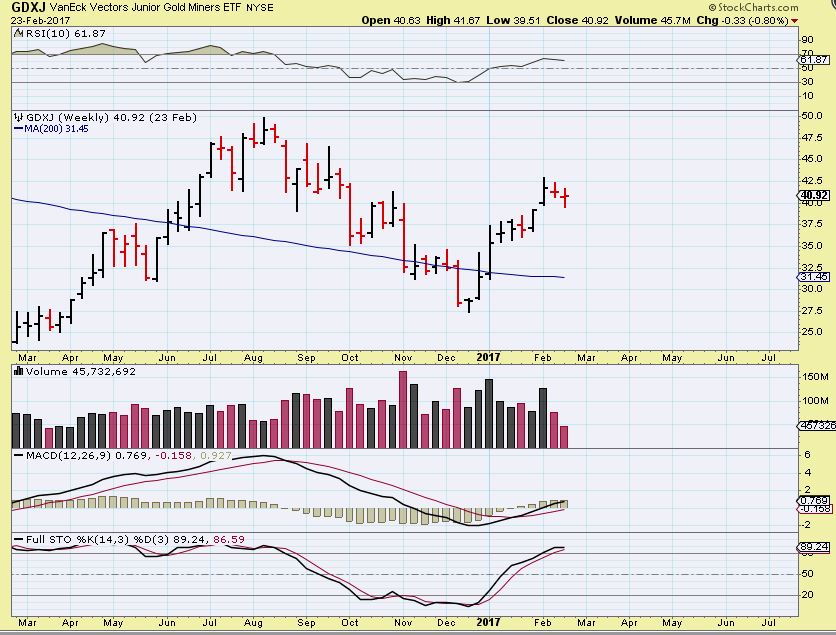
I wanted to add a chart of GDXJ just last week. Last week everything seemed just fine. This was a solid run higher from Dec through February. The recovery was a rally of over 62% of that 6 month drop in just 2 months. That seemed strong.
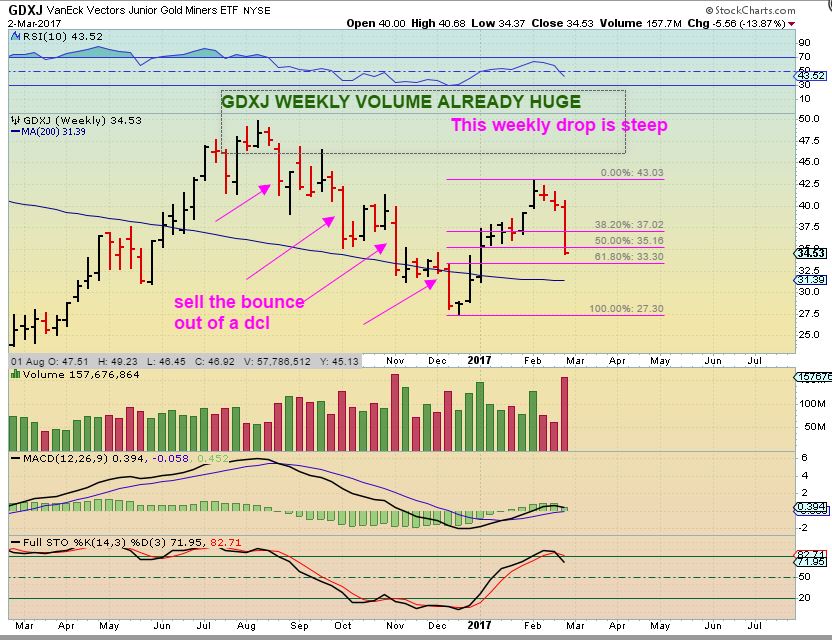
And then we got this steep slam down all in one week? Notice that during our bearish sell offs from August through December, we saw these types of drops into DCLs, and then a bounce. These are more like bear market drops into a dcl than healthy bull run dcls. Each weekly slam here ended as a dcl that week or early the following week, anda bounce did last for weeks. I will discuss this this weekend, in a bear market you should sell that bounce. Maybe this will be a 61.8% drop ?
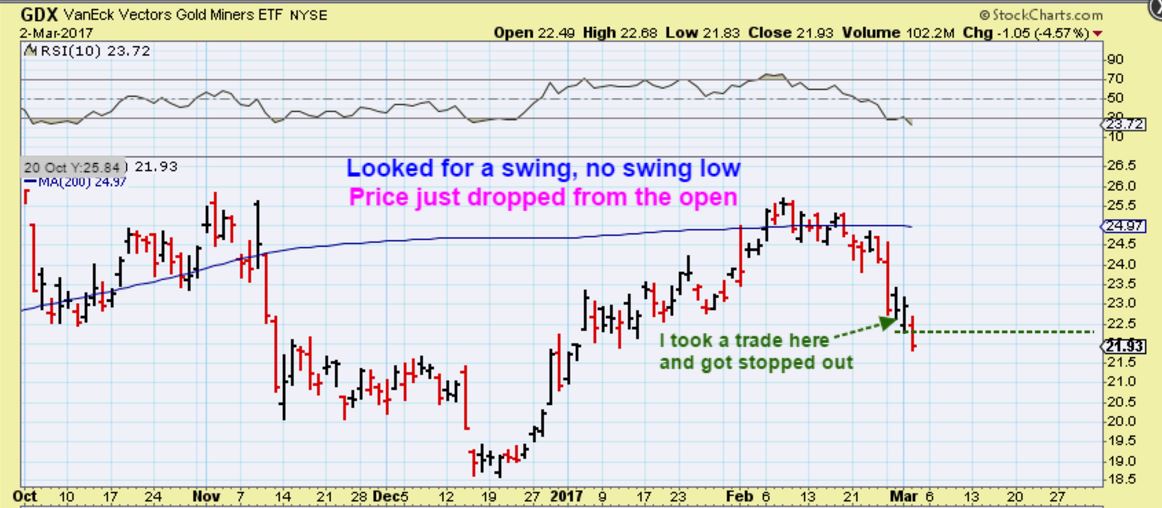
REVIEW: This was yesterdays trade set up, if we were in a bull run, these reversals often have follow through upside.
A reversal that eats up more than 1/2 of the prior days candle can be bought with a very tight stop. I mentioned that Conservative traders would WAIT for a swing low to be in place. The conservative trader was safe. I took the trade at the 50sma on Wednesday and got stopped out of JNUG for a semi bigger loss. Maybe my position was too big.
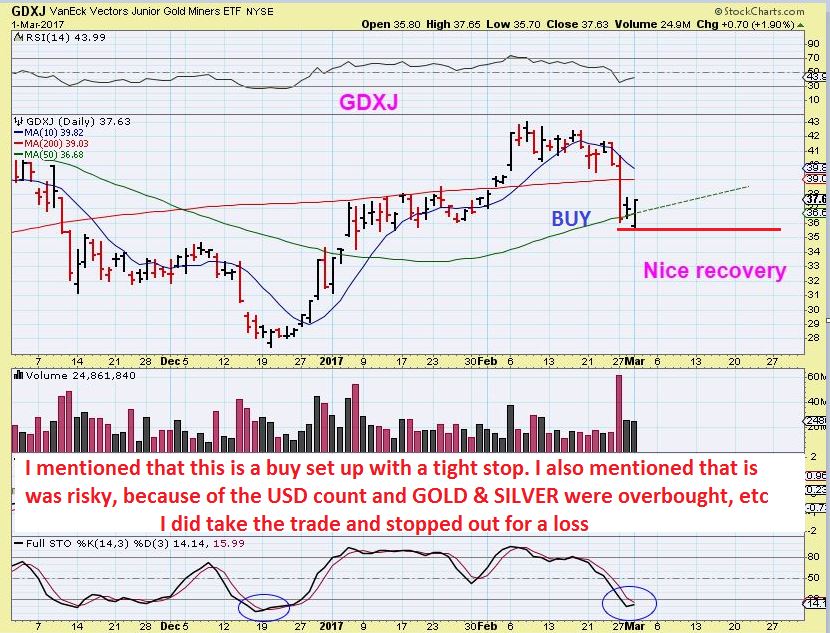
We saw MANY reversals right across the sector, and in a bull run, when you see this, it gives you confidence that possibly the buying is coming in. Even so, I did mention that I was uncomfortable or it wasn’t quite right with GOLD & SILVER overbought and due for a dcl, but I still took that trade thinking maybe the miners sold off first, and Gold and Silver would put in shallow dips.
And this was GDX on Thursday. It did not even attempt to run higher and put in a swing, so if you are a ‘conservative trader’ that was waiting for the swing low- you have no further damage. That is the safer method, and this is proof as to why that is.
GDXJ – A possible target could be the 62% level, since we said that the Big Slam down weeks in the bear market last fall ended with a dcl and a multi week bounce. The question is- how to play it , or should we bother. I do NOT like to see GDXJ regain the 50 & 200sma and then lose both of them again. I really do get mixed feelings about what I am seeing.
 .
.
NEXT : THESE ARE BEAR MARKET CYCLES IN GOLD
.
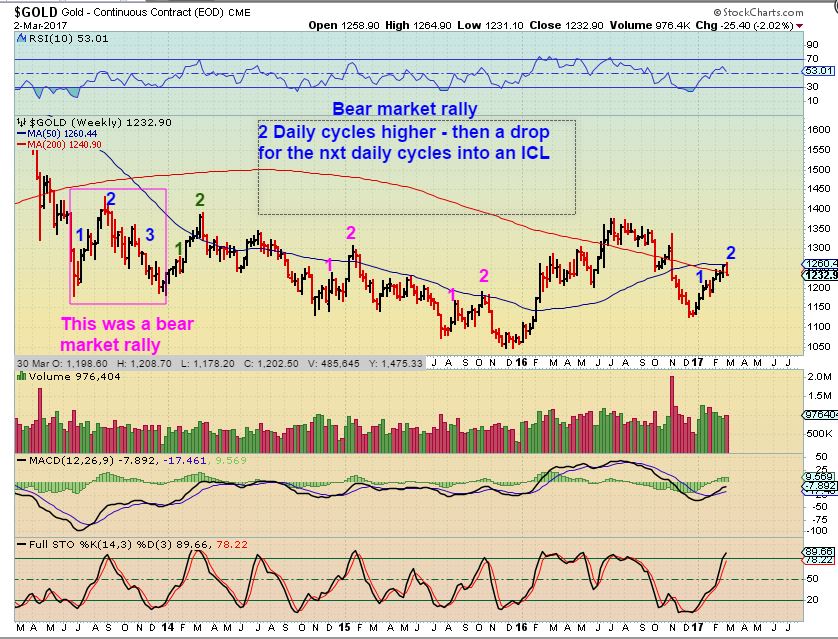
GOLD -I drew this chart when Gold was bottoming in the summer of 2015. It shows how cycles look in bear markets. NOTICE WHAT I WROTE: You get a convincing 2 month rally even in Bear markets ( 2 daily cycles) and then it rolls over for the next 2 or 3 daily cycles. This is an old chart, you don’t need to read it, just that we get 2 month rally ( 2 daily cycles higher) in a bear market rally.
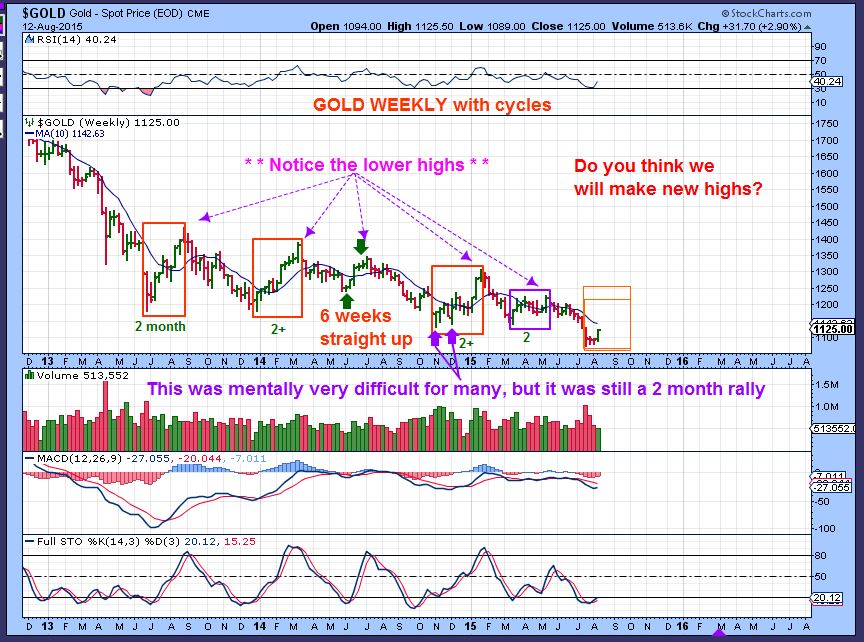
Look at prior Daily cycles that ran for 2 months- 2 daily cycles, and then rolled over. We just rallied for 2 months, and now we seem to be rolling over in Miners? I’d really like to see this 200weekly MA hold today or recover very quickly next week. We have to admit that at this point, this looks rather similar to past bear market rallies and then a sharp drop. 🙁
Are GOLD & SILVER About to follow that pattern too, with the USD rising? I’ll discuss this more in the weekend report.
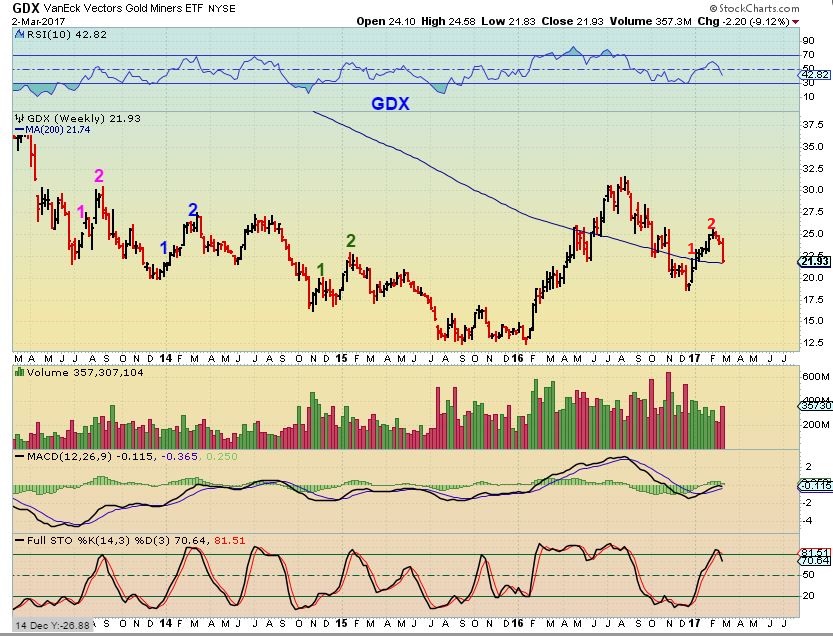
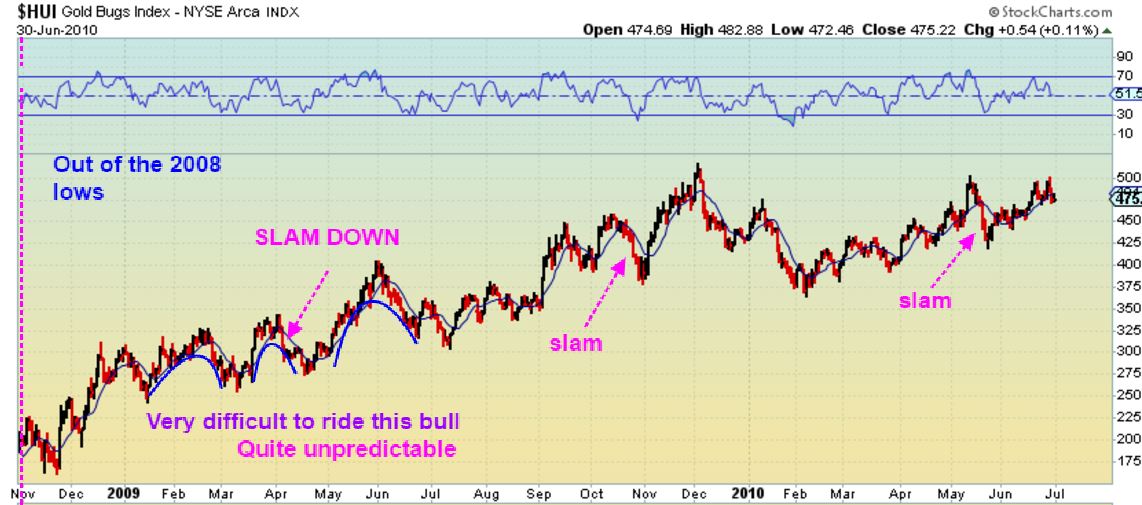
As for the fact that Miners are selling off , that alone doesn’t mean we are in a bear market. I keep showing this chart over and over to try to help you to see that even in this bull run, there were sell off s that brought price almost all the way back to the prior lows.
-
Look at the run from Jan to March. It looks like it almost tagged the Jan lows in March.
-
Look at the run from March to April. Another deep dip.
-
Over and over again, this bull ran up and gave it up. Ran up and gave it up, but it did go from…
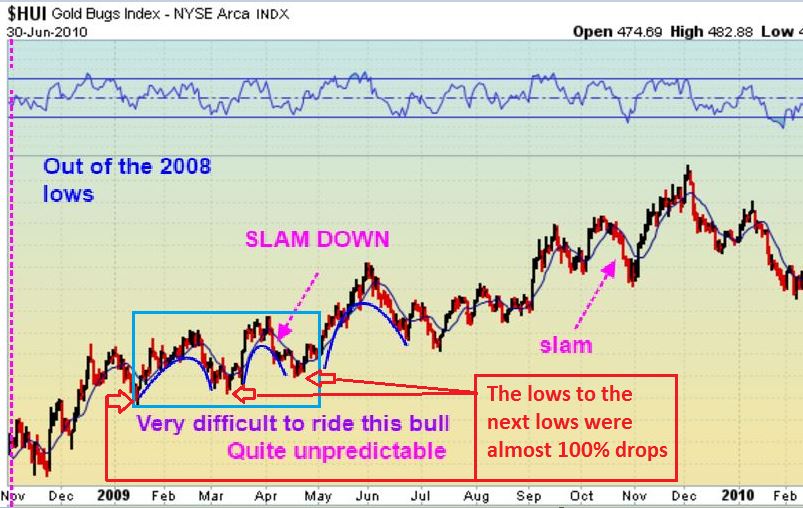
$160 ish to $500 in a little over a year and a half. It was just very difficult to ride, ESPECIALLY IS YOU USE LEVERAGE. Many more readers here use JNUG & NUGT than I realized. I have repeatedly mentioned that inexperience or lack of discipline with these trading tool can damage your account. I know that emotions can get the best of us, but I am sad to have received an email that said, ” I bought JNUG at $12 last week, I’m still in it, should I hold or sell.” THAT IS SO SAD. a 50% loss right now! These are not for inexperienced traders please.
Things in the big picture still are not perfectly clear, but I do know what I’ll be looking for going forward. This will be part of our discussion in the weekend report. For now let’s just say that Gold, Silver, and Miners have now all begun their drop into a dcl, and the USD is running higher. We will get a dcl in precious metals soon, and the USD will top on it’s first daily cycle and drop into its own dcl.
Questions for the weekend report to answer.
Could this have been a 2 month bear market rally and now we re-enter a bear market?
Can the USD still put in a new intermediate cycle that is left translated and fail over time?
What about Inflation and rising interest rates? How do they historically affect Gold & the USD?
Again, last week, the charts for GDXJ & GDX looked excellent and very bullish. This was a strong looking rally.
This week alone GDX & GDXJ and many other Miners started stopping us out and piling up losses. JNUG got cut in 1/2 this week. Average looking pullbacks in Miners that I normally would buy in a bull market 2nd daily cycle dip laughed in my face and took some of my gains back too. It has been an ugly week for Miners, despite Gold & Silver holding up rather well.
Many Miners that looked great and had a very nice rally are getting ugly (see EXK ( Wow) PAAS, CDE, etc). As this chart shows, there will be bounces, but it might just be time to sell the bounce.
Honestly, for me there is no reason to look back and say, ” I should have done this, or that.” That doesn’t really help going forward and often it is an even an illusion when we review what really took place. We had GOLD & SILVER right at their highs this Monday ( Silver was there yesterday). I saw several Miners still at highs, and if Gold broke above that $1264 area and ran to $1300, Miners could have just done a shake out & run up with them, becoming Right translated. Mondays slam and Tuesdays lack of follow through downside looked like a possible shake out. Woulda coulda shoulda doesn’t help as much as earnestly trying to figure out what is next and honestly assessing the situation. Then we can proceed with a trading plan. This was a fast ugly week for Miners, I took some bigger losses than I usually do, and that with GOLD & SILVER right up at the highs until yesterday. I even had a JDST hedge on for a little protection, but cut it loose after Tuesdays neutral day. Woulda coulda shoulda- but I had a different plan and it stopped me out. Now what can I do …. is the question?
I’m going to have a lot to cover in the weekend report in this sector alone. Have a good Friday, and enjoy your coming weekend. Thanks for being here and if you made great gains December to February and then gave some back, do not worry. There is always another trade for the patient, and we can continue to grow our accounts, whether it is in the precious metals sector or another area that sets up bullishly.
.


Alex, I’m not trading miners or PMs until things turn around. That doesn’t mean I don’t want to make any $$$. Is there another sector where you like the setups? I was thinking about infrastructure. Stocks like X, and USCR?
CLF, VALE, TGB, WRN, HBM, etc are near the 50sma, they look promising . They keep poppng and dropping so they havent really started another run higher
As a pure fundamentals play USCR sounds good. Up 10% since Trumps speech. Concrete and steel everywhere. I was in Dallas this winter, and man they are building everywhere with concrete.
I’d be interested in a discussion about SELL signals. Does anyone want to share what they use? I personally want to get more disciplined about when/where to stop. I currently watch the RSI and moving averages.
I usually wait until the emotions kick in and then sell at the bottom. Don’t really recommend that as a method, though…
Ha, trying to stay away from that approach, but thanks for sharing.
I knew you and SOG and a few others would enjoy the humor. GL, bro!
lmao Cason.
hahaha! I’m there with you sometimes….:)
Glad you are laughing again this morning, and shared it with us.
lol cason
There are many under various conditions, but it is almost impossible to sell the top. Many pople get discouraged when their account value peaks and drops…and they say “Why didnt I sell” – but it isnt realistic because we ride the waves all the time up and down and hopefully it is a stairway higher.
Some people just sell after the initial pop and take the 5% for example- not caring that it could go higher
Others do a-b-c-d rice projections and just sell without concern that it could extend and go higher.
Other just let them ride in a bull market like Jesse livermore, and they look for gradual steady gains over a year, even with sell offs along the way.
Some use indicators like you aid, they sell if it reaches 70 rsi – but I’ve seen the strongest stocks run above 80 RSI and get pegged there.
Some sell when something gets so many % above the 9 sma ( But the risk of it just going sideways to the 9 sma and continuing on leaving them behind is there. ( Like SPX lately).
So it is a tough call in my opinion. I just try to get a feel for each individual stock and hold if it looks like it is acting correctly, but at rare times like we’ve seen lately, many have been a bit erratic ( URRE, PLG, etc).
Recently I caught WRN near the low and also sold WRN correctly, just based on how it felt right near the top, and now it is almost at a new entry point.
The hour chart for Gold and USD look promising.
Fighting back HARD from early pre-market lows, guys. Let’s go!!!!!
I posted this note back on December 15th;
“I have found that during a BULL market, whenever the XAU Index closes below its 50 day MA by more than 10% simultaneously with a close below its 200 day MA by > 10%, a “low” of significance is close at hand (I know, I know, you’ve heard this tune before!). During the last secular advance from 2000-2008, the following dates were recorded where such a phenomenon materialized:
7/26/2002, this was also the LOW week and the low was recorded on a Thursday.
10/10/2002, also LOW week and low on Thursday.
3/11/2003, also LOW week, low on Tuesday
4/28/2004, 2 more down weeks approx. with a 6% draw
4/27/2005, 2 more lower weeks with a 6.5% draw
9/14/2006, 3 more lower weeks with a 6.25% draw
8/16/2007, also LOW week, and low on Thursday
In all of the above cases, once the weekly had established a swing low, that low was never again violated until the previous highs had been exceeded.
During the 2008-2011 run, that condition appeared only once in late SEP 2011, and did produce a minor rally but failed and that was a good omen of things to come.
The current situation, with today’s close on the XAU at approx. 73.70, we satisfy the conditions as noted earlier.”
Although not quite there yet (XAU close below 78.60 or so today will suffice) we are close enough if one were to tweak the rules a bit. Besides the obvious conclusion (a good rally is due once again assuming the BULL thesis remains valid) there are a couple of points I would like to emphasize.
First, back in 2002, we had two extremes reached within a couple of months (late July and late October) with the 2nd one really being a re-test of the July lows (and did hold those lows). The rally from the July lows until mid September lasted 52 calendar days and the ensuing correction lasted 24 days and gave back 82% of the prior advance. By comparison, the current situation finds us with a somewhat similar picture. The rally off of the December lows encompassed 50 calendar days and as of yesterday we are at 22 days and have given back 64% of the advance (but like I said earlier we haven’t “officially” met the conditions for a another “entry”.
Second, and more important IMO, I noted in that memo that at no time had we broken the lows once a weekly swing had been established and to do so, would be potentially very harmful to the bullish case. Of course, the DECEMBER lows on the XAU stand at 71.63; will this be a successful test or something worse?
Thanks PANKEF, very well presented data, a lot of research obviously. Thanks again.
I will copy this and try to follow it later…thanks.
Pankef, Excellent post. Thanks, John
i did a chart (at Ken’s request) for that info if you remember.
it used ema data, rather than sma, but it gave the general idea.
here is the updated chart…
https://uploads.disquscdn.com/images/2a1c310dc3d3127c565cc4d516d367c516c6e0cb5ac12c252df9631611bd3caf.jpg
indicator below chart shows the %distance of price from 50ema (red) and 200ema (gold)
Agree with you completely. We may be close to a temporary bottom.
Great post. Thanks pankef.
Great info, I’ll crunch through it this weekend!
Thanks!
PANKEF – I agree and I like this way of looking at it too.
I researched this the last time you posted and I agree, and that is because what I found was that what you are basically looking at is ICLs in a bull market. These are the deep drops into cycle lows.
In a bear market, this would act differently, and this is actually what bothers me. There is NO WAY that Miners should be dropping into an ICL at this point from Dec lows to now. It doesnt make sense timing wise. ( Though XAU also isnt down 10% below the 50 & 200sma yet).
I also looked at that 2004 dip. This would have been very hard to hold day byday, so your mention of WEEKLY SWING is good PANKEF.
See attached for that 2004 drop into an ICL. Very hard to hold, even from where we would be right now. People tend to look at what is happening ‘right now’ and each day on here would mess with people.
https://uploads.disquscdn.com/images/ae02f198932c6e66ad67549625ea0bcf9b52574e2025165b68c07dc1135da973.jpg
indeed, another ICL so soon after the Dec. one is highly improbable, thus this being a re-test and ABSOLUTELY MUST hold the Dec lows or else we are dealing with something else
Yeah, the drop has me scratching my head in quite a few ways , since we shouldnt be at ICL level type drops below the 50 & 200sma.
This was a great post Pankef , because you included the historical dates and % drop following that point, etc. The problem with those additional drops is that being below the 50 & 200sma, most would be very jumpy and nervous, but your solution was waiting for the weekly swing.
You miss moves directly off of the lows, but you mentioned that the lows were usually in and not violated, so more confidence in the trade is how I took that – for the conservative & patient ones.
A good post explaining the idea, the drawback of additional loss, and solution (wkly swing). Nice!
dont make me go sit in the back of the room professor … but i ‘thought’ that “2” waves .. were ICLs .. :-/
#SummaCumLaude
Go up to todays report and notice that the first 2 months or 2 daily cycles are the run higher in Bull or bear markets. In Bull markets the 3rd daily cycle can be the peak and then the dip down to an ICL. In those bear markets, they drop for another 2 or 3 months.
So an ICL comes 4 – 6 months after the last one. We are dipping in a similar way to other ICLS, and this was only the 2nd dcycle. A bit too early to dip like that. SO I am talking about the ‘timing’ of this dip. If we are dipping deep in the end of the 2nd daily cycle, what will happen during the 3rd & 4th? (Is my concern).
yeah.. that’s where i fall down ….(and the little men upstairs take a window) because of the law of alternation. most times 2 is deep &4 is shallow… but depending on sentiment/momentum etc. that can reverse and I have trouble reconciling that… no biggie.. just thinking out loud. I enjoy following along but in no rush to commit it to memory ;o)
Give those little men a glass of wine and tell them to enjoy the weekend 🙂
Is it likely that Primary 2 (miners demise from Aug – Dec) which was extremely sharp could then be followed by a intermediate wave 2 (in Major 3) that was also very sharp? I guess since we just had a rough wave 2 that we would get a more gentle one (though I am talking of the lesser degree at this point, obviously). All of this is blown out of the water if not in a bull market, though.
What if this was the first DCL?
I dont think it is in GOLD & MINERS
It would also have to be day 50 in Miners. I have to doubt that strongly, but I never say never.
got JNUG 6.30
and sold for 6.00
me too.
stick a fork in it next time.. its not done yet
Don’t know how you did it Maria… maybe gold wasn’t doing this bad when you were on vacay but it’s been ruining the relaxation lol.. greetings from Tahiti team! https://uploads.disquscdn.com/images/223b6ccfbc1b91c81312ad7a82ee38361008fc8d779d0f82f19cc049d11c65ac.jpg
OMG! What a fabulous place to be! Lucky you. Heard it is exquisitely beautiful. Enjoy!
WOW… gorgeous!! I’m so jelly!!
yes.. my trading account literally doubled while away…. gave back a bunch.. HEY … I just need to go back!! .. THAT’s IT!!! im outta this snowstorm!!
Beautiful!! Thanks for posting. Great shot for us in the middle of winter!!!
Great view BayTrader, its on my bucket list. enjoy
me too…. !!
Very Nice !!
You even have Internet…. 🙂
THIS IS CALLING ME !!
Great motivation to continue trying to build my trading account!!
JNUG 21million shares plus through in first 30 minutes. Impressive
And silver hanging in strong. Hmmm
thanks for your thoughts CF — so clear, realistic …… honest… which is why I luv CF so much… I can always count on your honest, cut to the chase analysis. It’s very …very much appreciated, including your jdst hedge idea 😉 which has helped A TON!! so THANK YOU…
That’s horrible about the reader with those losses… eeeeks!! That is one of the reasons I spoke up about some posting “buy” and “sell” signals… I’m old school I guess but THAT is what exactly was worried about… folks trying to follow and jumping in and out… OUCH! Those toxic twins are .. TOXIC and so dangerous… sad.
*the Service .. not the man… ;o)
Hey Alex, how do you feel about an oil short? The weekend report will do just fine if you’d rather wait to answer. I’m not much on playing short but it is showing some merit here IMHO.
Interesting spot here for GDXJ. Should find support at the dotted line. Currently at the 61.8% Fibo. We’ll see. No buy signals yet, although very oversold. https://uploads.disquscdn.com/images/8ab55a683d308dd6502f1420fb2f804494edf4b099175dbfda3159ec0d516294.jpg
Yes. Hopefully. And there’s Yellen this afternoon…
Thanks, Bill!
I know I’m the “party pooper” around here lately, but I feel obligated to post my opinions as “food for thought.” Take it for what it’s worth and make your own trading decisions. Alex is an excellent trader, MUCH better than me, so follow his advice. I just want to say that I know it’s hard to believe that miners can keep dropping more after the brutal slam down this week, but my charts show that miners are still in a DOWN trend. Be very, very careful trying to pick a “bottom.” As Alex says, if you are a conservative trader/investor wait for an UP trend to get back on the miner train. As of now, the P&F chart of JNUG shows a bearish price target of $1!
http://stockcharts.com/freecharts/pnf.php?c=JNUG,PHTADANRBO
I know that may seem crazy and impossible, but last week how many of you thought JNUG would be under $6 today?
I will post if/when miners are back to a “buy” on MY charts, but for now they remain a “sell” (DOWN price trend), Just my two cents. Of course, that can change with a strong dip buying rally later today. Remember, I do NOT make long term predictions, I just look at what is happening right now.
Thanks Steve. Nothing would surprise me. 🙂
It’s hard to chart the 3x etf’s accurately. What does the P and F say for gdxj?
Good question! GDXJ still has a BULLISH price target of $73:
http://stockcharts.com/freecharts/pnf.php?c=GDXJ,PHTADANRBO
But notice that there was a “high pole warning” on March 1 which means that the P&F chart could flip bearish soon.
I find the 3X ETF’s are much easier to chart accurately because the moves are more exaggerated. P&F charts are very slow moving, so it takes a very long time to get it to change direction. I also notice that the target price hits on P&F charts more often on the 3X ETF’s than on the regular ETF’s. And don’t think I am saying that JNUG will definitely drop to $1 … it’s just something to think about as a possibility to keep perspective as you try to BTFD.
So do you chart the GDXJ (as shown) and extrapolate to JNUG or do you actually chart JNUG too?
BTW, I spent a few hours last night working with Heikin-Ashi charts that I mentioned yesterday, I like them a LOT. I forget who said in response yesterday that they thought they were excellent, but I’m tending to agree. You can do all the things you can do with typical candlesticks but with the gaps smoothed out. Much easier (for me anyway) to spot trends and changes. So they seem to work well on daily charts. Now my next step is to see how they are with shorter time frames intraday. Anyway, all that FWIW… I’d just never heard of them before and wanted to point this out in case anyone else is looking for additional tools…
Just to be clear, I don’t follow P&F charts closely, they are just one of many different things I look at. I chart each ETF that I trade individually. If I’m in JNUG I chart that, I don’t look at GDXJ. I’m not encouraging anyone to follow me, just saying what I do. I don’t use traditional TA systems I use a charting system I developed on on my own that works for ME. I hesitate to keep posting here because I seem to generate a lot of questions every time I do. My only reason for posting today was to say that IMO the damage “ain’t over yet” in miners, so be careful!
Hey Steve, you’re pretty clear so don’t worry. As far as I’m concerned, keep posting. I have my own way of approaching analysis too (as I imagine most here do too) but always trying to learn more and pick up useful tid bits. Thanks much…
I’ll take the credit. 🙂 Glad you like them. They have their limitations and a traditional chartist would not like them. You seem to have caught some of HAs strong points. They work on all time frames and are especially great in conjunction with indicators. If you want to be very conservative in this current gold market, for example, wait until you get a weekly buy. Just sit back until you see a green bar. 🙂
Thanks Glmus! What charting platform do you use? I was playing with these on stockcharts. Unfortunately my on line trading platform does not include these types of charts. Sorry to hog space here but what are the limitations you are referring to from a traditional chart point of view?
I use and love TC2000. Have used it for 20+ years. Worden Brothers are good folks. If you subscribe and if you want to quit, they easily refund. Biggest limitation is that the HA price posted on the chart is NOT the actual price. Look in your watchlist for the real price. Also, can’t see gaps. There may be more, but their simplicity overwhelms their weaknesses. As I mentioned, you can use a split screen and put standard candles on the other half to catch gaps, etc. I don’t bother.
Great points thank you.
That’s interesting, I hope GDXJ wins : )
Steve, keep posting. The more you post, the fewer questions there will be.
Steve, feels like something big is being covered up or is coming up that will
really rattle markets so they are smacking metal down so when this whatever
takes place metal will just return to break even where it was rather than send
a global message it is soaring . . . .
Seer, I agree. There’s that feel to it right now. Definitely. Perhaps they won’t raise rates despite the hawkishness? Like late last spring? Yellen was practically foaming at the mouth on a rate hike then and then they didn’t raise, and miners shot up. That happened more than once last year. Or maybe the debt ceiling deadline coming up? Don’t know, but there’s definitely that feel.
AG getting smacked as well the last couple of days
Keith Neumeyer (CEO) was very vocal last year on the silver manipulation (with DB etc.) and right after, and since then on occasion, I’ve noticed that AG seems to be a favourite target of the smack downs… He’s also CEO of First Mining Finance if you like him – and they’re still under the radar for the most part.
and I think he is joining in the class action suits. Maybe CDE joined him
and was put on the smack down list. TRX for sure is.
Right on.
DXY looks like it might be confused as to which way is up at the moment…
URRE fell out of bed and having a bit of trouble getting up. It’s pretty dangerous out there for us (ok me) amateurs. Time for popcorn, sit on hands and watch the candles go up and down.
I still think it is impressive that NAK can’t break that bear flag. I’m using NAK as my tell, since it gave clues to the downdraft.
NAK was the first one to fold, but that was due to negative articles by people shorting the stock. NAK does look to be basing right now, no more sellers?
The article was bad, but usually a bullish stock (market) can ignore downgrades, hit pieces etc. It could be back to bear market for gold, but if it’s not, NAK moves like a leveraged etf so I am watching it closely for clues.
It’s right at the breakdown level, so today should be a tell
Ann, much of that bullishness was a result of hype generated by Stansbury and Associates out of Baltimore who for a “modest fee” recommended it as the one miner you Must Own.
No idea. I never saw that. It is definitely day traded a lot so not a lot of long term holders. Breaking thru bear flag now so not good.
It has currently double bottomed at $1.37.
New low on gold, with taking miners to new low. That’s a positive
But, is it positive with the dollar currently down .3% today?
I think gold is due for a bounce soon and miners often lead up and down, so I’m watching to see if they are hinting that. Trading against todays low in miners for a day trade.
Seems like everyone is bearish now. Pretty much time for at least a temporary bottom you would think.
Deleted: graphic upload didn’t work.
The upload actually did work- I saw a bear clawing at the air when Carl mentioned a bottom for Miners
haha
I did well selling early some physical yesterday in Australia.
Straddle my holdings overseas v US$ valuations of gold and silver.
Sorry… last one for today… this sunrise is unreal https://uploads.disquscdn.com/images/74ad509d6aa1c5fe06164edadb468b87ac0f743e567458ee665c2ce44ae01c7a.jpg
Wow. What a beautiful planet.
nice
I sold my XRA for a small loss. It was holding up better than most, but got a daily sell. Usually I like to wait until the end of the day, but …
With Yellen speaking this afternoon and the March 15 FMOC meeting coming soon, I will be somewhat “cautious” in Metals…..short term.
Although I will be adding to Equities soon, that is where the “money” is going……
Have a great week end all……
Thanks for the reminder.
OWCP getting hit hard….I was trying to hang on….bleh. No news that I can see, maybe someone on the inside knows something….
So I just saw that their year end is March 3rd….so…..what are the chances someone knows something they’re not saying yet? Too big of a drop…..geez.
Maybe someone knows it’s going to be good news so they’re dropping the price before the big up swing…so they can get in cheap…..rose colored glasses.
With the trouble Sessions is in, I thought that the MJs would be looking up. Several are, but not this one. Sorry for you.
Thanks…I got out of most but held a few…this was one…thought it was going to do great…..oh well, live to trade another day.
MJ stocks just not the place to be right now….not sure if it’s just Sessions or if they are evolving their own daily cycles…..I’ve been studying them out to see if I can figure out a cycle pattern….I’m just guessing here, but it seems, IF they have their own cycles, that they could be in their cycle low right now and stay there a couple more days before they commence up…..that’s a big IF….since there isn’t a MJ ETF to look to for swing highs and swing lows….I’m looking at several different stocks to see if there is any kind of pattern…..
I should say…MJ stocks not the place for ME right now…..others might find some good chart patterns going on…..I’m sure everyone here knows to follow their own thing….I still have some but otherwise sitting on sidelines til things look a little different….
OWCP was very extended. When these run up, they all do very well, then they drop down, consolidate and do it again later. Look at most of them, and what they did in Oct -Nov—then came back down from way overextended to consolidate and did it again
CBIX, CNAB, CNBX…now MNTR & OWCP. It is normal movement in these extreme moves higher . I dont chase them, I but them low in the base and ride it higher ( Then sell is the key….wash, rinse, repeat).
NDEV in Nov huge run up, now building a base. Not ready yet, but this base will likely launch a new rally too.
Im seeing some decent setups in basic materials though Who else is seeing some decent setups in the small cap basic material space? We have some at support like AUMN and some waterfall types like GEOS http://www.finviz.com/screener.ashx?v=211&f=cap_micro,sec_basicmaterials&r=41
WRN looks ok here https://uploads.disquscdn.com/images/8e3b91e0662a97466b6dc57918dd855adfb9a2943354fc2e1d4dc5c092b11d82.png
FYI .. miners are now a “Buy” on my 15 min chart, so you SHORT-TERM traders may want to buy today. But I’m staying out of miners until my longer term charts turn bullish.
FYI:
Yellen is speaking in 5 minutes.
Oh you might want to hold off then! LOL Just wanted to make a positive post on miners since I’ve been Mr. Bear lately. Miners are starting to sell off a little so the “buy” may be very short-lived (watch the 9 EMA and 10 MA on a 15 min chart, 9 above 10 is bullish). Remember, signals on a 15 min chart can flip buy/sell/buy multiples times in one day.
smack down and back up…YELLEN
Anyone know what was said (Yellen)?
rate hikes
interest rate hike “likely appropriate” for March. “Hikes coming gradually”. They’re waiting on the jobs report is next week is the implication as they are waiting for further data. DXY spiked and then dropped. Gold slightly up. Miners slowly rising at this moment.
thanks
Keep in mind Trump has said he wants a lower dollar so those statements are at odds with a rate hike it seems. Yellen did reference the “administration and congress” as having fiscal responsibility “to address such adverse structural trends”. Meaning the ‘recovery’. CNBC “…Trump has called for expansionary fiscal policy…to jump start the slowest economic recovery since the Great Depression.”
I think we got ourselves a green light. Still Like PVG (bot it at $10.20)
Great call!
If I can get a monthly PM chart to look like my 3 min chart we would be golden!
things are picking up…
I started JNUG as it turned green and gold was still red. Stops under lod. Was watching EW retracement levels of 5.75 and then 4.82 for JNUG.
Thorsen has an report at gold-eagle.com/editorials
a report
Yeah, I read all of Gold Eagle the other day, that was the best report. And lines up nicely with a 1-2 rally off the lows here BUT as an opportunity to sell. At least for now.
Hope some of you short-term traders took advantage of the “buy” signal on miners I posted a couple hours ago. JNUG is rocking now!
Thanks Steve, I owe U one. John
Get with the program First Majestic!!!
No kidding, right? I sold and bought back. Bought back WAY to early, darn it. Man, btw EXK, CDE, and AG, having a tough go with individual miners.
break of down sloping trend line would be encouraging for GDXJ. Not there yet.
stalling at it right now on my charts
100 million shares through on JNUG! Wow
It is now the “go to” ETF for PM traders. Lots of day trading today in/out/in/out … that jacks up the volume.
Steve, Is that the 1 day 15 min. chart that you spoke of?? Thanks, John
If you are asking about the “buy” signal I mentioned earlier today, that is based on a 1 day 15 min chart.
Thanks very much. John
Do I need to mention that in technical analysis, in a downtrend if the reversal candle recovers more than 1/2 of the prior days candle…..
….. Never mind. 🙂 But Thx Janet. Maybe thats a glimpse of March 15?
NAK – So close to the tag of that 200sma. Maybe the rising 200sma will rise up & tag price, instead of Nak dropping & tagging it
I have bigger hopes (below)
NAK working its way back, off of those lows and a reversal candle . Yay.
Light volume sell off today
I think it’s going to make me wait till Monday to see if it completes. I’m hoping for gap and go on miners on Monday. Everything bull flagging into the close, no one would suspect it ; )
Nobody , except for Ann : )
Me too Ann !
My heart is fluttering….:)
L-O-L – I’m in too, if that’s what you mean. I wanted a nice easy tag of that 200sma too, but I may add if that happens.
If this is an inverse H and S on Nak intraday it’s going to be sick! in a good way : )
CLF just tagged the 50sma and turned higher – Kind of tempting as a low risk entry
VALE TGB & HBM still above the 50sma. I am holding TGB and want to add if I see a reason to.
Looks like FCX actually wants to drop to the 200sma.
Just noticed that the Uraniums are breaking own through supports. URRE, UUUU, UEC, DNN,
I was thinking of buying UUUU soon, but now need to wait fro better set ups in this sector too
Agree
Hey Ken-
I was going to ask you earlier when you said you were looking to get into SPX.
If you were using E.W. on SPX- how far back would you go for 1? I was looking at it and can obviously come up with several different counts. I can start with JAN 2016 ICL and go from there, but I’m not sure if I should start with the last ICL, Jan 2016 ICL. etc?
I guess it would depend on Monthly or weekly or just daily.
Daily from the last ICL, I feel that 3 may have just peaked. DCL at 4 and a final 5. Not really sure though.
Let me get back in the office for that one…..
Listen to MissyElliott .. or i guess MisserElliott ;o)
LMAO
Thinking that we just peaked 3 of 3 here. Intermediate 4 should retrace a bit, but identifying that DCL would be a BUY into wave 4.
Weaving this into the OPPOSITE of miners would give us a 2-week bounce. That we need to sell. Wave 5 would top out for S&P in spring and usher in a long correction potentially lining up with the next gold ICL.
BOOM!
Hi Ken, are you also with John Galt Atlantis?
If so…. what name do you have there. Just curious.
Thanks man.
URA though at the 50 sma….
And oversold….
what I was worried about with URA was a 1-2-3-4-5 complete, and then an A-B-C and A&B are done c starting?
Do c waves ever truncate
Yes. Agree.
I see it as corrective Wave c of 2.
Waiting for the swing ?
Well that;s the funny part, i n my mind I thought that the ‘c’ leg down was often equal to the ‘a’ leg, and that would mean a drop to the 200sma or at least a lot more to go. That was why I asked if ‘c’ can truncate.
Yes for sure.
Could also be a 5 wave c….
Yeah….and look at UEC –
I’ll Wait 🙂
Agree……
They need to proof themselves to us. No need to force the trade imo
A and C could be the same, but C could also be 1.62 length of A
I thought URRE looked good early in the week. Glad that I had a tight and correctly positioned stop for once; I exited yesterday with minimal loss. Today wouldn’t have been much fun to ride down.
IVN.TO (Ivanhoe Mines) strong one. Sweet chart.
That is a good one. Have held it for a while. Bought last summer with huge gains. Huge potential in the ground. I’ve added to my core position a bit earlier… Good call.
Adding a few Miners. 1st. tranche
EGI MUX XRA
2nd tranche at the next swing buy.
Stop today’s lows.
Ditto on MUX. Also added some NAK.
That XRA – Holding that 200sma ( and the highs) like a true champ under these conditions.
Agree.
I can’t bring myself to readd mux, but added heavily to XRA.
XRA down in after-hours? Any news.
Looks like a few small orders. Nothing I’m worried about
Everything I looked up, I mean everything was showing down pretty big for a Friday AH. Probably just crap bids, I wouldn’t assign any significant to it and wait for Monday PM data.
ADDED to CNAB on the 20sma ( it has been on it for days) . I was waiting for the 50sma, but this will do for now.
Cool. Thanks. I would have missed it ….. I have wanted a piece of that.
On second thought I may wait for the 50 sma touch.
Not sure if it is “ready to go” yet. It MIGHT need to tag that 50sma, I got tired of waiting, but it IS like a 25 cent drop if it happens. That 20sma has been holding firm though : )
Lol. Beat ya to to with my edit. Same thought.
MNTR – I do not own it
Yeah, I have plans from a while ago for both Saturday and Sunday. This is going to be a tough weekend to write a detailed report.
I really need to find a way to be BRIEF with words and plenty of charts, but that always leads to a ton of questions if I dont try to really detail explaining them.
I’ll figure it out
https://uploads.disquscdn.com/images/29004b25fe82e4b0a20d32c30c6571a2f21ce8ff72ed512bb281f14c865dc547.png
Have a good weekend all!
We were up big in the first 2 innings, the 3rd inning got rough, but there’s still plenty of time to win this game.
Rest up and leave this week behind.
Thanks, you too!
Have a great one…. .
Thanks, Alex.
Thanks, you have a good weekend too!
Good advice.
Good point. And though this was an amazingly tough week, I’m still up compared to when the 1st inning started!
trendline held gdxj and did not let it go.
Interesting to see next week
Alex, just wanted to take the time to tell you one of the things that I really admire is how honest and real you are. Just lay it out there that you took a shot and got stopped out and it was kinda a crappy loss. Period. I’ve seen other newsletter writers in the past that could do no wrong and when their trips and trades fell to sh*! then would be like “oh, I got out weeks ago at a profit, why didn’t you?” which was absolute crap. Then publicize a 80-90% success rate.
Anyway, you eat your own dog food and keep it real. And I respect that. I think we all do. Word.
CF eats his own dogfood? lol….
I ate my own dog poo with my last 2 JNUG attempts : )
Working on the weekend report.
HOW IN THE WORD CAN I BE BRIEF??
.. exactly ……………… GOOD LUCK w/ THAT!!! ;o)
#YouTube
#TickerTv
https://uploads.disquscdn.com/images/b073f09ec9c6f2a1fb6d3beedaafb42de335e98e7bf99dee3f4d3b85b18a9378.gif
So…here’s an example of one of the MJ stocks that has a long red shadow….ACBFF…had a long red shadow on 2/24…down to $1.88…..it popped up right afterwards….then it horsed around…started falling March 1st through 3rd…it hit that $1.88 on the 2nd…actually went a penny lower to $1.87 on the 3rd….then it started looking like it wants to head back up…..I have no idea what it might or might not do…but just an example of that long red shadow foretelling that price would fall again to that level…..I think it might be a short term thing though…like….within 10 days or couple of weeks…not sure it holds true for longer time frames (like months and months)….or even if it holds true all the time…I just know when I see one of those I take a pause wondering if it will fall to that level again…
Is anyone else having trouble logging in? Thanks, John
Are you OK now John? If you got the email alert to a new report, just click on that email alerts title of the report, that should get you in.
very confused by the above ALEX what are your thoughts about the future direction?