
Friday March 24th
LOADING * LOADING * LOADING… As we watch various markets lining up or setting up for the next trade, it often reminds me of that dreaded “LOADING” symbol that shows up when you are using a slow internet connection. It seems like it takes forever to ‘get connected’ to the internet. With trading it can also seem like it takes forever to get things lined up for a low risk trade set up, but patience has its rewards. As the saying goes, “Good things ( including good set ups) come to those that wait.”
For our Friday report, we will review how some set ups are playing out well, and others may be setting up now.
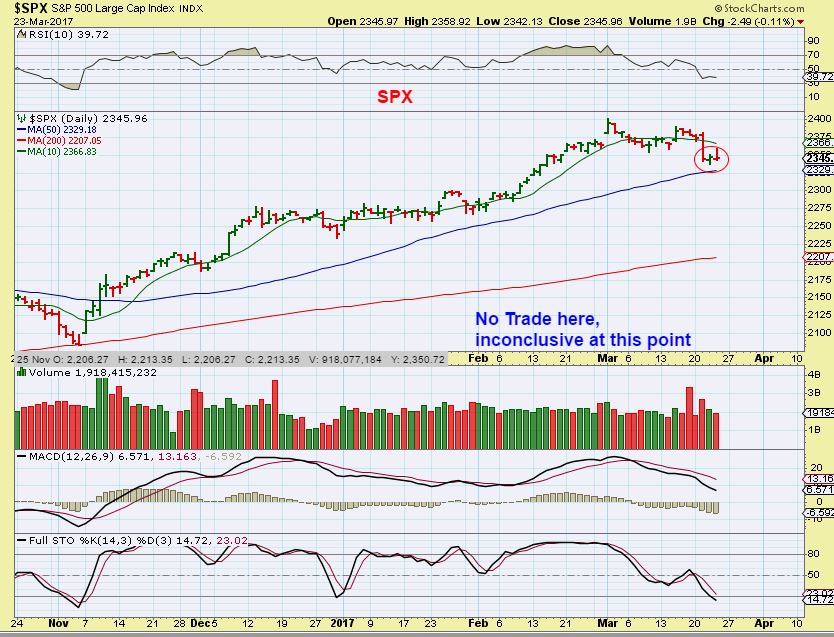
SPX – Even though a swing was put in place, I wouldn’t trade this long or short at this point. Thursday trade ran up under the 10sma, and sold off again. Also…
XLF – The Financial sector was concerning to me. It is oversold, but…
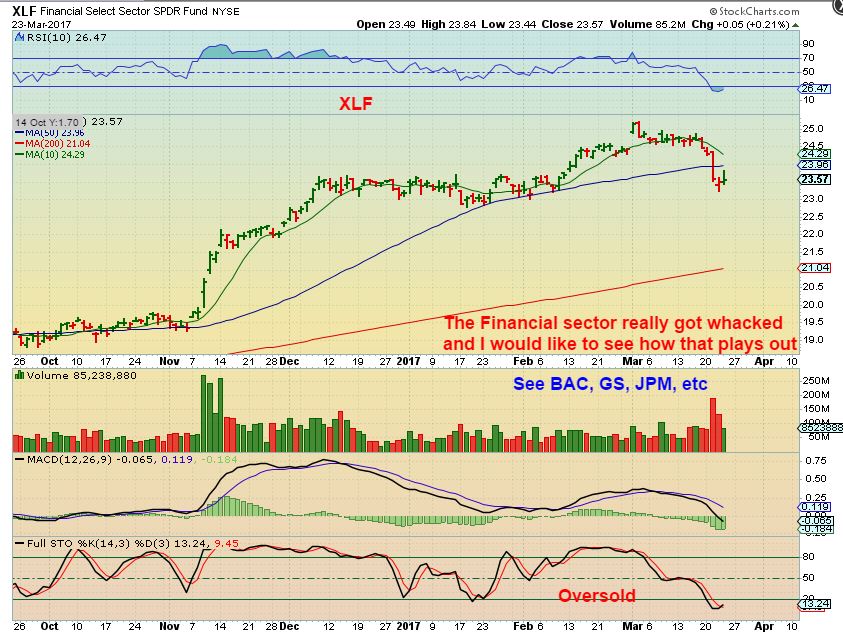
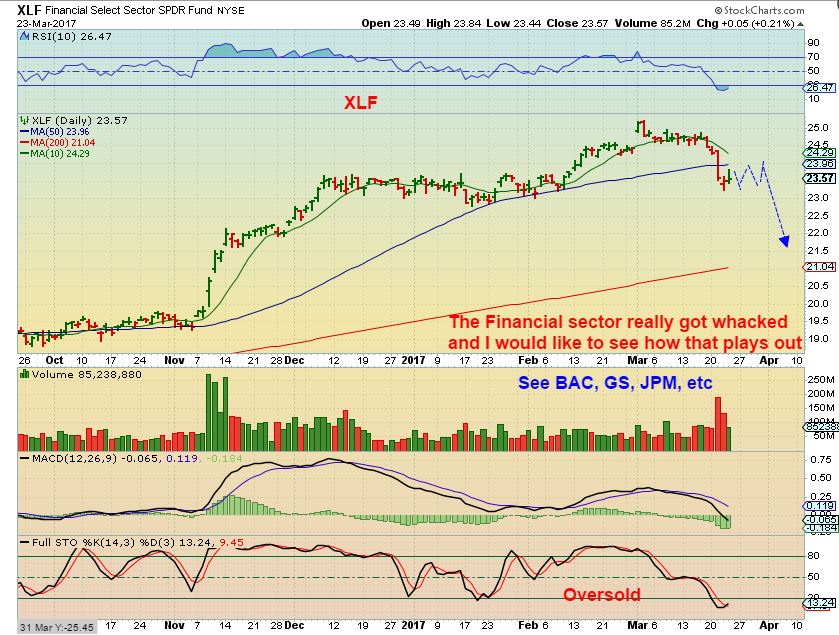
XLF – Even though it may be oversold, it could unwind like this. I’ll be patient in this area for now, because the weekly charts formed a swing high. Information on what this wants to do is still loading.
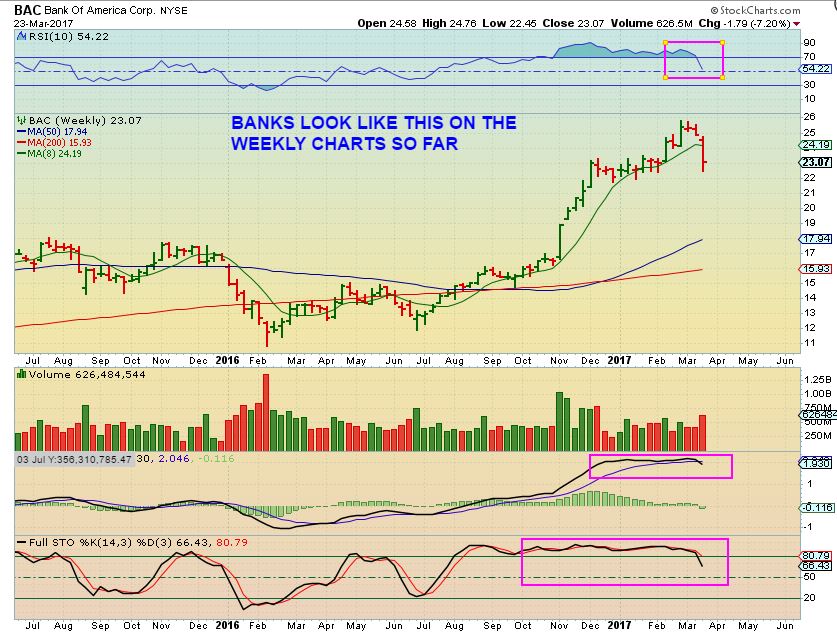
MOST BANK STOCKS AND THE XLF LOOK LIKE THIS SO FAR, so being long the General Markets right now could be risky.
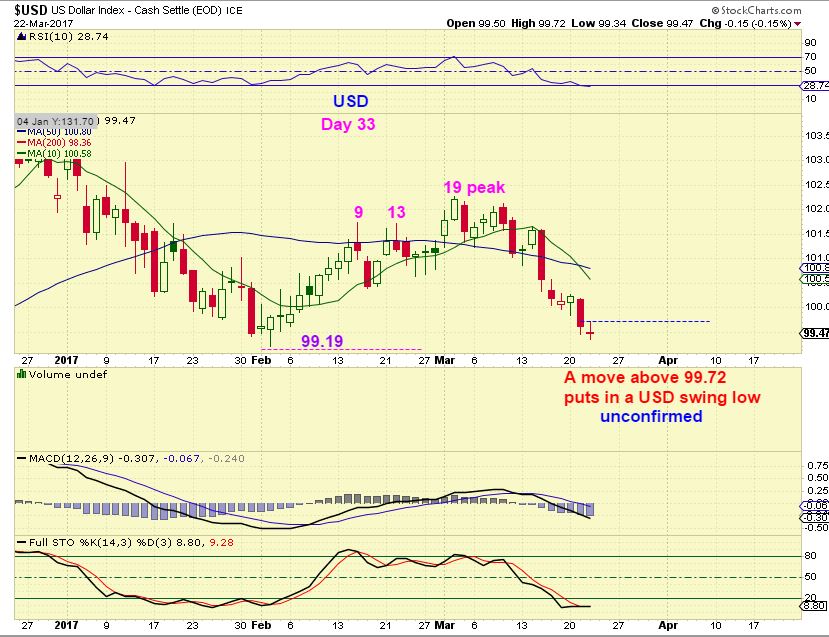
THE USD did not change Thursday, so this is yesterdays chart. Price did not break the high or low of the Wednesday candle, but it is due for a dcl.
EDIT: The USD went to 100 last night, and is dropping now. That puts an unconfirmed swing in place as long as the low of 99.34 isn’t taken out. I’m also watching Februarys 99.19 .
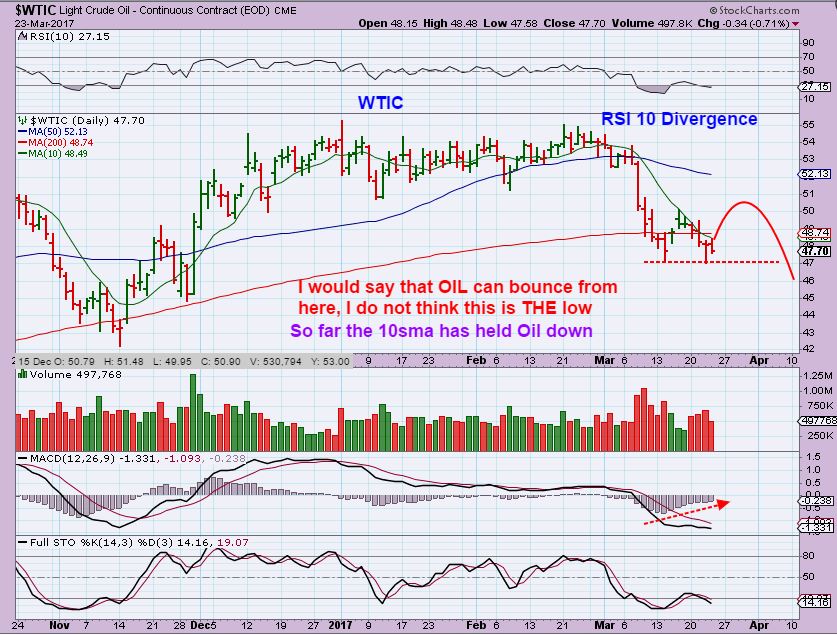
WTIC – Oil sold off a little bit and struggles at the 10sma ( $48.49). As mentioned, I’m expecting a drop into the lower 40’s, but shorting is difficult for me. I wanted to short the bounce, but I expected a back test to the 50sma. They havent made it THAT easy for me yet.
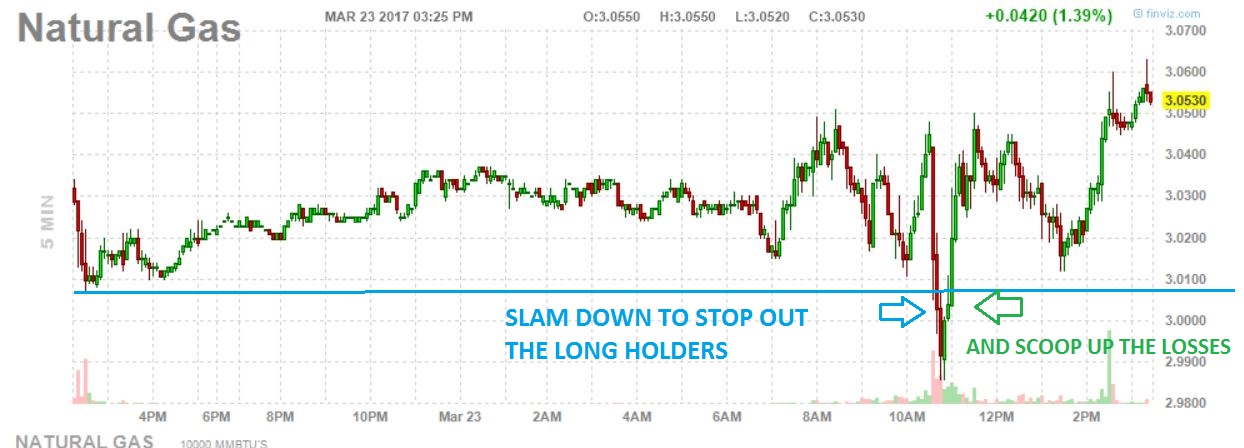
NATGAS has been a LONG trade for weeks, since I expected that it put in an ICL, and it has been playing out as expected. Inventory reports on Thursday mornings can make things a bit tricky , though, and yesterday was no excuse. Look at the intraday action in the morning when that inventory report was released.
NATGAS INTRADAY
We saw a slam down below all of the prior lows, and this would run all of the ‘tight’ stops. Immediately after that slam down, buyers / bulls took control and bought up the panic. Focusing only on short term charts would have kicked one out of this trade.
Stepping back a bit and looking at the Bigger picture , that would not have shaken you out. Here we see a cup & handle on the hourly chart.
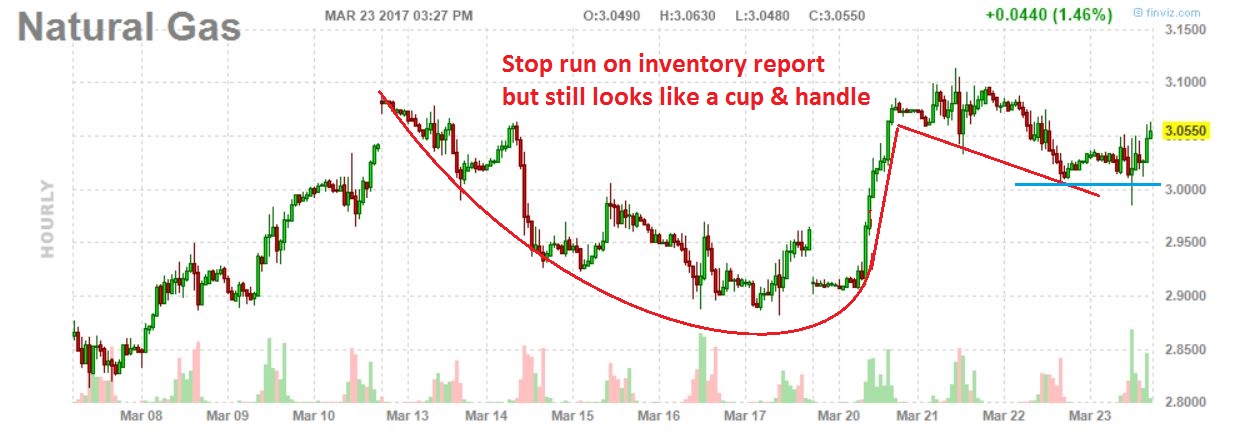
As you can see, NATGAS on the daily looks great above both the 200sma and the 50sma. I am still in this trade, hoping for a run like we saw in November. stops can be raised to the 200sma or 50sma. I got in early, so I’ll use the 200sma loosely.
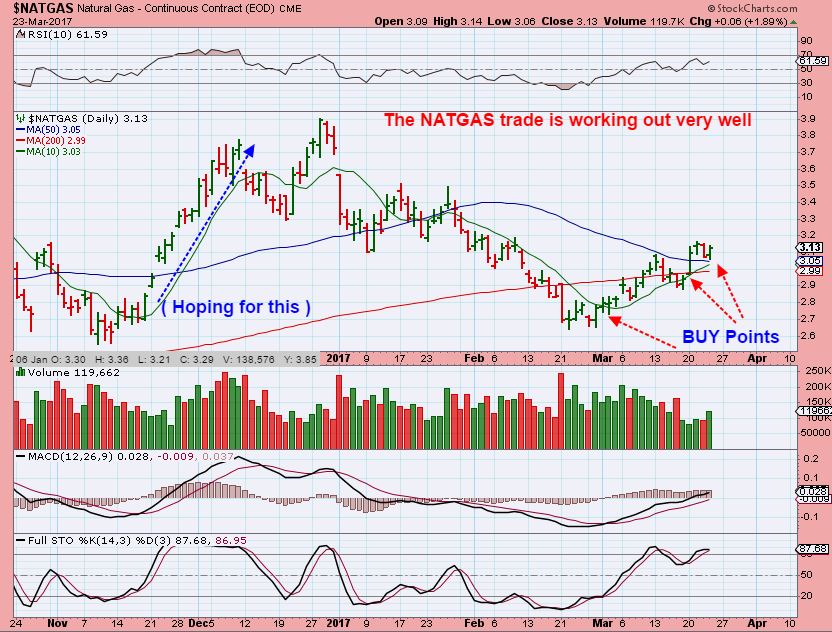
NOTE: I looked at several NAT GAS Stocks, and they are NOT responding to this move higher yet. That is worth watching, but so far NATGAS is acting bullishly. XCO and FCG are examples.
.
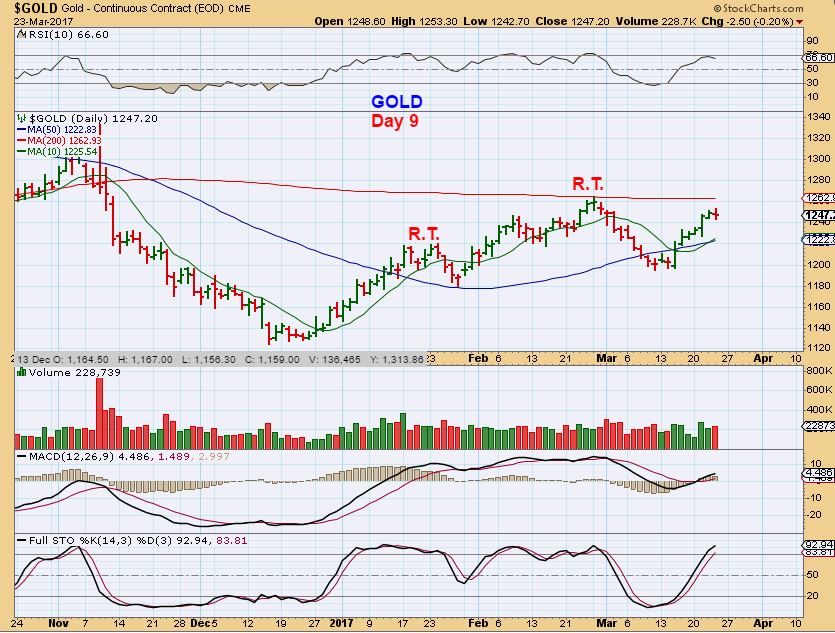
GOLD – DAY 9 and Gold stalled. By now you know my expectations. I think that Gold will top in this 3rd daily cycle soon, and then drop into a dcl and an ICL eventually too. Yes, at a glance this chart looks bullish, but Miners have been stalled out for about a week, while Gold was up for 6 days in a row.
I think that for some active & experienced traders a short in miners is Loading* loading* loading*. Shorting is not for everyone, and some may want to just wait for the next intermediate low to go long & strong. CASH is a position too.
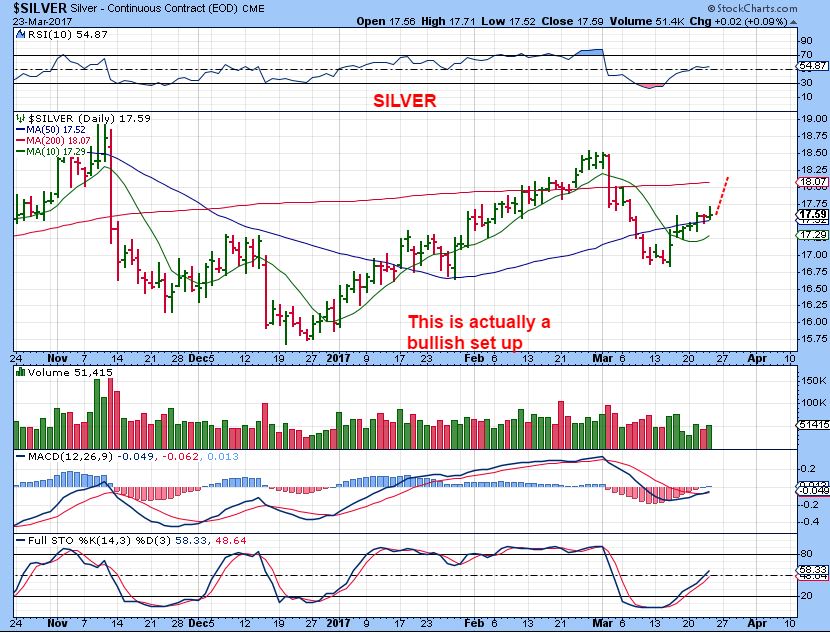
SILVER actually looks bullish too. It looks like it wants to tag the 200sma, and the way Silver POPS, it could do it in 1 day from here.
GDX – Almost 1 month ago I said that I would probably short the Miners at the 50sma back test. After explaining all week what I am seeing, and that was that Gold is rising 6 days in a row and Miners are struggling at the 50sma, I did buy JDST at the open on day 10. I sold 1/2 for a good gain of almost $1 per share, and may hold the rest to see how this plays out.
THIS LOOKS LIKE A BULLISH REVERSAL CANDLE and it could break higher above that 50sma for a quick run to the 200sma, so that 50sma is where I would use a mental stop for my JDST ( or a bit Under $14 on the actual JDST chart , if I want to lock in all gains). So I may sell the 2nd 1/2 under those conditions.
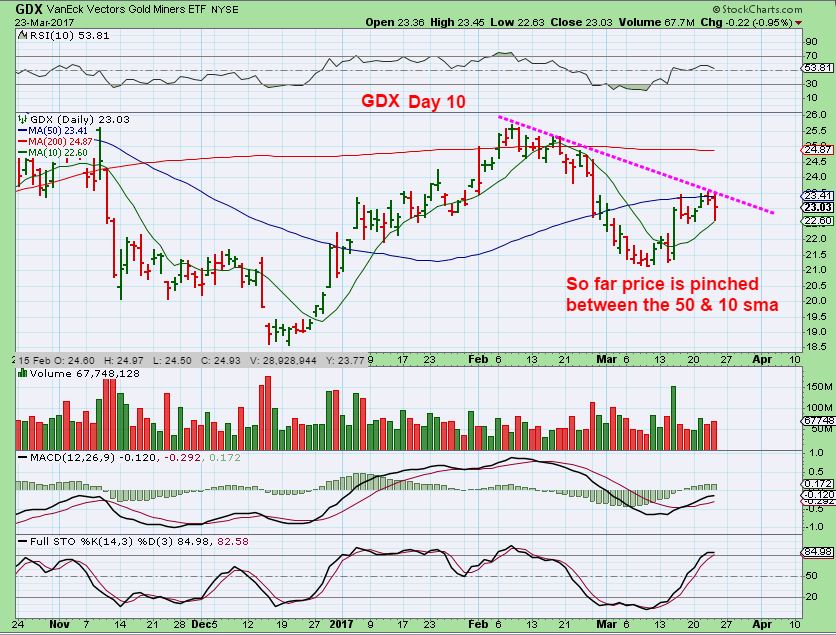
Topping out can take some time, it is a ‘process’, and I think that the Miners may wait for Gold & Silver to top before really dropping ( Like that slow internet connection loading- loading- loading). So ‘shorting’ is a tricky trade and difficult to execute properly, I use intraday charts to enter my trade, sell 1/2 when I get decent gains, and watch the rest at his point. This leveraged trading is NOT for everyone, and actually any trade that you take, you should have an EXIT STRATEGY BEFORE YOU TAKE THE TRADE, HAVE A STOP IN MIND & HONOR IT. I SAY THIS FOR EVERY TRADE, PERIOD.
NOTE : I think that there will be time to short the miners later too, for those that aren’t quite comfortable shorting this early in a daily cycle. Also this is not a trade for all traders, so please be patient and do not feel that each trade mentioned here needs to be executed. My thinking is this: Do you remember what it feels like when a daily cycle drops into a dcl? You may recall that the entire comments board becomes full of fear and loathing and warnings, etc. If you are short at that time, you are amazed at those comments, because it doesn’t feel quite that bad and agonizing. You could even short a daily cycle from day 20 onward and get most of the gains. The final days often drop fairly quickly.
.
TRADE UPDATES
CGIX – This trade has also been working out very well. It is as bullish as I thought it would be, due to that excellent base set up, but it is playing out a bit differently, so let me share my updated observations.
#1 – My upside targets were hit, I thought that maybe we would se an A-B-C type correction to $2.60 break out area
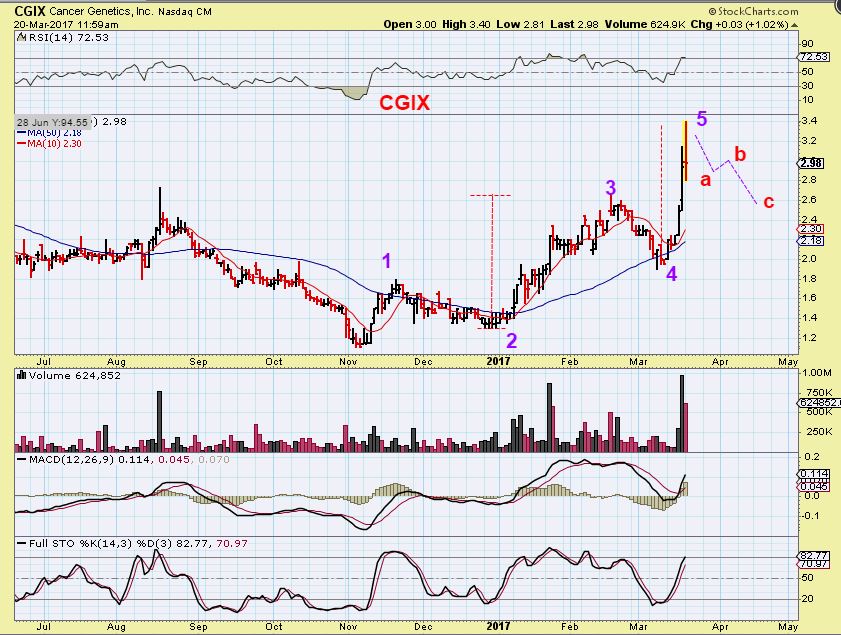
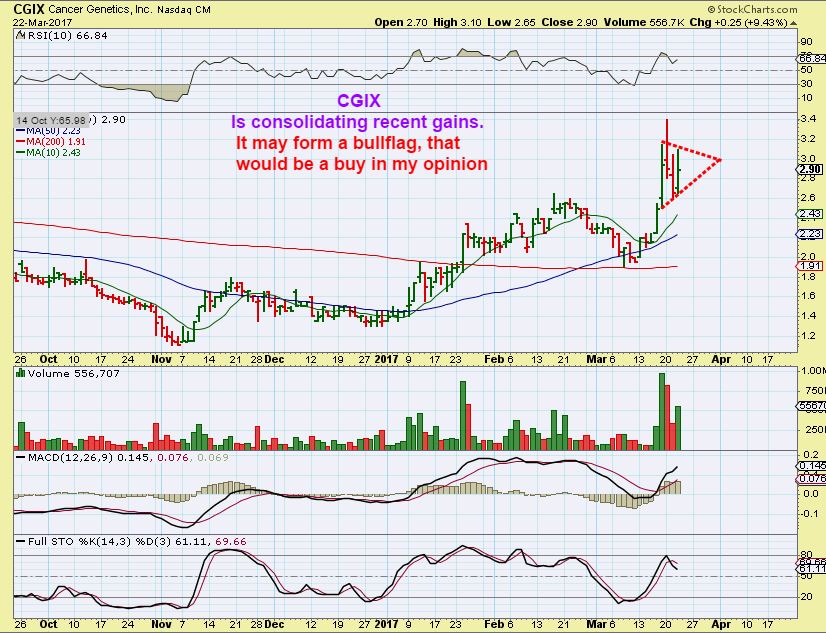
#2 – CGIX dropped to $2.60 the next day and then buyers stepped right in. I thought, “That looks bullish, maybe we get a bull flag, and this is a buying opportunity.” One could add to current positions or even start a position.
#3 – Boom, it took off again! So obviously this isnt an a-b-c correction Alex. Obviously this is not a bull flag forming, any more ideas Alex? Yes, I do, and I hope that I am right 🙂
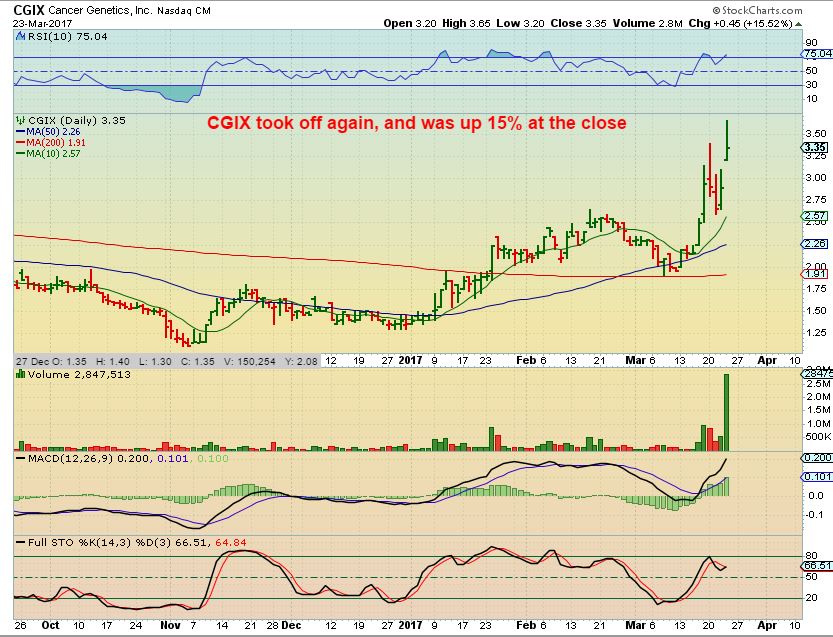
When I see a stock coming out of a long strong base and it BURSTS higher, then drops back, and bursts higher again…that just looks like a bullish move out of a base and can continue to make strong moves out of that base. You’re going to like this if I am correct.
.
Do the next several charts look familiar to you?
#1 OCT 28 – I pointed out that I loved this base and we entered around 40 cents, and the POPS out of that base confirmed the bullishness. This was our NAK trade.
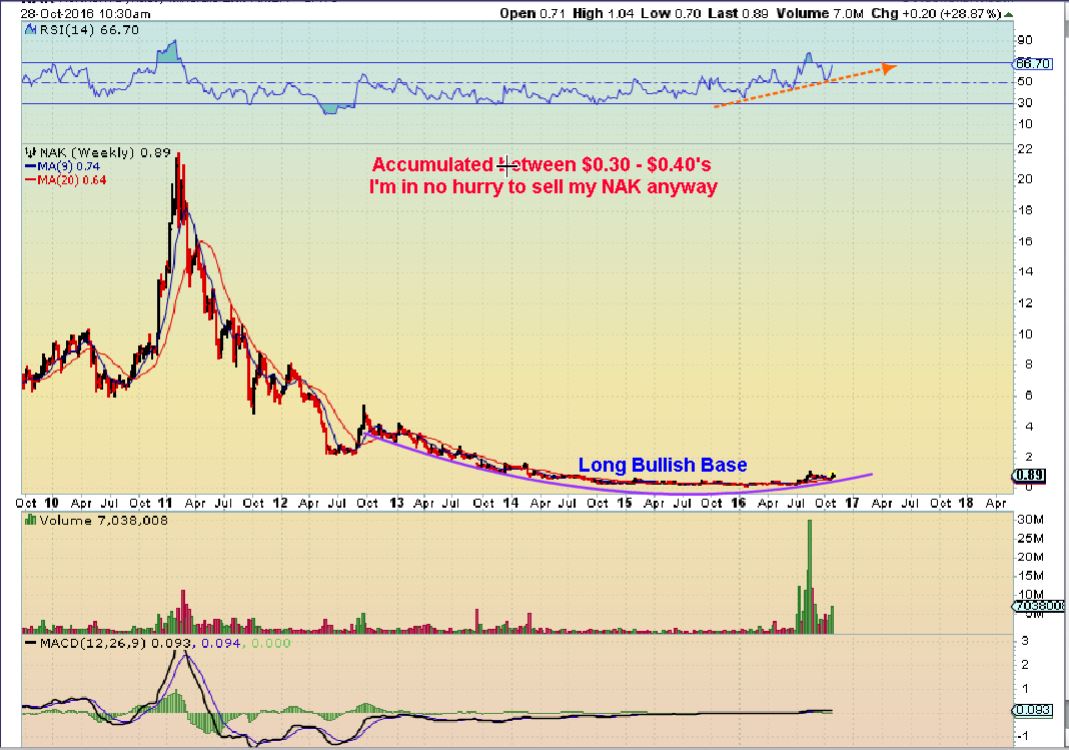
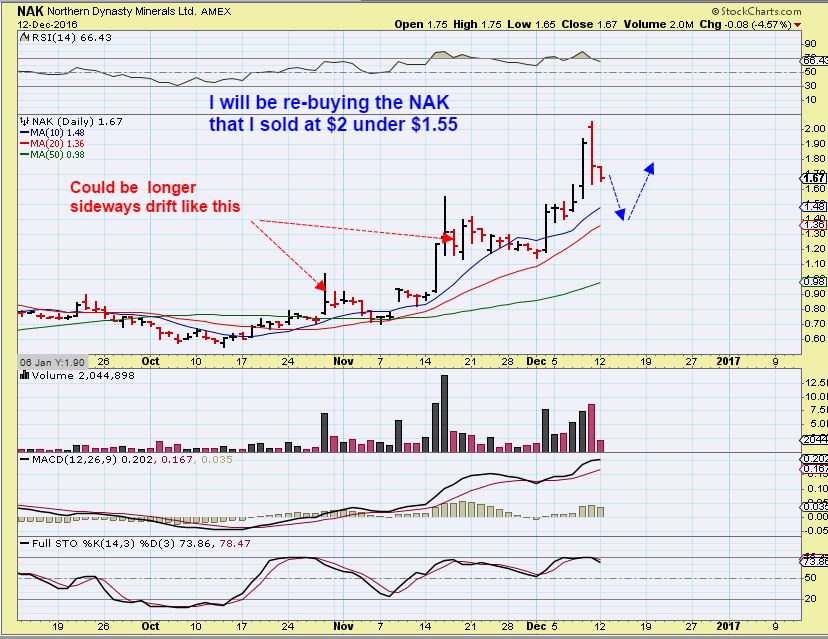
#2 NAK DEC 12 was Popping, and dropping to the 13 & 30sma at first, before it took a steeper ascent. We may see this in CGIX, but notice how it was a process. It wasn’t straight up like most people like to remember it. NAK was a game of patience too.
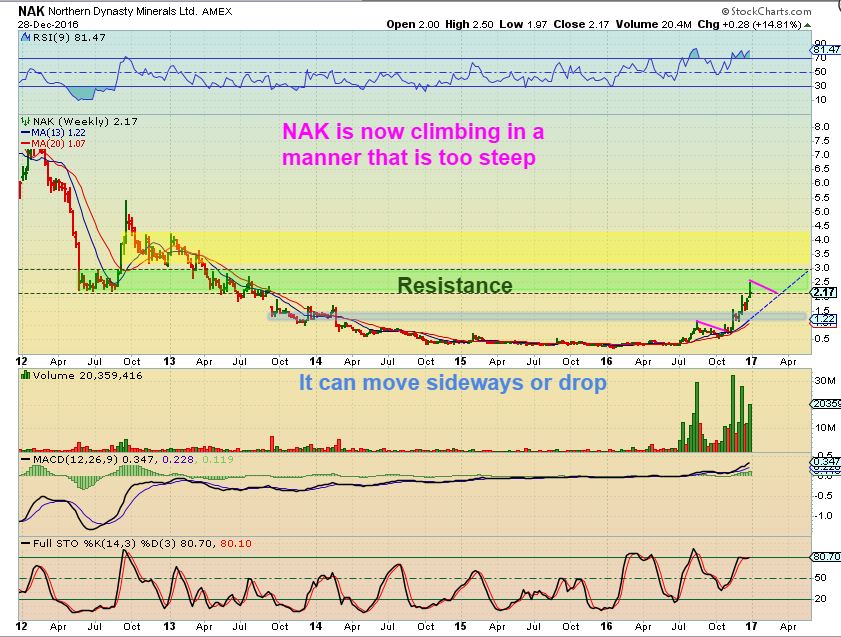
#3 DEC 28– Look at this chart and CGIX may act this way.
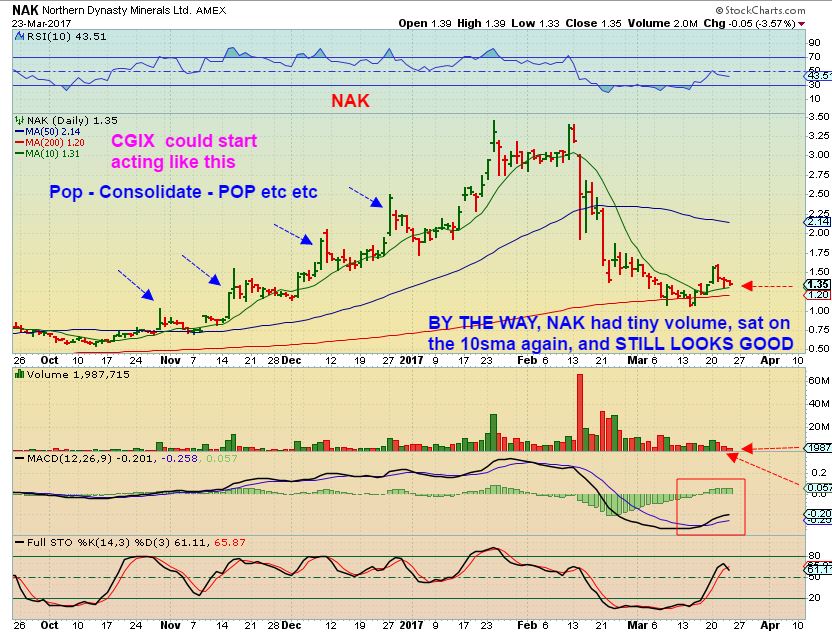
#4 March 23 – I’m going to “kill 2 birds with one stone” .
1. CGIX could climb in the same manner that we saw NAK climb on the left of this chart. I added on the dips all the way up, and it doubled and tripled in the following months. NOT AS EASY AS IT LOOKS, but rewarding for the patient ones.
2. On the right hand side of this chart: So far NAK itself has been selling on very very light volume over the last 2 days, and only tags the 10sma. I think NAK remains bullish here 🙂
Honestly it has been a very exhausting 2 weeks for me, with the FED RATE HIKE and all of the volatility, choppiness, and market sectors flipping bullish and bearish repeatedly along the way. My daily reports have been like long extended weekend reports. I can’t wait for the more normal ebb and flow of the markets. The fact of the matter is that there are times when we have tons of proper set ups, market sectors all proceed with a rhythm and flow that is much more predictable, and the trades follow through like clockwork. We have enjoyed those times here and made money on many many trades for months! And then there are the occasional times when things get choppy and volatile and it is just harder to make the gains. I try to just cover the markets at those times, but readers let me know that they want ‘trade set ups’ daily despite the risks. We have very active day traders here, so I do look for trade set ups, and some work out, others wont under these conditions. Please do NOT feel like you MUST trade under these conditions. Holding cash and waiting for the markets to calm down a bit is safer and patience is often rewarding.
I want to reassure everyone that the markets will settle back down to a very readable ebb and flow, and trade set ups will again become abundant. We just have to remember that at times like this, we might need to be patient and allow things to settle. I have mentioned that I keep trade positions small and manageable in this environment. We always need to know BEFORE we even enter a trade, where will I exit if this trade goes against me? In other words, always HAVE AND HONOR STOPS. I have said that repeatedly, protect your funds. No excuses. Sure, getting stopped out is frustrating, but losing 40% holding a trade that went against you is a bit worse, right?
Enjoy your Friday trading, and have a great weekend.
~ALEX
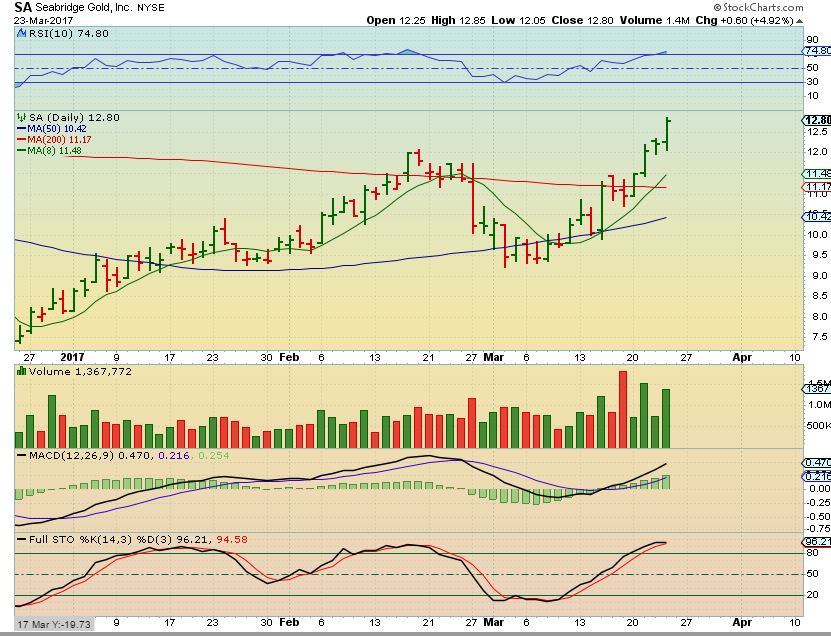
SA – I mentioned that I was watching several bullish looking Miners, some that were just ‘average’, and some are just plain ole weak. SA was a good one, and this was a beautiful chart.
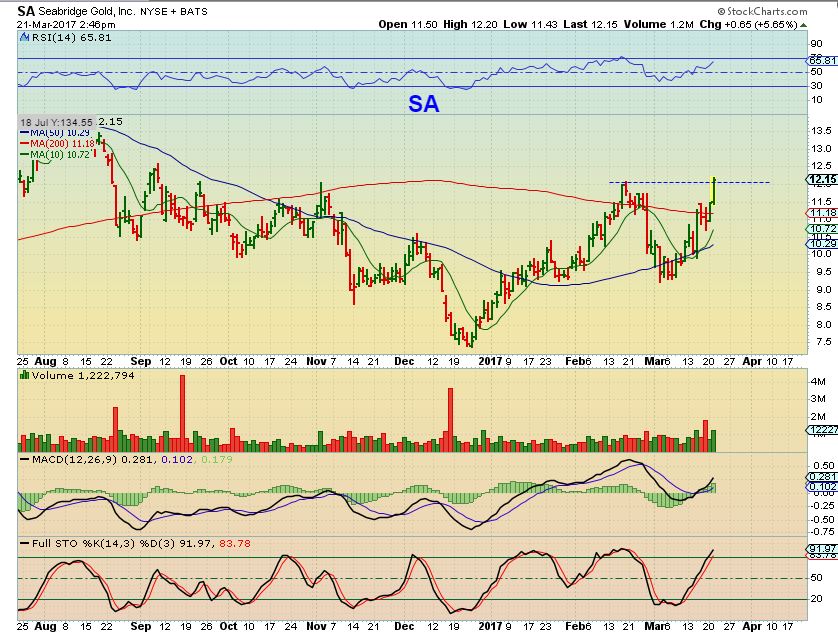
Thursday : It does make me a bit nervous when I am trading anything that shorts the Miners, so traders beware. We are still getting some Mixed signal with the choppy volatile markets. Be safe! 🙂


Hey Alex: are you expecting an ICL in gold in April or May at this point? Or is it a TBD kinda thing? Same for the miners: you expect they bottom along with gold? Appreciate the insightful reports:)
Hi Mark- I do expect the Metals and Miners to bottom with days of each other, and we should get a dcl into April that COULD BE an ICL, or it may just be the 3rd daily cycle low and then a 4th weak daily cycle could also roll over into what would be the next ICL in May.
So I would say that it would be more of a ” Lets see how the 3rd daily cycles sell off looks, as it drops into its dcl, possible ICL”
Got it. Thanks for working OT on all this stuff. We need a trend:)
Exactly – We DO need a trend! Enough of this bucking around stuff
Historically, end of May has been leading into the strong seasonal buying season.
Hi Alex, thanks for the great report; its been choppy for sure.
Should be real interesting to see if the 99.19 holds on $USD
Have a great weekend!
I agree Zig, the USD should be putting in a low and a bounce any day now. These markets battling between the bulls and bears have really been quite….. zig zaggy 🙂
You have a great weekend too!
At this point, I have Gold spiking up, and I see JDST up 15 cents to $14.70. Odd.
I feel like selling a bit more pre-market just to lock in gains 🙂
Weve seen miners struggle with gold spiking before. Usually a sign of a top, then miners lead gold down.
Yes, Miners often lead and so far they have just struggled at that 50sma. Maybe they burst through in the short term, maybe they continue to just struggle as thy wait for Gold to finish showing off.
Another thing that we often see is 8:30 a.m. Eastern time spikes or directional moves.
Countdown t- minus 1 minute 🙂
That’s when the COMEX metal pits open each day! 🙂
Yeah, I was kinda pissed to get stopped out of JNUG this week (vs getting out on my own terms). But it’s only lower now so guess that ended up for the better. Ended up with enough chump change to buy a few happy meals. Disappointing but that’s better than taking a loss!! (And I can sleep at night).
It just dropped to $14.55 . gonna be another one of those amusement park ride days – lol
KSHB I totally missed this move 🙁
XLF:
I like this set up CF. I understand and respect your opinion above but she broke above resistance yesterday and All my indicators are indicating the bottom is in at 23.23……the risk/reward is excellent imo at less than 2%. Long June Calls.
Caveat: CONGRESS !!
Is GEVO breaking here Alex?
Methinks that gold is making its final move higher. But miners do not appear to be following, to any great extent.
Agreed but will it go out with a BANG or a whimper?
I wish I knew. I do think that the USD will make a significant drop, but I don’t know if gold will take out its Feb high.
The “obvious ” resolution based on the widespread view here is that gold and especially miners will fail here. Of course what is obvious does not always play out. Just a guess, but one last final burst higher, above the February highs accompanied with miners rising strongly could end this move just when the doubters jump back in. How high gold goes here will play a key role on what type of ICL we can expect later. All of this is a “guess” so we shall see
Very plausible.
URA:
Bottom of C wave complete ?
I’m starting to worry that I missed a great buying opp in TQQQ. Looks like it may have double-bottomed on Tuesday and Wednesday. I was greedy, hoping for a deeper drop and tag of the 50 day SMA. Right now it’s back above the 10 day SMA and I’m starting to get bullish reversal signals on my daily chart. I’m going to wait a while longer, I have to be away from my computer for a couple hours, we’ll see where it stands toward the end of the day.
I think we could a bit more downside, personally. I’m still waiting a bit for market ETF longs.
Hi Maria,
Are you thinking (GDX) we are in wave 2 from the 18.58 – 25.71 wave 1
OR
still in wave 2 from the 12.36 – 31.70 wave 1?
TIA
hey zz
well … at the moment .. i have been following this pattern and I’m liking it for a couple of reasons … not the least of which is the similarity of the the price action – aka the candles. The move is ‘copied’ from July 2015 bottom into the first leg up of 2016. If this follows thru, it could be that we have wave “1” finished and we are now in “b” of ABC correction (wave 2) with the final C taking us ‘coincidentally’ into May ICL perhaps??? ;o) IDK I’m kinda liking it …. ?? Obviously this would mean the BULL is intact … and wave “3” would begin at that MAY ICL.
Note the similarities of the candles, and how they stay neatly in the channel until finally the break into C…
hmmm … in any event — it’s just a “what if” type scenario for the bull. The bear — well it just keeps heading south … lol … in which case we will make boatloads of cash shorting ;o)
btw – it is a 4hr chart of GDX
https://www.tradingview.com/x/w9Vo709Y/
refresh .. I added “chartfreak’s ICL – (the one he spoke of in today’s report) just in case someone didn’t read it yet….
edit 2 .. lol .. it was in the comments below..not the report.
oopsie 😉
GDX could be in a A B C wave 2 corrective wave or wave 2 complete wave 3 in progress…. imo. 😉
My “leaning” is wave 2 complete.
:o) I’ll take it!! :o)
Have a great weekend my friend…;)
PeaceOut
M
🙂 If your B is broken I shall be hedging very quickly…….
You too Maria…..
Ken, good point, the move down to 21.14 is almost a perfect 62% retrace.
hey Maria
That is definitely a possibility, I’ll be watching for the “b”. Hoping the “b” might go a bit higher to the previous high of 25ish.
I’m not going to complain if Ken’s count of 2 being done plays out.
Thanks for sharing!
My pleasure…
Yes..Me too!! 🙂
Hey, so what I am having trouble with is why did Wave 1 of 3 suck so bad? B/c Major 1 (Jan 16) ROCKED then wave 2 was one bad bitch. So, could this really be the end of B of 2 of 3 (meaning C is upcoming and the drop into the ICL) launching us into 3 of 3? If the long term BULL is really alive, Major wave 3 should get us to 1500-1550. So, we’re gonna need more than a couple days of +$6 gold for a few days to get there.
Anyway, I’m good with the short-term moves in gold, but struggling to put it into the larger multi-year EW context. If you figure out the answer, I’m right here reading it, yo!
Why did wave 1 of 3 suck so bad………
Two tin foil hat theories………..
If this is a bear market rally then the chart should look like this:
http://schrts.co/W3JVrC
For the bear market rally, wave C would be 5 waves up;
wave1 (already done is +7.13
wave 3 would be +11.55 (1.62Xwave 1)
wave 4 would be -4.39 (.38 X wave 3)
wave 5 would be +7.13 (equal to wave 1)
Second tin foil hat theory is we are in a new BULL market, then …following the same chart
A= wave 1, B= wave 2;
Since A or wave 1 up was equal to $19.34, and C up on the chart is equal to $16.85 to get to 35.43 target then I would say that in the new bull market theory that 35.43 would be minor wave 1 of 3; so now the chart would look like this for the Bull market camp:
http://schrts.co/W3JVrC
So if we are in a new BULL market the reason 1 of 3 sucked was because it is only a minor 1 of 3 and 1 of 3 should end up around $35.
When I updated the second chart below, it messed up my first chart.
The first chart should have looked like this:
http://schrts.co/LP8bNm
here it is on a weekly… think it’s easier to understand AND I labeled it a bit better for those who don’t use EW …
https://www.tradingview.com/x/BKCcB7Fi/
I just cannot place the wave 2 of 3 ..because I’m not sure we have finished — until we see it spring to life..;o)
So impressed with your reports Alex. Each report seems to be so on target. And I especially appreciate your advise on how to think about what to do or not to do in each situation.
Yes I agree I like your thinking on NG…. they will usually run the stops on NG report …. I have experienced that before good to see you mentioned on your report. I think April might be ICL might test Dec lows in Gold… just my thought. But dont like miners here… USD USD/Jyp at dcl low. Of course if Marine Pen wins in France …gold could shoot up like crazy…
I’ve sold my remaining speculative gold and silver positions now, not wishing to hold over the weekend. There still might be a pop in both, but if that happens I don’t think it will last long. I am now pretty much all in cash, waiting for the ICL in a few weeks time.
I’m still long-term bullish on gold – I continue to hold a core of 10% of my net worth in vaulted bullion.
I have a few core positions left, but similar have exited all but one “shorter-term” trade. Moved on to a few bios and tech plays along with Nat gas.
Yes, I should really do that as well, but I’m held back by a desire to sit on my hands a bit, and focus my energies (and capital) on a possible fat pitch in miners.
EOD ramp up in JNUG
So much for that….
Does anyone have information on New Concept Energy Inc. (GBR)? It has just gone bonkers and wonder if it might be a buy out?
In answer to my question I got this from seeking Alpha but this is dated 2014. Does history repeat itself??
http://seekingalpha.com/article/2169443-new-concept-energy-up-50-percent-solely-as-a-result-of-meaningless-stock-promotion
Crude Oil ICL now possibly occurring…….long USO calls.
Alex, Since no one has mentioned it, CGIX had a great day, as you expected. Thanks!
Yes, some of NEED the repetition. (Ian talking about ME!).
alex im broke and busy so I’m ducking out for a while but I’ll be back
Thanks for being here all the time that you have, hope to see you again in the future T.Y. 🙂
for sure, I enjoyed my time and I’ll still be here for a couple of weeks until the next billing period hits. I, liking the CLF setup right here