
Friday 3-17-2017 TRADES
The markets have not changed very much from the Thursday report, and I’ll be discussing the bigger picture in the weekend report, so today after a brief GOLD & MINERS discussion, I want to just discuss a few trades.
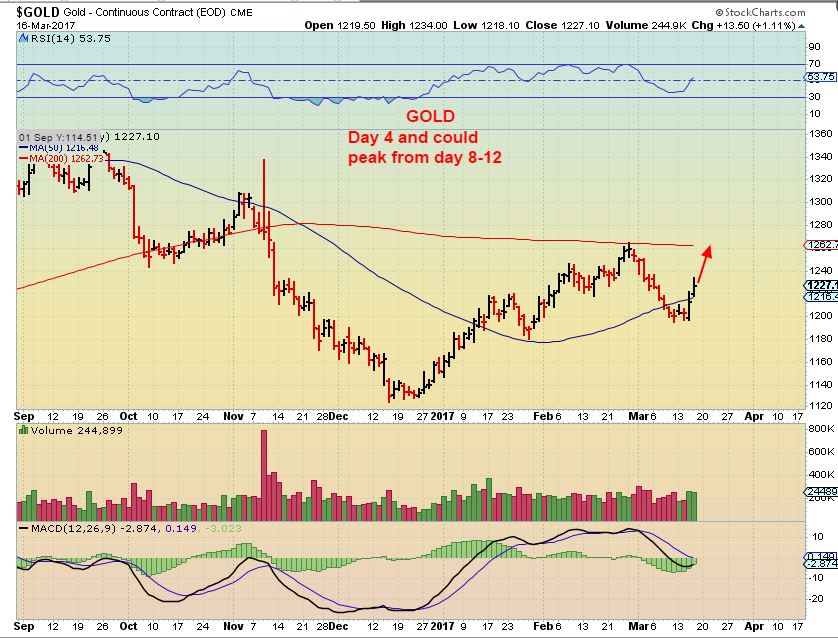
Just as a reminder : GOLD has put in a swing low to start the 3rd daily cycle, and I would expect it to reach the 200sma. If this is a 3rd daily cycle, it could form as Left Translated and top within 2 weeks of the lows. Trades should be considered short term going forward and we can then watch for more signs of strength or weakness around the 200sma.
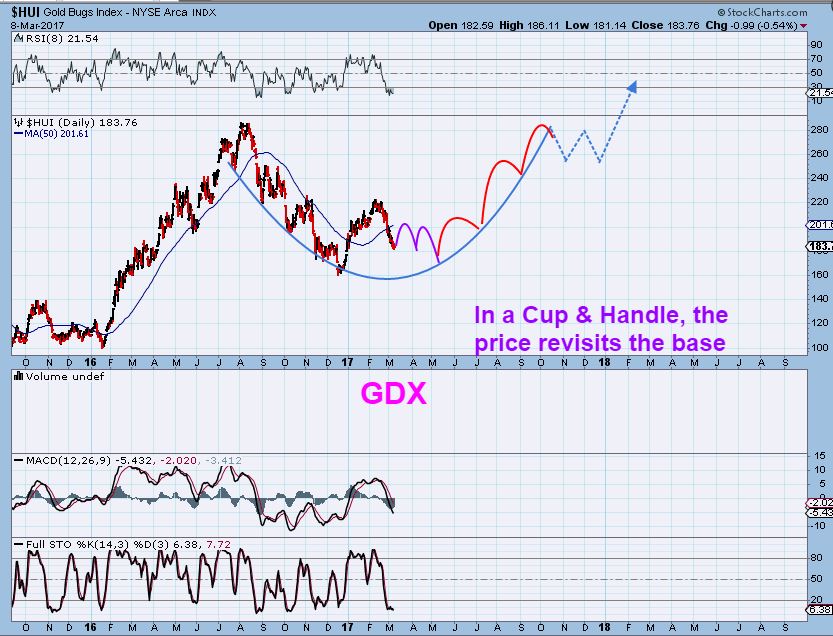
Reminder #2– So at this point, as shown on this chart that I posted back on March 8th, I have been expecting BOUNCES IN MINERS, but not a long term rally right now out of this low. Miners can be traded or purchased for the bounce at the lows as mentioned yesterday, but so far it may just be a short term trade for a week or two. We will have an EXCELLENT place to buy in the future at the next ICL, and that will be a great place to buy & hold Miners for a while. I will discuss this more in the weekend report.
URANIUM AGAIN?
After a nice run in the uranium stocks weeks ago, we had to let them rest and consolidate. It seems that signs of life are perking up in a few, and others with similar set ups could follow along.
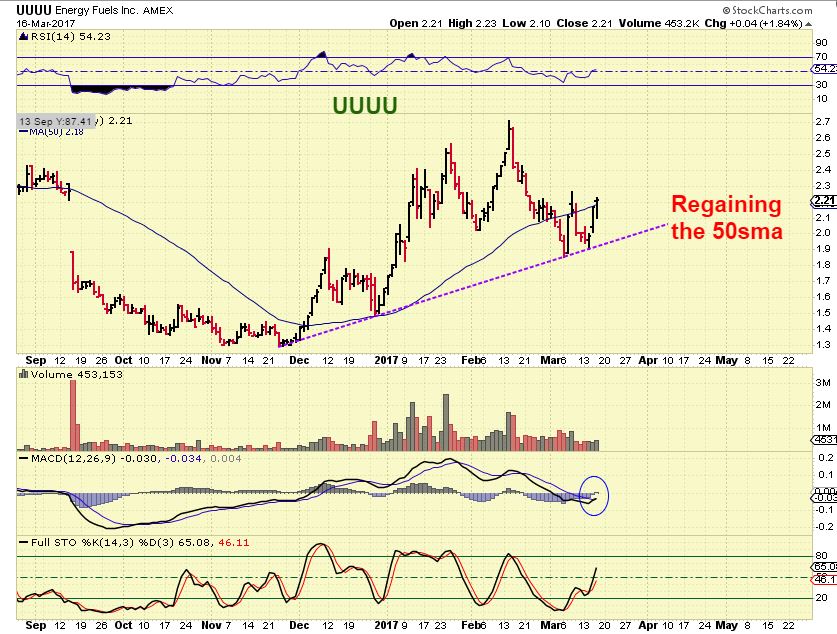
I’m going to post 3 Uranium stocks and I want you to notice just how similar these set ups are. If 1 of them breaks out, will the others follow? It is possible, so we’ll start with the one that broke out above the 50sma yesterday.
URG – notice how it consolidated before breaking above the 50sma. I’m hoping for a run to former highs ( And possibly more).

UUUU – I own this one and added yesterday just in case it follows through with its break above the 50sma
UEC– Such a similar set up, I’m expecting that UEC should break out above the 50sma
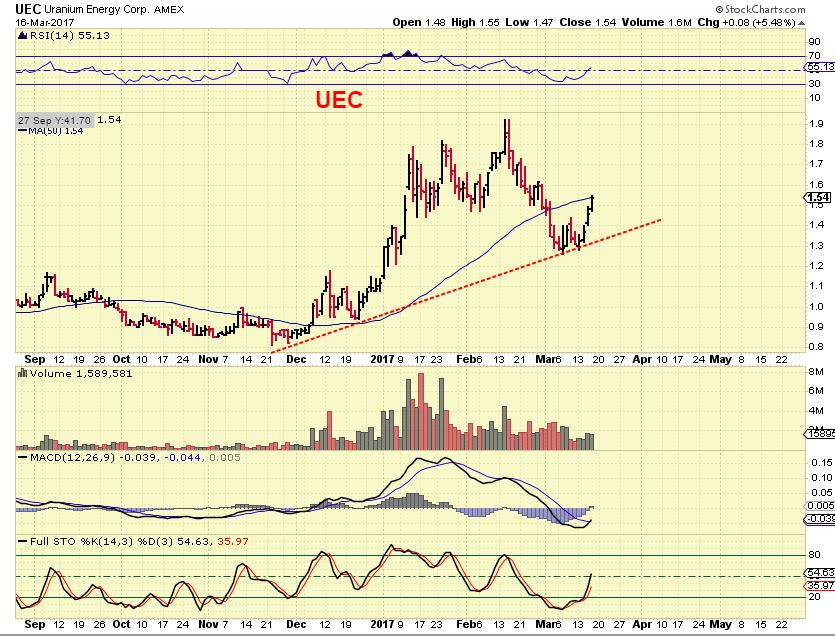
The above Uranium stocks all dropped and formed a trend line higher , are attempting to get above the 50sma, at a MACD cross over point, and reached oversold on the stochastics. They all look the same and URG seems to be the leader, so I will be wacthing URG for signs of strength. I think that any of these can be bought at the 50sma
VALE , CLF, X, AKS,HBM, TGB, etc – These are valid trade set ups as mentioned in a prior report, but they are not just busting higher and running straight up. I recieved a question : “Is there something wrong with them?” Answer : ” Not at this point, but many of the recent trade set ups are just not explosivley moving higher like we have been accustomed to in the past. This is normal and we have our stops under the lows and just have to wait for the trade to play out.” For example :
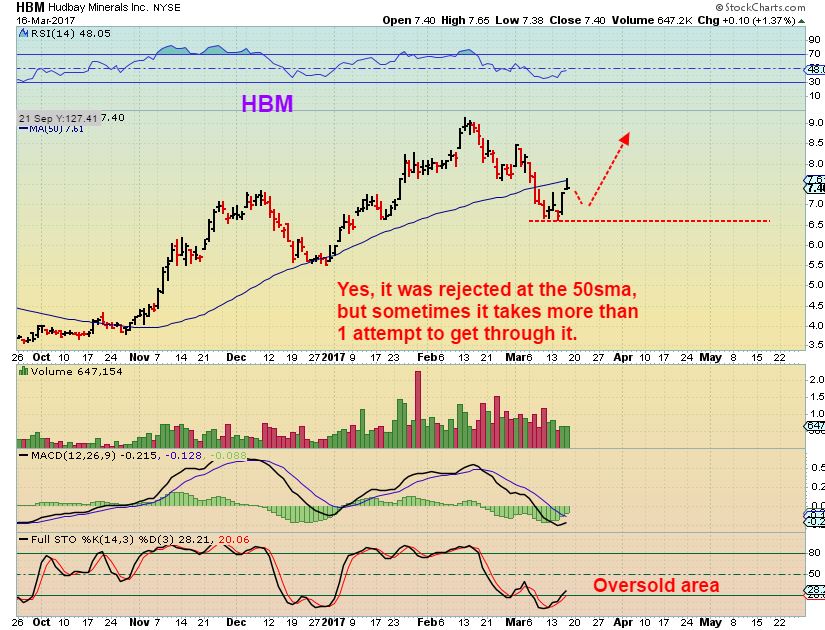
HBM – I recommended it here yesterday, feeling that the lows would be a good stop and this is comparable to TGB, which looked good.
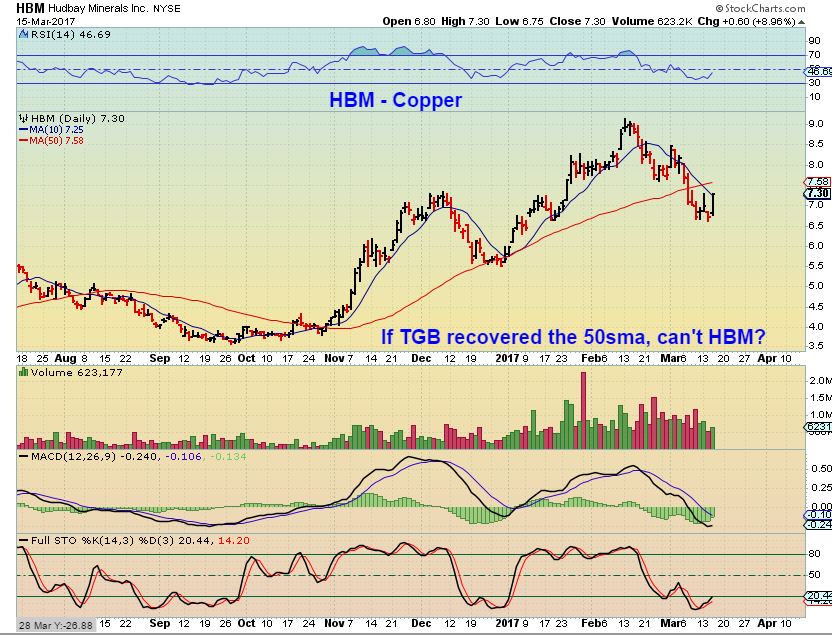
It tagged the 50sma & dropped, and I was asked, “Should I sell, is something wrong”. When you take a trade like this, your view is that it cant drop below recent lows and you are going to allow it time to see if it can continue to work its way higher. These are not necessarily do or die 1 day trades. Give it time.
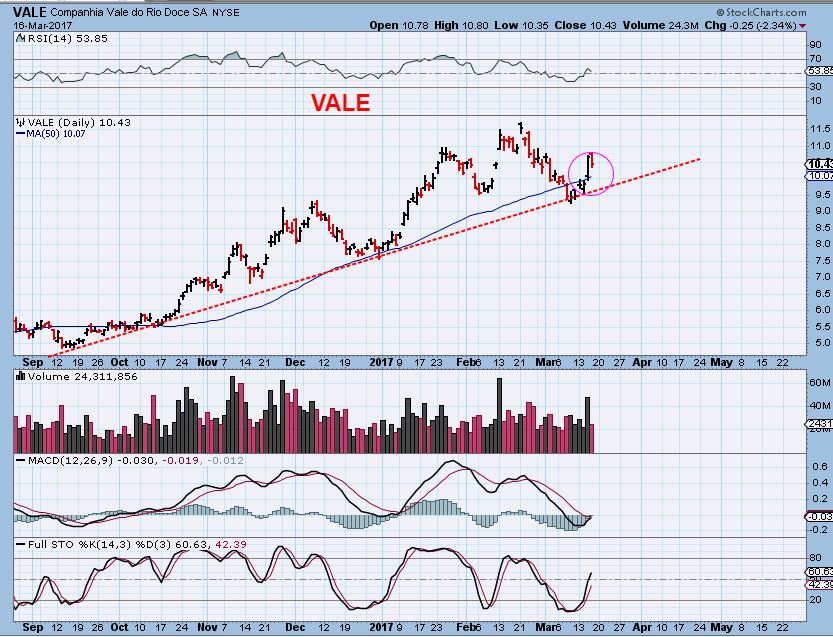
VALE – It dropped yesterday, but it is the same set up as before. It doesn’t have to explosively move straight up to be a good trade. I often add on a dip if I see that my original entry was acting correctly.
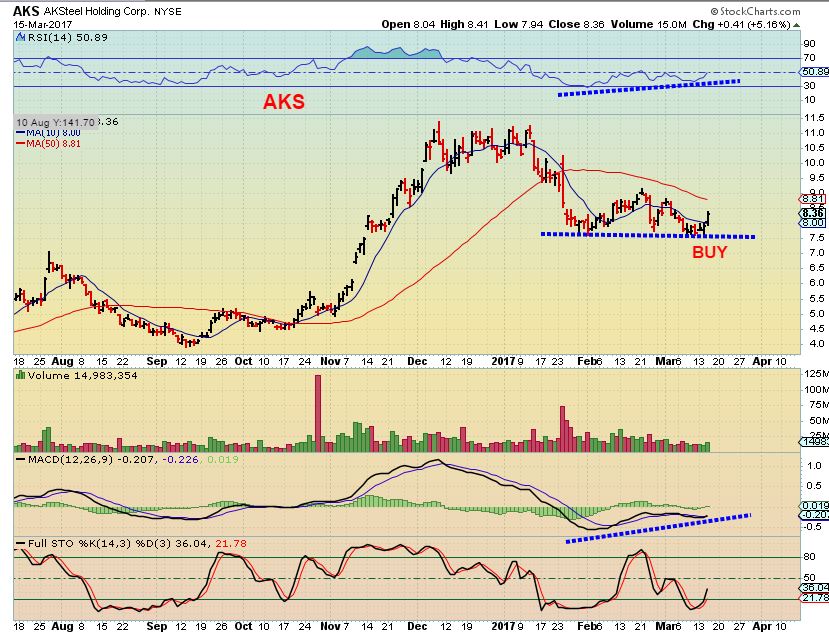
AKS – From yesterday – I like the divergence, but MANY set ups are just moving slowly and trading is rather slow at this time.
SHIPPERS
I dont know if you saw this, but many Shippers went ballistic yesterday. TOPS was up 109%, GBLS = 56%, SINO = 23% , and then some were just DSX- 7%, ASC – 6%, DCIX- 12%, STNG – 10%, etc .
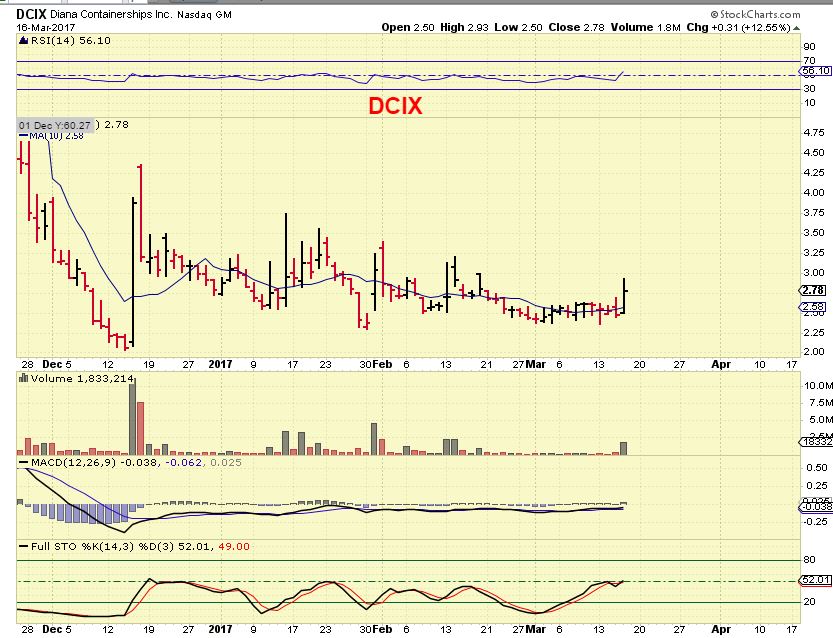
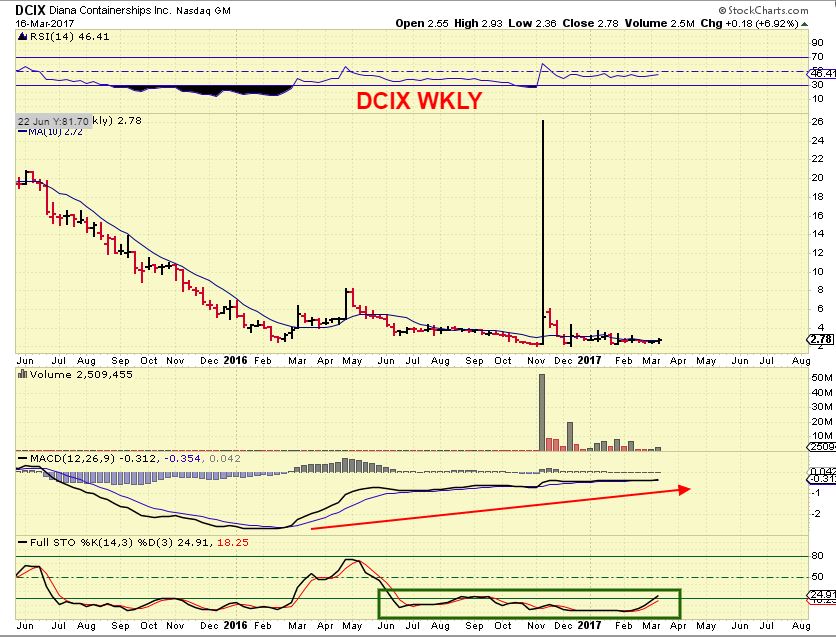
I’m just going to show one here today, but you can run through that list above and see if you like any of the others. I liked DCIX weekly chart and daily, so here it is.
DCIX – 12% pop yesterday, and it has been doing this a lot , peculating. To be truthful, I bought it , sold it, bought it , sold it a few times and am just about break even 🙂 BUt this set up looks like it will one day break & RUN, that is why I have been trading it. One of these days, this could just take off if they do not release bad earnings or other bad news.
DCIX WEEKLY – This is the other reason why I kept trying to trade it hoping to get in on that pop & run if it came along. Upside potential could be good.
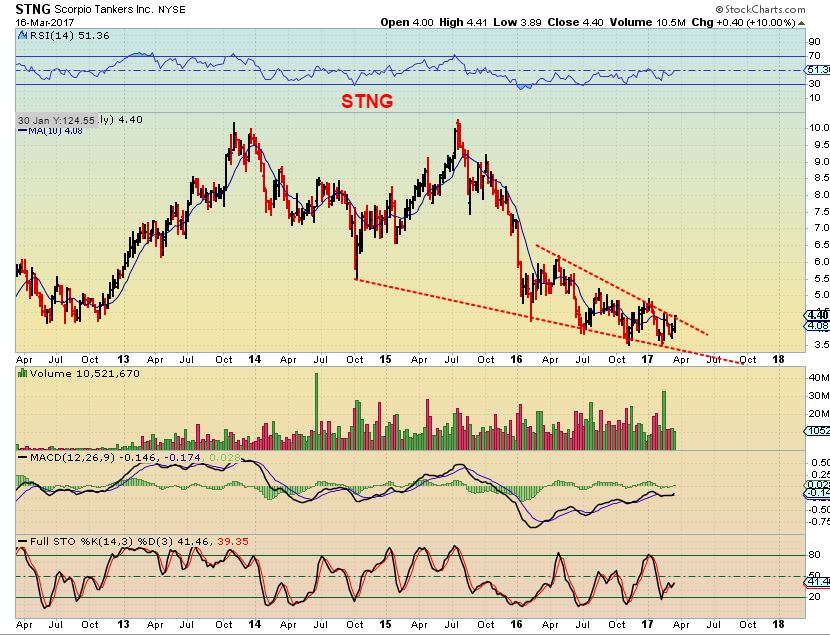
STNG WKLY – this has potential too.
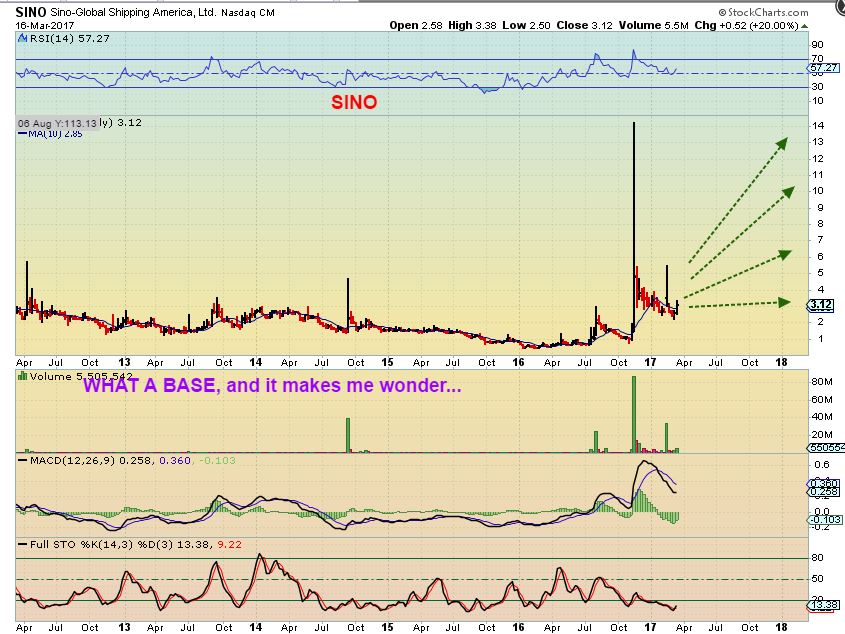
SINO DAILY –
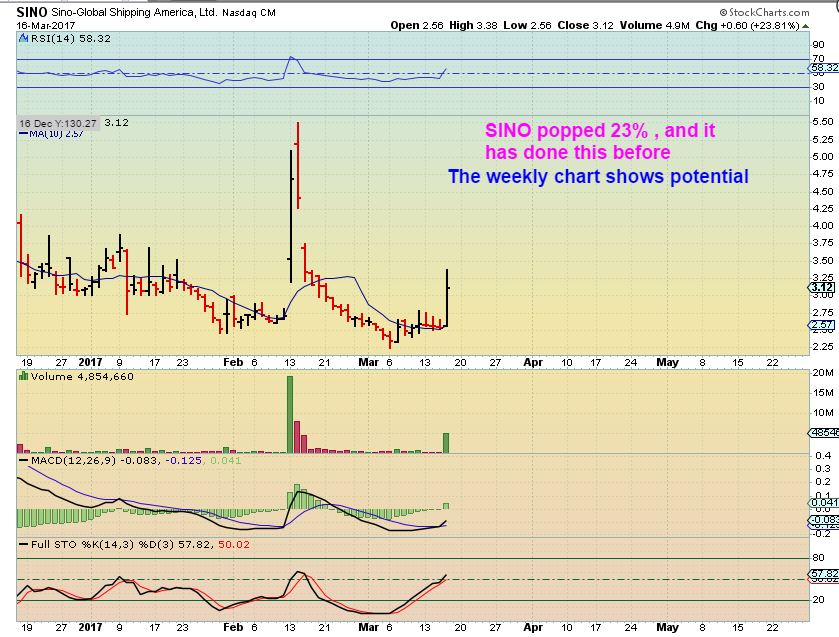
SINO WEEKLY – Oversold
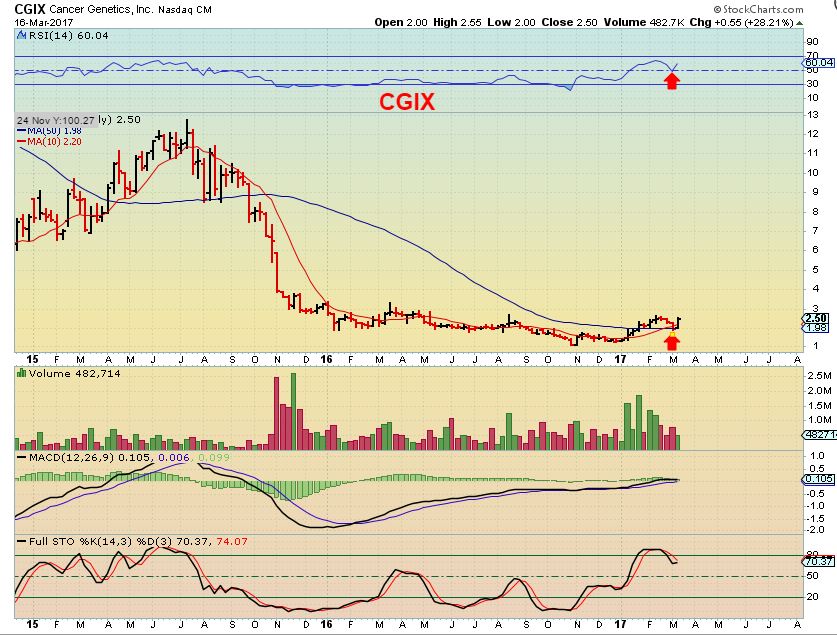
CANCER GENETICS
CGIX – Biotechs can go BOOM & BUST very quickly too. This happens to be the biotech stock that I bought years ago as a ‘BUY & HOLD” due to their cancer research and I liked their story. I doubled my money quickly on it when it was in the teens running to the $20’s. Then with an FDA trial rejection, I lost all of my profits when it gapped down massively and I held. It dropped below $10 ( seen here) and I sold it for a loss.
It has now formed a nice long base and I actually like this steady set up again. This is a weekly chart and it regained the 10 weekly MA. I do not own this, but it is cheap enough and bullishly set up enough, that I may BUY & HOLD again 🙂 The volume recently has been bullish.
Let me conclude by saying this: There are times when everything seems to be setting up bullishly and we are trading the daylights out of the market. Many probably remember when sector after sector lined up and we had tooo many trades setting up and not enough money. THOSE TIMES COME & GO AND WILL RETURN AGAIN. Our cycle timing proves that to be true.
I am holding more than 50% cash still, I am patiently trying to wait for the FAT PITCH, and trading with the limited set ups that we have trying to make a little extra cash. Some trade set ups are following through, others are just churning sideways and consolidating, not really paying off at this time. It can be boring, and frustrating, but please know that we will be making great trades and fast money again in the near future, and if you have just been patiently waiting on the sidelines, you will be rewarded for that too. I will discuss this in the weekend report with the bigger picture. Enjoy your Friday trading & the weekend!
~ALEX
.


To continue with the trading conspiracy theory stuff, I want to show that the “signal trades” I have been posting appear in other sectors. I see those long tail candles most often in SPY which is the most popular way to trade the S&P. Check out these signal trades from Wednesday’s AH and yesterday’s pre-market for SPY. They have a bearish price target around the $237.00 area. As you can see that they are on their way to their goal in the early pre-market trading today. BUT if you look closely, you will also see a “signal trade” candle with a long tail UP to about $238.50 … so bulls and bears are battling each other.
Of course, please remember that this is “tin foil hat” stuff and not to be taken super seriously.
https://uploads.disquscdn.com/images/c0f7487c1efeae45c66236a4def50fcae9df4597fa8130412bdb6d786ec08a3a.gif
https://uploads.disquscdn.com/images/685232b1c66427603890cfefbdee575a35ca626ab5745e90f7b9f14d287d6049.png
I don’t see any of those long candles on tradingview. Is it platform specific?
They only appear in certain trading systems. On another trading forum a guy who goes by “Mr Miyagi” posts these candles a lot because most people can’t see them on their trading platforms. I use Schwab StreetSmartEdge for trading, but they don’t’ show up on my StockCharts.com account, primarily because that service doesn’t show pre-market and after-market action (as far as I know).
Mr Miyagi, I remember him and his long wicks……
tempted to make a joke, but discretion won out.
LOL, well Steve, this is an Adult show!
Perspective & perception.
You can make money on short term time frame trades if the candle wicks in premarket & after hrs really do prove to play out, but I wanted to point out perception & perspectives too, just for the fun of it.
That 15 minute chart can distort perception ( For those not used to looking in different intraday time frames). It looks like the SPX would have to absolutely DIVE to 237, and then the Bulls would have to push things higher in a HUGE PUSH to the 238.50 area.
Just to put that ‘battle of the bulls and bears’ into perspective – outside of the 15 minute chart
refresh
Yesterdays candle was pretty much in that range, so if it opened at 237 and closed at 238.50 – you’d get a normal reversal day.
Just another way of looking at things for those unfamiliar with a 15 minute or 5 minute chart and the apparent extremes exhibited. It is similar to a huge drop on a daily chart, and then it hardly shows up on a weekly chart. 🙂
https://uploads.disquscdn.com/images/3609ed88920a7bcaf821f88d4d531f224b7af05cccd8e5fbcd6f95155477b24a.jpg
Cheers Alex.
Cheers Daz – I’ve read all of your posts over the past few weeks, seems to me that you have a little bit of a “funny guy” hiding inside, huh? : ) Made me chuckle a few times.
I see URA up in premarket ( Uranium etf)
URRE doesnt seem to be following the other U’s
Yet. there are leaders and there are laggers. We’ll see.
Some scary “signal trade” candles in NUGT yesterday and today. Miners look like they will open as a “sell” on my 15 min charts, but that signal could quickly reverse to a “buy” with a slight pop after the open.
https://uploads.disquscdn.com/images/d3c20569a32c86fc0cb095494b0885779dd495df111816e8f7a74ae3c5cc1a5d.png
Thats a $1 – do you have one for JNUG? I would expect it to be the same if you do.
No long tail candles for JNUG or GDXJ. And right now, we are getting a bit of a pop in NUGT and other miner EFT’s like GDXJ and JNUG.
BTW, my daily charts for GDXJ/JNUG look pretty bullish, as you know I don’t follow cycles much so miners are “all systems go” for me … for now. I never try to predict more than one day out.
Thanks – yes, I see that Pop for now
As posted yesterday, “max pain” for option traders in GDXJ is $37.50 today on “Quad Witching” day. That’s right about where it is right now. When do options expire? At market close?
NUGT is outperforming JNUG today for a change and it has flipped to a “buy” on my 15 min chart.
Take that “Big Boyz!” LOL
NUGT up, JNUG down? Weird.
…is that like weird?
MEOW
#CG happy Friday
😀
ditto
*stairway to haven
Led Zep day is over, you messed it all up with your Geddy ness
https://youtu.be/7VwleyTT50o?list=PLKx7-YU9eVr261FVPMEmwzUJWCxTIMzdD
Little Friday Tune
Mellow
Alex, all. What do you think of the LABU chart? Daily looks good, slow grind higher. Hourly looks double top and probably lower prices short term, IF the 100ma doesn’t hold. Probably drops 5% to 49
Kind of looks like a double top starting to roll over a bit. XBI & IBB too.
IBB dropped already, XBI looks like IBB yesterday and may follow.
Confirmed, thanks
I’m in it but keeping it small for now, methodically adding on dips.
UUUU break out on the 1 hr chart. Looks good
.. then unfortunately dropped 3.5%..
Broke the trend line on the 5 day chart . 5 day hrly, 5 day 30 minute 5 day 15 minute.
Lately many trades are not getting the follow through. They just keep consolidating.
5 day?.. is that not the same as the Weekly?
No-
try a chart covering 5 days only, using 15 minute (I’ll post it if you dont follow what I’m saying).
ah ok.. see what you mean now
refresh
It’s basically not a big deal in the daily, but it does show that the consolidation continues and not the break out at this time
https://uploads.disquscdn.com/images/9c4d56c597816102dddea197d142cd91c02a3a5694a415e8160d10cba2630e6c.jpg
I don’t like the look of that! Get back up there above the scary red line.
Yeah, but the daily chart is still fine. 🙂
pshew
Sorry, I broke it…as usual…right after I buy something…timber!
ok Nancy.. you must make amends.. sell it now, make it go back up 🙂
I think I will give it a little more time…I decided on some diversity away from metals so bought uranium and SINO shipper…..both promptly dumped! I really have a knack.
You and me both, girlfriend! I always screw it up for SOG!
?? Im seeing a crack sir…
looks like a fakeout on my hourly, unless its just playing with us
Agreed, pulling back from double top, oversold now on the 15min chart. Lets see if we get a move higher now.
Daily chart looks fine to me , so the longer time frame seems fine. I’m still in it.
Heres what I see. Trend line break but possible Double top for sure, BUT a higher high on the hourly chart, and a big ole, almost perfect, BEARISH BAT pattern playing out. So If we do get past the double top, we should make a run higher to the $2.60 are. Just my 2 cents! https://uploads.disquscdn.com/images/4d3f7c9420f4b731958a83b4ba3b82136f79c61f2771691ca3dce3df66722bb7.jpg
annnnd there goes JNUG
Looks like those “signal trades” for JNUG are going to hit today … $6.75 has already hit waiting on $6.53
….play spooky music here as a background for your statement.
On one of my screens I thought I saw it hit $6.57, but now I can only find $6.59 hit…weird..depending on which way I pull it up I’m getting different “lows”….
..more spooky background music…
Coincidence? You make the call.
https://uploads.disquscdn.com/images/c2e1c16a239250a440bc62820c215fde1f41159e7d65b7b3c2d162316c763de1.png
Shall we load at 6.60?
The low is $6.53 for the second one. I have a stop set below that.
Getting a starter here
There she goes…
Crazy 20% move high to low. Wow
JNUG selling off hard! I’m out. Looks like the “Boyz” got what they wanted. I’m becoming more of a believer in those “signal trade” candles.
Me too
Any candle wicks pointing higher? Could be a good BUY here.
Thanks for posting them. Can’t see them on TOS
JNuG nothing like buying the big red candles
Yes, looks like a stop run. They got my stops, those bastards! But I have bot back into JNUG.
/gc and /si could go now
Check out XCO with a 50sma and 10 sma, and volume. Hmmm, that is a rather interesting consolidation and looks to be building steam in an attempt to break above the 50sma
OK folks, send me a tip via PayPal for posting the “signal trade” candles. They really seem to be working! The UP candle before the Fed news predicted price would go up and the DOWN candles after the Fed hit too!
I will. What is your email? 🙂
LOL. Thanks, just kidding (sort of).
Steve, i really appreciate your sharing. Thanks.
Are you trading all of those fast intraday moves, YS?
I know Mr. Miyagi and I find it interesting, but I have never traded them .
(Also with Mr. Miyagi, I have seen them tail or spike and not fulfill for days and jump around a lot in between, so I never took them for that reason. Rapid day trading is not really what I’m looking for)..
Alex, I’m not. 🙂 just keep my starter position and watch. Believe me, I’m a chicken. I’m 90% + in cash.
Actually – I’m glad to hear that. When we get to the next ICL and it gets established and confirmed, you want to go heavy for a few weeks and you can really cash in.
Right now some of my trades are working, some aren’t , and it just chips away at ones patience. The follow through has been slow & tedious on many trades. It’s a tough trading environment.
Alex, I’m following you. 🙂 just cannot resist playing a little bit.
I know, I can’t resist it either – lol. The lure of a good set up and I think to myself that I just want to add a little more gains, but the lure of even a good set up in a choppy market is a tad frustrating. CLF, VALE, TGB , UUU, etc all should be moving higher, but the chop chop is hindering things.
Thats why I am mostly in cash. Small trades, small gains or losses until things really set up properly.
Was SO good in Jan. I couldn’t even follow all the setups. That will be back again soon enough. I’m learning patience but MAN, that has been a tough lesson!
I always need to stay more invested. I am too impatient to be in all cash. But I have diversified into bios and others, can’t have JUST miners right here.
Yeah, Miyagi used to keep a spreadsheet of all the long tail candles and track them for 10-20 days. Most either hit within 10 days or never hit. I still don’t know if I really believe they mean anything but after the past few days in JNUG I’m becoming a believer. I also believe in Bigfoot (seriously).
Is it that easy Steve, let’s see how the future goes.
Keep us informed with this excellent information.
Many THANKS Steve.
Here is a tip: buy low and sell high – do not lose money. Ha ha!
Thanks for your input. Nice site of everyone sharing. I am thinking that
this year is different in that the dollar is being lowered and other currencies
will rise – they have had enough time being strong. Time for them to weaken.
I am long New Zealand and Australian dollars.
Alex, Sorry to be such a tool, but in your HUI chart, you mention the ‘base’. Where/what is the base you are referring to? TIA
The formation of a cup itself is a basing process or consolidation process after a strong run up.
So price would not just run higher , but it would base out by returning to the cup formation ( roughly as drawn by me on that chart ).
I’ve just exited my miner positions. Still have a core in gold and silver, plus some speculative funds in 2X gold and silver funds to take me to the DC high. But, I just don’t like the behaviour of the miners recently, and would prefer to sleep better at night!
I will keep my powder dry for the next miner ICL…
I had originally mentioned that I thought that MINERS would bounce to back test the 50sma.
On a daily chart, look up GDX & GDXJ with the 50sma, so far that is exactly all they’ve down. They COULD break above as a false break out by day 12, and then give it up if the set up is still playing out that way ( The drop into a 3rd daily cycle dcl & ICL ).
I am debating “Dust” and “JDST” in small quantities for the drop into the ICL, but those are so difficult to trade, because the drop is often bouncy and jittery for a while.
Yes, I had this sort of thing in the back of my mind. A lot of unknowns cycle-wise, so I figure it’s best to get a bit more clarity first and sleep better. I am prepared to give gold and silver a bit more leeway though, as there seems a bit more headroom there.
Absolutely. There seems to be a little more time for MIners to show their strength or weakness in the longer time frame. They can bounce around until day 12 if they want, and that just gets frustrating.
And sleep…what is that?? : )
Good call on the rollover at the 50 SMA. I’ve been watching JNUG rather than GDXJ so I need to keep that in mind in the future. I bot back most of the shares stopped out in case this was just a stop run, but yesterday also looks like a short-term high so I may just give up for now.
Since it is still a bit early on Gold daily cycle, it is possible that MIners pause at the 50 and then break through, but when we got that flash drop Monday on miners and it dropped further, that was when I expected at least a back test on the 50. It ‘could’ break above it..we’ll see.
If it stalls for a long time, I will personally go short.
https://youtu.be/uMyCa35_mOg?t=23
That ICL is going to be a beautiful thing – It ALWAYS is a money maker.
And yes, the waiting is the hardest part!
….. innnnDeeeed
Is it possible that we just saw the ICL?
Hey Murphy Doc, for some reason, others have asked me this too. Someone else must be spreading this, I’m going to answer it at the top of the page for all to see. Thx
well… providing u dont get chopped up jumping in and out of things in the meantime…. ;o)
I have faith and trust in your experience and analysis to hack out a path -with your magic machete- .. through the dense brush to the elusive ICL …. where after patiently waiting, we will all live happily ever after .. and I will spend 8 weeks in FLA next year…
The End.
MVT
….. well actually .. let me think about that … maybe a desert Island somewhere… hell as long as im dreaming .. .. I’ll buy the Island and we can all snorkel sit around the Tiki Hut drinking out of coconuts and talking Markets …. while CF plays in his pretend band, and pecos stands in line for his Treehouse beer …
TheEnd2ndEdition
HA! So there IF we have Treehouse AND Alex playing Rockband!!!
Nice call!!
im keeping this guy close at hand …. I believe it’s my favorite gif to post .. ;o)
https://uploads.disquscdn.com/images/a25cc7314c60712be2e8d08cab7568bcb79e03c9ffcebfe74d94050c5715dd5e.jpg
Did you pick that price based on the “signal trade” candles that I posted?
Your candle confirmed my 15 min 200ma I use. I usually buy around it
JNuG reversal is pretty. Big flush, bounce to 13ma (5min), retrace 25%, now heading to vwap… what’s next?
Thanks CF for AKS yesterday. Took some: nice and green ☘️☘️☘️
I kind of like TGB too…broke above the 50sma and resting back on it, but I actually got stopped out of TGB, so I have that built in hesitation now – lol.
I took the CGIX trade on the drop today …see if I can double my money and give it all back one more time 🙂
POSSIBLY – this is a 1-2-3-4-5 and this would be ‘5’ concluding, but also it could be a legit break out and extend. Volume is good.
Interesting that NUGT did not have the same kind of slam down as JNUG. I don’t know if that is due to the underlying miners in GDX vs GDXJ … or were JNUG/GDXJ really manipulated down as per the “signal trade” candles I posted?
JNUG overheated from We’d. Had to give back, GDX less so.
There goes CGIX. Whew.
Light volume 5 minute candles intraday as it moves higher, that usually falls back. I may add if it falls back later today
Nice trade Alex!
Thanks Pat, hopefully we can get some more out of it. The weekly chart ( The last chart of this report) has a great base and I’d like to see this move up & out of that base.
Volume seems pretty good for 1/2 day too.
SPY “signal trade” candle revisited … came pretty close to hitting the low today.
https://uploads.disquscdn.com/images/4e851bf1e7642fb3817b4ecbead5b2febad8900f7c09e0c62bce03837c6a348c.png
Steve, 6.75 seems really the number they want to hit:)
Any of those candles on OIL or NAtGAS?
I don’t follow oil or gas, just miners. But if you give me a couple symbols I can check.
natgasusd, usoil, ugaz, gush
Bill, I can jump in for steve here – StreetsmartEdge doesnt allow us to see some of these tickers… Like natgasusd, usoil…
I can tell you, GUSH (low vol) doesnt have any tails)
UGAZ none either
DGAZ none
Thanks BayTrader, how about Alex’s CGIX or UUUU?
UUUU nope – CGIX Nope
Im thinking it shows up on tickers with higher vol and alot of AH and PM action. Most of the ones you called out have very little vol and litttle to no PM or AH action…
Yep, like Bay stated, usually shows up 9n tickets tickers that trade Futures like gold, oil, SPY, but not on low volume equities (URRE).
Most shop up in premarket and/or AH so you have to add that to your charts in SSE
I do… And none that he asked for show it… I should have looked up USO…
Thanks for sharing. My platform doesn’t have that either.
Here is one for USO with a bearish target price of $10.10
Follow at your own risk. 😉
https://uploads.disquscdn.com/images/3f0d554e5c762c320bc4827c9f35f2ae93772158acf8b44b41518d56e2841640.png
https://uploads.disquscdn.com/images/87cca34021a23f3f996ddac542f6908af39126085a7c87f19b16c9c4061a4a16.png yea I get it with USO
Steve, being that we both use SSE from schwab – I see them too. And due to the lack of “FUN” in the market right now, I picked up a few SPY options on this tin foil hat theory… Currently making some money lol
CF – OVAS
Nice base and already reported earnings. I’ll try to keep an eye on it.
I like some of the bios here. I’ll post a specific trade chart when I have time this weekend.
Man some bios Ive been eyeing for weeks… And never played em – watched them sky rocket….
I like the chart of PCRX. I’m also in SUPN but that chart isn’t quite as pretty. What are you watching? I kinda always keep an eye on XBI to follow the sector.
Man, CGIX hit $3.15 already today, and I had a first target at $3.20 using a FIB extension.
It could extend or may consolidate after this run.
excellent 😉
impeccable timing
quick short-lived spike on NAK
I was just going to say that, but it is still up 6 cents – I’ll take it : )
Been watching the intraday action on URRE… Entry at 1.74 so Im still good but its got the oddest movements. Price jumps and drops so quickly outta nowhere
On a weekly chart, I like it a lot. Pull it up on a 1.5 year and use only a 50 ma.
That has acted as support a few times. As long as that holds, I like it, but I cant tell if this one wants to go sideways and consolidate a bit more or not.
I think if the Uraniums run, it will too.
Never mind, I captured one for you- refresh
https://uploads.disquscdn.com/images/cab435acc6a2e9bdba0640b15c613c5169bdc7b93aa90731e97e5623e7a407ab.jpg
I got stopped out of MTL quite a while ago, but the weekly chart has put in quite the reversal from that plunge.
It has almost recovered to the area where I was stopped out.
Had to leave for a while….the only 2 gold stocks I’m holding (not counting the JNUG I bought today) are at losses from a while back…..they surged FED day like everything else but today have already given back and are back where they were pre FED….wow.
So JNUG up and down a bit….the last few minutes it is bobbing around that $6.50-$6.53 area…..$6.53 being one of those long tails Steve mentioned….maybe they let it go way under…then up and now this 2nd attempt at this area didn’t let it fall below the $6.50 area and now is going back up….so maybe this place is where it will launch from…..one can always dream….see..it was a code….just have to know how to read it…wink wink….
Make sure you have on your tinfoil hat when you try to decipher it!
I do, I do! You should see me!! 🙂
I nibbled either way. Buying at lows is SO much more rewarding than buying the tops!
ken .. you still following Wheat?
Looks like I’m not going to get filled on MNTR. See everyone next week. #allCashChef
nimble on some NAK before you go : )
nice eod for NAK
still climbing aftermarket.. +17%
Which stock is climbing +17% SOG ????
THANKS…
NAK was up… think it then dropped back to about 1.40.. sorry, don’t have chart in front of me now.
i suspect it will drop back even more anyway in next few days
SOG!! So your saying that it was a phantom spike, secret A.H. message, telepathic indication that it will go there Monday. Thats it….I’m ALL IN.
GEURT- I am just kidding, do not go all in 🙂
Giggle
wow… look at that standing tall on the 50 on the weekly … hmmmmmm
Exactly
And I did. Yesterday. And Tuesday. 🙂 Almost made back my loss from The Big Short today (that does NOT include all the gains from earlier! Only my final trade!).
Have a great weekend all …… 😉
you too M
So I am being asked by more than one person, “IS THIS AN ICL that we just had?” Or what are the chances.
I am not one to say “Never” in a market, Anything can probably happen, but look at the probabilities and it is almost nill chance in my opinion. SLIM SLIM chance. It would be very odd, so Lets just look at a few of the facts.
Most ICLs used to come 2 times a year. 6 months apart. I’ve seen some at 5 and even 4 months apart…
but 3 months apart..Dec to March? It has never happened before that I know of.
Think about what we are looking at in addition to that…
2
daily cycles in gold , both right translated ( A very bullish set up)
, and then an ICL? ICLs usually come when GOLD looks very bearish and
looks like it is going to crash, and everyone is afraid to buy it.
I just dont see how it could be an ICL.
Now take a look at NG today , KLDX, SAND, MUX, – Gold was up
IF IT WAS AN ICL – We will still have plenty of time to identify it and profit from weeks of upside, you just wont catch the very lows of this one. I still think it is 1 or 2 months ahead of us.
BUT 3rd daily cycle could still hit cycle highs, even in miners. In a BULL we would expect that. I’d love to see GDX get back to the 25.xx range. But based on your advice I’m probably going to cash out here before too long. Thanks for keeping it real, brah.
Yes, this is what is confusing me – We had a higher high on the last IC low, so this should mean we have started a new bull market, therefore this 3rd cycle should be a strong one? Also, the last cycle was extremely right translated, meaning a higher high surely to come? I keep reading on other blogs about seeing this cycle failing, BUT, if it did, then surely we would see gold breaking the December low? and then back to the drawing board. How then would we ever be confident of seeing a gold bottom? if higher IC highs happen even in a bear market? I am v confused.
So that’s the issue. Gold was right translated setting up for a higher 3rd. But Miners were Left translated. Not sure why the dichotomy. Fed did have something to do with it. Alex isn’t guaranteeing the 3rd cycle will fail but wants us to be guarded. Not a time yet where we can go all in, leverage, no or loose stops, etc. While gold was stronger, it didn’t have any of that raw, rip yer face off power it did winter 2016.
I’m a fan of Alex’s cup n’ handle he drew above. That’s the only solid attempt I’ve seen at relegating the current weakness within the context of a young BULL market.
Have a great weekend and Happy St. Patrick’s Day!
I didn’t either and waited for today. Whoo! Let’s go Monday!
Steve / BayTrader,
Could you please check if XLF has a bearish long tail yesterday? Someone saw that. I want to verify with you guys. Thanks.