
More Low Lying Fruit?
I wanted to put out a bonus report on Tuesday morning. Realistically we probably have enough on our plate, so if you are happy with your current positions, please just view this as a possible heads up for possible future trade set ups or a watch list going forward. In the past few months we have been trading Energy, industrial Metals like CLF, VALE, WRN, NAK, X, etc. We have been trading in the Precious metals sector ( I also encouraged readers to buy & just hold on to some positions from the December lows forward ).
You may also recall my special report in December on another sector that turned very bullish. We will discuss that a bit further here today, as well as what could be some more low lying fruit in another sector that may be sending out some bullish shoots. These are just extra trade ideas for the active traders. Let’s take a look…
Today we will be discussing 2 bullish looking sectors –
1. Medicinal Marijuana companies or contributors to that industry
2. Solar stocks ( Thanks to LeChiffe for pointing out a couple of interesting solar stocks in fridays comments. That is what got me looking at the sector again).
.
Medical Marijuana
.
If you go back to the end of last Fridays report, I mentioned a few companies in the Medical Marijuana sector that were setting up bullishly, so let me start there. If you need to read that report again to refresh your mind on the subject, including all of the warnings that should be made known and a link to my Dec report on this subject, please do so at this clickable Picture link.
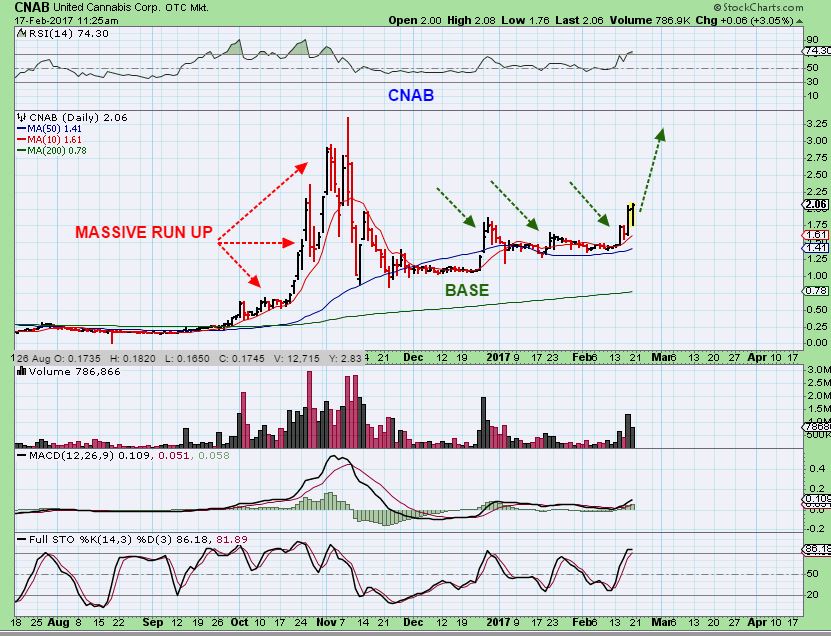
I recommend being reasonable in this sector , since business here may be somewhat unpredictable. That having been said, since I wrote my Dec report, many of the stocks have actually doubled , tripled, or more, but many are also penny stocks. They are still higher risk, so please keep positions reasonable if you decide to take a trade. I also said last week that I recently bought CNAB , because I thought that THE CHART SET UP was similar to CNBX ( which has blasted off higher, like many before it). I’m looking for charts with huge runs higher in November, and then a pullback and a base building process, so let’s take a look…
.
CNBX from my Dec report. Huge run up in November, drop into a base building process.
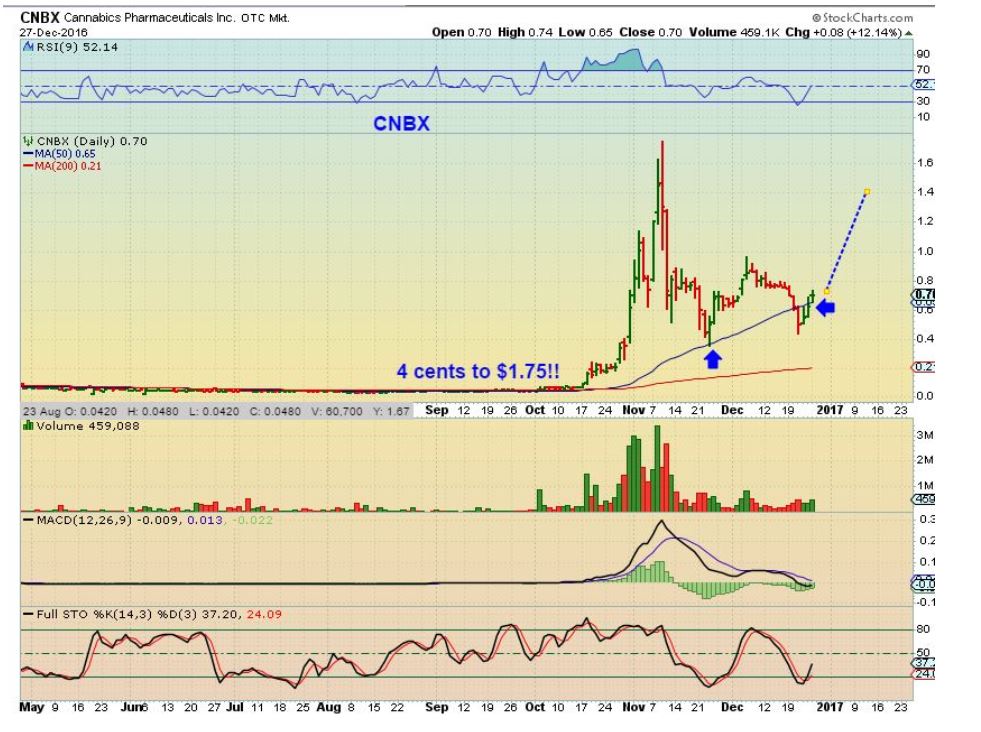
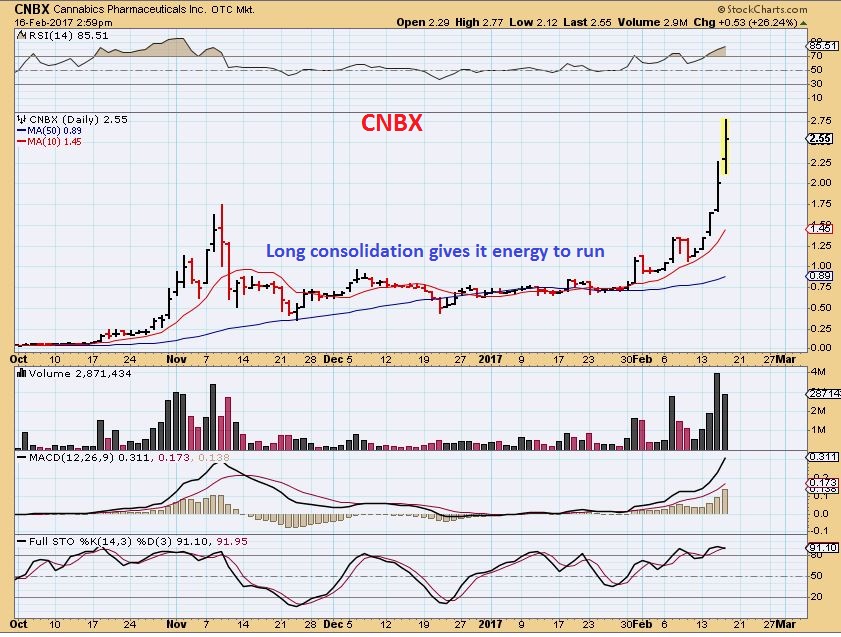
CNBX – You can in Thursdays chart the long base and the gradual breaks higher where suddenly it is overwhelmed with buying (and maybe short covering?) . It hit $4.41 the next day! This just ran from 75 cents to $4.41 in 1/2 a month! Crazy.
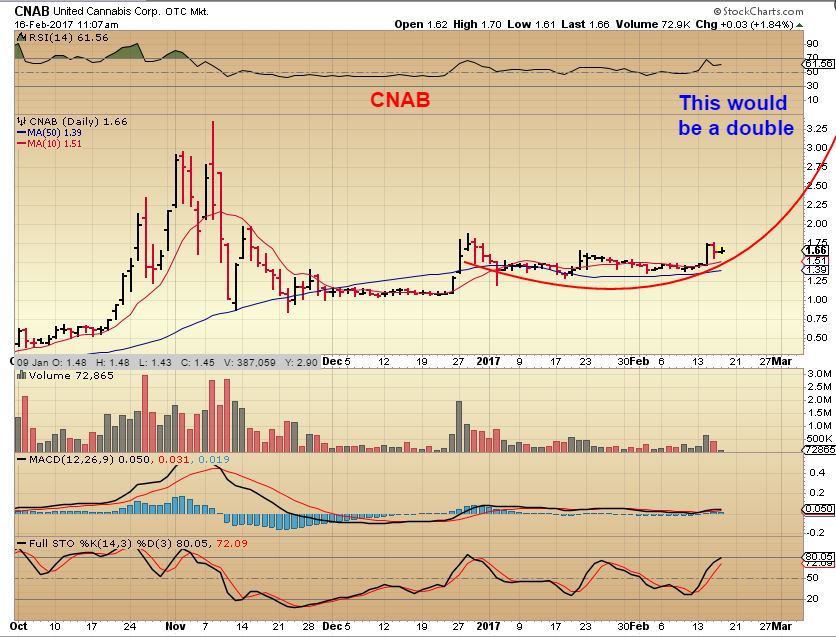
Now compare that chart above with this CNAB chart from Thursday. I bought CNAB STRICTLY on a bullish chart set up and a little research on the company. Here it was $1.66.
This is CNBX – After Popping a few times above the base (blue arrows), it just took off to new highs
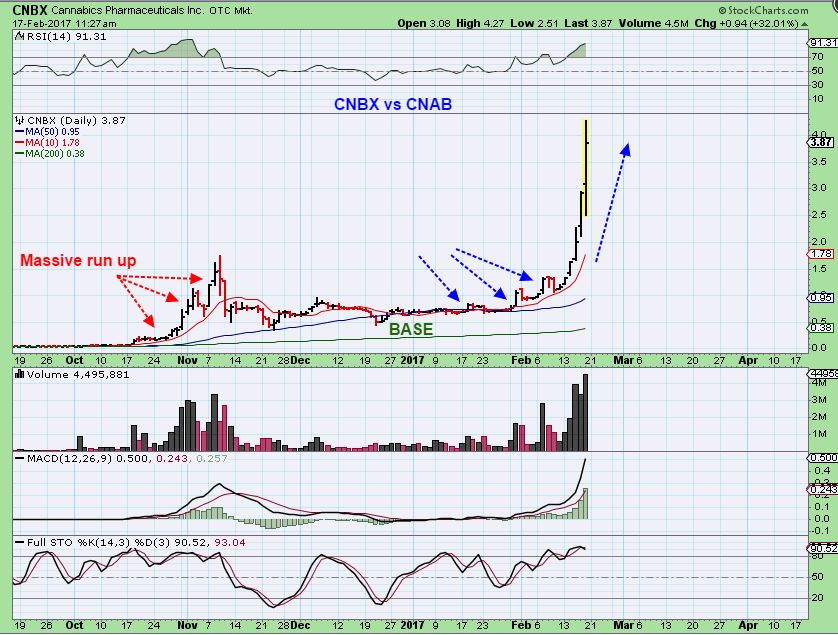
Compare to CNAB now at $2.06, and I think the patterns are similar, but this base is not as long. Popping a few times above the base and now moving higher. NO GUARANTEES, this base could still be building, but so far, so good.
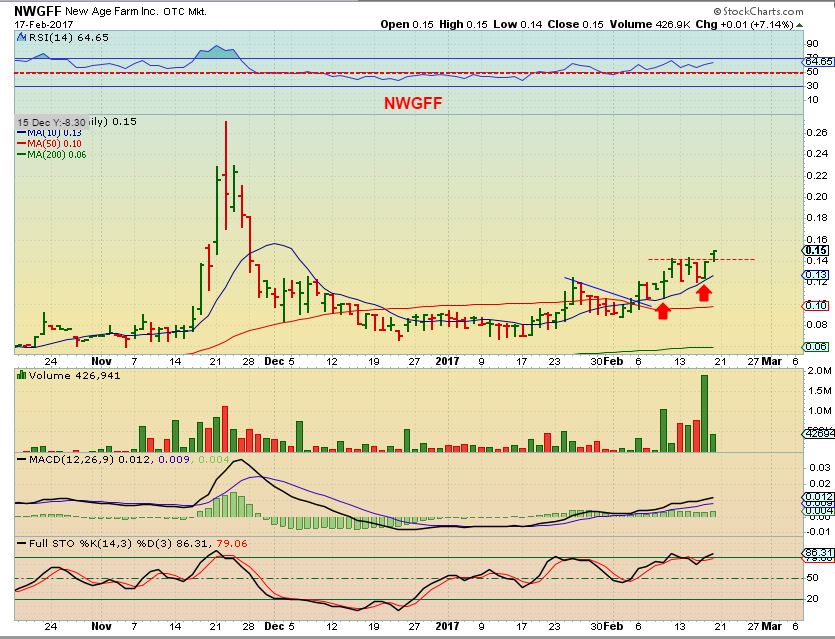
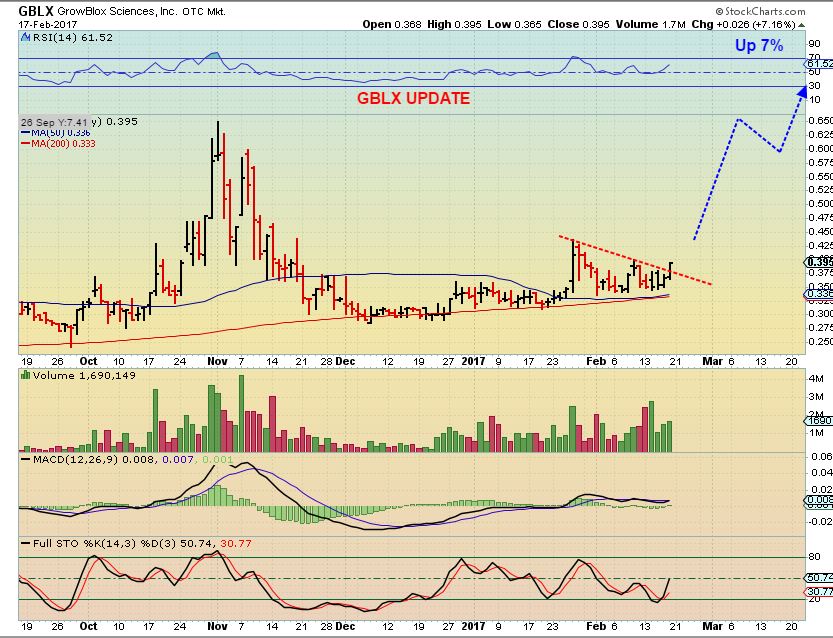
In last Friday mornings report, I mentioned 2 companies that I thought were going to be set ups ready to perform well – NWGFF and GBLX. This is based simply on the chart set up (And I did a little research on the companies too). On Friday they both went up 7%, so let’s take a look.
.
NWGFF – From Friday mornings report, this is a rounding base climbing higher.
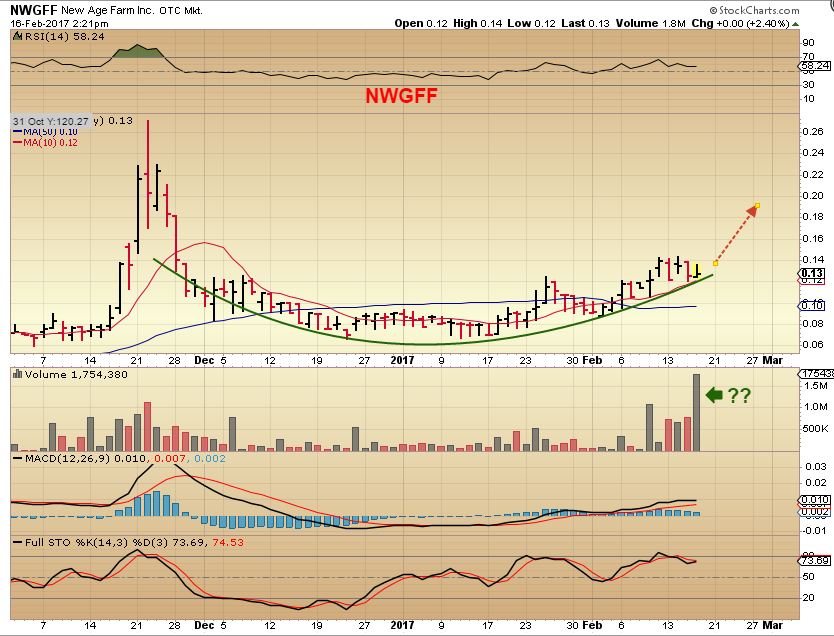
NWGFF NOW – It popped higher Friday.
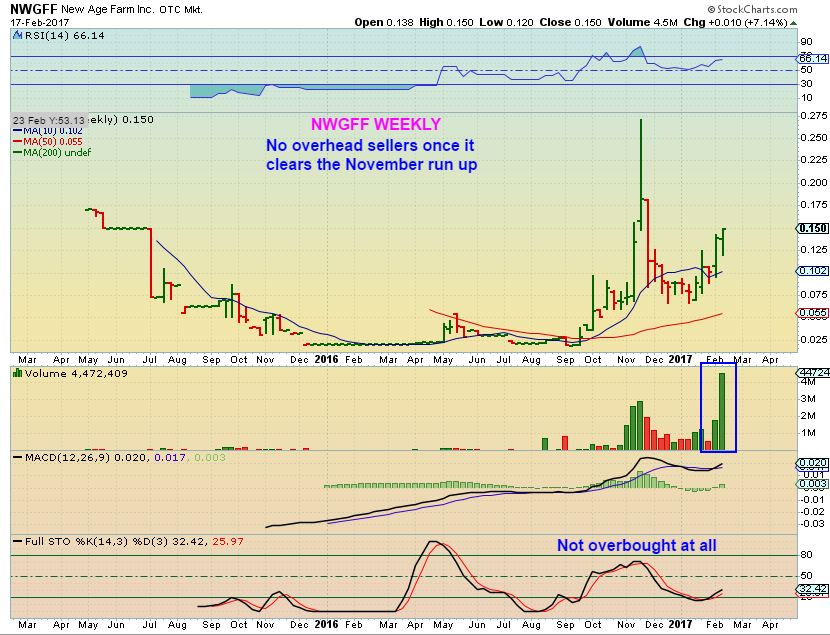
NWGFF – The Big Picture
GBLX – From Fridays report, I was expecting a break out and it was quite oversold, so I bought it.
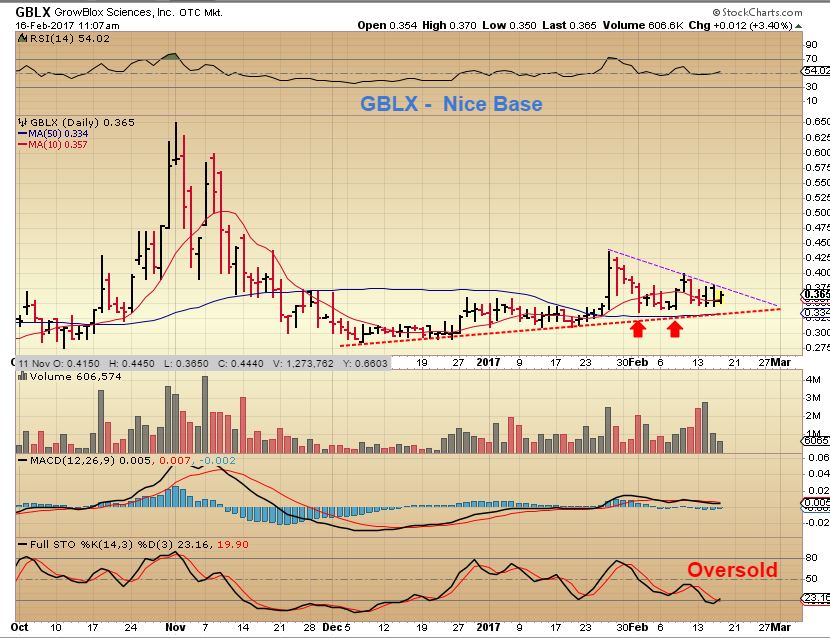
GBLX – As of Fridays close, we got the break out. These could still be considered a low risk entry, especially if it has a chance of running from $0.39 to former highs at $0.65 or more.
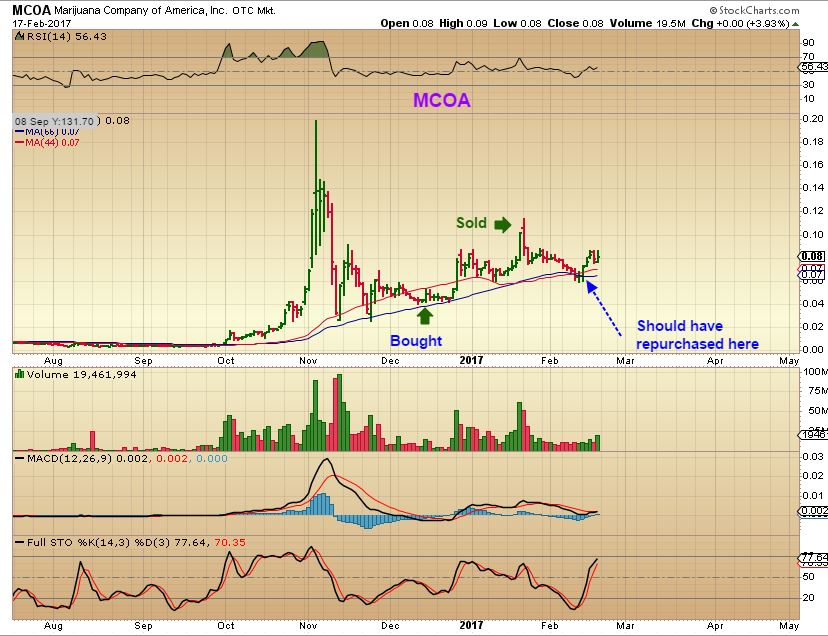
MCOA – This is one that I bought in December and when it ran up over 100%, I sold it ( roughly 4 cents to 10 cents). It pulled back and is now almost right back to where I sold it. I still like this set up, it is similar to what I pointed out in CNBX & CNAB in my humble opinion.
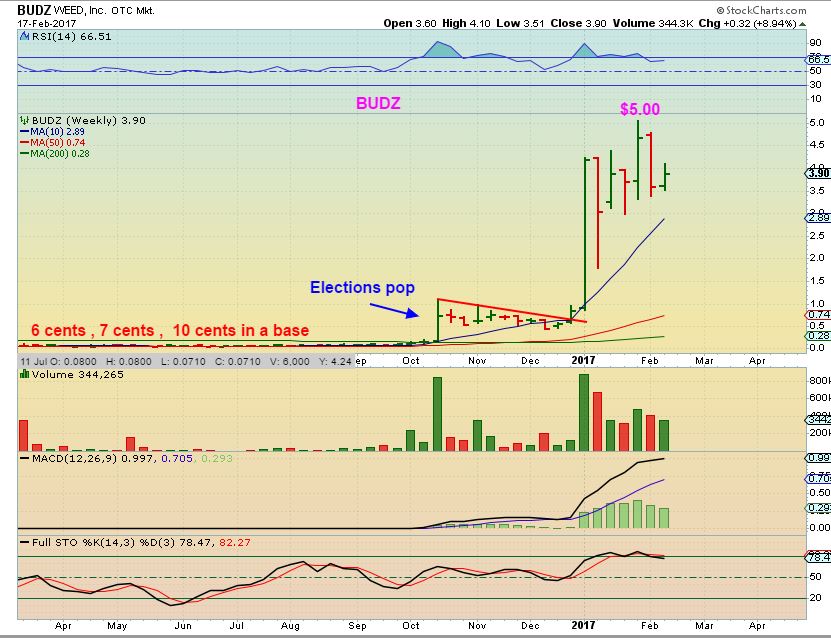
BUDZ – This is one that I never covered before. It has been V-E-R-Y strong after moving out of that first base and the second base, so I just wanted to point it out . Can you say 7 cents to $5.00 in 4 months?
So that is a sector that is responding to the recent vote to legalize medical marijuana in multiple states ( And recreational legalization has grown too. This legalization recreationally may or may not continue, but medicinally it is being widely expected and growth could be here to stay.
.
Sector Number 2 for consideration are the Solar stocks
.
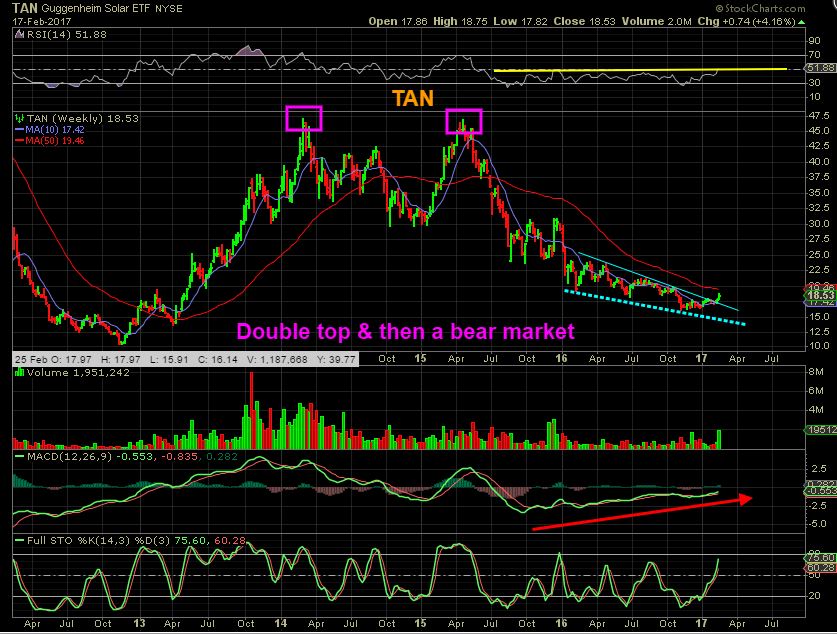
TAN WKLY – Let’s start with TAN, the Solar ETF. It has broken out above a descending wedge and that’s a bullish start. It does have resistance above, so Solars MIGHT stall for a bit or they could just break through. We’ll be watching.
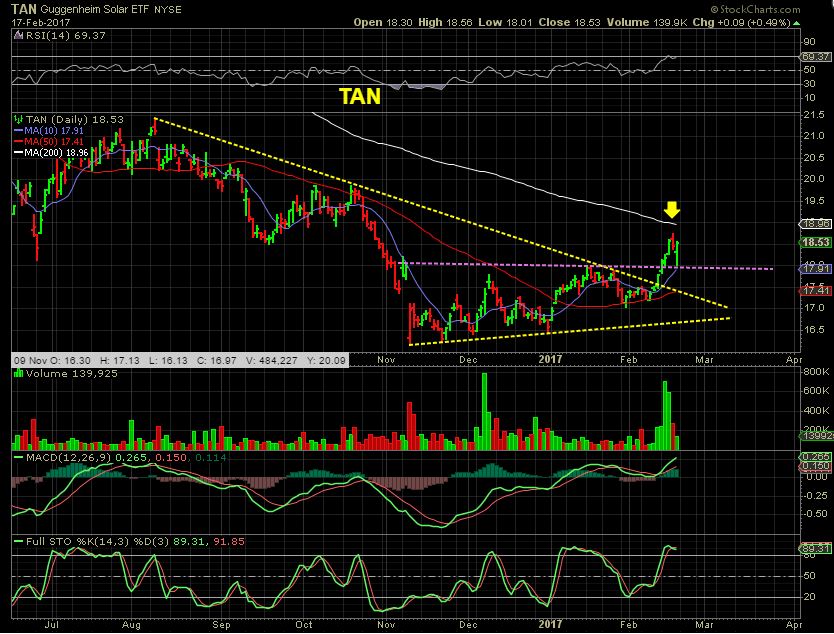
TAN DAILY – We see a break out and it dropped to the 10sma and reversed on Friday. It is at resistance and overbought, so we’ll see if it can break out or does it need to build up some steam first. It could stall for a bit first, and we’ll keep that in mind as we go through individual Solar picks below.
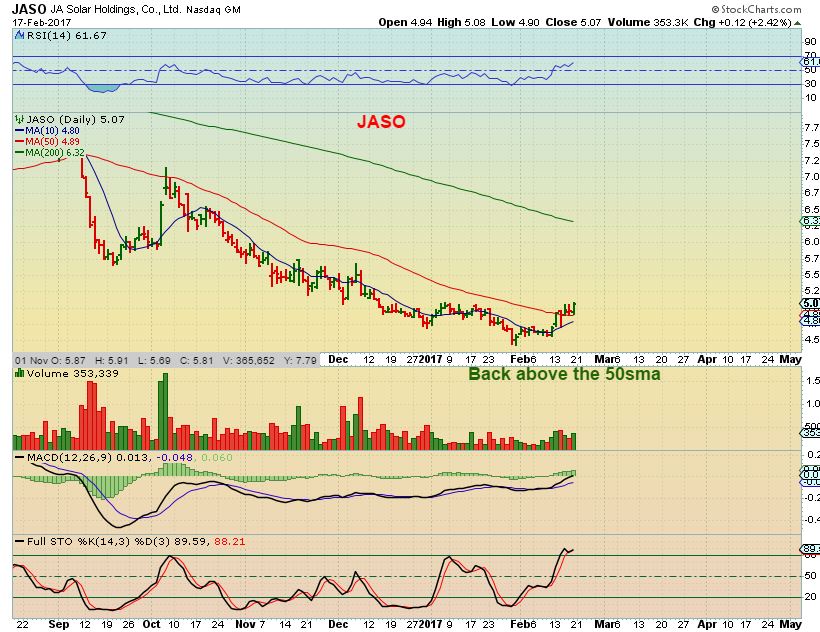
JASO – The RSI is showing strength and it is now above the 50sma. This could just continue higher.
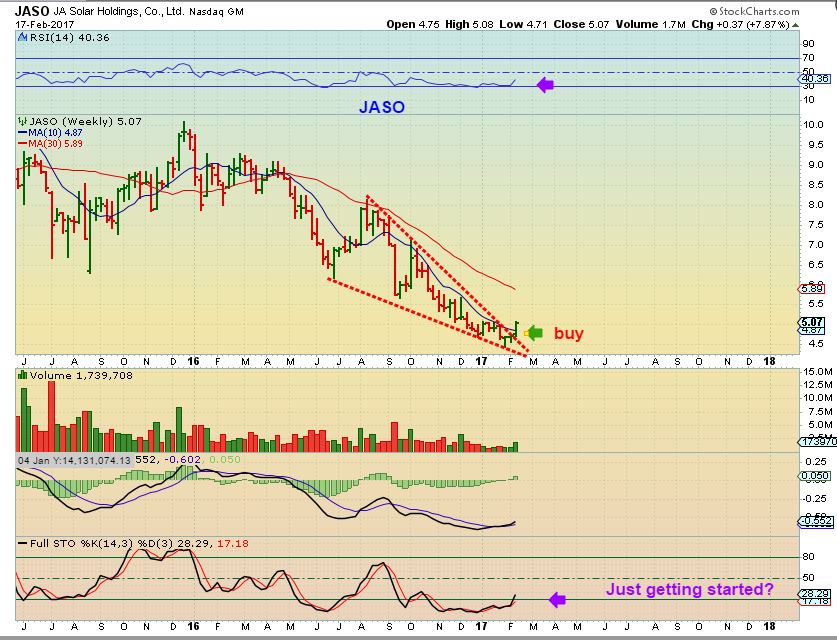
JASO WEEKLY – This weekly chart would be a buy, but a stop should be placed at the recent lows. This could just run higher or it could start building a base and bore us to death.
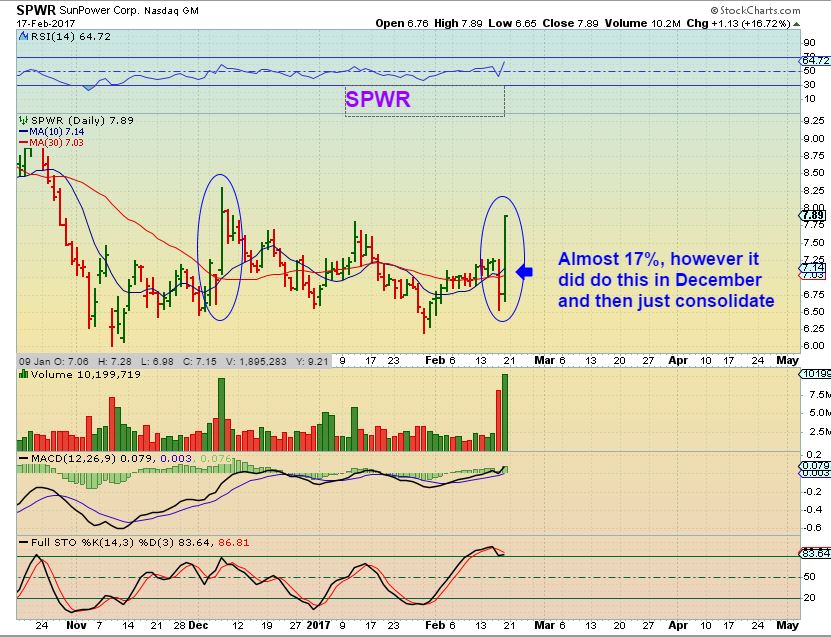
SPWR– It had a huge pop on Friday, but it has also done this in November as seem in the chart. After the Nov Pop, it continued to consolidate, so lets look at the weekly chart for clues.
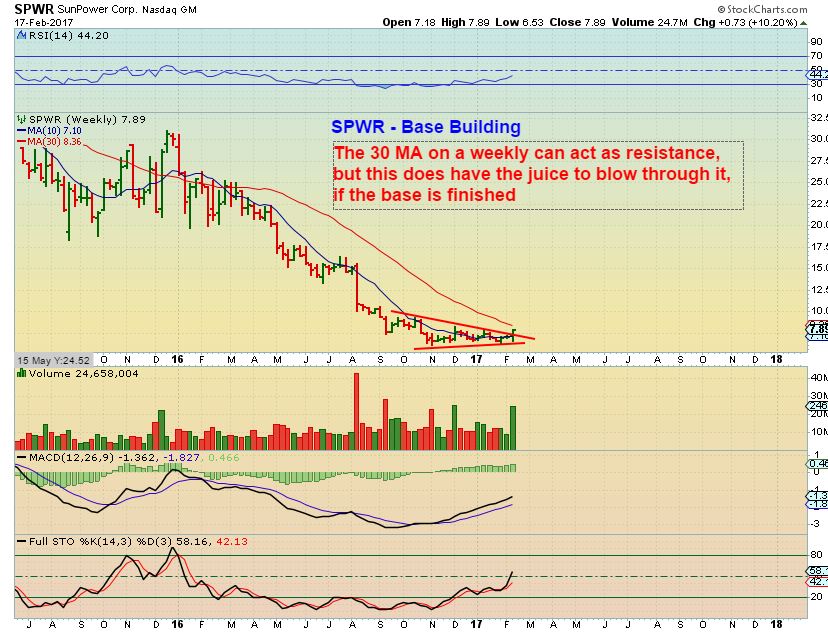
SPWR WEEKLY – It does look like a weekly break out, but overhead resistance is the 30ma. It could break through it coming out of that recent base, or it may stall. I think that it is a low risk entry with a stop at the recent lows too, I’m just not exactly sure if it is ready to run higher quite yet or not.
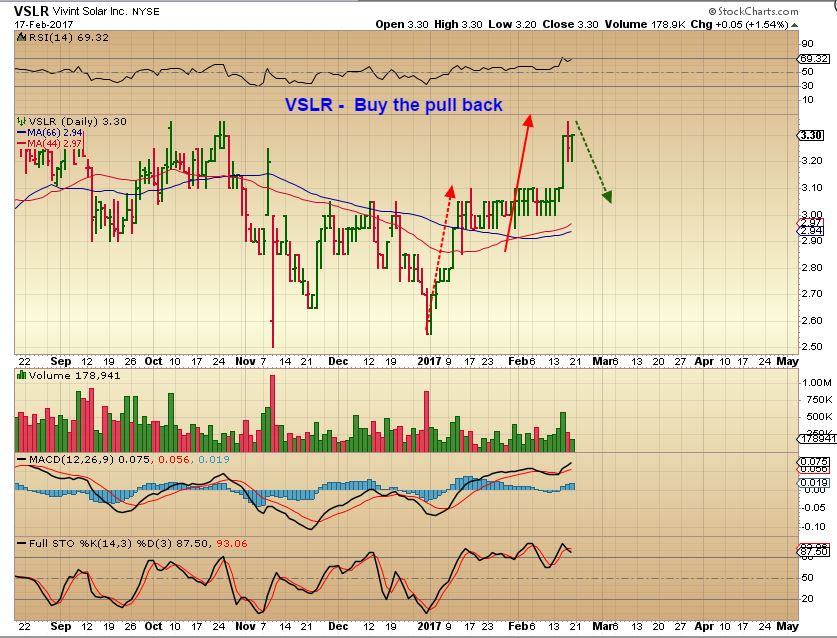
VSLR – I kind of feel like VSLR may have just completed a measured move, but it is worth keeping a close eye on it in case it just continues on higher with some follow through buying. The weekly chart is awesome.
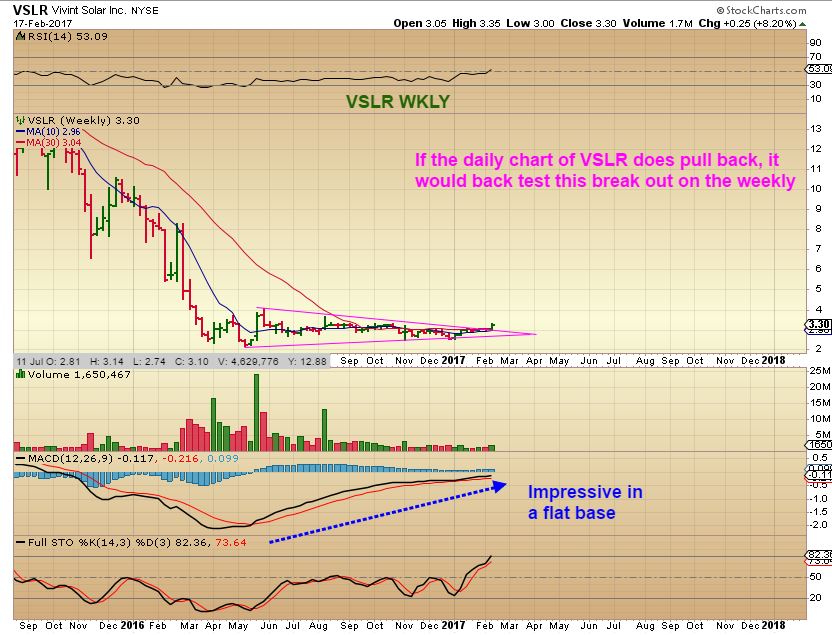
VSLR WEEKLY – Awesome. You could buy & hold if you were patient and willing to just allow this one to do it’s thing. It could just continue higher or continue to work its way out of that base.
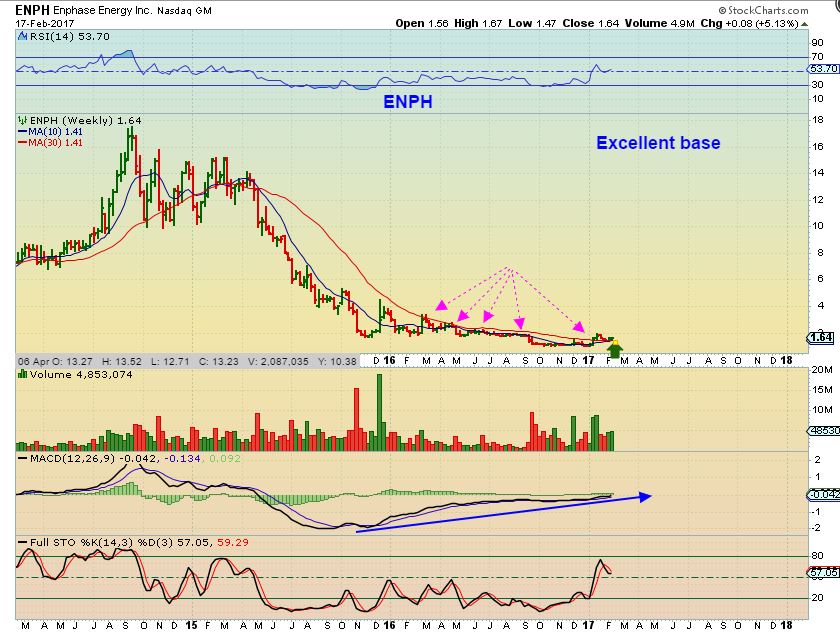
ENPH – I did a little research on this one. It isn’t in the business of manufacturing Solar Panels or installing them, but it a product that goes hand and hand with solar installation. For lack of a better technical explanation, their product converters the electric current ( solar micro-inverter systems) and business seems to be growing. You may want to do your own due diligence. I love the chart.
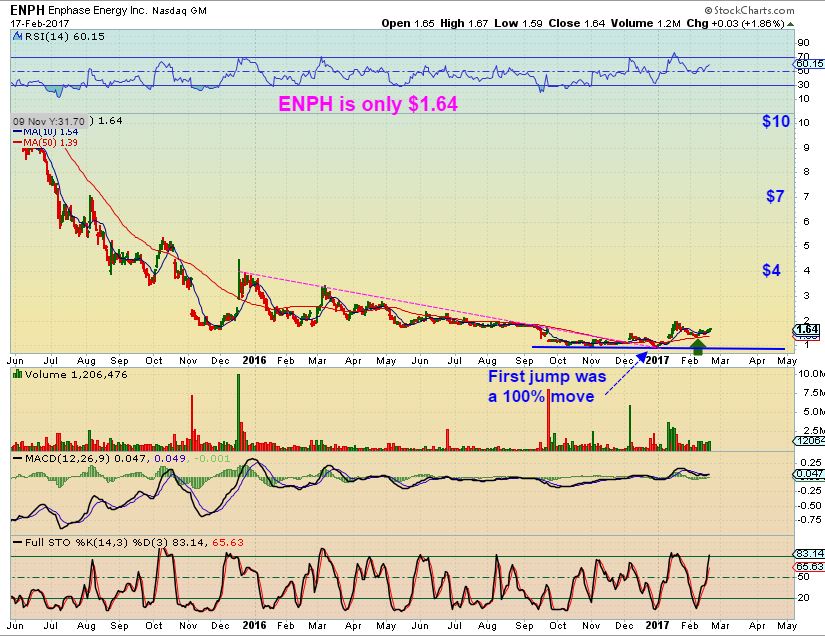
ENPH WEEKLY – I really like this chart too. Can’t you just picture the right side of a cup forming here over time? I made up a name for that, a recovery cup. That would be excellent %-Gains for the patient ones, if it did recover. Is it ready to go? Time will tell, but it looks like it is breaking out now.
SEDG – I would wait and see if this one pulls back first. It is overbought, but it adds to the idea that the entire sector seems to be rebounding. See also FSLR, JKS, TSL, RGSE, SOL ( Breaking out soon?), YGE.
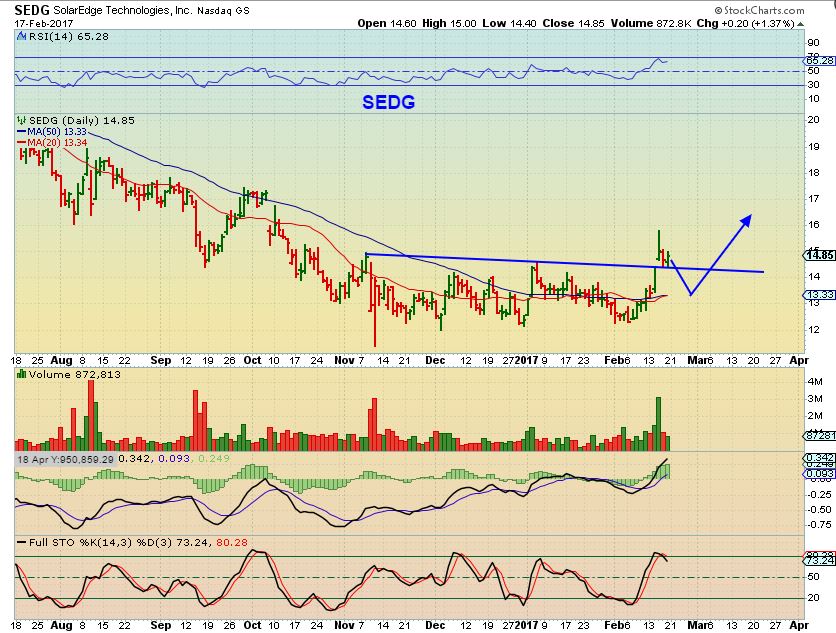
So it seems that the entire sector may be rebounding. See also FSLR, JKS, TSL, RGSE, SOL ( Breaking out soon?), YGE. Some of these have done reverse splits in the past and some are looking weaker than others. This means that it is best to do your own due diligence and as always, honor your mental or hard stops!
.
Last but not least -And not solar 🙂
.
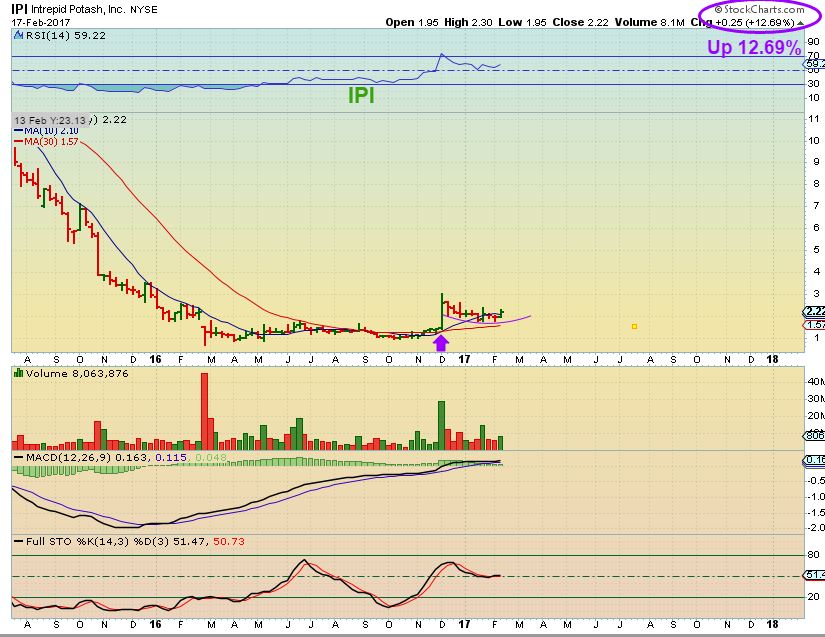
I just wanted to revisit this recent set up. On Feb 13th, I posted this chart of IPI looking like it may finally be ready to break out from a recent consolidation.

FEB 17th – IPI now looks like it is forming a mini bull flag and building energy to break higher.
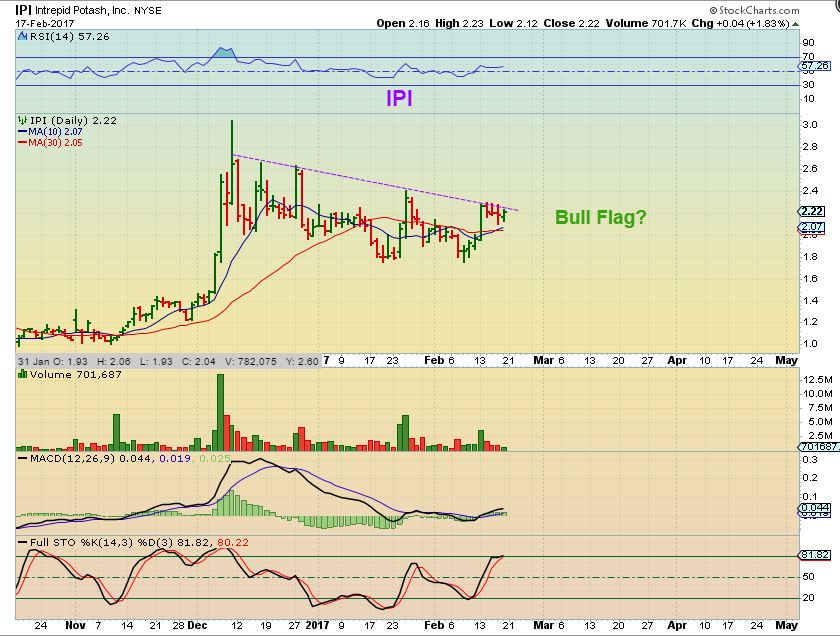
IPI WEEKLY – And the weekly chart is also setting up in a very bullish manner. This is a good example of just how long these ‘recovery cups’ can take.
.
Again, you may be satisfied with all of your current trade positions and that is fine. Do not let extra trade set ups in these sectors overwhelm you, this is a bonus report. We certainly should not feel that we have to participate in every set up that we find. Keep in mind that among the many readers here, I have some very active traders that want new trade ideas from time to time, and this provides new trade ideas for them as well as another sector to invest in.
I hope all had a nice restful weekend, and enjoy your Tuesday trading!
.
~ALEX
.
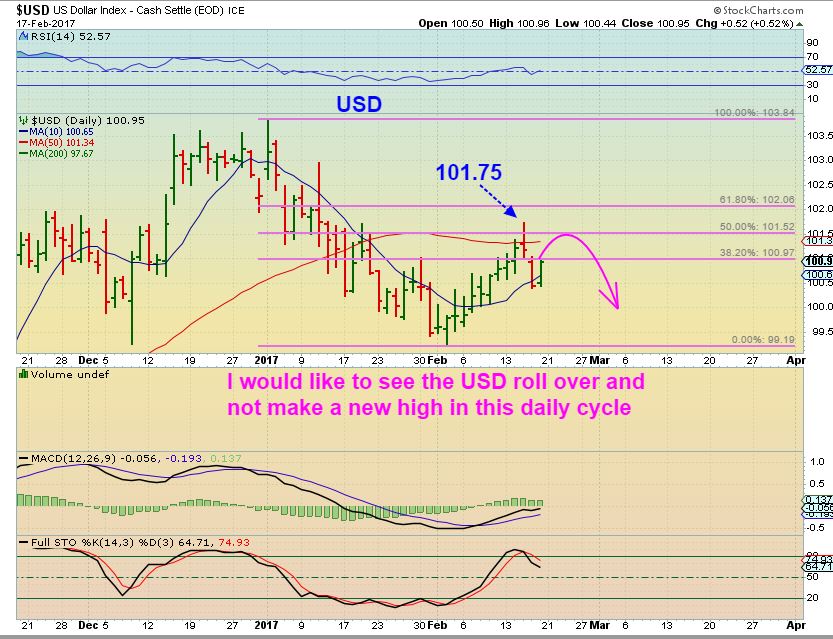
This is a bonus report discussing 2 different sectors. Please refer back to the weekend report if necessary, as you watch SPX, NASDAQ, WTIC, NATGAS, Gold, MINERS, and the USD today.
Note : THE USD is rising quite a bit this morning, it is good to see that GOLD is not dropping very much. As I write, the USD is at 101.50, and I did mention this bounce as a possibility in the weekend report. I would like to see it roll over before hitting 101.75 to add to a weaker view of the Dollar.


Alex or anyone else,
Metal stocks have been pretty hot lately – CLF, X at 52 week highs, WRN. But it looks like I backed the wrong horse, FCX. Anyone see a reason to keep it, b/c I sure don’t. Lost pretty much every single moving avg on Friday and will gap down with the rest of the greater mining complex this morning. I stopped out of CLF during the consolidation a few months ago (poorly placed stop), and got back in but on the wrong horse. Anyone see it differently?
Hope this link works: http://seekingalpha.com/news/3244717-freeport-mcmoran-indonesia-impasse-grasberg-mine?app=1&uprof=45
I have a small position in my core holdings. I may just hold. Political “games” can change. Not sure what I will do.
Starter position in JASO doing great today. light vol but with a 39mil float this thing up 23 cents right now
to my eyeballs… it looks like 1,2 .. 1,2 for GDXJ…. guys?
https://www.tradingview.com/x/qGxJwoGD/
*and gals .. ;o) goes w/o saying…..
you got your eye on HK Missy?
i’m a-watching.. close to a break from a big year base
Uggh…that chewed me up&spit me out last yr….. But i will look 2nite… Tx…..at pool. 🙂
Hope u r wellll……
yes thx.. all snot & fever gone now… just niggly cough.. be right soon.
here’s my HK chart for you to view poolside…. https://uploads.disquscdn.com/images/d2aea35681794c208fbd2a89af91f4465521f51dd3732e6031853b6deb525dc2.jpg
🙂 tx..on my cel and 4got me grannyGlasses…teehee
Tip…. Press your eyeballs from the sides to make them longer.. or look thru a tiny aperture of a clenched fist for better depth of field …
I have to that all the time in the shops, when ive forgot me spex, and i need to read a label.
The store detectives must think i’m an escapee from the mental ward.
I can’t believe I actually tried that! It did not work for me! LOL. Were you joking?
no.. it does work! 🙂
.. so long as its a pair of magnifier reading glasses that you normally require
squashing your eyeball from the side allows the image to focus on the retina, instead of it focussing beyond the back of the eye (due to loss of elasticity in the lens as ya get older.)
Well, I don’t feel so gullible after your explanation…but I could not find it workable…guess I won’t have to worry for now as I always have a pair of magnifiers hanging around my neck!
…. L …. O …. L … omg im literally almost fell off the bed reading that… omg… 2much..
hehee :).. and for xtra nuttiness appearance in the supermarket.. one could simultaneously try the press-eyeball method for one eye, and the fist-aperture method for the other.
well.. i usually just use my camera & zoom in to read labels etc … but obviously couldnt since the chart was on my phone… lol
hey… maybe if me&u both call out “C H R Y S T A L” at the same time…. u think she’ll come out from hiding?
giggle….
ok here ya go…… C H R Y S T A L ! ! !
she’s probably out spending the profits from her IPI
…annnnd … nothin….
a very Zenlike paradox.. a like the eye trying to see itself.. or a fingertip tryin to touch itself
hahah
Yes, looks like the second 2 is an abc, not sure if the final C wave is done
Eyeballs are not failing you.
everything went so fast. I got dizzy already. 🙂
question: why silver futures is red, but slv is green now?
SLV trades with the market. 0930-1600 Eastern. Futures trade Globex AH, near 24 hours. So you’re seeing the difference btw spot and Friday NY close.
ung $6.63, shall I buy some?
Stick you head out the door. Tell me what you smell. SPRING
Alex said we shouldn’t trade natgas based on weather, isn’t it? 🙂
That what he said, but a lot of other people do. Alex trades on Charts but I could help adding my two cents. Sorry!
Ung went down more. So at this stage, I probably should look for natgas at $2.5
what’s the rush… .wait till it proves itself… b/o …pullback…go …
no need to be a hero… protect….
mvt2cents 😉
been there done that …got my hand chopped off…. ;o) lol
Hi Maria,
Thanks a lot for taking time to respond. I’m a very inexperienced amateur here. What b/o, mvt2cents stand for? 🙂
breakout .. pull back… (backtest)
MVT is Maria Vacation Trader…. ;o) becuz ive been on vacation…. buttt… that ends Thursday..boohoo.. then Ill just be Maria ..;o)
wow…cnbx
MUX, GORO, IAG, AG, Bounce pretty nicely, yet the baby miners (TRX, THM, TGD) crack… Am I missing something?
OWCP Just went Thermo-nuclear! Just as NAK went down the tubes. One hand washes the other.
yeehaa!
cnbx just won’t quit! I sold all my cnbx last week….
Wow! I don’t even know the right technique to exit one that blows up like that. Or maybe you just cash all once and don’t care. Way to volatile for a trailing stop to be of any use.
IPI earnings Feb 28….was just doing a little research.
How about that MNTR?
It’s been doing very well!! One of those I should have jumped on but it just…keeps…going….
Alex, I think as you pointed out in NAK, chart is damaged and it would take some time to recover the damage. What do you think about possible re-entry targets? $1.50? or more like $1.20?
Tammie, I know you have researched many MJ stocks …. What do you know of MCOA, GBLX, NWGFF ? I feel like I have missed the boat on most of the MJs, but maybe these are still ready to join the party?
GBLX…..inflammatory type diseases, filed for 2 patents….I have (Alex has too)…I added this morning …I think once it gets past .43-.44 it’ll go…..but check it out for yourself….I got AGSTF this morning….it’s moving now…check it out…I’ll post more in a few minutes 🙂 🙂
Thanks…I did take a position in MCOA.
or at least I think Alex had this one…
Yes, he reported that he bought it Friday…went back to the report to double check, didn’t want to speak out of turn…:)
You were right again….and I am beyond frustrated now….tried to get a fill in GBLX and did not get it. Kept chasing but it left without me. My account requires getting a code to place orders on some pink sheet stocks. Takes too long to get the order in. Poo.
aww, sorry you couldn’t get that fill! AGTK I’m still waiting for it to take off….IF you like a super cheap stock….risky…but aren’t they all? Has a long base and has just popped over some averages…could be time for it to head up…?
OK…joined you in AGTK…..infused coconut popsicles….hmmmm….
LOL, really? I haven’t had time to research this one……
Hemp pops, Also pouches of products to be rolled. Under “wellness Products” on their website:
http://agritekholdings.com
Thanks! I’ll have to go read that….I researched a lot this weekend but the only notes I have scribbled for that one are that it’s leasing land to growers…..
also waiting on SGMD to pop….might not…but…if you’re still shopping…I’d take a look…
I got 1 limit to fill on GBLX today!
Good….I’m still in….hope it goes up tomorrow! 🙂
Me too. B/c I killed EDXC. My bad. Sorry folks. I got into that one and caused it to go nowhere for folks! 😛
Many many that aren’t too late to get into….I’m watching BLOZF, ACBFF, ….have SING, ACOL, OWCP……also watching AMMJ….go look at that chart….post more in a few minutes 🙂 I’m going back and forth between work and charts 🙂 🙂
ammj taking off…
well done!
On SING…I did read a brief reference somewhere this weekend that there could be some shenanigans (I didn’t research further so no idea if true/not true/etc)……so I’m keeping my eyes on it….not a long term hold but just seeing how far I can ride it…
check out AGTK….don’t know much about it…leases land to growers…..check out the chart…
I have SGMD also…waiting for it to go….they make containers/packaging that preserves the cannabis, protects from bacteria growth etc….think sales are going up….and the chart looks…nice!
Tammie, who do you consider to be the best QUALITY marijuana stocks? I’m not into chasing penny stocks for massive % gains like many traders here, I want to invest in the BEST company at a good entry price for a longer term swing trade. For example, I consider AG to be the best silver miner in the biz, other silver miners like GPL may have better short-term gains but I like AG best because it is a very well run company.
Well, not many quality ones as far as financials go (haven’t researched some of the higher priced stocks)…..as far as potential products or products under development – CBIS, GBLX, CVSI, EDXC, SGMD, CNBX, maybe PURA, RMHB, owcp, blozf…off the top of my head….most just potential, have to wait and see……I’m sure there are others that have potential good products/services – I am buying based on what their product is/news coming out and chart set ups – and not many of them held long term –
Gonna have to start your own MJ newsletter now. High Times with Tammie!
Hahahaha! Funny! Yeah…no. So many skilled traders here I’m learning from – probably couldn’t tell anyone anything they don’t already know! I do a lot of research so might can tell you a little about a company…but…..:) High times with Tammie is very catchy though…..gonna have to figure out somewhere to use it! LOL
Here is an example of a possible “signal trade” today in GDX. I say “possible” because there is no way to know for sure it really is a secret trading signal, but you be the judge. I track after-hours and pre-market trading because it gives me a better overall feel for intraday trading and a jump on the market. Today, miners opened as a “sell” on my 15 min chart, on the screen capture below you can see the moving averages were angled down in the pre-market trading with the red 10 SMA above the green 9 EMA. BTW I color code them that way on purpose, when the green MA is above the red that is a “go” and when the red MA is above the green that is a “stop.” Makes it easy for me to see at a glance what is going on. Anyway, back to the chart. Despite the fact that the price trend was DOWN this morning, notice the 15 min pre-market candle I highlighted. It has a massive candle with a high of $24.79 even though the trend was down. Sure enough, GDX opened with a downtrend exactly as my chart predicted, but look what happened after the first 15 min candle. The sell-off reversed and bounced back to an intraday high (so far) of $24.76. Was that a coincidence? Or did the “Big Boyz” signal their friends that they were going to run stops and then run GDX back up to $24.79? You make the call. https://uploads.disquscdn.com/images/f41011af1f5a05162e13c3d21b87c474d499107b8ed0394abc1c84245ae206ae.png
Interesting!
Just curious…. So ur trade signals r short term & u trade in & out of just miners?..but not MJ..?
Confusing….
Tx
Maria,
I don’t day trade, I’m a long term swing trader. However, I use the the 15 min charts for entry/exit points.
I hate to admit this, but I got stopped out of some of my JNUG this morning. When I saw it flip back to a “buy” on my 15 min chart (3rd candle), I bought it back.
I never should have stopped out, but I slept in this morning, stock market opens at 6:30 AM here on he Left Coast. If I had been at my computer screen, I would have lowered my stops to avoid a stop run this morning. Unfortunately, my stops hit before I got out of bed. Classic “stop run” action. My 15 min chart got me back in. If the 15 min chart had remained in “sell” (down) mode I would have been happy to be stopped out. So that’s an example of how and why I use 15 min charts. I watch short-term intraday trends every day, but I don’t trade on them very often. I suck at day trading, so I don’t even try. I hope that makes sense.
Confusing – But i dig your style. And yes, Im here on the Best Coast as well – waking up at 530-630 to trade is killer..
Don’t you wished you lived in Hawaii 3:30 or 4:30 to start the day.
I dont mind that lol.. When ever I go to Kauai or KONA – Im stuck on my time and wake up and trade form the hotel room. The East Coast crowd is always awake and making noise anyway.. lol
Hey now……:)
Hey..send me some coffee…that hardAss ken wont…;)
*smirk
OH Im not in Hawaii right now MVT lol. I was saying when I do go. But man, KONA coffee is a gift from above..
Omg..just stop that right now…lol..its not nice to taunt…;-)
lol
Lol…that would prob suit me..i hav wacky sleep cycles….
Never visited there..the flight scares the crap outta me… I get antsy on a 2 1/2 hr flight 2 Fla…lol
This is why I don’t post charts here … my charts are way more complicated and confusing that Alex’s great charts. I have my own trading system, and I’m not encouraging anyone to follow me. Just posted an example of a “signal trade” candle today to follow up on my post last week where I said sometimes those long tails up or down hit within 10 trading days. This time it hit between the pre-market trading and the first few hours of regular trading. This is for informational purposes. I encourage everyone to follow Alex. If you have time/inclination create your own charting system as an additional source of information. Personally, I like it when my charting system matches up with Alex’s chart recommendations. Makes me much more confident in the trades.
The best coast? Lmao
Lol
I challenge u to a duel…with swizzle stix 🙂
(Me takn a slurp)
Oooh sorry about jnug..
Im still confused Tho as to why u use very st intraday signals for a long-term swing trade….
Thats ok..every1 i know..well pretty much every1.. Is confused by EW theory…lol..i try to mesh Alex cycles w my signals for delish buys & sells… 🙂
Hi Steve,
Do your settings have pre-market left on during open market? (Your chart makes it appear that you do)
Just curious, as I find that turning pre-market off works better for RSI & MACD during open hours
I’ve been observing your 2 MA setting for awhile, but haven’t thought to check them with pre-market left on
Thanks!
Cal
Yes, I always include After-market and pre-market trading in my short-term charts from 3 minutes to 30 minutes. You will find you get much different readings on the MA’s doing that, but IMO they are more accurate reflection of price trend, which is all I’m looking for. BTW, I should point out that my charts are NOT “predictive” I never have price targets or anything like that. I just look at what is the CURRENT price trend and extrapolate from that. About the farthest out I ever try to predict is the next trading day, and even then I’m often wrong.
Very Nice Steve…..thanks !
Maybe show your longer term buy / sell charts first Then your 15 min. Entry chart ?
I do the same on a signal Daily first…..2 Hour next…..15 min. Entry.
NAK actually looks ok on the middle band its been support on the weekly https://uploads.disquscdn.com/images/20dafe7b35e75b92c112fb3e9e8debdcb785f013cebac3a39dd4fef1fb9130e3.png
Thank God, I got out last week. I waited for the rebuttal, action was lackluster so I took a small loss and left. Would have been a huge loss if I held until today. This is gonna be dead money for a bit. I’m definitely leaving her alone for awhile.
Me too. Got out, actually wound up doing pretty well on it. Started selling it from the 3$+ range. Final tranche sold this morning before the bigger down move.
I sold 2/3 of my holdings twice so even with the ride down last week kept 85% of my profits. A win is a win! But will be moving off NAK for awhile now. Glad you got out alright.
JO: +2% today….currently in wave 3 of 3 of 3. Stop: below 20.20
AKG: Added……very nice chart…..
USO: Broke upper TL on the open this morning …… positive, getting interested in Crude.
PLG: Disappointed so far but holding lower TL…….
TLT: Stop below 118.07
MM: Added PURA & CBIS……
I bought akg this am as well… Nice
You and me MVT !
Not seeing the AKG chart as being a nice add… Whatre you seeing? Or simply the bounce potential?
ithink its at or near finished w/ correction…. so took my starter…
Anyone wanna chime in on AKG? Im not seeing “very nice chart” here…
Maria ?
Alaskan Mine….very good ground.
Stochs: Oversold
RSI 5, 7 12 all turning up
MACD: turning up
MFI getting oversold
Defensible….Risk Reward is Excellent.
Sector positive trend…….
This could all change tomorrow at 2 pm……. lol !!
hahahahahah – thanks for that
😉
Chicken …. 🙂
USD: UUP
Still might be in the wave b up of 2 correction…….
FCX…….yikes !!!! Indonesia !
Yeah, I knew that had been a lingering issue but the news this morning was pretty bearish. I could have made 30% with CLF instead of losing 8-10% with FCX. Quite simply put my money on the wrong horse. Right race, wrong horse.
Wonder how options expiration this week will effect silver miners . . . .
don’t you love SOLAR today :P)
MMJ work too. Can’t beleive I am out of CNBX…. sold WAY too early
got a starter on ENPH.
Fantastic report Alex :)-
Thank you!
PS: added some UNG Jun calls in the blood
and some NUGT calls too.
LeChiffre – added JASO and TAN on friday, loving the action today
Fed Minutes tomorrow at 2 pm eastern……..heads up !
UNG! Blood in the streets! Bill would agree for sure!
crystal gf…where areeeeeeeeee uuuuuuuuuu …. :o)
CF, hopefully you can address this in the Wed report – GDX and GDXJ both “busted” their recent consolidation lows this morning but gold did not. At this point would be very left translated. Any implications for cycles with this or did today’s recovery just act as a shakeout? TIA.