
Feb 28th 2017 Report
The Weekend report covers the general markets and Natgas , etc just fine, so todays report has to focus mostly on the action in Gold , Silver, and Miners. Let’s get right to it…
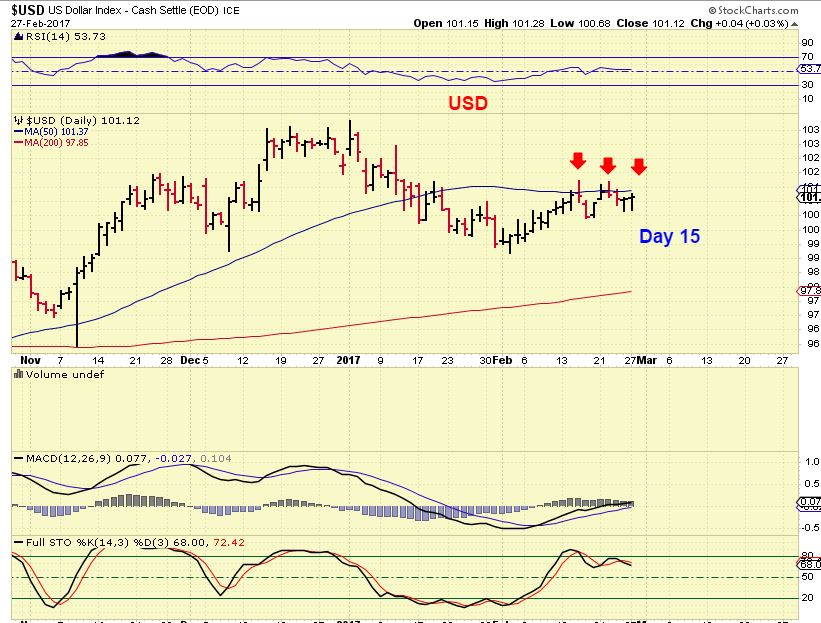
USD – The dollar has peaked on day 9, Monday was day 15. A break to a new high would indicate that the USD wants to go a lot higher. Staying below day 9 should indicate that the USD is breaking down as expected.
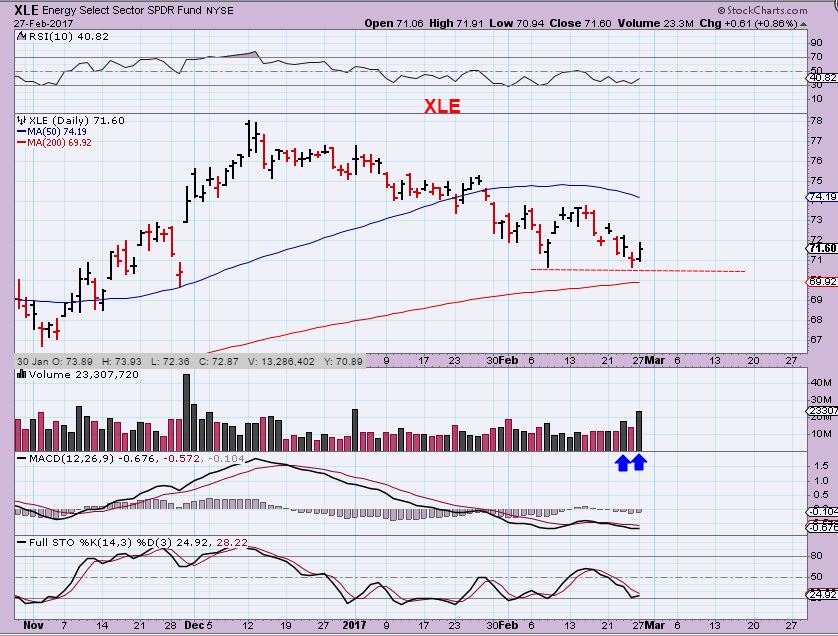
OIL remained the same, but I just thought that I would throw in an XLE chart. It has been in a downtrend and I was expecting it to tag the 200sma, but now it has a higher low and some volume coming in on the buy side. I’m not trading this at the time, just noteworthy for now.
GOLD & MINERS
I was in front of the screen Monday morning and miners were riding higher with Gold & Silver. Last week I added a small hedge ( JDST) simply to take the edge off of the selling in Miners, so I removed that hedge as Miners went higher. I had to leave during the afternoon and when I returned many Miners ( GDX & GDXJ too) were selling off rapidly , while Gold & Silver lingered at highs. I felt the selling Monday.
The difference between Precious Metals and Miners right now seems irrational. Gold is still at 3 month highs and miners are getting smoked to the downside? I just had to start digging in again and look for more clues. The unfortunate thing is that we seem to find ourselves right in the middle of no mans land. I see examples of how Miners could be at support and settle down, but I also saw some things that were more concerning than that ( I will show that here too). I will say that it is ‘difficult’, because it seems like irrational and unpredictable behavior in a bull market, and that is what we see right now.
Let’s go ahead and just take a look at the good, the bad, and the ugly.
.
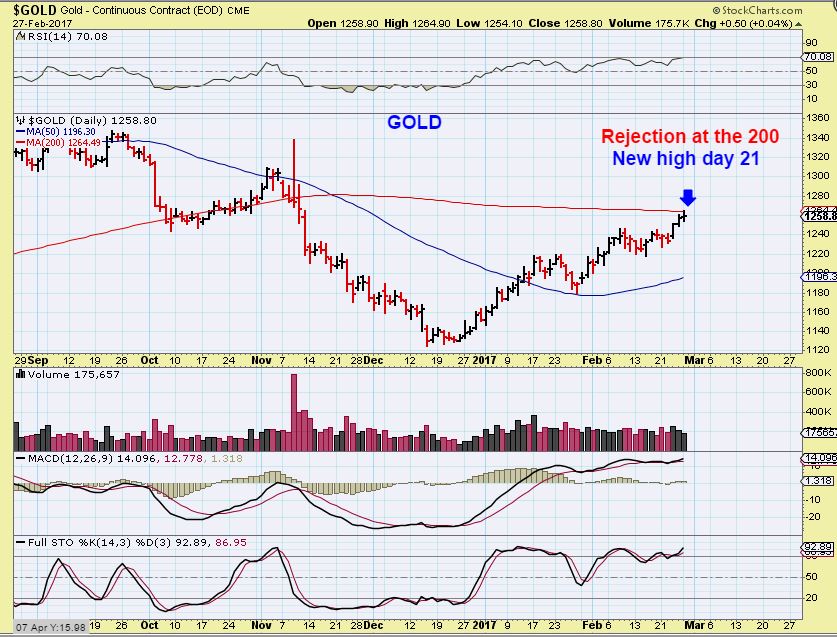
GOLD – In the weekend report I mentioned that the early selling that we see in the Miners could indicate that GOLD is about to get stopped in it’s tracks at $1264, possibly followed by a dip into a dcl. Gold did stop at $1264 on Monday. Gold seems to be acting correctly. To put in a dcl, this actually could just crawl along the 200sma and dip slightly lower, but the action in the Miners makes it seem like it will tag the 50sma too.
While GOLD and SILVER are still at 3 month highs, many Miners got roasted. Trying to understand what is happening is difficult, because the Metals and the Miners are pretty much acting exactly opposite from each other recently. It is rather rare to see it happen to this degree.
Please Note this: Last week the Miners were fine on weekly charts, so I was fine with it too. Mondays action alone turned the weekly charts more bearish, and that is concerning to me. Let me explain…
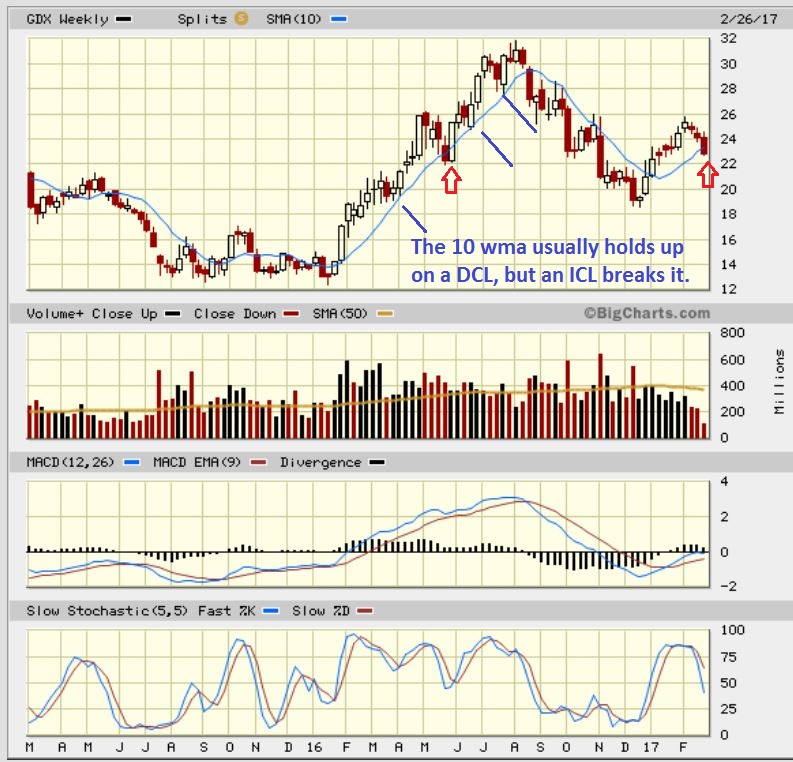
GDX WEEKLY – I am seeing things in the weekly charts (This is only 1 of a few things) that usually does not happen on normal pullbacks to a dcl, and definitely do not happen 2 months out of an ICL. This needs to repair itself very quickly in my opinion. It looks like the MAY 2016 ICL. This HAS happened in the past, but it can lead to those long consolidations that I have pointed out before.
I have to explain what I am looking at in each chart, and you will hear bullish thoughts, and you will hear and see bearish implications. That is the difficult part, because the Miners are acting very unpredictably. I have seen this in the past during a Bull Run, but it can become the dreaded unpredictable sideways chop. I will show that too.
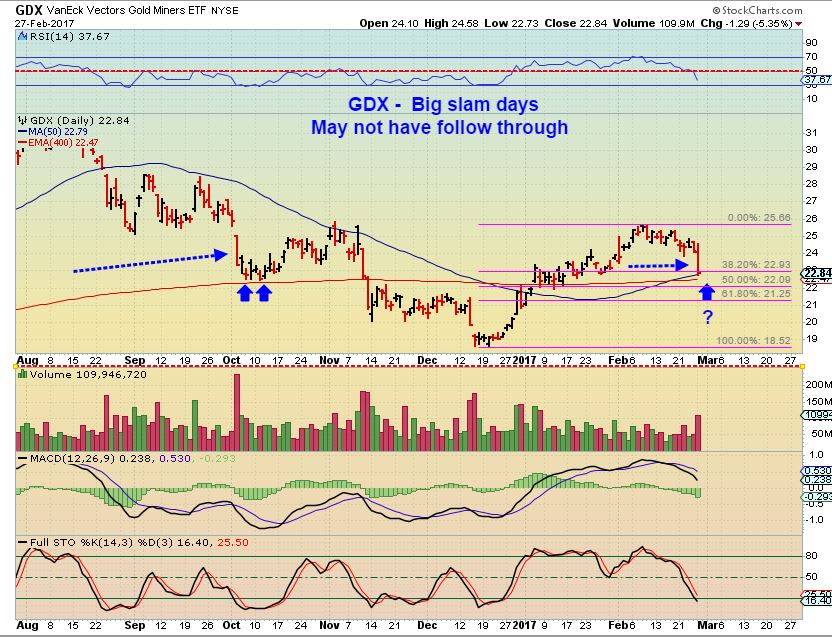
GDX – This chart is not so bad. The blue arrows do show that at times a solid slam down day exhausts into a low . With GDX landing on the 50sma and the red line 400ema that was supportive in October, we could say that this may be a slam into a final low. Maybe we get a 50% pull back? SO what if gold pulls back from $1264? GDX could ‘bottom’ out at the 50% area, like it did after the slam in October ( like the blue arrow on the left). THIS would indicate that selling could be finishing up for now. Stochastics is near oversold.
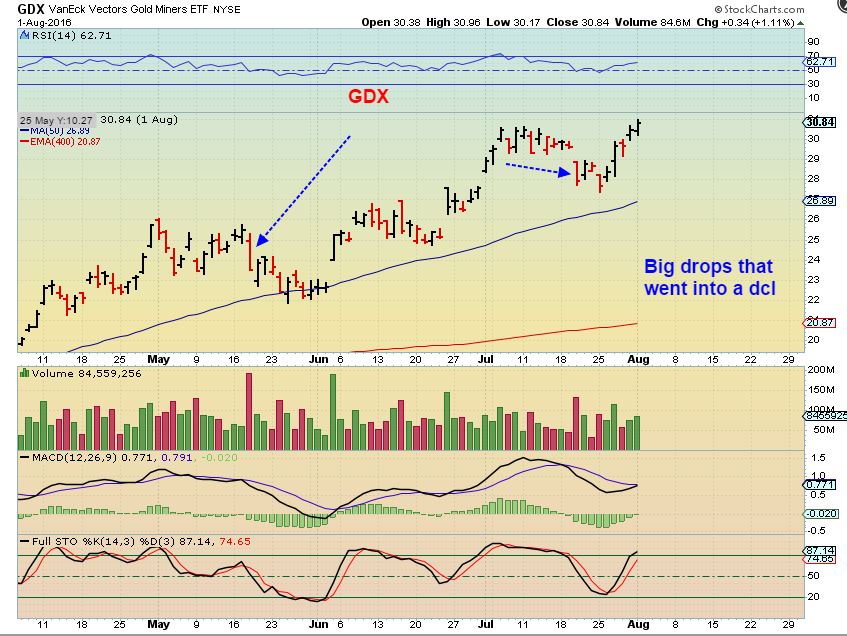
GDX in 2016 – I looked for 1 day slam downs in the 2016 Miners run up and yes, we did endure a few at that time too. It did not happen as EARLY in the run though, like we see now, but I wanted to see what happens in the days following a slam down. Here we see that price still drifted a bit lower to a dcl, then took off higher.
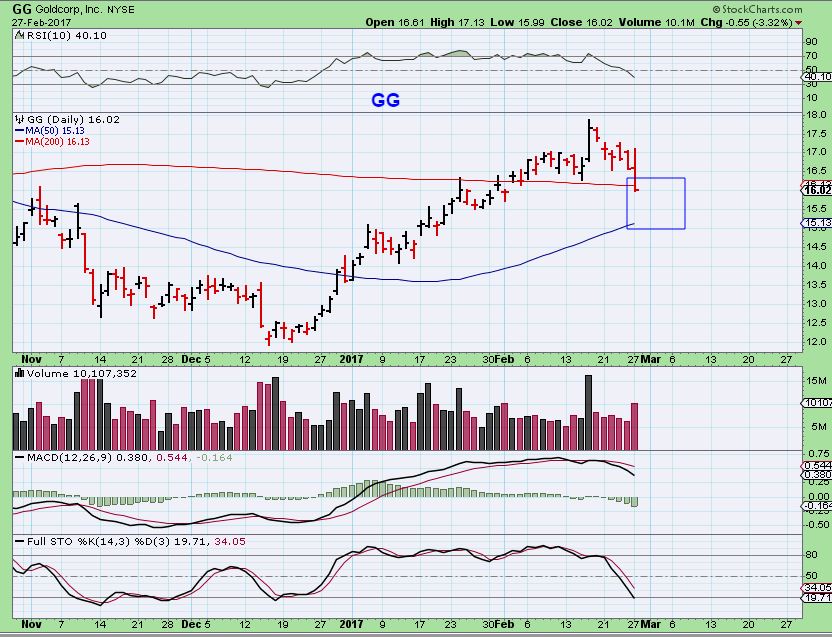
GG – GG looked fine when I looked at it this weekend. Monday it broke with volume and closed below the 200sma. It was actually very bullish looking this weekend, climbing straight up and still holding near the highs, but now it broke the 200sma. Maybe we’ll see just a quick drop to the 50sma? Mondays action isn’t too bad here, but let’s look at one that’s a bit more ugly.
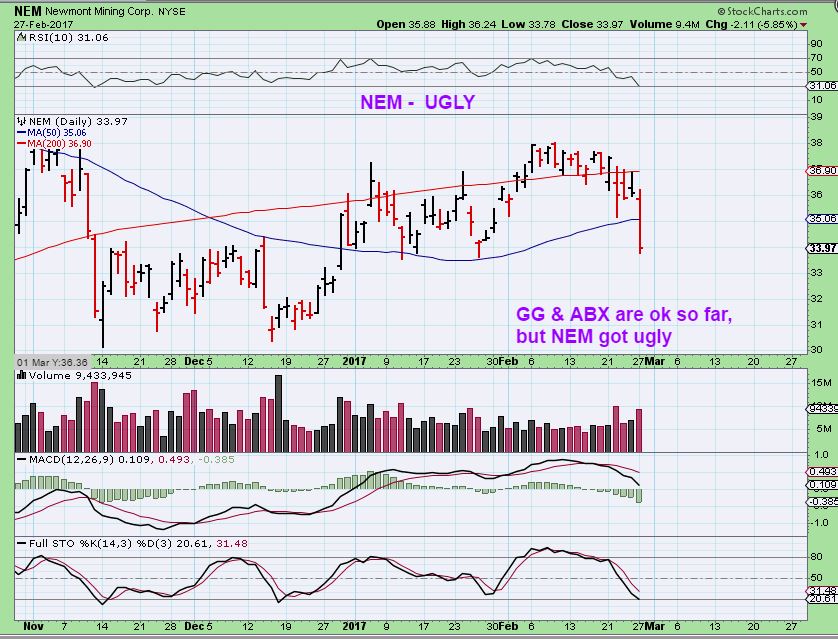
NEM – NEM looked weaker and yet it tagging the 50 sma and bouncing along. This got ugly Monday. So far, NEM lost the 200 and 50 sma. Where is support? Is this a Shake out or break down? Now I would say that this is UGLY with Gold at 3 month highs.
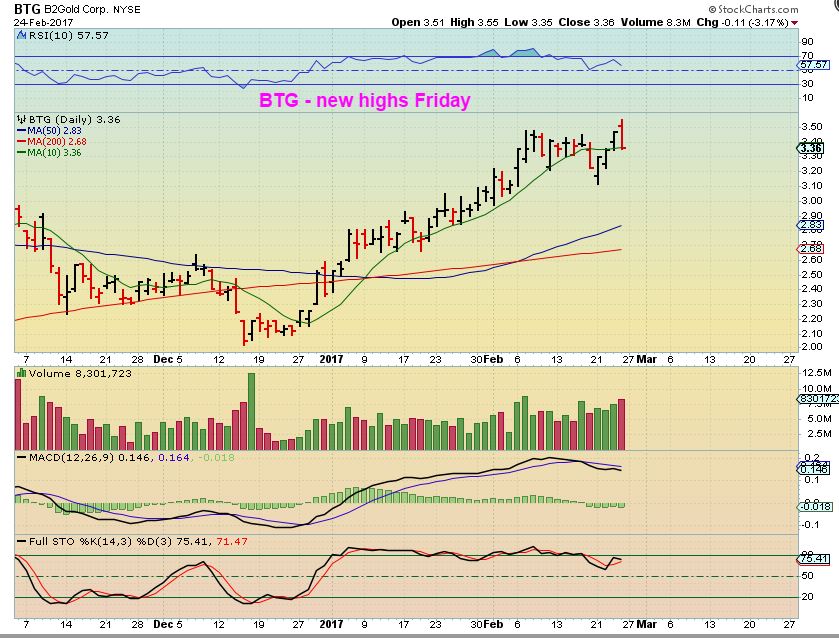
BTG – I used BTG in the weekend report as a strong Miner and it looked quite Bullish at the highs, right?
Even BTG got smacked down out of nowhere on Monday. The MACD is ugly and it lost 3 days of gains in 1 day.
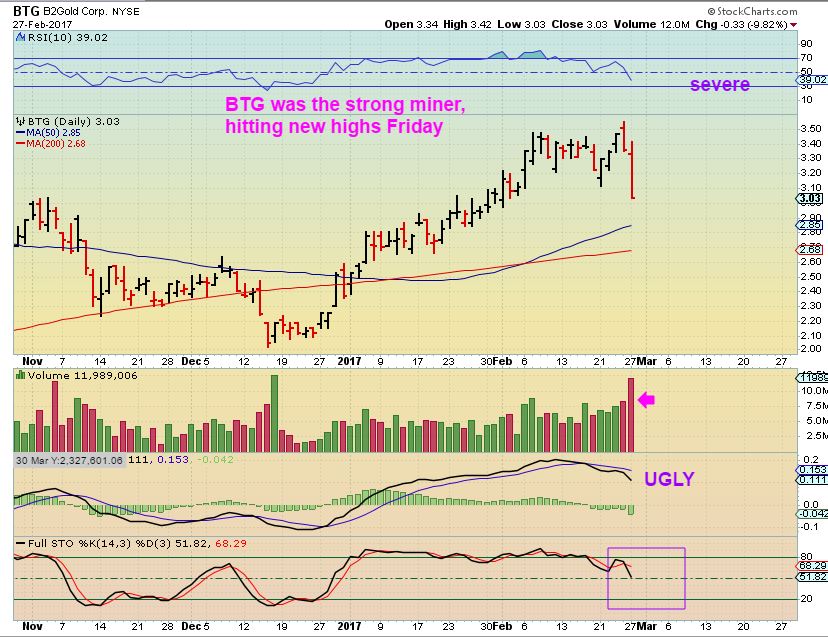
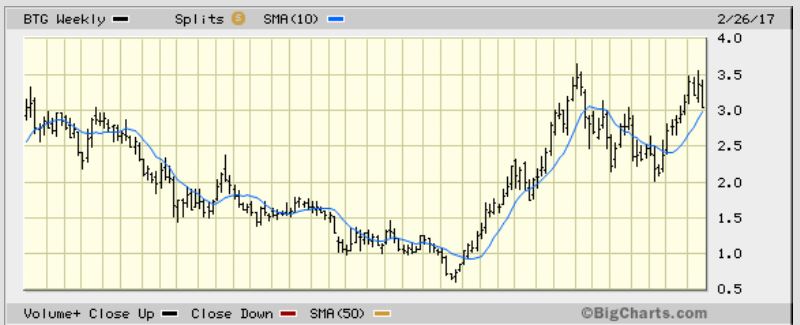
BTG was not only at the 3 month highs as of Friday…
BTG was at 3 year highs last week! It was looking ready to break out to new highs and added to my confidence that Miners wanted higher price. If GOLD broke above 1264, I thought that this would rip higher too. Monday it got slammed down with the rest of them.
So I can say that the above charts add a bit more concern to the recent selling, because Monday accelerated and even took down the winners.
.
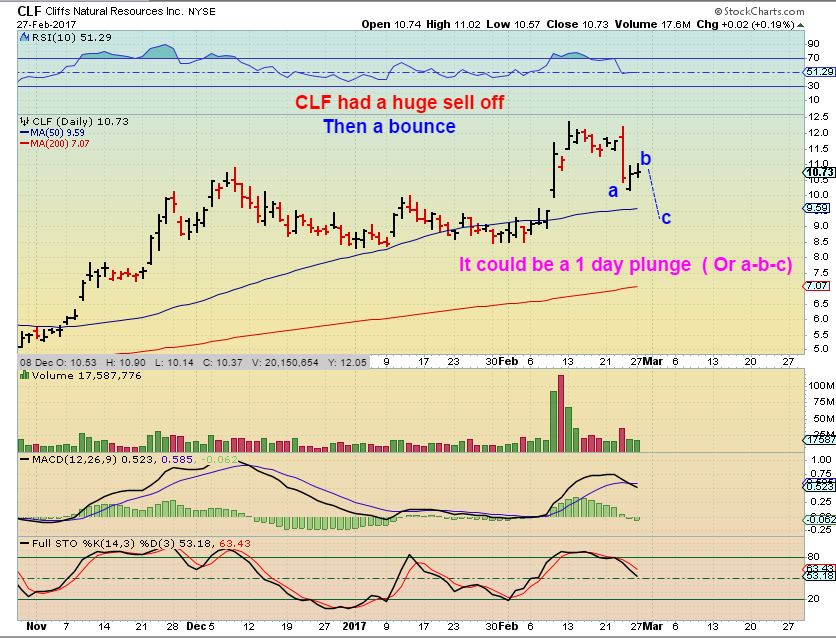
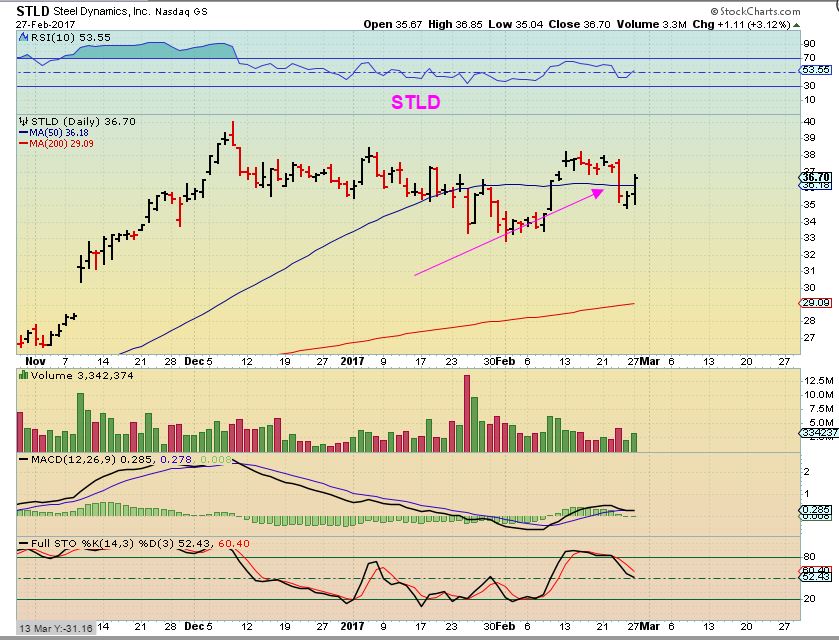
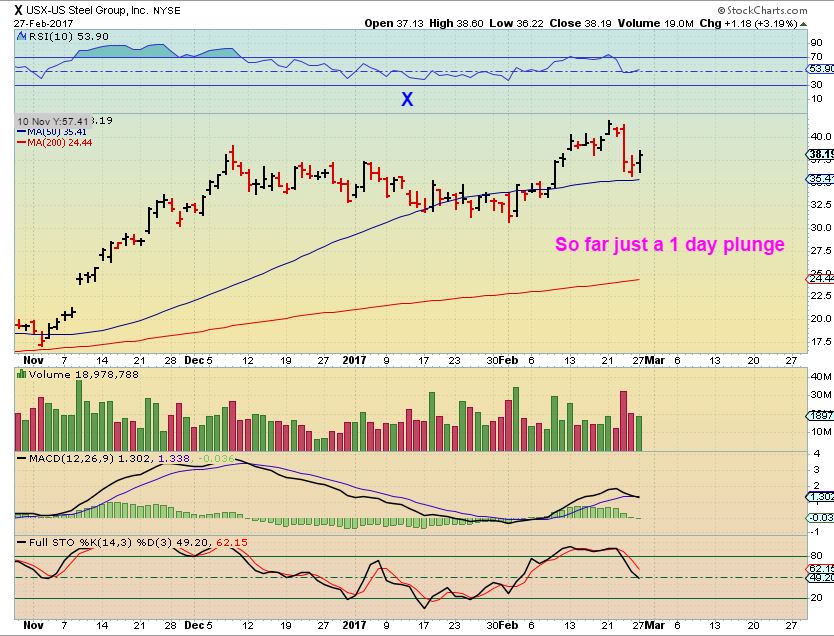
So with our big slam down day, I quickly thought about what I saw last week. Many of the ‘Metals’ stocks had a sharp slam down day last week too. The good news is that the selling exhausted and was pretty much complete. Will Miners act like this? See the following charts. The only thing that we don’t know yet , since it happened last week, is …”Was this part of an A-B-C correction or is it a 1 day exhaustion sell off that has completed?”
CLF – Big slam just like our Miners last week, but that selling ended with a gap down reversal.
STLD – Ditto and STLD lost the 50sma, but has now recovered it.
X- 1 day slam and the selling ended so far.
So even though the above charts offer hope that Miners may just have a flash crash and then bottom out, they need to try to recover quickly to repair the weekly charts ( and nothing says whether they will or not). After Monday I am seeing weekly charts experience damage that is happening too early in an intermediate cycle. To be clear, I am concerned because we are on month 2 of this possible 5-6 month run, and the weekly GDX & GDXJ charts broke below the 10MA already?
With the sharp Monday sell off, and the affect on the weekly charts, I now have concerns that this is too sharp too early in an intermediate cycle. Also with this Sharp drop on the weekly chart and Gold and Silver still at 3 month highs, it gets concerning because we have 2 these possible scenarios…
.
1. Gold breaks out higher above that 1264 and the USD drops , and maybe Miners just put in a DCL. They will put in a 1/2 cycle low when Gold finally drops to it’s dcl.
2. Gold resistance at the 1264 stops the Gold rally here, and Miners have been selling off ahead of Golds coming sell off, so it could get even worse for miners?
.
Conclusion: The weekly charts are of concern. We have to honor stops, and if you are already stopped out, that gives you an opportunity to watch how this plays out. In my opinion, Miners really need to recover quickly ( for the weekly charts sake). I won’t recommend trying to catch this bottom in Miners without confirmation of a swing low, and I do not recommend leverage long or short unless you are a fast trader in front of your screen. As always, honor stops and do what you need to do to remain unemotional whether it sells off further or rallies out of the recent slam down. There is always time to make a good decision as the trade plays out. As I mentioned, I did sell some of my weaker miners hanging at the lows a week ago or so, like PLG, TRX, etc. I was actually going to add to VGZ after showing it in the weekend report, and it still held up Monday, but I wont add to it yet- I will watch it and I may even close the trade until I see whats going on.
I really still want to dig deeper into this situation and tomorrows report will include more thoughts on what may be happening, and what this disconnect in Gold Silver & Miners lead to. This early in an intermediate cycle, we should see strong healthy charts coming out of the lows. In the past, when we didnt, we were in for longer consolidations and deeper swings. Things are not quite clear yet with Gold at the recent highs and Miners sharply dropping, but Tuesday might help to clear things up. I personally will be doing less trading and more chart research during the day Tuesday. Thanks for being here, and don’t give up hope that this difficult trading too will pass. It always does, and there is always another trade.
.
~ALEX
.
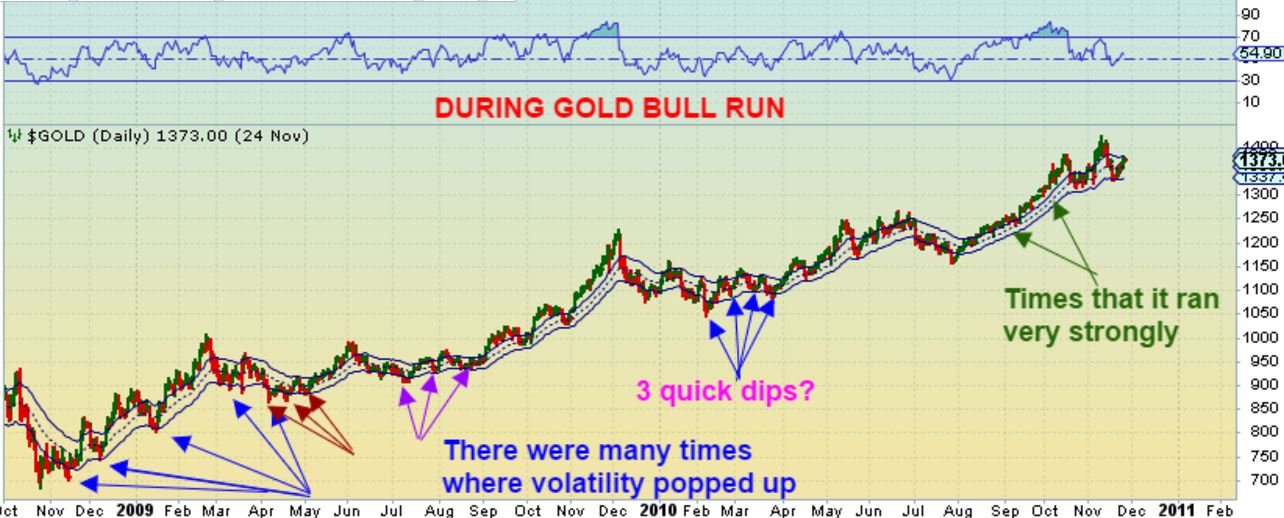
I’m showing this chart again, because during this time, the movement was rather unpredictable. This consolidation also has sharp drops and surges higher.
And this HUI 2008-2009 close up shows how difficult the Miners were to ride with that wild swinging action in 2009. It was still overall an uphill run, with new higher highs along the way, but it looks like leverage would have been boom to bust over and over again. Your account value would have looked like this chart day to day. Gains, drop, gains, drop, gains, drop.
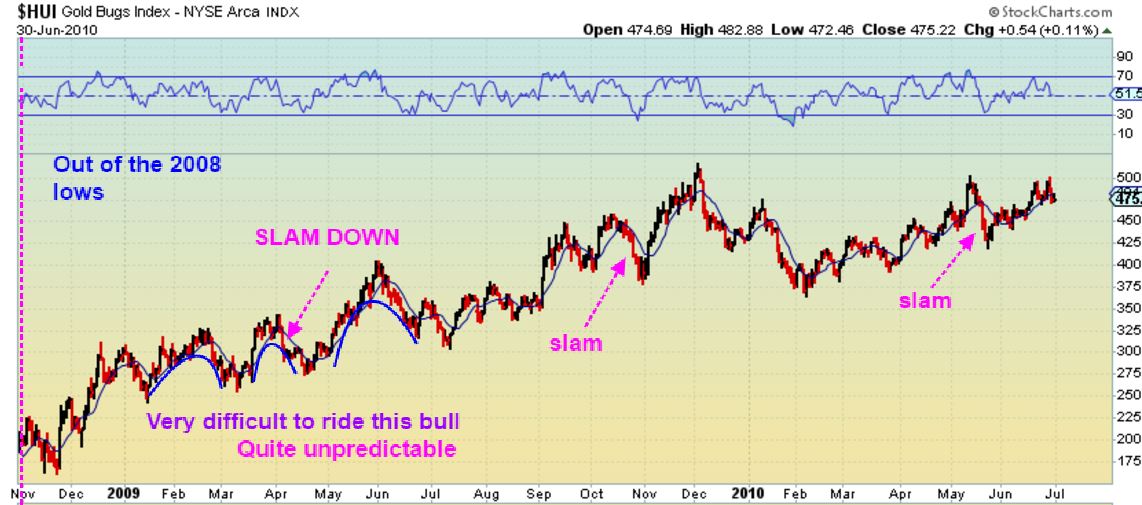
With that crazy ridein the above chart, please notice that HUI went from roughly 170 to 500 in 1 year. HUGE gains, but day to day tough to ride.
.
NAK – This was just a chart of a possibility that I drew up for NAK. When a chart ‘breaks’, you can get a V-Bottom with rapid short covering, or at other times it needs time to repair, build investor confidence, attract buyers, and so on. This was an idea of a possible buy area for NAK.

Also some of those Medical Marijuana stocks had a slam down and I thought that they may still be fine. I was pointing out in the weekend report that the CNAB slam down looked quite similar to the one in December. If so, that would end the selling.
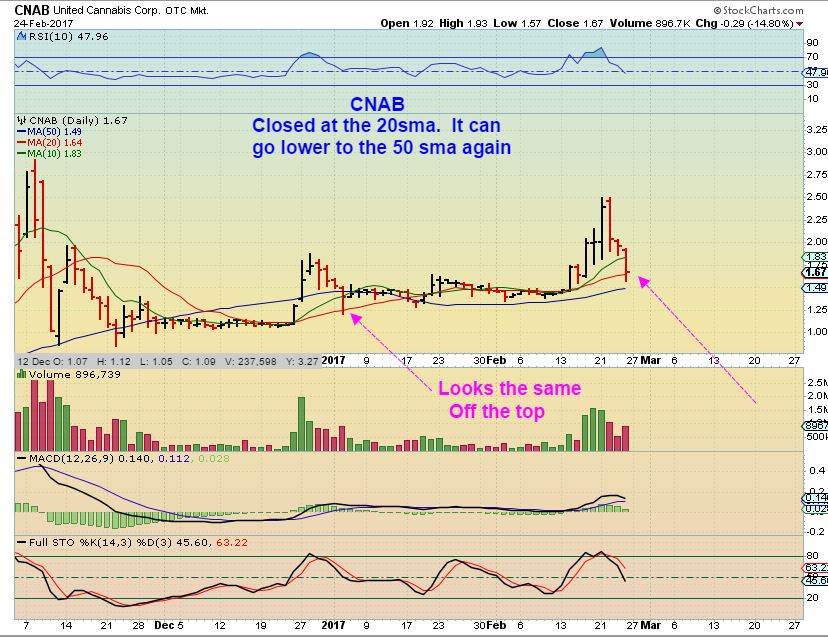
CNAB – We got a reversal on Monday.
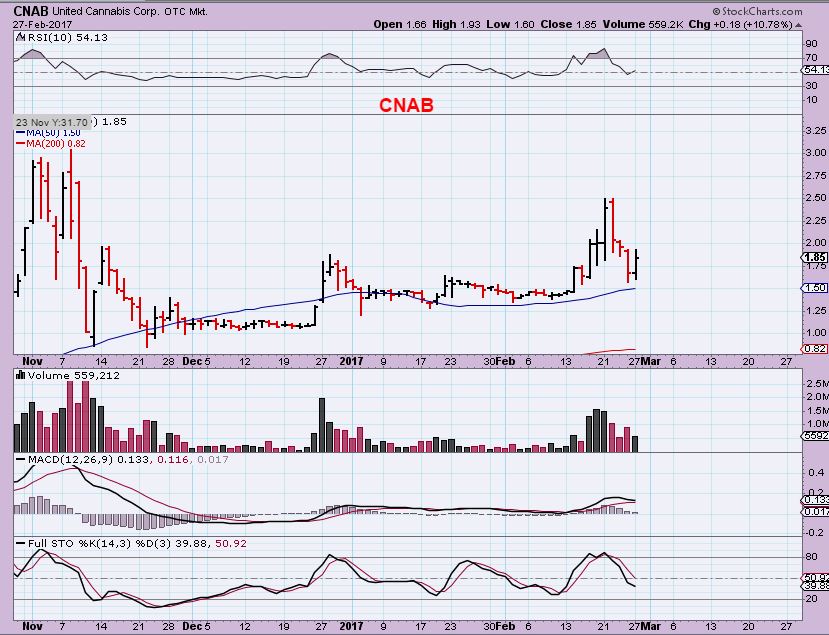
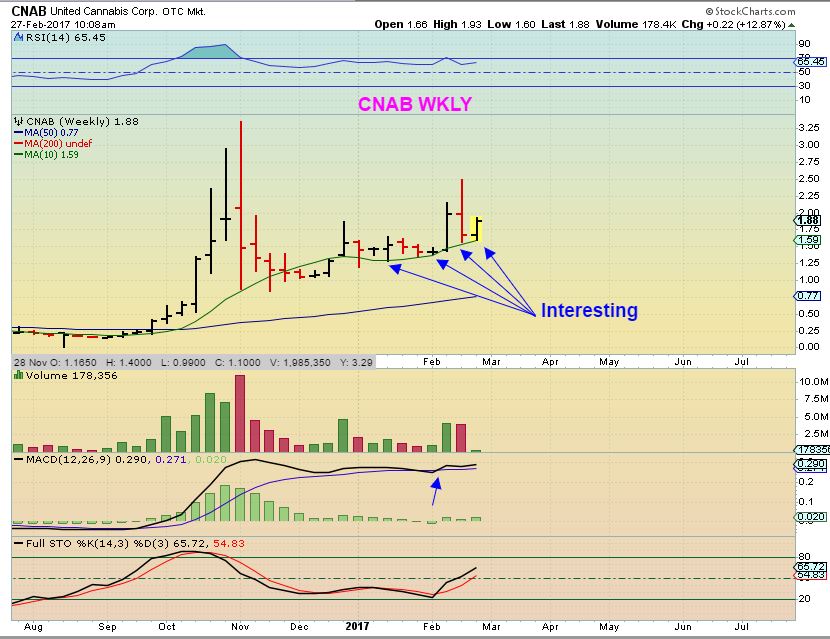
CNAB s weekly chart is also still healthy


What would be an appropriate stop level on GDX, GDXJ?
That always depends on where I bought it or entered a trade.
How much are you willing to risk or lose to see if you are wrong?
I meant to add to the report ( And forgot) That BULLISH SENTIMENT for Miners is in the dumps, which does usually happen right before a move higher.
Thx Alex.. very depressing few days as I have back a chunk of gains but I have a core which I am holding. Hopefully it’s a shakefest as I will say the last few have shown huge bow numbers.. now I am not a close follower of that but will say it’s worth noticing as appears someone is accumulating.
Yes, B.O.W. and sentiment does seem to point to a bounce or rally soon. A temporary low of sorts.
At this time (Likely today) , I am going to really start looking into the moves out of the 2008 lows and try to find some clues as to what may be next.
Looking at the charts, most Miners peaked in early to mid Feb and so did my account. : )
I have been bleeding out in the selling too, and this always happens, because nobody consistently sells THE TOP. That is why we always see our accounts making great gains in the first 2 daily cycles , and then we start to give some back until the next DCL is in place. The hardest part is giving some back. Anyone holding leverage made greater gains and now lost a bigger chunk on the selling off of the top too.
We need some more good trades to make gains again, and even a double top in Miners before dropping into a 3rd or 4th dcl / ICL would give us additional gains and a better final exit than where we are now.
The bow numbers along with Elliot wave counts/cycles/your charts are making me really think this move is about taking stock and moving it to stronger institutional hands.. I am not usually a conspiracy guy but this smells engineered to me and by the time charts better the train will be long gone…
What is BOW please?
Buying on weakness.
Edit: What the boss said 😉
When strong selling occurs, it is a Buy On Weakness ( B.O.W.) number. The Higher the number, the more likely a low will be arriving soon ( temporary low or dcl).
Thanks CF and Daz
Buying On Weakness
Nancy, you will also see reference to SOS (selling on strength) the reverse.
Thanks for a well thought out report Alex. Now that I was stopped out of GDXJ yesterday, I am going to avoid miners till they show they are in an uptrend and not getting whipsawed. Going to move into industrials for a bit and keep one eye on miners progress. I’m also watching healthcare sector.
Not a bad idea. IF we just roode out the first 2 daily cycles, we could get a 3rd and 4th that wont make new highs . The 3rd could, or I’m hoping that miners do a double top on the 3rd daily cycle at least. The way this dropped, I might even go long for a bit in the 3rd daily cycle, and try to short the rill over from there.
Industrials might work out.
Solars have been working out too.
XBI or IBB has been a HUGE base building process – LABU did look good
I was going t ask you about LABU and IBB
I do like yesterdays break higher and then look at a 2 year weekly chart, that is a long base that it may be breaking up from.
GDXJ is up 70 cents in premarket, so that is encouraging – right off of the 200sma.
Yesterday it had HUGE volume & may have been capitulation, but to keep it in perspective, GDXJ was down over $3 yesterday also.
For NAK-ers…new opinion article Seeking Alpha
Very timely report Alex. Thanks.
I am glad you stated the Sentiment levels for the Metals….very important imo.
I forgot to put it in my report, but I think it was under 10% bulls for Miners, and that is deep low ( Almost ICL levels). This dip was odd.
Yes for sure.
DCL soon imo.
I am staying with Gold and Silver as my Sector focas……both seem good to me, although a corrective wave is due…..don’t “freak out” ChartFreak ! JK 😉
just a deeper ‘2’ …?
maybe 4 of iii ? for GLD
peeps bailing b4 trump speech 2nite? it is an ‘odd’ event ..
you know what they say…. ants will march in a line on the path — if encounter an obstacle .. will go around the obstacle .. and continue on the intended path….
RE. EW .. but same could be said for standard TA…. no?
Could you repeat the question please ? I lost ya 😉
lol..sorry – back to work ya know ;o)
I have heard many times in reference to EW and “News” events — that yes … News ‘may’ affect the waves … but just temporarily… ie. ants continue on the intended path…despite the news…
Oh I see….lol….yes agree ! Charts Never Lie !! Humans and News do…… 🙂
(that last statement was not political btw 🙂 )
Say what ? lol 🙂
BTW if I am leading that ant march we are going straight thru that obstacle ! 🙂
lol.. u & ur old trusty bulldozer…;)
Ahh the memories…..
😉
MTL looking for a bottom…..
FCX also looking for a bottom…. (I have a few Calls on this one)
GRNH is very tempting……too add.
One day shakeout? If miners can stay strong all day maybe but I think it will take a little time to repair the damage.
I was watching the 5 minute ( 3 day) chart and thinking , “C’Mon V-Bottom!
But after the 1 day slam downs in prior times, you can also get a bounce around the lows for the next few days to put a low in place.
wondering if we might be in for some envelope channel chop in GDX?.. as per 2014.
https://uploads.disquscdn.com/images/c29cbff0175dae37a06364efa4bb3456a8afca176563882f5d8810e9cd2f3279.jpg
Anything can happen, but 2014 was a bear market.
I usually do not compare bull market action with bear market time periods….they tend to act differently strength and weakness -wise. Unless this was just a bear market bounce after the sell off last Aug – Dec.( like your red line projection shows?)
Doesn’t that look like a bear fag on NAK ( like an upside down flag & flag pole? It ought to break down to that 200sma, maybe even slightly undercut it
Sure does. From the 3 month right up to the one year chart… thanks for pointing it out. Out of NAK and waiting to get back in…
I am soo tempted to add…..
That’s funny – I Am too
Just to semi-small starter a position and add if we get that drop.
Sometimes I track things better when I own a piece of it. At times I lose track of other stocks that I want to enter when I don’t have any in my account.
Oh geez I already took a starter position at 1.60 last week !!! 😉
ditto
I sold last week. I think I will do a 20% position here shortly. This is such a funny stock. It’s all about future possibilities and what is likely in the ground, and what the EPA is going to do, and what Trumo is thinking more generally. But man, is it ever watched closely by a lot people.
CF……..Why couldnt GDX”s drop yesterday just be a stop run by the BB”s ?
It could be viewed that way, but kind of odd that they didn’t do the obvious stop run ( At the 50sma, where most really would place their stops). Or will they?
Take a look on Aug. 16 at the 50 sma for GDX….not acting the same ???
I’m not seeing it on Aug 16 for GDX.
The 50 sma held as support on Aug. 16 THEN Gapped down the next day GDX is Not do that this morning and the 50 held so : not acting the same ?
I don’t know what I’m doing wrong, but I dont see that on GDX Aug 16, 2016.
Can you put up a chart?
Yep…..
https://uploads.disquscdn.com/images/58446500120c493d40b9da3745b6f8267ea06f766b17704ab4b96aee90f88d20.png
Oh, I saw it on the 22nd – lol. You kept saying the 16th
yea sorry shortened up the time frame on my chart
So we arent getting the immediate break down below the 50, but it can spend a few days here. I hope it holds like in May at the ICL 🙂 It sta;led there for days but held that 50 pretty well
We have;
The 50 sma supporting…..so far.
Due for a DCL very soon.
Sentiment very low.
22.78 also held which was the first DCL.
Gold and Silver charts look very good still……so far.
For me this would be a place to add with a defensible stop under the 50…….???
– true
– true
– very true
– actually, it didn’t , but was it a dcl in Gold & miners or just Gold? Miners lept making higher lows in that sideways move
– yes, really good
For those in front of the screen, I’d say with a ‘defensible stop’ yes, and if stopped out with a slam and reversal tomorrow , have the mind set to get back on the horse.
lol.. i was JUST typing “true true” same time…
WEIRD
to ken… besides… I yiah yiah…
*Get outta my head CF
😉
you are correct it did not hold lost it by .05 GDX
Really appreciate your input Ken.
YW Daz just my thoughts…….for me these are the times I personally look for entries.
Yes, I enjoy your thoughts (backed up by charts of course!). Lots of noise sometimes on this board now, but when i’m skimming, you seem to ask the questions that i’m thinking of, but am too apprehensive to ask at this time. Thanks again for your input. Every day is a school day.
No need to be shy we are all learning here imo never too old to learn even when I am wrong. 🙂
That is my concern. I have read a number of theories on the stop run by “them.” If so, “they” wont stop at the 50. Break that and we’ll drop another 5%. That would be a spectacular buy imho.
Certainly a possibility Markm.
And it looks like the answer is ….they will do the obvious stop run. Possibly tomorrow if not today.
PALAF very nice ……
That volume though… you buying here? Or already in?
I bght. UUUU and PALAF last week, I forget what day.
I think CF and Maria added too at that time ?
well .. i ‘wanted some’ did not however..get sum
*myLifeStory
*snicker 😉
plenty still available to get sum……. 😉
true…true.. im young and healthy …
…o wait … u were talkn about UUUU???
*MEOW
was i ? lol
https://uploads.disquscdn.com/images/9312c095e56f58bc5664dfc9796428cd2fab506390f2f8e52279e1ebd2936035.jpg
Win sum, lose sum 🙂
Just sold my position in miners with a tiny profit. I wanted to see them take off to gain confidence. It didn’t happen.
Anyone else thing natural gas looks good here?
yes
Yes, in various time frames. Tempting
Would you recommend UNG or UGAZ? Or are there other options?
… we do not talk about fightClub….
*bort*?
Not ‘Bort’, “Boil” : )
lol
My only experience with Boil is with “zuup”: https://youtu.be/fDLiVFpYzOk
LOL
There is also BOIL , which is 2x I think . Ugaz is 3x
how confusing.
do they do a crude oil etf called BGAS?
NG indicating h&s on the daily and weekly, top of the right shoulder target 3.3x ish
what’s that, translated to UNGlish?
Remember too that the NATGAS inventories report is released on Thursday – so far NATGAS has bounced for a couple days and then gapped down. That will change eventually – but safer to buy after a swing low is confirmed. By then, you feel like you are chasing with UGAZ however
Indeed. NatGas bottomed and moved higher, then came back to a double bottom. Now it has moved up to the previous high. IF it breaks above I’ll buy. Im watching the 2hr time frame.
Is anybody thinking leverage yet – JNUG or NUGT? Risky but I’m getting tempted to take a nibble here and see how it goes…
Nope, not me. I need to see some direction.
Totally get it. I usually need that too. But I’m just getting an intuition that won’t go away, that why I asked how others are feeling about it. Think I’ll go for a walk and clear my head… 🙂 Thanks for the response…
Thanks Bill. The walk cleared my head and I did not nibble. Still watching closely though 🙂
I’m watching the DXY (US Dollar) chart. 2hr time frame watching the USD bounce off the 200sma. I’ll wait for a break below that before looking at miners.
Took a nibble of FCX.
Welcome aboard… 😉
Thanks.
Nibbled. Lets all hold hands. Tight(ish) stop.
I bought a bit the other day. Hope it works out for us all, risk/reward looks interesting.
I’d like to get into X too before the president’s speech, but I’m a bit afraid it could fall back to the 50.
If CLF filled that gap and landed on that 50 sma, I wouldve bought that before the speech.
It didnt cooperate
It’s always nice when you can get your ducks in a row. Unfortunately it’s rare.
CF GDX chart below
NATGAS looking good here. Break higher then a retest of the low. Looking for a new higher high to enter. Close.
So yesterday, it was right about now that I had to leave for an appointment, and things looked pretty good in Miners so I removed my small JDST position. JDST was slightly red at the time.
I came home and JDST was up 28% – ( :-O
I had walked away and didn’t Stay Frosty
Hope you don’t have an “appointment” today………
I’m afraid to make appointments during trading hours now .
LOL. I usually go the gym around now. I feel the same way.
I haven’t go to the gym for a long time after I start to trade gold/silver.
I just made some “appointments” Dentist, Doc’s,Vet’s and a long over due STD check. See you guys at 4pm.
*giggle
So funny! When I travel I usually get a fax to sign papers my house sold.
yeah .. or ‘pretend band practice’ ….
I lightened my miners 25%. Things a bit too cloudy right now. Thanks Alex.
GFI is up about 9%, it’s really crazy
You beat me to it!
It might be one of the first miners to recover its loses from yesterday.
shall I keep it? 🙂
For now I am sitting tight.
It did a 69% retrace, if it gets past 3.74 then next previous high is 4.47
you could do a stop at 2.95 swing low from yesterday.
thanks. I’ve been holding it since last December at $2.78. just hate to give back the profit. 🙂
GFI is an encouraging chart- taking back most of yesterdays losses.
I think that a few of the encouraging ones were tickers
‘GOLD’ – RANDGOLD RESOURCES – regains the 200sma ,
EXK – bounced off of the 50sma and regained the 200sma today
GFI – erasing almost all of yesterdays losses
thanks, Alex. I’m sitting tight. it seems more people are buying. 🙂
A lot of these inverse head and shoulder patterns got a lot more symmetrical with yesterday’s plunge
https://uploads.disquscdn.com/images/220eaf9dc8cfcd930f1e157bf909e5ea15f8871122eef2fe1dead957330eedba.jpg
GDX right on top of the SOS right now. Just for your information BTW.
http://online.wsj.com/mdc/public/page/2_3022-mflppg-moneyflow.html
Party pooper!
But thx
Not sure about “party pooper” feels more like “hair of the dog” !!
Ken – F.W.I.W. – maybe you liked GRNH dropping onto the 200sma on super light volume?
It just reversed and went green too.
I like !
Added CANN this morning.
MNTR perking up after that sell off too, maybe similar to CNBX.
Agree.
I already have a piece. 🙂
Yup. Looks like new support level to me.
My opinion is the bankster/blackboxes are manipulating and take out the stops and are accumulating
that way back in. They can see every trade. Also, trying to create fear and knock more people out.
They know miners are held by those who want Austrian economics . . . not their Keynesian debtonomics.
I agree. That’s what I’ve been seeing for over a year now. And right around jobs, FOMC, or other such dates. Now with the SOTU address tonight, it falls right in line with the shenanigans. Also explains divergence between miners and metals. Question is, are they done??
I think they have accumulated enough physical and are running out of physical and were exposed
via lawsuits so now they are after mining stocks for “in the ground”.
That would make sense. Best vault in the world is the earth…
and they are after the mines after crashing the stock . . . .
preparing myself for another stop run
For you that probably means placing stops in or lightening up
for others it might mean buying diapers – lol
not placing stops just mentally preparing
Alex, I was looking at GDX and JNUG 2 year charts. Quite different.
3x etfs are designed to go to zero, so they just keep splitting them again and again and again. Charts will never match the underlying miners etf.
Plus GDXJ is JNUG , NUGT is GDX
Forgot about splits. Thanks for clarification re Jr’s.
Yesterday’s plunge eliminated the EW count wave 1, wave 2, minor wave 1, minor wave 2.
It now looks like we have wave 1 up and possibly wave 2 done or hopefully close. This new count actually gives us a higher price projection for wave 3. Previously wave 3 projected to $53 on GDXJ. If the low holds we will now project out to $61 for wave 3
(Unfortunately I am having trouble attaching the file)
If your having trouble, copy and paste the stock charts link or save the .jpeg( I think). Would love to see the chart.
Just as a general suggestion Alex, maybe a guide to members as to best upload images would be great.
Sounds like he is having trouble with the best way to upload images
What is the best way? save as a jpeg then upload? Just trying to figure it out myself…
Have you ever attached a chart here using the box in the lower right of the comment box?
I just save a chart to my desk top or a folder and upload it with that box that says ‘upload images’ when you roll your cursor over it
Yeah, sorry just thinking out loud. I’m a douch.
That’s the easiest way, but today Disqus is having issues.
Yeah, got that but it doesn’t seem to be working. Just wanted to help out zig zag.
Good Idea.
Hopefully this will work
http://schrts.co/pxwIPz
That works – a red rocket ship, right : )
Maybe…..
But both Gold and Silver have a different count….
When Disqus is running correctly again, would you mind posting, maybe tomorrow? I’m having trouble with my count now, so would be very interested to see how you handled the recent move. Thanks!
I was watching this as a trader – a sell signal or a break out higher.
This is JUST short term idea, but it could be a bear flag intraday
Guess what- my imagine wont upload either
tried again here- something wrong with discuss
what’s the stock you’re looking at?
GDX & GDJ – It still wont let me attach it : (
Sorry for the confusion, yes GDX GDXJ.
I hear you!
bort broke it…
*wasnt me
what’s that little snippy snail LGCY tryn 2do … hmmmmm
Jinx’d it sorry 🙁
what stock are we looking at here?
I was looking at GDX & GDXJ – They broke down, so they will likely form the double bottom if the lows are in. If not? A shake out below the 50sm?
that’s what I am looking for. a bounce today could have only have been a bounce. V bottom are super rare, above all after such a bloody day like yesterday.
I have a cycle guy who is pointing at the March 6-10 window as an important one. His stuff has been good for quite awhile so kind of watching for a miner low and stock market high as a possibility in that time frame.
Thanks. Glad I didn’t nibble earlier…
So GDX & GDXJ did break down and now ( 5 minute chart) we seem to have a double bottom with the MACD divergence & RSI divergence in that time frame. .
ABX below yesterdays low
GDX back to the 50 sma….will it hold ?
I’m having trouble loading charts as well. But interesting correlation between TLT (20 year treasury) and GLD…
I would say that DISQUS is having problems. No one can upload ( or attach ) charts
like TAP flag under 200ma.
Nobody mentioned Gold – quick $10 drop. Miners dipped back to the low of the day and seem to be bouncing currently
holy crazy price action…..
Should see some selling with this break of the 50 sma…..
GDXJ on a 5 or 15 minute chart looks like it is going to hold the lows. A bit different from GDX.
Good divergence too.
Meaning…..you jumping in JNUG before the close ?
I do not have a good feeling……
No, but I really do like the set up. If we had 4 or 5 more hours in today, I’d have bought that double bottom low and see how it played out – but with the chance of a gap tomorrow, the risk is too high (Unless the position is very small).
yea agree
EGI is not holding the middle daily band but still looks to be in a decent spot
I like it a lot. Bought some today and will buy some more on a decline to about .50
I am Not playing GDX here…..this thing could gap up tomorrow morning or gap down…..how will the the congressional speech be perceived ?
Take a look at DRYS – the volume and a double bottom low.
Vegas at its finest
yea that frikin thing made a lower low and stop me out at 1.96. grrrr
https://uploads.disquscdn.com/images/029bcf0befd4785759742325926db79a32f0af68dcadeec31f34b82bc7f88259.gif
I STILL CANT UPLOAD CHARTS…> WHAT DID YOU DOO SCOOOBY DOO
I even tried the ole drag and drop.
… that will be $375 please
*id tell ya…but id have to ….
nothing different ….. i refreshed…? lol
I restarted my laptop after lunch, cant get any fresher than that
hmm… i must be *special* ??
L .. O .. L
did u clear ur cache?
test….
https://www.tradingview.com/x/fnvsClOB/
apparently this link works… so fyi its just a copy of the previous move… ABC x ABC
I was just going to say BUMMER, then I saw Marias reply and apparently Maria knows a magical way to post now??
OPERATOR ERROR *** OPERATOR ERROR (LOUD BUZZING SOUND PLAYING IN BACKGROUND)
By the way, I rode DCIX for a while but got sea sick & bored
SB kind of look good
Same. Was tempted a bit, but no, going to wait for more clarity.
Had bought JNUG yesterday at close, stopped out this AM at a small profit once it pulled back from highs (trailing stop, tight for a 3x).
if it looks like a shakeout, and acts like a shakeout, and smells like a shakeout– How in the world do we” invest” in this PM sector without being driven nuts?
No clue! But if you figure it out first, let us know! 😛
with patience ? easier said than done right ? lol 😉
Buy that shake out? ; )
Actually, you wait for a swing low and break above the 10sma, and it is a tad safer
at least we got the shorter candle today, for quicker swing-low confirmation.
wouldve been a mare waiting to exceed yesterday’s red monster
Hey , GDX dropped down below yesterdays low and recovered. That does lower the parameters for a swing to be put in place tomorrow.
USD moving higher. Was squeezed
Just another thought.
A lot of times corrections are A, B, C
where C is 5 waves
Plunges like yesterday are usually a wave 3, then you chop up to a wave 4 (now?) and then you retest the low (wave 5 to conclude wave C and wave 2
The wave 4 and wave 5 help setup some positive divergences to offset the ugly wave 3 down.
I hope wave 2 is in, if not; this is what may be happening.
I wasn’t smart enough to expand the chart to the right before annotating so its a little crowded in the lower right.
http://schrts.co/2g3iZ2
VIX + 7% today …maybe a tell ?
https://uploads.disquscdn.com/images/5a4b86d865df75d90c68d55d8555ec7987303d54bea7f45eea33e10329c2fee8.png
just a test…
seems to be working ok now??
Enticing !!!! is it not ?
Sorry..Was just playn w a bunch of scenerios….. Not a projection!!! Was just testing discus.
Too bad …… 😉
a little too simple … anyway..;o)
PUL-LEEASSEEE!!!
very much so; the S&P is getting ready for a nasty spill here and should be quick. 5-10% lower by 4/15 is within the realm of probabilities in my work
Certainly due ……
Congressman “introduced the “Ending Federal Marijuana Prohibition Act of 2017,” to the House of Representatives. If passed, the bill, H.R. 1227, would decriminalize marijuana federally by removing it from the federal controlled substances list.”
http://mjinews.com/legislation-introduced-to-decriminalize-marijuana-federally/
Will have to read through this. It’s really going to take something to save my MJ positions. I got buried last week. But all were small; didn’t risk any capital that I knew that I couldn’t lose. While I could certainly now add while lower, haven’t seen anything yet that made me want to do that. The phyto-byte thing sure as hell is working last 2 weeks and def isn’t working for me! :O
Yeah, I’m out of most of my marijuana positions…holding a couple….waiting to see how things go…..keeping close eye on things – popped in and out of one today for a quick turn around but I never put a whole lot in them….
Oh, I thought you were still doing some as a longer term hold (as compared to the trading account which was pop in and out). I gave myself very liberal stops basically thinking if I hit 1or 2 out of 5 then it would more than make up for anything else (like CNBX right?). Def not working so far. 🙁 As usual, it seems I got in at the end of the party. So, I’m waiting for the next party to start up!
Yeah I do have couple longer term…those are the ones I mentioned I’m still holding…but I mostly pop in and out…I’m finding the best thing for me is to take my profit when it is in front of me…
and I’m thinking I might sell even the ones I’m holding…I might just become all short term on these…
30 minute chart of GDXJ shows classic 5 waves down with positive divergences galore.
Some type of bounce should be due.
https://uploads.disquscdn.com/images/ed611ad1c3b3c37637208b813049b655c7dc84794a242100653e8e9ed0d8776b.jpg