
Feb 17th – Choices
There are times when I feel like I can’t even find a solid trade set up, and then there are other times when I feel like there are plenty to choose from. Right now, I feel like I’m seeing a lot of trade set ups. This Friday edition is going to feature some trade set ups after a quick review of the USD, NATGAS, and Precious Metals.
.
USD – I’ve been expecting the USD to reach the 50sma and fail. SO far so good, but …
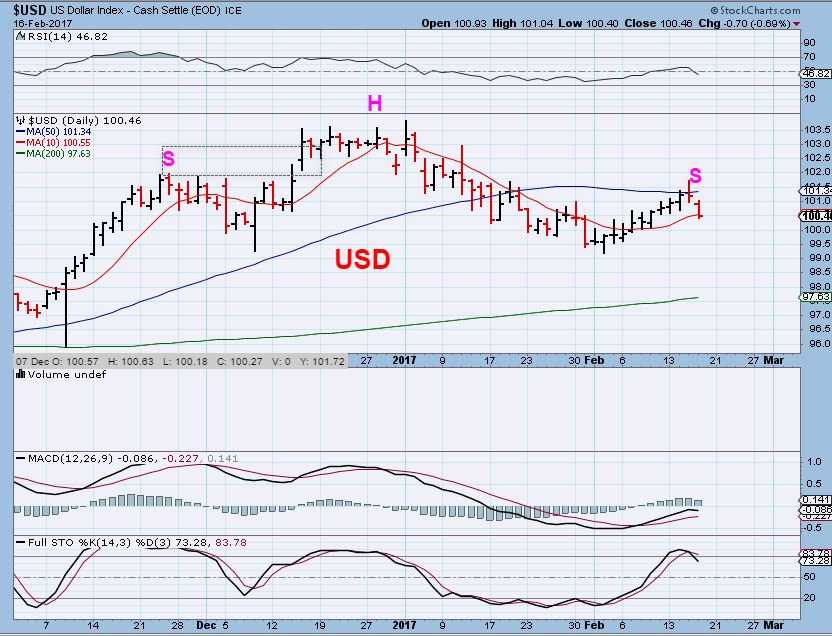
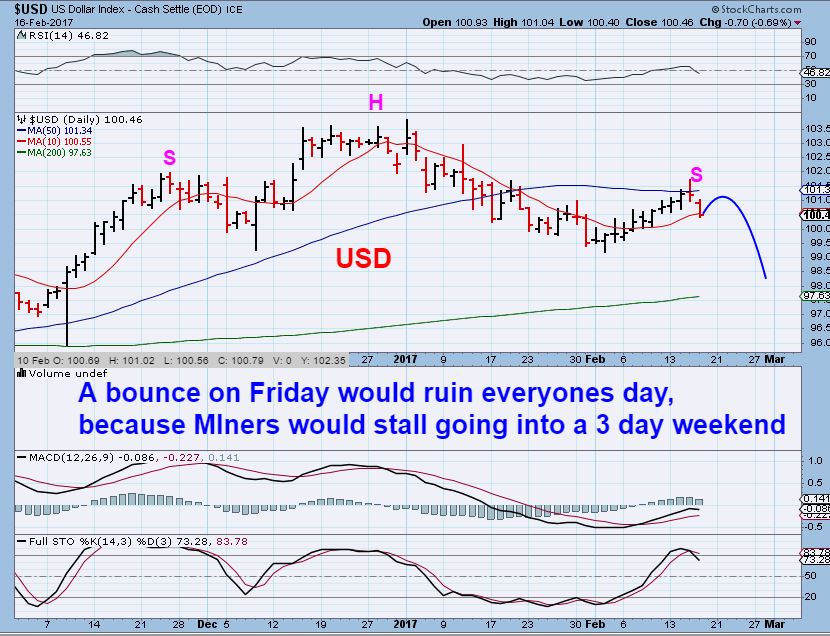
USD – Wouldn’t a bounce ruin our Friday? If the USD bounced, Miners may stall and then traders in the US have a 3 day weekend to wait through 🙁
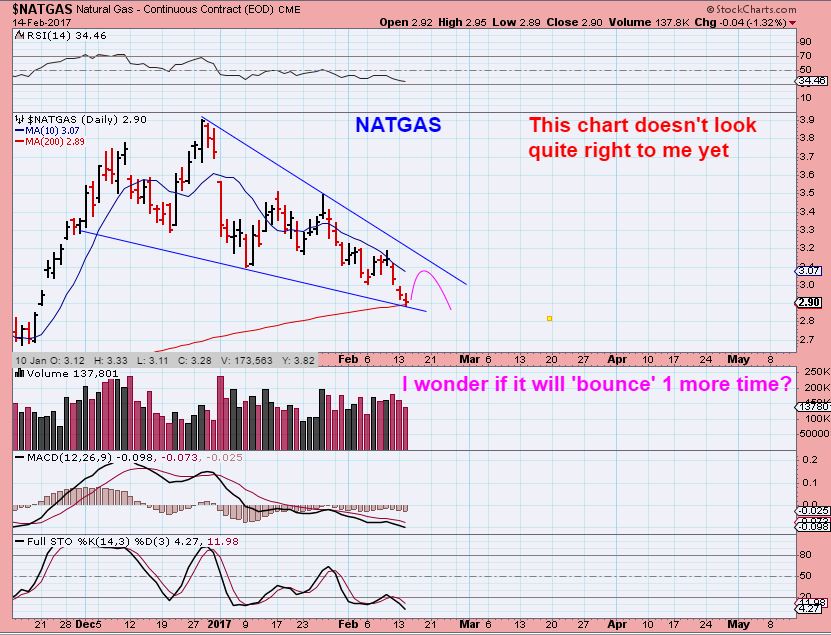
I looked at the chart of NATGAS last week and earlier this week and it just did NOT look right. Even though it landed on the 200sma as I had been expecting, I mentioned that this chart was ‘ not quite right yet’. I was thinking that it may bounce & roll over…please read the chart from Tuesday here.
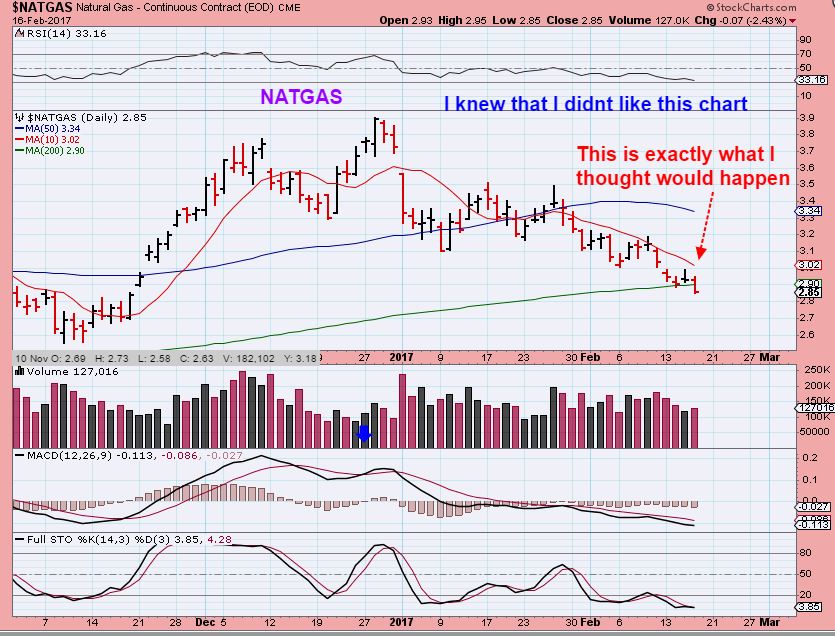
NATGAS – And it did bounce, roll over, and broke the 200sma. It is still not quite right, and I will continue to watch it until it sets up properly. This may be a shake out.
TRADES IN PROGRESS –
WRN – I mentioned in yesterdays report that this is at the apex and would either break out higher or lower. I expected higher, but would cash in good profits if it broke lower.
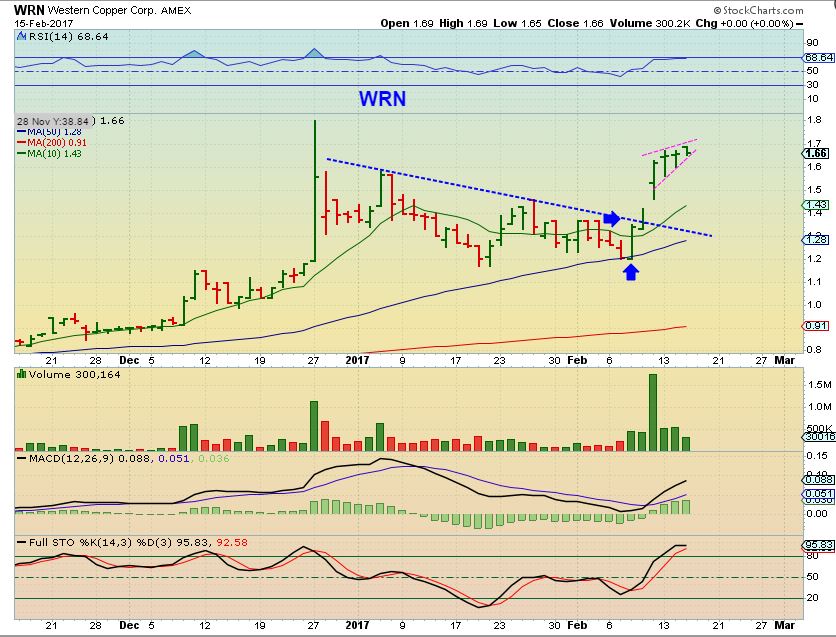
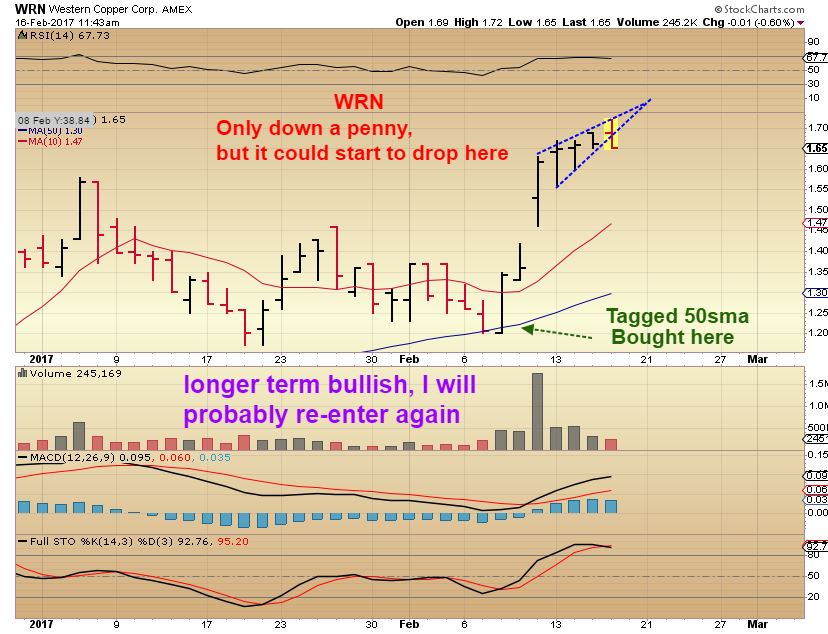
WRN – It started to break lower, so I posted this in the comments at 11:43a.m. and said that I sold it. I like the big picture, so I will look to re-enter, but I could have just held on longer term too. This could stall and build a ‘handle ‘ on the cup and waste time, but I will look to re-enter in the future.
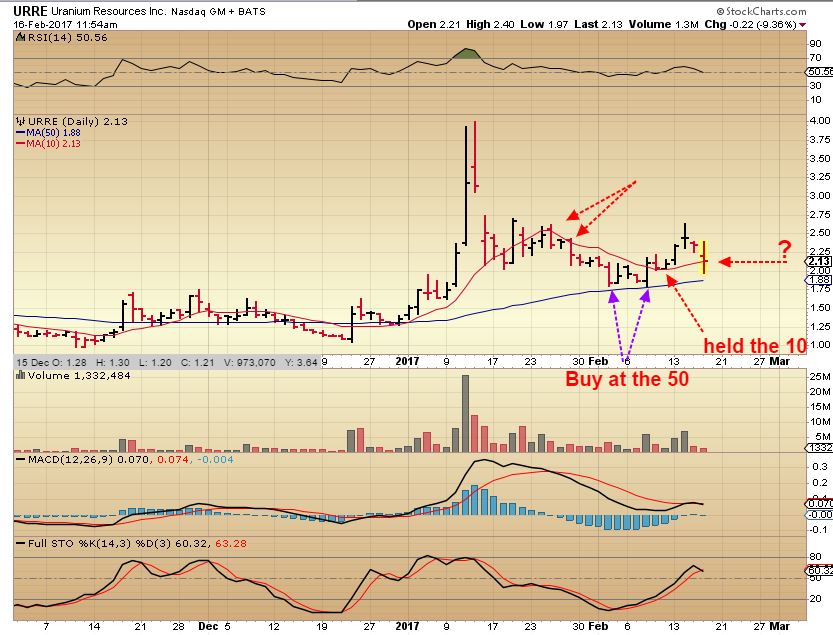
URRE – This chart was from noon time, posted to show what I would be looking at. I decided to hold this one longer term, as long as it holds above the 50sma where I bought it, and hopefully above the 10sma. I am giving back some good gains from that original pop, so maybe I should have just dumped it. it CLOSED at $2.20, above the 10sma.
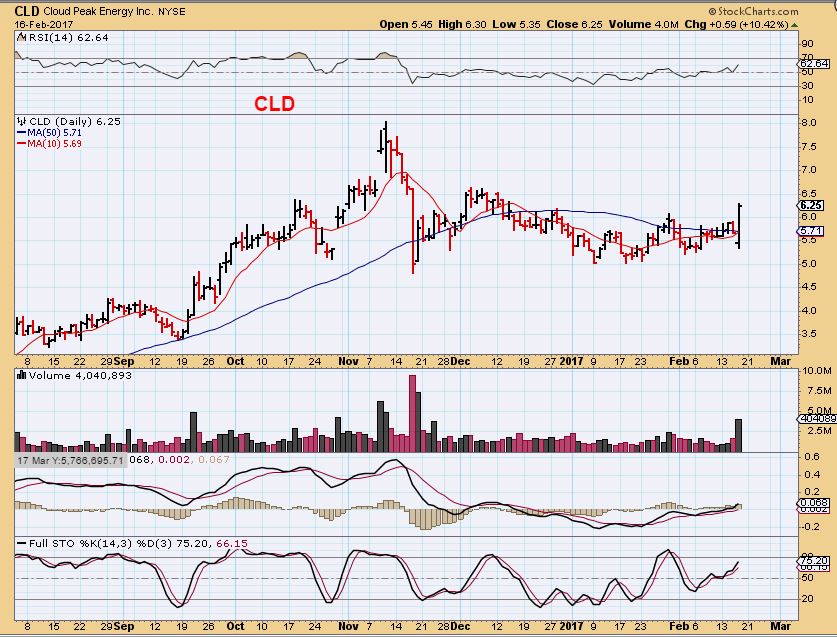
CLD – Recommended this Jan 24th. It looked to be breaking out. I didn’t take the trade.
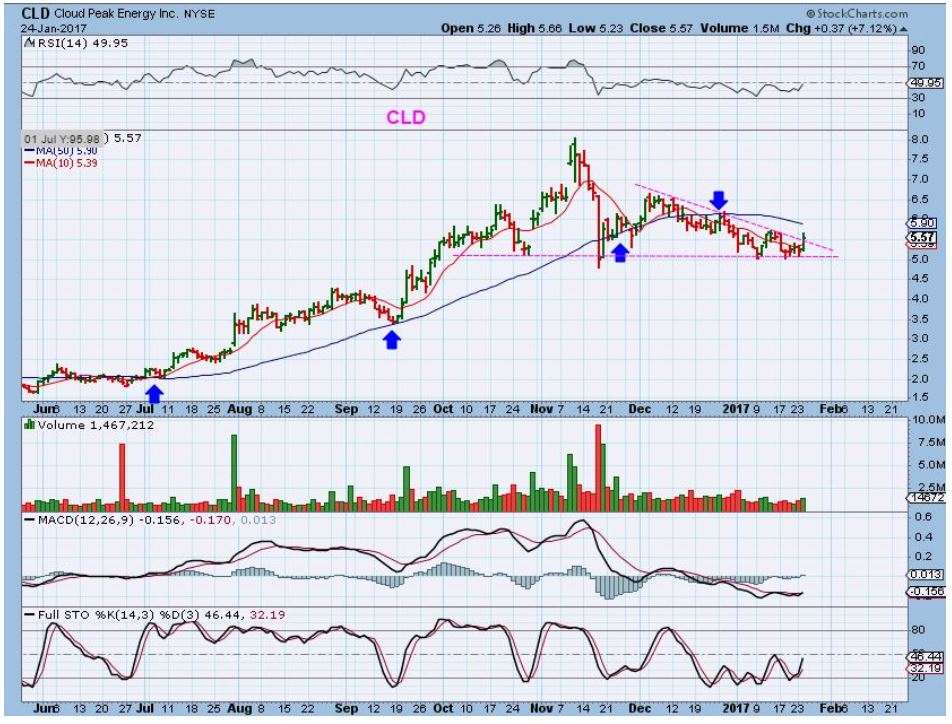
CLD – What a strong reversal Thursday after earnings were released. I definitely think that this is a buy and will probably now work its way higher quickly.
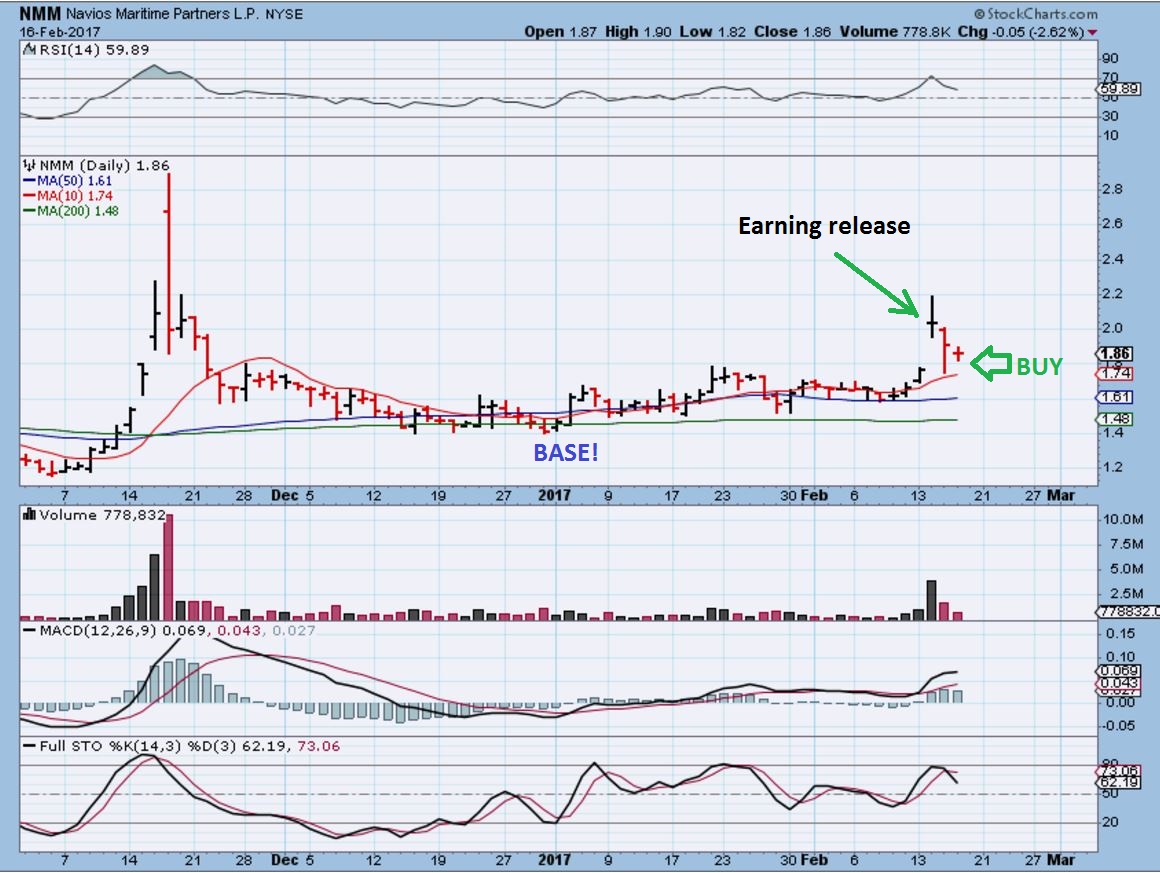
NNM– Earnings came out and NMM POPPED higher. Now it has settled back down on very light volume. With this base, I think that this is a low risk buy near the 10 sma with great potential.
PRECIOUS METALS
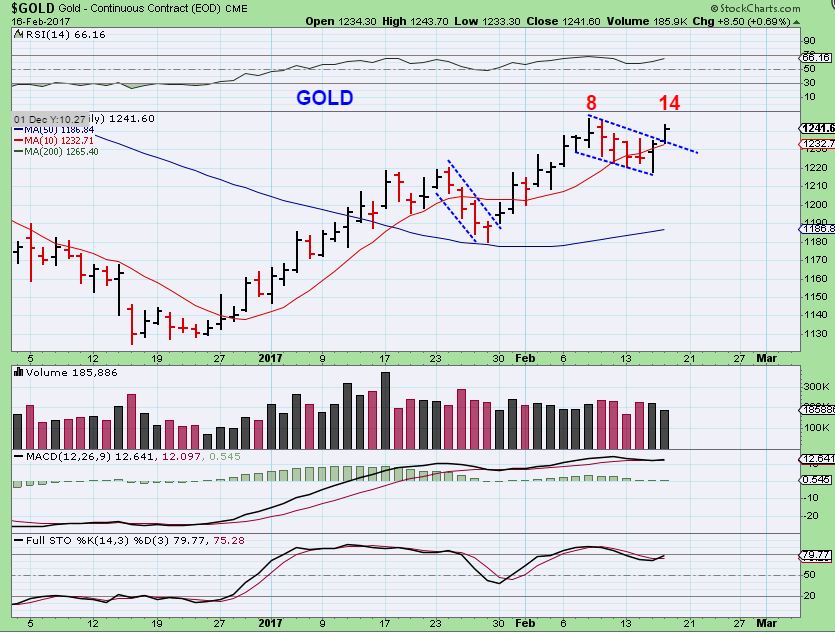
GOLD – Day 14 and Gold looks to be breaking higher. $1246.60 is the day 8 high, and we want to see Gold above that to add to the bullish side of the story.
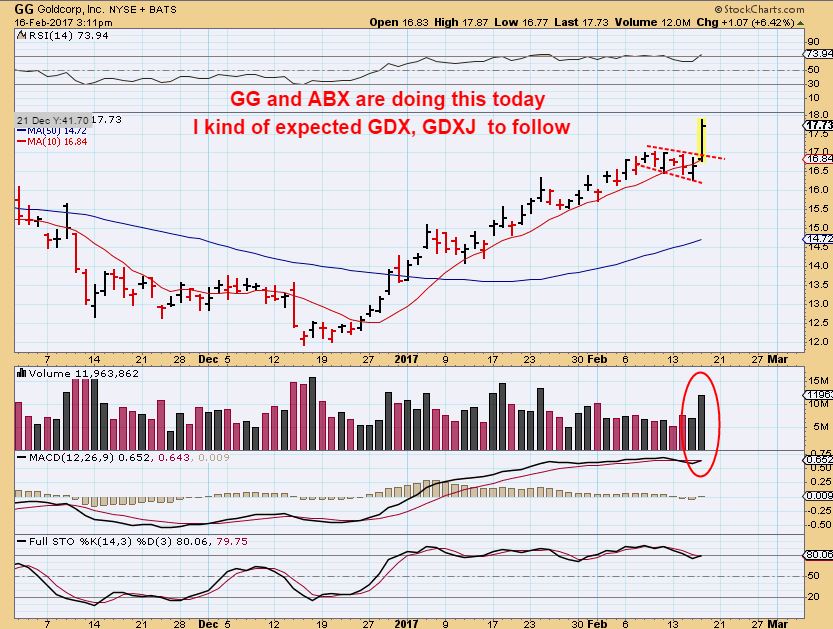
GG & ABX shot up, and I expected GDX to shoot higher too, but GDX just moved up slowly. If the USD continues to drop on Friday, I would expect some follow through higher in Miners. Notice how these flag patterns can POP? That is why I recommend buying them. Let’s look at a few more.
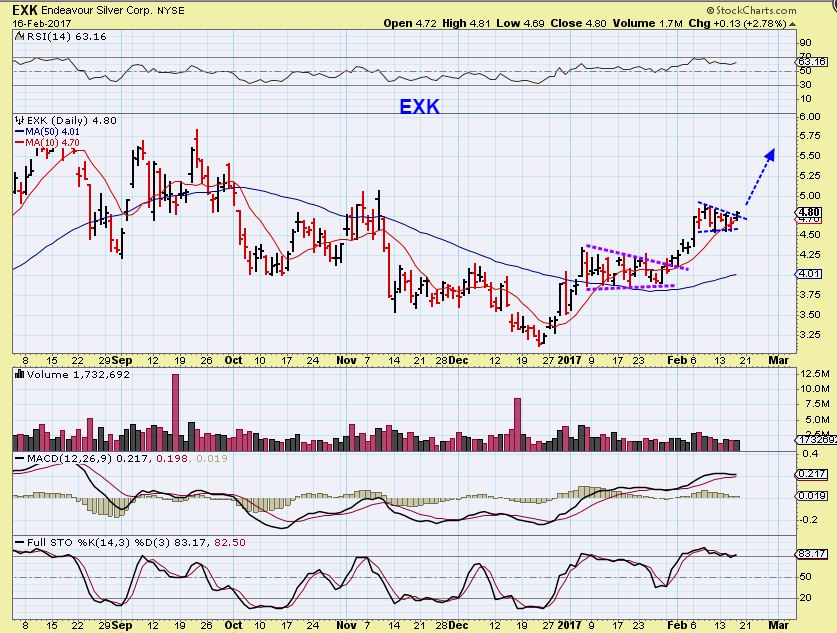
EXK – This is a low risk buy, with a stop beneath the flag.
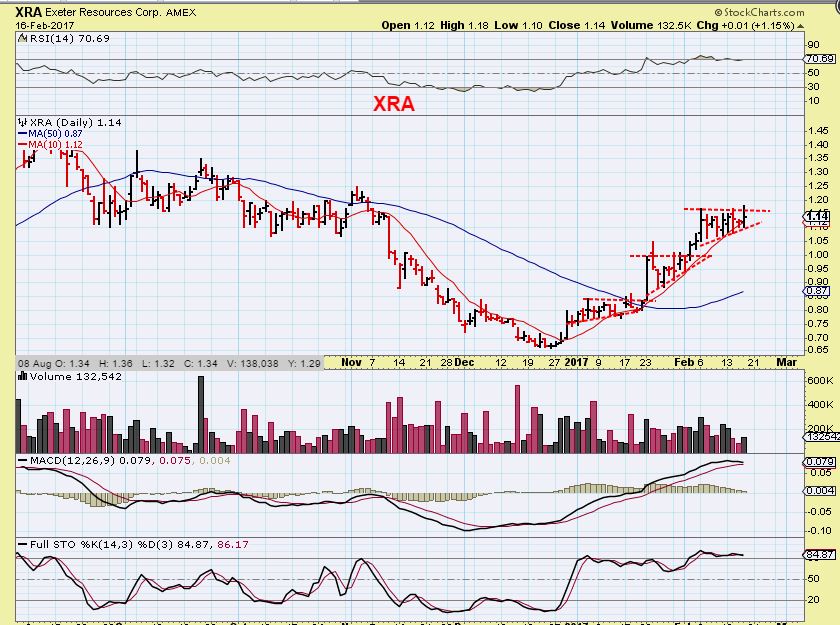
XRA– DITTO
SAND – Breaking out, this is a buy
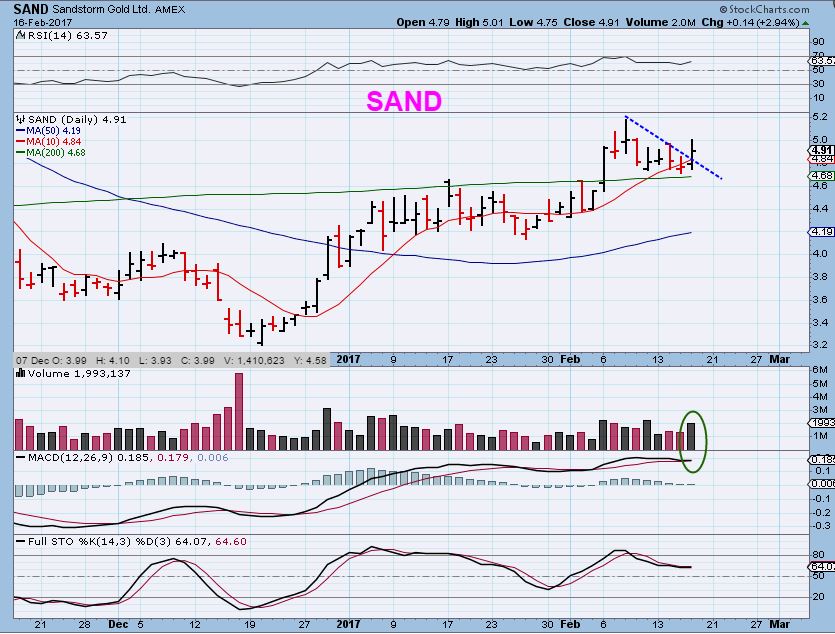
Many Miners are set up this way. Find them and they could be breaking out soon. I think that they will break out higher, and can be bought if you have cash and want to ride the 2nd half of the 2nd daily cycle higher. These may do well during the 3rd daily cycle too, after all of this consolidation.
.
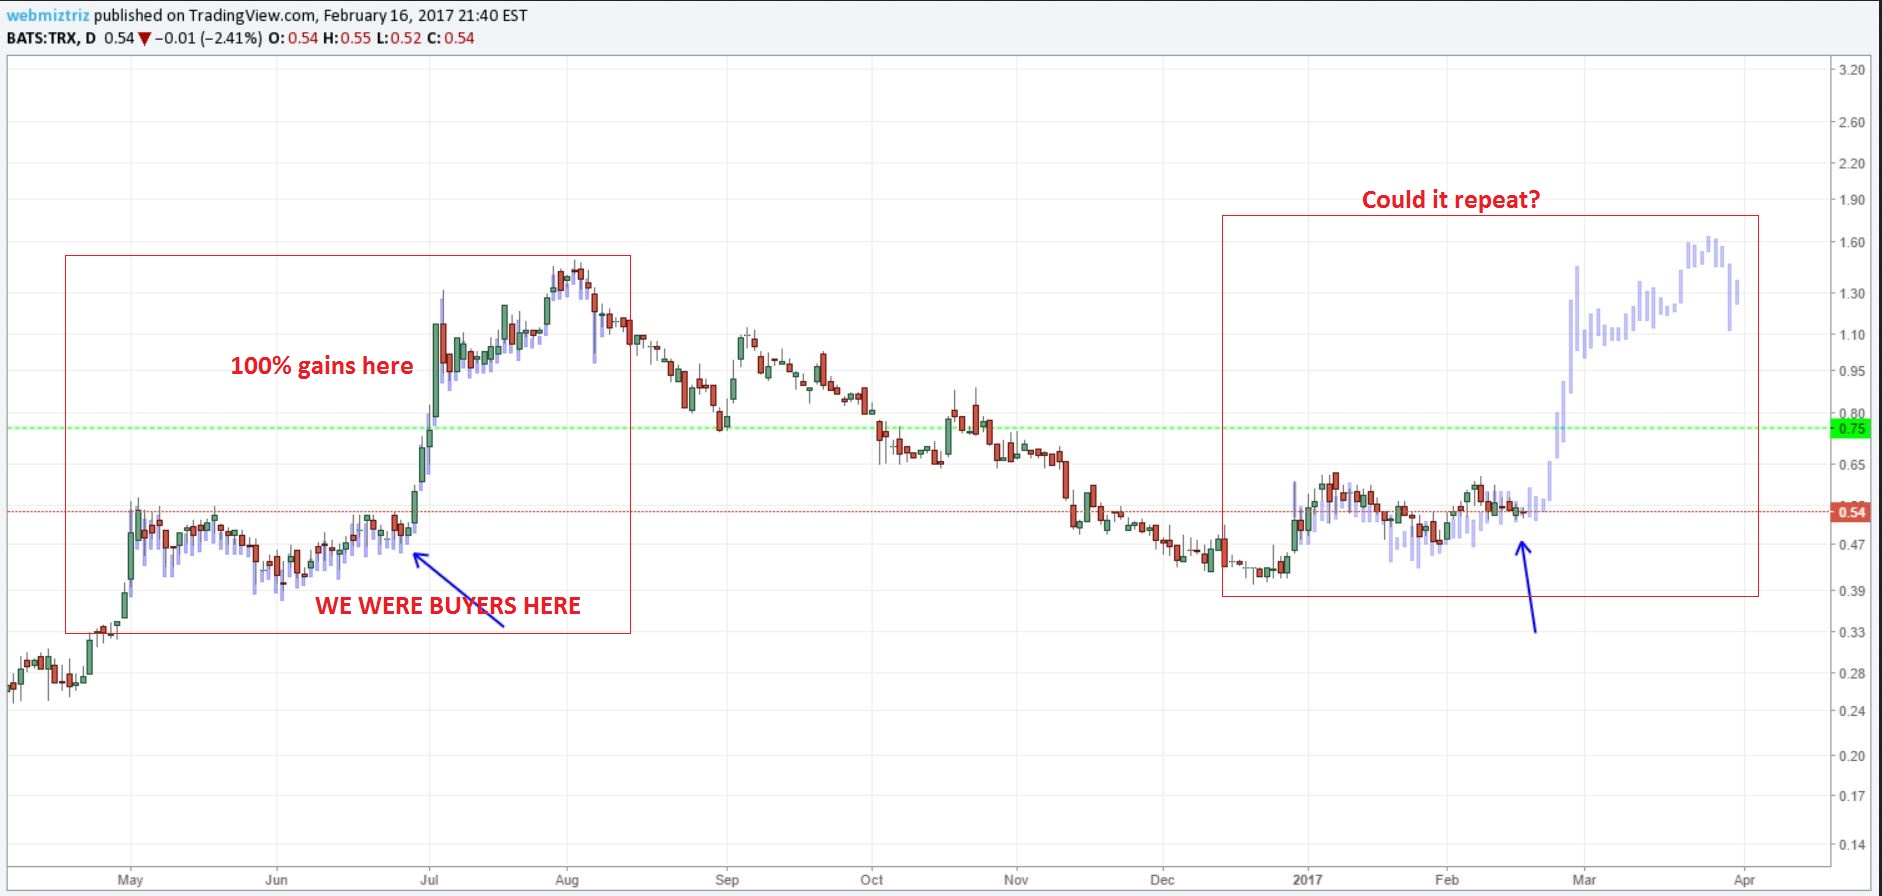
TRX – Maria posted this chart in the comments area, and I liked it. You can really see a similarity between TRX last spring and now. We bought this last year and made great gains. If this repeats, many of us will be relieved. The consolidations build energy for a strong move later.
.
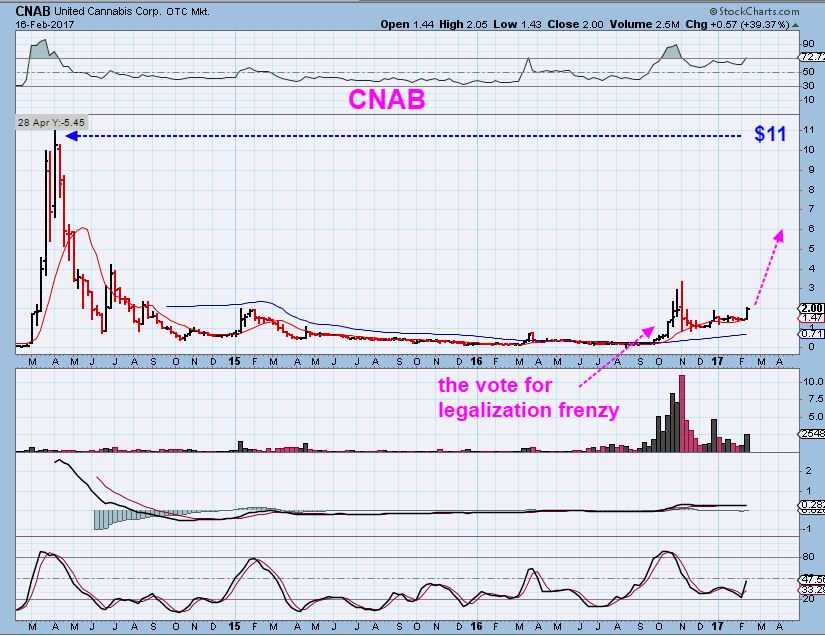
I wrote a report in December about the recent voting on Medical Marijuana and the stocks that looked set up to benefit. Many of the stocks from that report have doubled or even more, so if you want to read that report and all of the warnings, disclaimers, and guidlines, please click on this picture below.
.
CLICK ON THE PICTURE BELOW, AND IT WILL TAKE YOU TO THE DECEMBER MEDICINAL MARIJUANA REPORT
.
.
SO let’s revisit this area. I want to again CAUTION the readers here that these are volatile, subject to set backs, and they move fast on the way down as well as on the way up. This sector has added risks and may not be for everyone. It also may not be advisable to large positions, please be careful. This is what has happened since I released my report above.
CNBX – This was 70 cents.
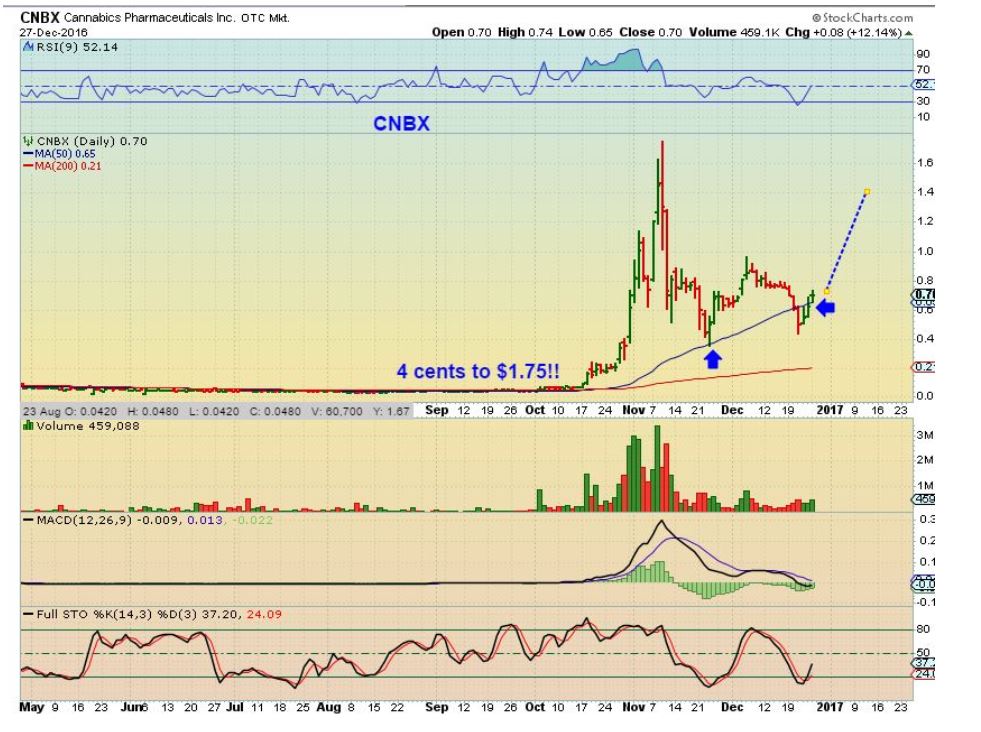
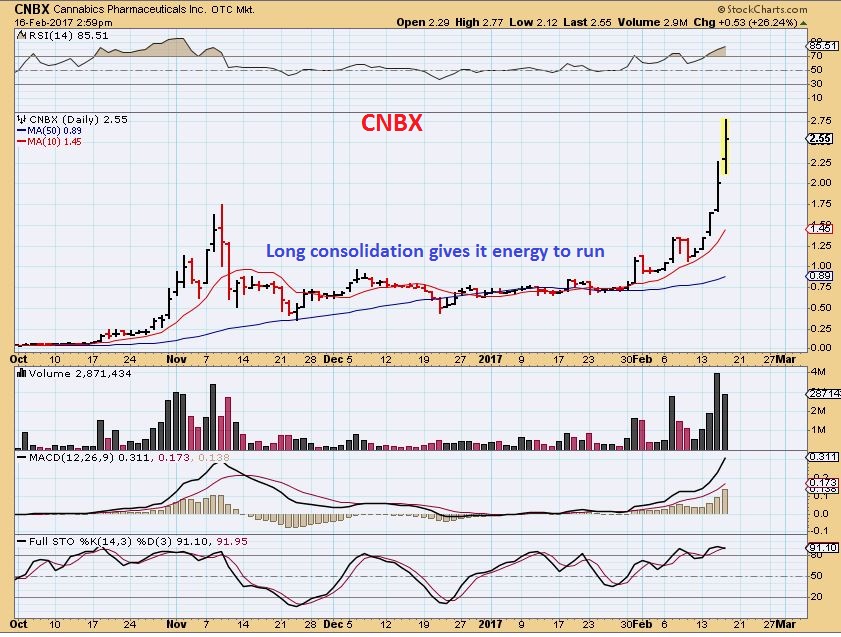
CNBX – Yesterday it closed at $2.93! 300+% in 2 months. I clipped this chart at 3 p.m. but it closed much higher. See how many of these burst higher in November, dropped and based out, and then run to Nov highs? This is happening to many of them.
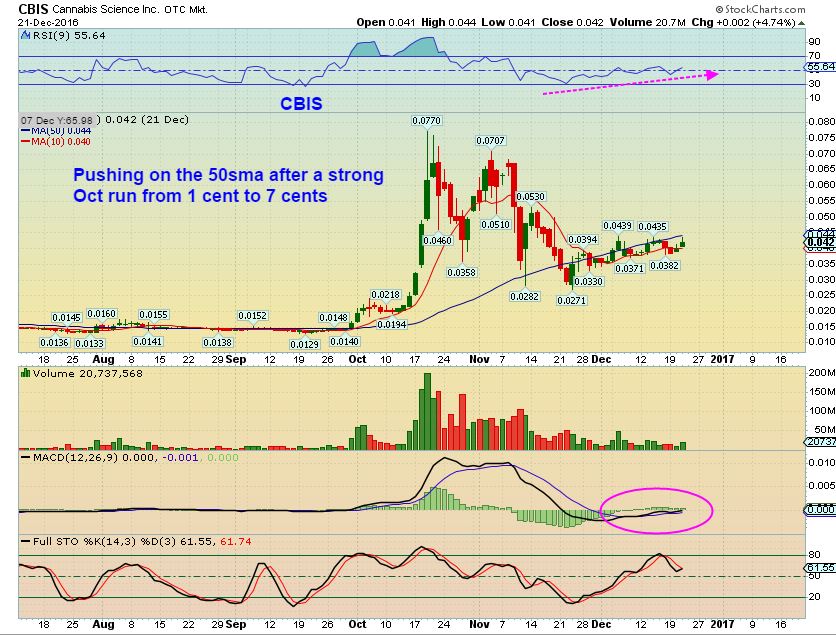
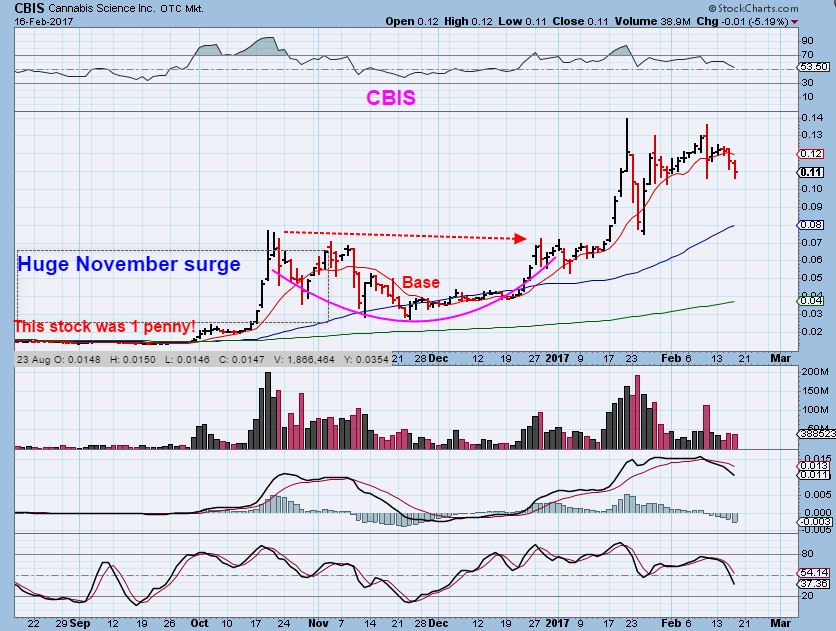
CBIS – Notice CBIS from that Dec report. It had the surge higher in November, drop and a base. Here it was a 4 cent stock, up from 1 penny.
CBIS – It did run to the November highs and…
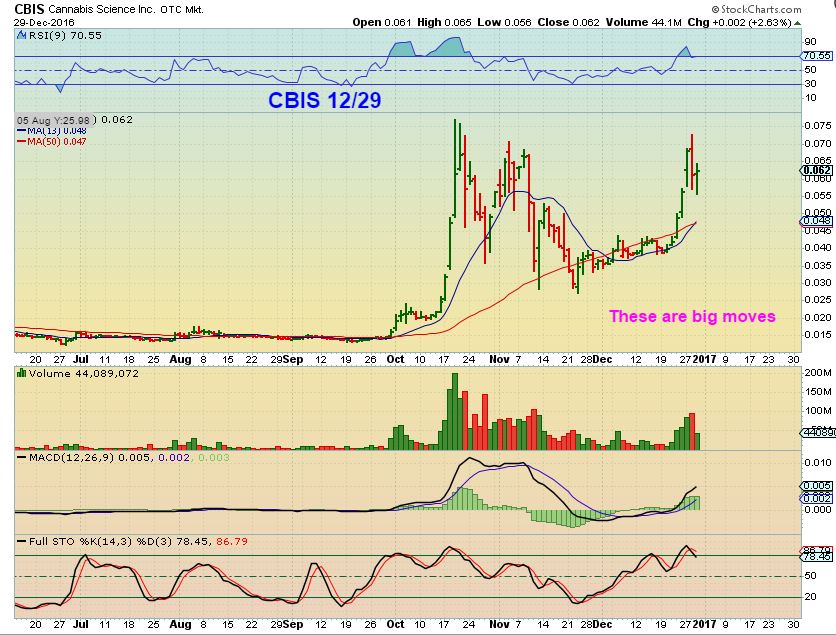
CBIS – It has continued to run higher. This was also up about 300% in 2 months.
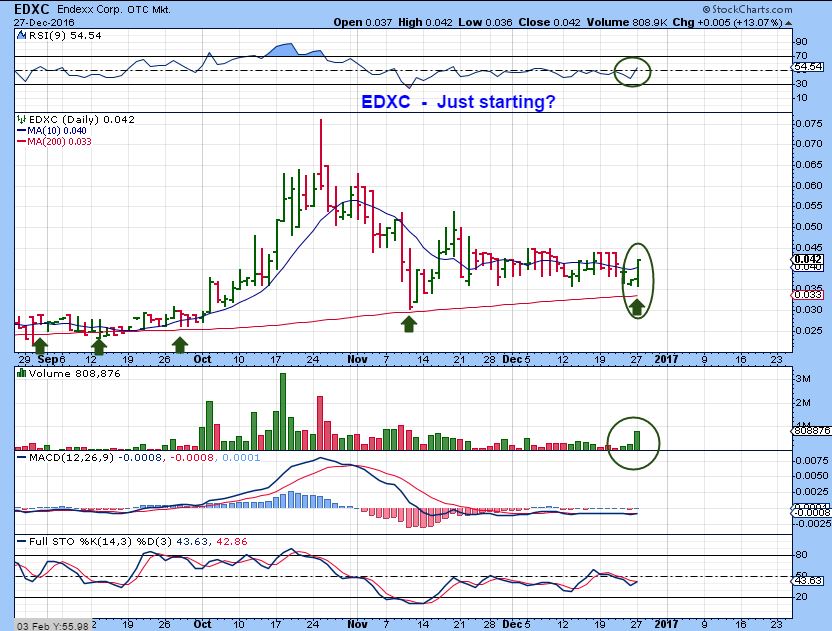
EDXC – This was 3 – 4 cents when I first posted about it. It was basing out after a strong surge higher. Would it return to November highs?
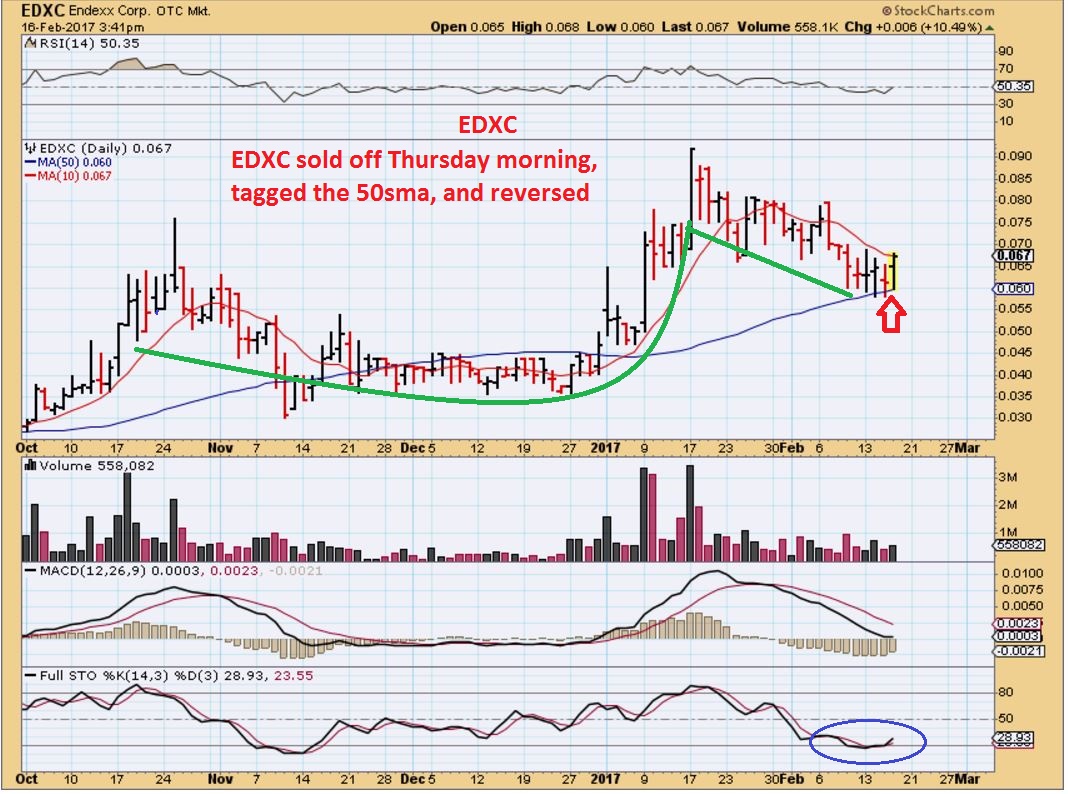
EDXC– This then ran to over 9 cents, so that tripled from 3 cents, and has now formed a cup and handle. It reversed off of the 50sma yesterday and looks ready to go higher. This one could be bought here.
CNAB – I just bought this one, because these set ups are bullish. It could run to the November highs too. I posted this chart in the comments section at 11 a.m. and mentioned that I bought it. Here it was $1.66 at 11 a.m..
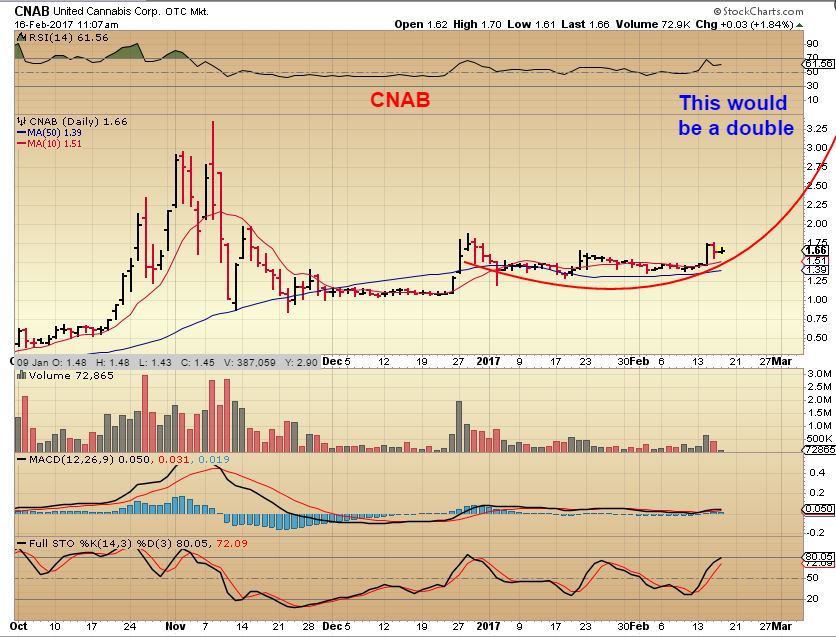
CNAB – By the end of the day, it was $2.00, up 22%. Is there a bigger picture to these?
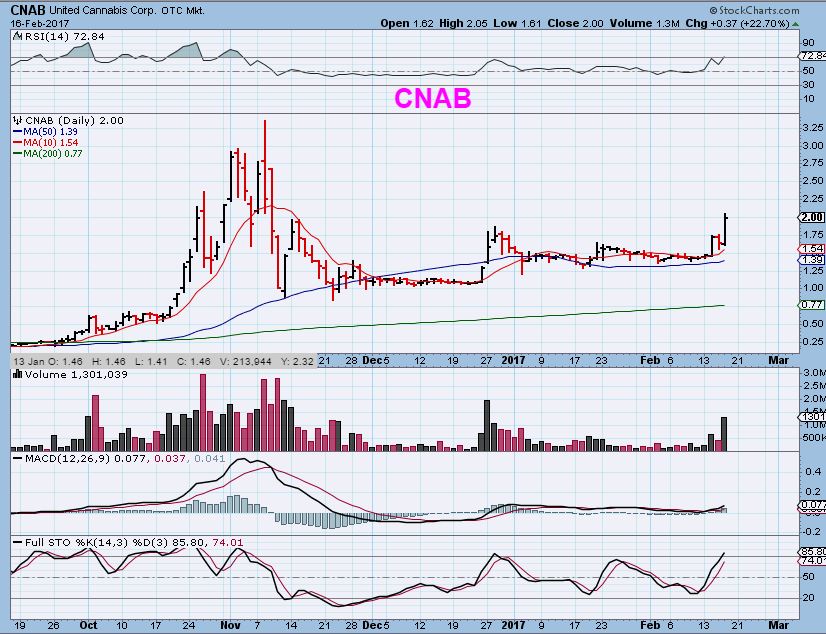
CNAB BIG PICTURE – Some have been around for a while and the big picture is huge if these companies find success.
Again, these bases are explosive once they break out and run. SO let’s look at a couple of other set ups like these.
.
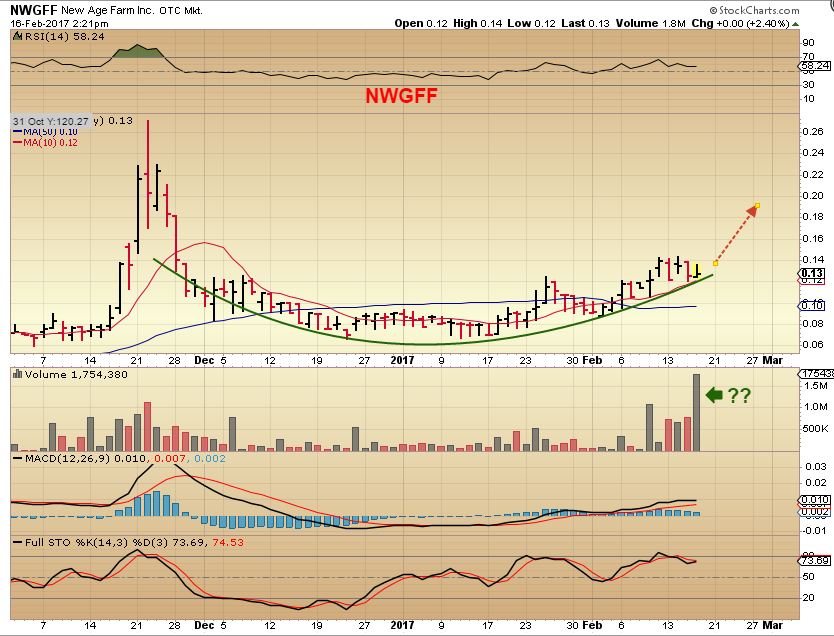
NWGFF – This caught my eye and I researched the company quickly. This is a solid base and they seem to be a solid company with a plant in Washington. This looks ready to break out too. November highs are roughly 100%, could it get there in the next 2 months? The way these move, it could be there in days or weeks.
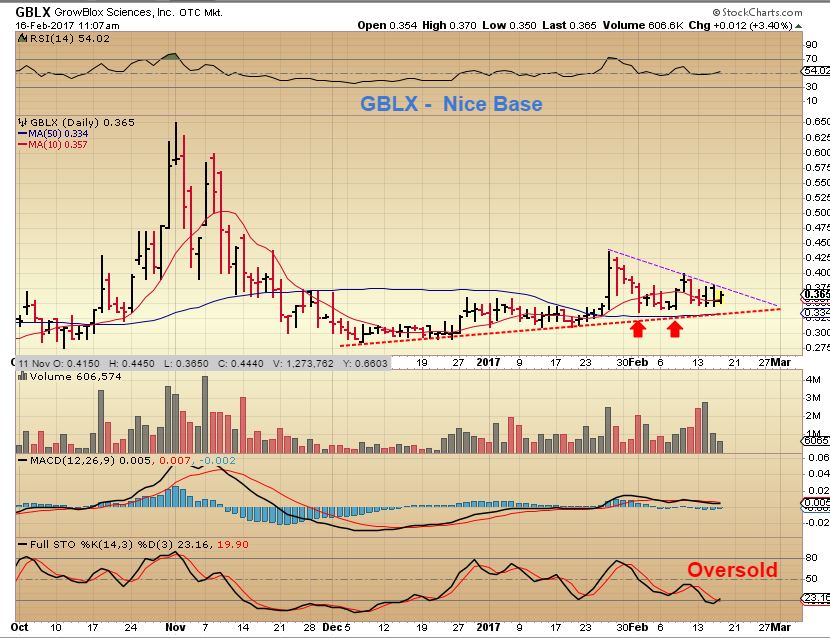
GBLX – A break of this wedge could cause a run higher. November highs is roughly 100%.
Again, THESE MEDICAL MARIJUANA STOCKS CAN BE HIGH RISK. Please do not think that you should put 1/2 of your account in here and try to double it. Read my report from last December for further warnings.
.
Precious Metals have set up as expected, with the USD bouncing to the 50sma and starting to roll over. NOW with Yellen out of the way, and she did mention that inflation is present, maybe we can get another nice leg higher in our mining stocks. Enjoy your Friday trading and enjoy your weekend!
.
~Alex
.
2 NAK BULLISH STORIES – clickable links


The rebuttle.
http://finance.yahoo.com/news/northern-dynasty-refutes-short-seller-120000322.html;_ylc=X1MDMTE5Nzc4NDE4NQRfZXgDMQRfeXJpZAM0aWNycTRoY2FkcHVhBGcDZFhWcFpEeHVjejR5WTJObVl6ZzBOQzAzT1RjMkxUTTRNMkl0T1RNMk1TMDFOMkU0TnpOaFpqY3lOVFE4Wm1sbGJHUStibVJ0TG5SdgRsYW5nA2VuLVVTBG9yaWdfbGFuZwNlbgRvcmlnX3JlZ2lvbgNBUgRwb3MDMARyZWdpb24DVVMEc3ltYm9sA05ETS5UTw–?.tsrc=applewf
Quick read, but didn’t see any new information for investors on current status. Was hoping for something more compelling. Anyway…interesting to see how Mr. market takes this info–he always has the final say in these things. Thx for posting!
Their rebuttal is out this morning. According to the company: largest undeveloped gold deposit anywhere in the world. 7th largest copper and 2nd largest gold deposit worldwide (this would include both developed and undeveloped mines).
I want to give Johnny Credit for finding the NAK company rebuttal first , because he posted it on yesterdays comments section. I read the article from his post. I had the second link in the report from yesterday.
Thanks Alex,
Have a great weekend!
You too Zig
AKG/Nancy the artist: A tad Late but I did stumble upon an article for you. Seaking Alpha / Gold Mining Bull./ Insiders Buying These 3 Stocks .Ghana is the best Africa has to offer as far as jurisdiction. Expect 240K Oz. In 2017@ all in of $825 . Bring in new mine to produce total 450K oz.by 2020. Some inside buying. Positive cash flow $70 M.cash, $150 long term debt. Looks good to me. Chart wise Alex sez not yet. I’m sure he’ll keep an eye on it for us. Hope this and CF.’s remark helps you. I like to try to pay back great insighters as yourself.
Thanks for the info….the Seeking Alpha article was where I got the name…..but I don’t trust that source. I poked around on my account for info too….but I will watch for now. I don’t like Ghana but I thought it seemed pretty promising too. Thanks again.
Yea Africa is a reason to “pause”.
For some reason that did not stop my index finger this morning…… 😉
LOL….I almost bought the other day too. I will be so jealous if it flies up, but will be happy for you.
I bought this morning Craw …… I like it !
!!!! Maybe I will reconsider! LOL
I posted this earlier but on yesterday’s newsletter. Look at $$ Jan-Mar 16 and then compare to right now. If we repeat that pattern then…
*F5*
https://uploads.disquscdn.com/images/1f42717a1e738e5090d9bbe1458702bb89ece331024a705963a7f92c71039e47.png
Looks like many Shippers are jumping in pre-market
Whoever brought up MSRT yesterday…can’t remember…it’s up premarket…..
good stuff as usual Alex, I think the rebuttal from NAK looked pretty good. I put on the rose colored glasses myself and bought some this morning
When I read the reports ( Both of them) , it is obvious that the negative report didnt ‘quote’ any known reliable authority.
They guessed as to why former partners may have left the project in the past ( they didn’t conduct interviews with the former partner) , etc etc . They saw the stock run up, put on huge short positions, and posted a negative fear article to scare the holders and trigger the selling.
Then you have lawsuits, because I hate to say it, but Lawyers were like sharks smelling blood in the water- they just wanted to jump in and get a piece of that action – NO WAY they took time to research and see whether their case was fact backed, so that compounds the selling.
My thought now is that he easy money on a smooth predictable run up has been made in Nak for now, and now they have to reestablish ‘trust’ of the investors. It’s the burden of proof is on NAK now, and that could take time and more positive news releases as they make progress with the EPA, etc.
One good thing was that they actually got a rebuttal from TD Securities and an upgrade with a price target of $5 – that can serve to boost confidence in their potential . It basically seems like it’ll be another matter of ‘time’…like CDE, to repair the damage. Buying here could be buying at the lows, however. Most of the damage may be done.
Hey, It’s early yet, but that NAK buy may have been really good. I saw NAK down right after the open, up 11 cents now . Congrats!
TGB jsut fell off a willie coyote cliff…
its finding support on the bottom daily band it think its ok
From their website: February 16, 2017, Vancouver, BC – Taseko Mines Limited (TSX: TKO; NYSE MKT: TGB) (the “Company”) will release its year end 2016 financial results after market close on Wednesday, February 22, 2017.
Did not find any other news.
I probably should have gotten back into CNBX while it was down….seems to be coming back up …
cnbx looks a bit extended. It can go crazy & go higher, but it may have topped, since its up 100s of % on that recent run
I am trying to decide if I should add on the pullback in CNAB. That chart still looks good ( At this point. )
The last 4 days have been big pop, semi big drop, big pop, and right now, semi big drop.
I’ve been trying to decide if I want to get more CNAB too….been watching it up down up down this morning…
well, CNBX just took off higher. I really thought that it had topped out there.
Yeah….I thought about getting when it was down 30 cents…should have just jumped in…be up nicely now 🙂 As you say….there is always another trade…especially in this sector! But if this one falls again I’ll likely jump in…..seems to be a very strong stock with buyers jumping in…think the product they are testing must be producing good hope…
CNAB and CNBX a tad overbought at the moment for me……i want a piece of both though…. 🙂
I got back in CNBX with not as many shares as I had before…and for retirement acct not trading acct….so far so good….
CNBX….Ka-RAZE-EY
Kind of looks like that extention that CBIS made when it went straight up in January
Still Wow. man. wild. wild.
that BLOZF is still pushing higher too, after that 1 day slam down. I’m watching to see if it can get back above the 50sma ( not buying, just watching ).
I like it ……
My call yesterday in the comments section was that NWGFF and GBLX will be the next Medical Marijuana stocks to do well, based strictly on the charts.
Off to a slow start, but both are up over 7% at the end of the day 🙂 I like the charts longer term
are you still bullish on miners? thanks
are you still bullish on miners? thanks
IPI – So was that a mini bull flag sitting right on the 50sma after the recent pop higher? It kind of looks good here
Here is one more positive story for NAK. Interesting read on the put options as well.
http://seekingalpha.com/article/4047132-northern-dynasty-safe-play-despite-kerrisdale-report#alt3
Gold dumping down again. Get back up there!
Just heard an ad for GPL on Fox business news. That was unusual.
Is anyone still in JO with me ?
I am!
How about TLT, Ken- were you stopped out on that?
Noooo
Stop below 118.07.
JO & TLT:
https://uploads.disquscdn.com/images/98d9cb9507ebbc79b0ec42202f3f58e42c99cc8edb6815aa150e3c61e9b7ef0c.jpg https://uploads.disquscdn.com/images/065665bb86186c69c2d2a2ad0f667c0511c9617a857a29b6d6986fa58137c044.jpg
…. I still wannnt Jo…..;)
This Peruvian I have in my hand is excellent…… 😉
WHAT? I CANT HEAR U RIGHT NOW… IM JUMPING IN THE P .. O .. O .. …………………
Don’t Get Your Hair WET !!!!!!
CANNNNONBALLLLLLLLLLLLLLLLL …..
lol
i wanna see that !
… u wanna laugh.. u outta see me comin down the waterslide… L .. O … L
video show please ……;)
I bailed! Thanks for the effort!
No worries Edward
Like I mentioned in my report today – it was a possibility that I didn’t really want to see.
If the USD gets a little bounce, it’ll ruin the Friday for Miners. Since those in the US have a 3 day weekend to ride out whatever happens in Gold- it isn’t desirable : (
Let’s hope that the USD drops by the end of the day and gives the Miners a bit of a lift.
USD (UUP) https://uploads.disquscdn.com/images/545f75e9e4db5d07e71915e6c20883b7a376eb9c019148a4d47d17b8de9cc5f4.png Count:
I’m Curious – Is it possible to move 3 up 1 bump higher? Looking at the whole chart from the May lows to Jan highs, this would make wave 3 the shortest wave of the 3 waves higher, even on the USD
Only 3 waves for 5 then ? I can see maybe 5 waves if I sqint. 😉 I like it because 3 = 5.
Either way I see a wave 5 top in January………now in a corrective wave…… imo
No, I would say 5 complete, since I believe that the USD topped. I was wondering if wave 3 was higher ( because the way you have it drawn, it is the smallest wave , and I thought 3 was usually the bigger wave) , would that help 4 to be more legit too.
Someone ( I thought it was ray) once wrote in the comments section that 4 cannot fall below 1 as drawn. I dont really know for sure, I never got into studying all of the technical rules of E.W. – I just look for the waves, but either way it does make 5 complete and correction happening now.
yup ……
That right shoulder has to come down ……
yup
Hi Alex,
GPL at highs….do you see it breaking out here…..or putting in a handle for a while. Do you have any price targets if it does break out.
thx
No way of knowing for sure.
Hi CF… any chance you add a link at the top of each report that drops you immediately down to the comments section? Or maybe flip the comments section to the top of the page? It’s not easy being this lazy.
LOL…. ur not alone… i asked ‘support’ to add a link to comments way back… (so i didnt have to scroll all the way down) … all he said was .. yeah .. chartfreak sure does talk a lot .. or something like that…. ;o)
AUMN looked really good this a.m., and now it looks ugly – hoping that it holds the 50sma
also, VGZ flat top fail..
I didnt see that. It sure did fail.
I tried adding to CNAB this morning and it kept jumping over the ask price as I placed my order – pretty hyper
I was feeling pretty good about my positions this morning until you guys brought up CNBX. It’s up another 15 cents in the time it took to write two sentences.
Wow – up another 40+% (So far) again. Just rockets to the moon when these get going.
sigh should have just jumped in i guess…..
I look at the weekly chart of CNBX and see CNAB s weekly chart : )
CBIS had it too, as they base out and return to Nov highs.
down now…3.61
check out the 1 year weekly chart. ridiculous!!!
I jumped in on a little on that fall here..not in my trading acct though…
NMM:
Maybe a buy closer to the TL and 50 sma ? https://uploads.disquscdn.com/images/3106ac151e5da40538ad85f45a0274b4e9030fe7bf8ca74f34dc38bea30510cd.jpg
Possibly, but I am thinking that it will not drop that far.
They released their earnings on the day that it had that good high volume pop ( Tuesday?), so I would assume that the recent light volume selling will dry up and just test that break out , filled the gap & recovered, etc.
Did you see TOPS . Man, crazy big moves in some of these. 🙂
That sector is Not for the weak at heart that is for sure….
I have witnessed that first hand. I’ve made big %-gainsin a few days, and I’ve been hit hard not paying attention and selling a bit too late. FAST moves.
I tried That Volume buy on OROCF thinking the sellers had left town …… they were just taking a siesta apparently…..needless to say that trade did not work.
TOPS has a ton of hype from past spikes and a VERY LOW Float. NMM not so much. Ive been in lvoe with this cart for weeks now.
OWCP finally making the move out of the flag, been waiting on that one
Ouch on AUY today. One of my core holdings.
So far , the 50DSMA is holding.
Yeah, kind of a bummer there. Down 8 % on earnings report. I do not own it.
It is sitting right on the 50sma. MAybe that will hold it up as support. f I owned it I’d kind of worry about a shake out & recovery if it breaks below, but at this point I’d still be watching for that area to hold. I didnt read the report, have no idea why it is selling.
Would you trade this with a stop below the 50 ?
2% risk factor…..
That’s a tough call. Normally you could enter it with a stop there, but
at this point I probably wouldn’t because the markets are closed on Monday and if Gold drops Sunday through Tuesday morning, it could gap down below that 50 on the open and maybe by quite a bit.
Maybe see where she is on the open Tuesday……
I bought CNAB 2 or 3 days ago. Added yesterday, and added today. I look at the 1 year weekly chart of CNBX and I bought that one at around 80 cents and got out at $1.20’s. Now it went Boom.
CNAB 1 yr weekly chart looks exactly like it is where I bought CNBX weeks ago. In other words, I think that CNAB is the next CNBX.
IS IT? Just based on a chart pattern? I’m ready to find out. I am loaded on CNAB : )
What is your exit strategy?
I got in early near the 50sma, so that has been my cut off on a drop, on the way higher , I’ll just have to play it as I see it. If it goes crazy like CNBX, I’d lighten up little by little on the way up.
. .same…. I like it…
Pass the dutchie on the lefthand side…
PLG back at that TL again……
TRX – no update yet as parties traveling so could not get info.
I remember Alex mentioning that sometimes he steps back to the weekly charts (maybe monthly?) to get a bigger picture of what is going on. A lot of the miners have positive weekly MACD crosses. That doesn’t mean that on the daily charts these stocks can’t chop around. Trend is your friend I guess its best to keep your eye on the 10DSMA if you want to protect some gains.
AUMN is at the 50 sma also……
GPL has been a runner……
They are running ads on Fox business news.
🙂
Alex- so far this 2nd dcl has been very dissapointing.. is it maybe giving us a clue that this ic will be left translated and we will retest 2016 lows or to early still to tell?
Too early to tell. So far the USD is playing out exactly as I have expected, I would expect a bigger drop in the USD next week, so I would think we’d get new highs in Miners next week.
Looking back at charts of prior runs ( Like I did in the report yesterday) Sometimes these things go sideways and consolidate for days, weeks, and even months unfortunately.
Yes but the daily cycle really isn’t going to stretch realistically past another 2-2.5 weeks tops and most likely 10 days. I guess I just expected more of a pop esp w usd weakness and abx and gg bid..
The way I currently see it
Even a slightly higher price next week could make the 2nd daily cycle possibly right translated, it can dip into a dcl, and then the 3rd daily cycle can make a new high – and from there we see where the intermediate cycle is r.t. or l.t.
Another MJ stock that may be poised to break out is CANN. “We lease growing space and related facilities (commercial real estate and equipment) to licensed marijuana business operators for their production needs. We are pursuing ancillary business products, regulatory compliance consulting, and advanced logistical support for grow operations.” [URL=http://s1374.photobucket.com/user/spikauf/media/Screen%20Shot%202017-02-17%20at%209.24.05%20AM_zpslcuzp6rq.png.html][IMG]http://i1374.photobucket.com/albums/ag410/spikauf/Screen%20Shot%202017-02-17%20at%209.24.05%20AM_zpslcuzp6rq.png[/IMG][/URL]
MCOA looks good too. The whole sector seems to slowly be shaping up.
I have avoided the MJ stocks, but this is getting ridiculous. While I am personally opposed to legalization of MJ (even though I was user in my hippie days during the ’70’s) I’m also a “trend follower” and this is one heck of an UP trend!! I have to start looking to BTFD … if I can find a “dip” to buy.
Were you a user in the 70’s because you were a ‘trend follower’ too – lol 🙂
yuk yuk yuk
Yeah “everybody” smoked pot back in the ’70’s! LOL
I know most folks back in the day might have tried it but I actually never did….so even though I joke around here I’ve never experienced the munchies and such that everyone kids about…hahaha! I am hoping there is some great potential for helping some medical conditions though…
I was too busy with my pina coladas…:)
I did, but I didn’t inhale.
hahaha! 🙂 🙂
You don’t have an intern do you?
Well done…I just KNEW someone would say that! LOL
ahahha. funny. MJ is good for ya
Another bummer day for miners (short term) as the dollar is strong, but for those looking for some light at the end of the tunnel, GDXJ/JNUG (the only miners I trade) are just now flipping to a “buy” on my 15 min chart that I use to track INTRADAY (not long term) price trends. This does not mean the miners will rally into the close, just that the price trend is staring to reverse up now … remains to be seen what happens the rest of the day.
Good ,easy to understand explanation…thanks.
thanks, Steve. I added some JNUG this morning. 🙂 will keep watching it.
The VWAP (Volume Weighted Average Price) of JNUG is $11.99 and the 10 day SMA is $11.89 so buying a dip under the VWAP and 10 day SMA may be a good place to add … IF miners continue to be in bull mode.
thanks again, Steve.
I have used VWAP on GDXJ for a signal in the past – Price always seeming to want to return to Vwap over time. I never tried JNUG itself ( I dont use that method anymore anyway, I have other triggers, but just curious).
Do you find it works on JNUG too, or do you look at GDXJ to trigger Jnug?
I don’t trade using VWAP as a signal but our old friend Bob K. uses it a lot. I just noticed that it is around $12 which is a little above the midpoint of the recent sideways trading range since Feb 6th.
UPDATE: my 15 min “buy” signal has petered out, the 9 EMA is still above the 10 SMA, but both are currently angled down, that’s not good. Need to see the 9 EMA above the 10 SMA and both angled UP to be a “buy” (UP trend) intraday. This signal can flip back and forth during the day, which is why I said it’s too early to know if miners will rally into the close. A “buy” on the 15 min after 11:30 AM PT (2:30 PM ET) is usually a good indication that the rally will hold into the close … but not always. This sideways chop, while still BULLISH on the weekly chart, has been frustrating. I’d much rather have a slow chug higher like my old friend TQQQ, it has had only 1 down day in the last 12 trading days!
Was waiting for OWCP to break out….it did….but I sold in my trading acct too soon…when it was up only 13 cents…..now it’s up .20…..do still have in my retirement acct though…..just have to learn patience…:)
I bought at $.70/sh but just too few shares. they will present at the venture capital show, The Wall Street Conference March 1st. The CEO, Mr. Turner’s comments.
Mr. Turner commented on the Company’s participation in the event, “The Wall Street Conference is one of the leading conferences for small-cap investors and OWC is excited to be a part of it. OWC continues to make significant progress in the research and development of cannabis-centric medical treatments, specifically with our psoriasis cream, which is being readied for the U.S. and European markets. We are focused on having our products on the shelves in the MMJ states this year. I am very much looking forward to discussing the Company with conference attendees.”
Thanks for sharing!
Hey, the least I can do for all that you do!
PRUITT confirmed as head of EPA.
This is considered very good for Miners.
I’m not familiar with this name, care to share a link for future reading Alex? EDIT. never mind found it. Thnx
Nice work this week as always 🙂
I dont have a link, but I’m sure its everywhere ( google) .
I just saw it on the news
Yeah found it. Thanks. Sounds promising. News is a little slow in Thailand 🙁
Regardless of your political views of Trump, there is no question that his admin is much more pro-miner than the previous admin. So this is good news for PM traders.
clean air and clean water above miners for me . . . . let’s see if the budgets get
withdrawn from the insanity and put them in jail.
How about Sessions for MJ? What about the Earth?
Write them a letter, and hopefully they’ll listen.
APRI – I posted a chart yesterday and took the trade. took Position at 2.87 at close. Sold half at 3.4 letting the rest ride out.
Looks like a handle starting to form on this cup? https://uploads.disquscdn.com/images/833e8f994447df0ee5744b6f4f6689d829387c79789143921c07a079b99f1270.png
MNTR opened by giving up almost all of the gains from yesterday, but looks like many getting filled, almost back to yesterdays close. What a tail!
Seems like I’ve seen pattern where when there is a long red tail like that, the price drops down to that again in the not too distant future…have you noticed anything like that?
I know a famous Mr. Miyagi who has used such tails to predict SPX price fluctuations with good success. But I haven’t noticed it (I’m bad at noticing things–ask my wife!). Is this a MJ sector-specific observation, Tammie?
No…I’ve seen it in gold too…..also used to read Mr. Miyagi when he pointed those out…..haven’t read anything from him in a while since I’m most just here at CF now …don’t remember what his take on those long tails was..?
took a position in ACBFF (Mj stock). Like the growth story and chart
This is on my list to get too….
Just took a position in CLD. (Thanks Alex!).
As a side note, I am liking the action in solar stocks. watching CSIQ (closing over 200ma), RUN (already long). Watching etf TAN for direction (heading towards its 200ma)
…and JASO. Just picked some up:-)
LOL I just ran a scan and JASO came up for me as well.. Like where your heads at
Nice..took a starter myself Frenchie 🙂
Sector does look good, good heads up .
Check out 6 month charts of SPWR, WNDW, CSIQ, JKS, …and TAN does look nice.
Alex, at this point it looks like NAK may lose the 50 day on the close. Are you giving it more room than that, or cutting back your position?
I was very heavy on this ride up, and now I only have 10% of what I owned before getting stopped out and then cutting some more.
I planned on letting that 10% ride and see how things play out, but I also told myself that if it closed under the 50sma, I would sell. I can always watch it and get back in if it starts acting correctly, but it is in the same boat as CDE to me. I like the company a lot, but look at CDE- it is trying to form a bottom, maybe trying to base out.
That said, from past experience I knew there would be time to get back in later, and that is what I see with CDE, and that may be true of NAK. A broken stock often needs to win over investors trust again- whether they like the company or not.
Personally, when I look on a 60 minute chart, I think that NAK wants to ‘test’ that high volume low again.
Then it can double bottom and hold there, or not.
so right. Remember GPL, after the offering, it took months of consolidation. NGD is in the same boat. Now AUY too. All stocks I own(ed)…. these big drop are deadly and so irrational but takes time to get back to the trend. I’ve cut my IAG position in 1/2 before earnings next Wed 2/22 because I’m afraid of not-so-great earnings
Right, and then GPL ends up being the champion lately 🙂
Crazy Miners
Dollar looks very strong today, not good for miners. My 15 min chart is now a strong “sell” for miners, so they are likely to sell off into the close and close below the 10 day SMA. No fun! 🙁
It’s going to be tough staying “all in” over a 3 day weekend.
am all in cash now
At this moment in time, I bet that is refreshing.
Not that I expect a drop Tuesday, just unfettered
does feel kinda strange, having been in miners since sept/oct time.
well today, ive been using my indi.. and the stocks have just been picked off one by one, as they failed the indi trendlines.
started the day with about 10.. ended with none, except i converted half my $$$ cash to a £££ ETF.
looks like there’s a move of £ against $ due, one way or t’other… so im gonna hedge a while.
Gotta admit I am nervous about miners … I have some “sell” signals on my daily charts so I hope to see a reversal next week. The weekly charts still look good, but they can also change to a “sell” if miners keep dropping. Never hurts to book profits and sit in cash.
CNBX spiked again but now falling here at end of day…
I’m looking for a buy in the $1.50 to $1.75 area … could see a retest of that long tail down. If you look at a 15 min chart of CNBX you will see massive candle spike down to $1.44 to 11:00 AM ET yesterday. Those kind of long tail candles on a 15 min chart are sometimes used as a signal by the “Big Boyz” to let their friends know what their target price is for a stop run bear attack. Will it happen? I don’t know, but I will be ready if it does.
Yeah, I was looking at that candle…..the reason just sold a few minutes ago what I bought into today….I’m thinking it will go down a bit….could be wrong…but….content to sit on the sidelines over the weekend……:) Thanks for the tip on those and the big boyz 🙂
Tammie – Didn’t you say that it traded there when you were looking in pre-market and then disappeared? Maybe that was another stock, I dont have time to scroll the entire comments here, just thought I’d chime in, I recall you saying something about price being WAY DOWN
Yeah…for CNAB….traded down to .20 after hours yesterday…I put the comment and then deleted it since I know after hours things can sometimes be all askew and didn’t want to sound in a panic…:)…….but…go pull up after hours trading and it has it down by $1.79..to 20 cents! I’m hoping that is a fluke……………and that when the market opens up on Tuesday it will be back to the $1.99 or whatever….shows only 1 trade after hours yesterday…..
That’s funny, I pulled up a chart and saw it too, but it is back up to 2.00 by the close of A.H. trading.
Odd stuff
Yeah, I saw it was back up, hoping that is the case, looks like a quick glitch or something. After hours trading still has it down by the $1.79 but I bet that’s incorrect…
On CNBX? I don’t see the candle to $1.44
$1.44 was LOD yesterday, look at a 15 min chart. There is a 15 candle at 11:00 AM ET with a high of $2.51 and a low of $1.44. That’s a massive range with a very long tail for a single 15 min candle and typical of the kind of “signal” trades that are made to give the “Big Boyz” a heads up. The low is often hit again within 10 days of the “signal” trade … but not always. Just something to watch out for.
you must be talking about a different stock steve.
I’m definitely looking at CNBX (Cannabics Pharma Inc)
here is my 15 minute chart for today, SP got nowhere near the 2.51 – 1.44 range you mention
https://uploads.disquscdn.com/images/d12642ee2fd86223ad5480f0093c16f5c7f8da5f57deb0f556929fd5cd538aef.png
Look at yesterday, Feb 16th. That’s the day I was talking about.
not trying to be difficult but here is the 15 minute candle at 11 am EST yesterday…maybe my chart provider is off? https://uploads.disquscdn.com/images/acccac77b031e5422195e85e29b8557a1389c51938f09952f2e1af2bbe3ee25d.png
sometimes these “signal trades” as I call them don’t show up on all trading systems. Here is a screen capture from my Schwab StreetSmartEdge platform. Notice the 15 min candle I highlighted, it opened at $2.51 and closed at $2.51 with a huge quick dip down to $1.44. Obviously you can tell that something looks “fishy” there … that’s why I call these “signal trades” … they are sometimes used to let other traders know “hey guys we are going to slam CNBX down to $1.44 so be ready!” https://uploads.disquscdn.com/images/5fef685281682116d8227220c72605e67521b7dca2f0cf09356bd9e51b8b2068.png
ok, good deal. i understand now, good info….thank you
still can’t see it. Looked on different chart application. Here’s stockcharts.com (refresh) https://uploads.disquscdn.com/images/5c96050376bc840f43ca04821db30c168fc2ea55c081f5afed767d3f7103f301.png
It does not show on my stockcharts.com account either. As I said those “phantom trades” or “signal trades” as I call them only show up on certain trading platforms. I have “Level 2” trading access on my Schwab StreetSmartEdge and it shows every trade. So I recommend using that as your trading platform if you want to see these kinds of trades. If you look at the screen capture that I posted, you will see several other long tail candles on the 15 min chart. IMO these are attempts by the “Big Boyz” to drive prices down so they (and their buddies) can buy cheaper. It does NOT always work. On another trading forum a guy who calls himself “Mr Miyagi” has studied these unusual long tail candles for years, he says the long tail target pricess (up and down) hit about 50-60% of the time, usually within about 10 trading days.
So just for the fun of it…..if I look at at chart of CBIS….I’ve been watching and waiting for it to come up….on 2/9 there is a long candle that goes to .106 as the low….so I was figuring it might reach that point again….on 2/16 it went down to that again with another red candle but the tail isn’t as long – for a low of .106….then on 2/17 (yesterday) it seems to be trying to recover and come up…actually yesterday’s chart looks like a small flag….so it will be interesting to see if that .106 was the low and now it will go up from here….:)
…and now….back up…
This is how I am watching CNAB.
I’m not getting ready to sell, I’m holding my current position, but I’m debating adding on this drop. I may not add until next week though. I want to see if it passes this test first. These are my current parameters.
refresh
https://uploads.disquscdn.com/images/bf6db637912527852df3a505c1c6cdca5a7663cfb20bfb2f336cdf97b3d5b285.jpg
Very nice…..
I can’t believe that price just bounced right off of that imaginary line 🙂 crazy
mmmmHmmm ….
Well – I have more positions than I like ( I dont like to hold more than 5-10 good solid set ups, so I cut AUMN out for now.
I bought it climbing over the 50sma, and had profits, but now it has come down and breaking back under.
I dont know if it is a warning or what, but I want to hold less positions going into the 3 day weekend. And more cash for next Tuesday 🙂
Refresh – And as for PLG – It is down today, but it is right back on what was support and a back test of the break out as shown on this chart – so I am holding that one.
https://uploads.disquscdn.com/images/4c60fa190b92a29a0685c2abde584133f3dcc59835a4ccee0c713666409ca536.jpg
I also cut AUMN and the last bit of NAK today, moved into falling JNUG. That was a long boring week, hoping next week we see our pop to 1275-1300!
LXRP added
Is that MJ?
Hemp infusion in foods
MSRT didnt fill … maybe next week….
REFG & RMHB looks good for next week also….
Last chart in the report , we both own it = GBLX acing correctly.
Break from the down trend line on the chart in the report. Small price, small wonders
up 7% : )
Cool !! 🙂
awesum…. my 1st ‘experience’ with MaryJane…. ;o)
just curious …… i was thinking of holding for a longer term swing… would you say that the group has completed waves 1& 2?
I’ve been in it a couple of weeks(liked its bio) good to see some green shoots. Having shoveled a few roofs—I hope you didn’t get frost bite. Used to put long extension ladders at the roof angle and shovel out of them to keep from falling off.
Worked up a sweat actually. 30 degrees and a pretty good work out
Alex…do you think if OWCP can break through .95…..it can soar? Nothing but air after that…?
Yes I do
PLG & TRX in my account just moved higher- the daily charts look better now 🙂
Amazing . . . hard earned 1 cent! for TRX . . .
Disappointing day for miners, but on the positive side there was some last minute buying and the LOD continues the trend of higher lows since the Feb 10 low. A block trade of 4.2 million shares of GDXJ came in at $41.25 at the close. I remain “all in” and holding longer term.
I am out….see ya all next week.
Be safe !
bye bye
the 10 DMA seems to be important to the uranium plays today. of the 11 i track (including URA), 10 of them are on or right at the 10. the exception: CCJ, it is above. the etf URA daily looks great, higher highs and higher lows since the run started on 12-29-16
Have a good weekend all!
Could Solars be forecasting a move in oil? Solar got killed b/c oil went from over $100 to almost free. No need to have alternative energy. Unless…
Had to leave right at the end of the day – good weekend everyone!
https://uploads.disquscdn.com/images/0bd204d3a8e5ad69c39097c35ff39a1717e247922d0934d4b88b836eb9e9abe7.png Really Liking some of these solar charts right now… Here are 6 that caught my eye
https://uploads.disquscdn.com/images/ee627f60ec69b66f3f2517208656a8c27c46ad3a60088d5bda7a6ebca48c1164.png https://uploads.disquscdn.com/images/d4a0fdc53e9777f9849200c35fb1beecde528cf60e7f2ec44b87a5dba07186b6.png https://uploads.disquscdn.com/images/7c955903780db3c0eada80669d365fd3b0981f9f45646761ab08d45562c0e68f.png https://uploads.disquscdn.com/images/f0ec4c2db0a688dfa1577bba46c4dba31a33f4ca006367cc3d9a6a89c338e459.png https://uploads.disquscdn.com/images/9e1c2c2fa34fce8a56d415501690fe745eb73d492050e9d85f6ebf7cccfa2b97.png
Maybe you could post these over on Alex’s new post?
Ok, maybe there is some after hour glitch…but….I am seeing that CNAB dropped 1.79 all the way down to .20??????? Holy cow surely that is wrong. It is on the after hours nasdaq site….I saw it first on marketwatch..huge candle down and thought there must be some mistake so went to check it out….oh. my.
I think something must be askew here….only shows after hour volume of 1000 shares…but has a high of 2.03 and a low of .2053…..marketwatch has another chart that shows it fell then went right back up so not sure what it’s all supposed to mean. Probably means I shouldn’t be looking at charts until next Monday.
sooo .. i was lookn at STEEL … saw this pattern … HMMM .. I overlaid 2017 – today .. onto 2005… W .. o … w … pretttty similar looking … dang. i actually drew it both ways … with 2005 onto 2017 .. but I liked this one better…
https://www.tradingview.com/x/rjK2vnmm/
i should add … that’s a monthly…i will do a weekly next in case anyone cares.. .haha .. if not.. well .. im just talking to myself ;o) nothin new…. 😉
Nice chart..so you are not just talking to yourself…but you should probably post it on Alex’s new weekend post so more chartfreaks will see it.