
Weekend Report – Still On Track
Things are pretty much playing out as expected in the markets, and from what I am seeing in the precious metals sector, things are still on track there too. Let’s take a closer look at what last weeks action brought us.
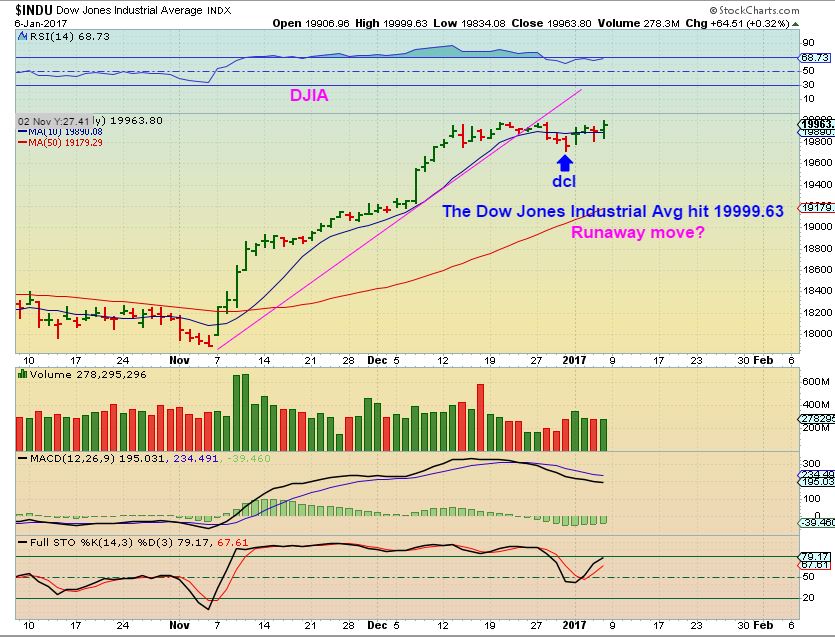
DJIA – 19999.63, are you kidding me? 🙂 A fraction away from DOW 20,000. I feel that we likely just saw a dcl and I would expect a push to new highs soon, so DOW 20,000 should be accomplished in the near future.
There are, however, a couple of other things that I’m noticing in the general markets too.
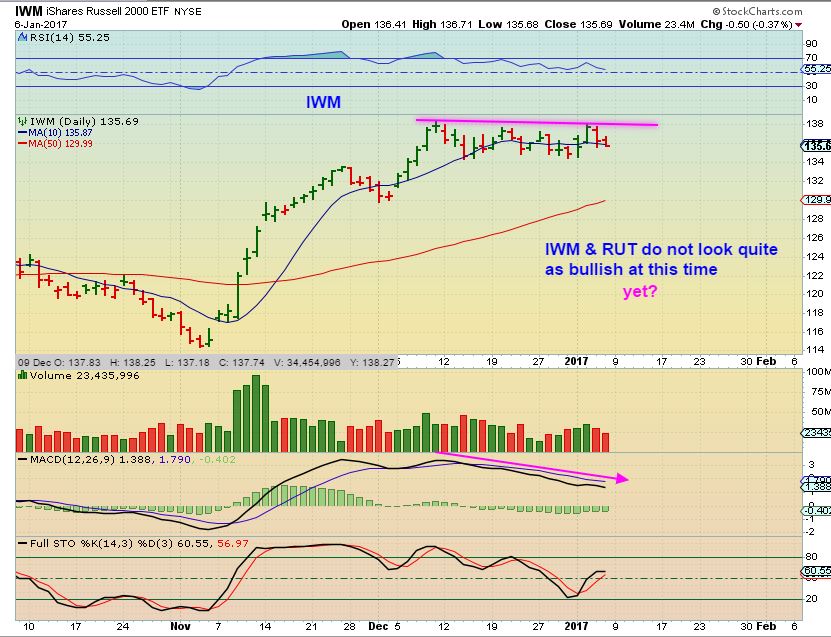
The MACD on that DOW chart is dropping as price hit new highs, and the SPX, IWM, RUT, etc charts are showing a few signs of relative weakness recently too. This is a consolidation at the highs and can correct itself over time, so we’ll just have to see how this plays out. The MACD on the IWM does look noticeably weak at these levels though.
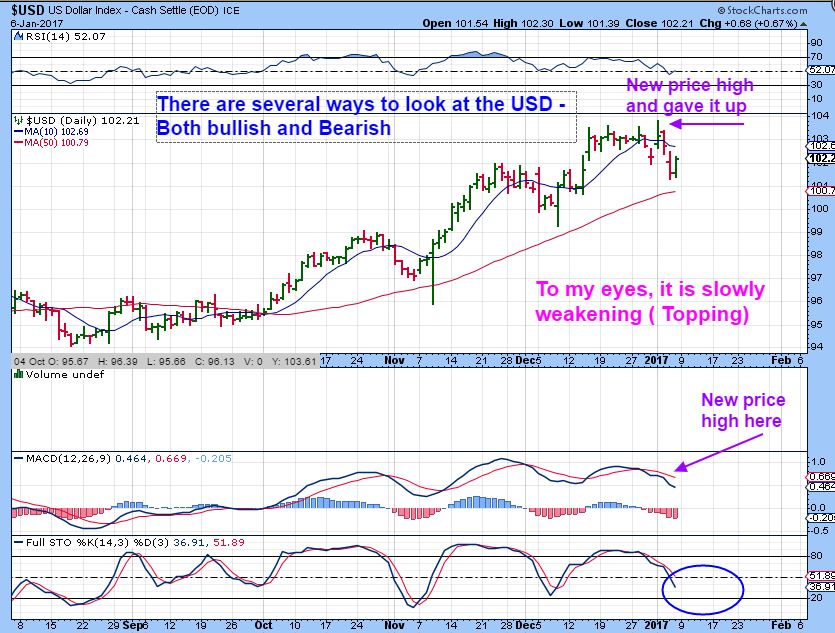
USD DAILY – This COULD also be a dcl forming, but when I look at the chart in its entirety, I feel that it still wants lower price.
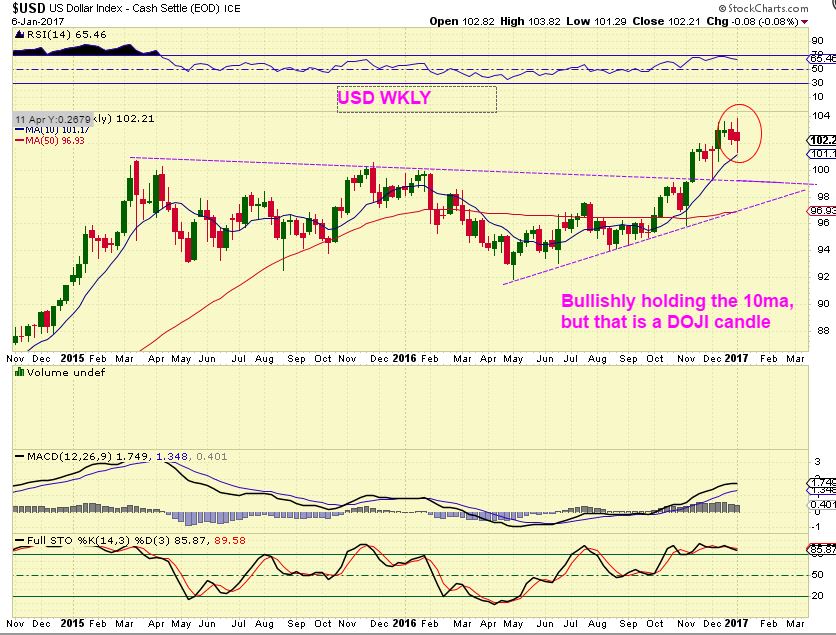
USD WEEKLY – That is a weekly large doji candle, it indicates indecision at this time. After a run higher, a doji can signal a change in direction too. The USD is entering the timing where we could expect a dip into an ICL soon, and this doji could signal toppiness.
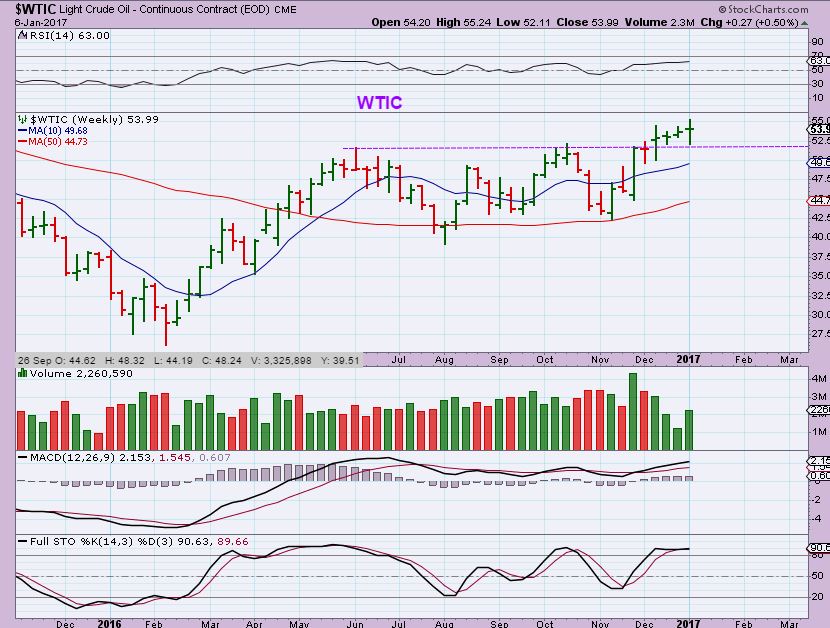
WTIC – Timing is getting along cycle wise and this looks like a rising wedge forming.
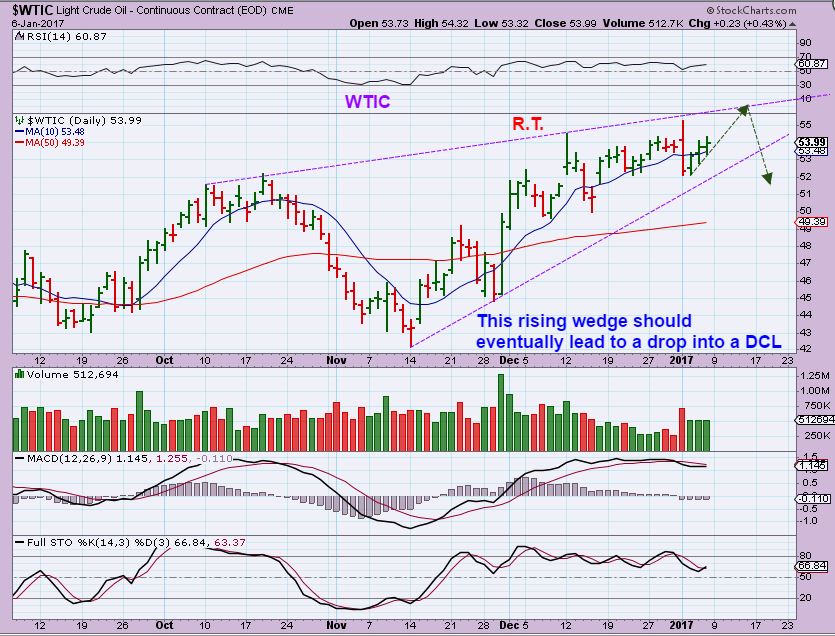
WTIC – I mentioned 3 weeks ago that OIL still looked bullish above the break out, and I got emails & comments telling me that the COT for Oil was at record levels, signaling a crash is coming. I said, ” I do not use the COT as a timing tool, I heard the same thing during the entire GOLD run higher last spring as GOLDS COT smart money short levels kept on increasing.” The COT is a good tool, but it isn’t a good trigger or timing indicator. I use it as a guide to gauge the environment, but it is not a timing tool. The same goes for the COT & the BPGDM for Gold & Miners. So far, OIL has held up, but it is now entering the timing for a dcl.
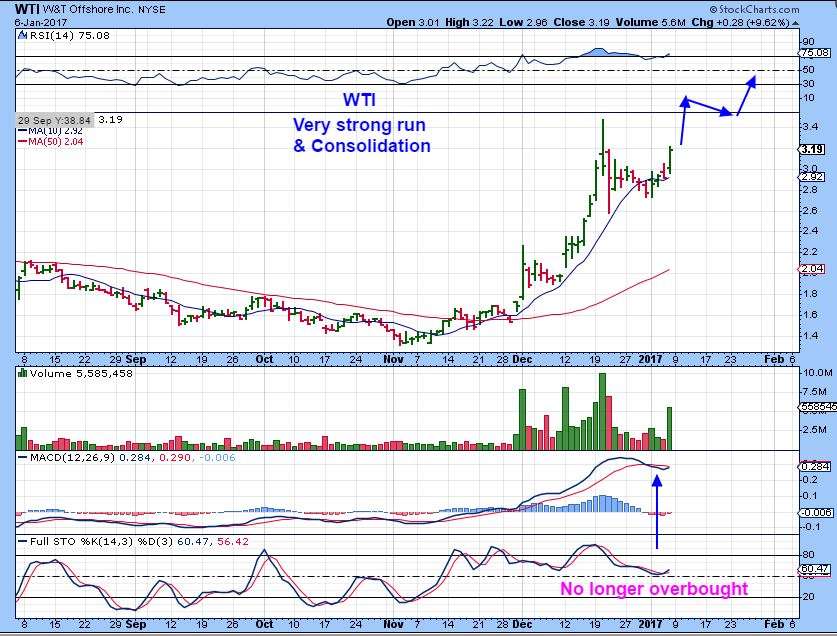
WTI – I still see bullish set ups in the Energy sector, so I am trying to look at both sides of the equation. Time will tell once Oil starts to sell off a bit.
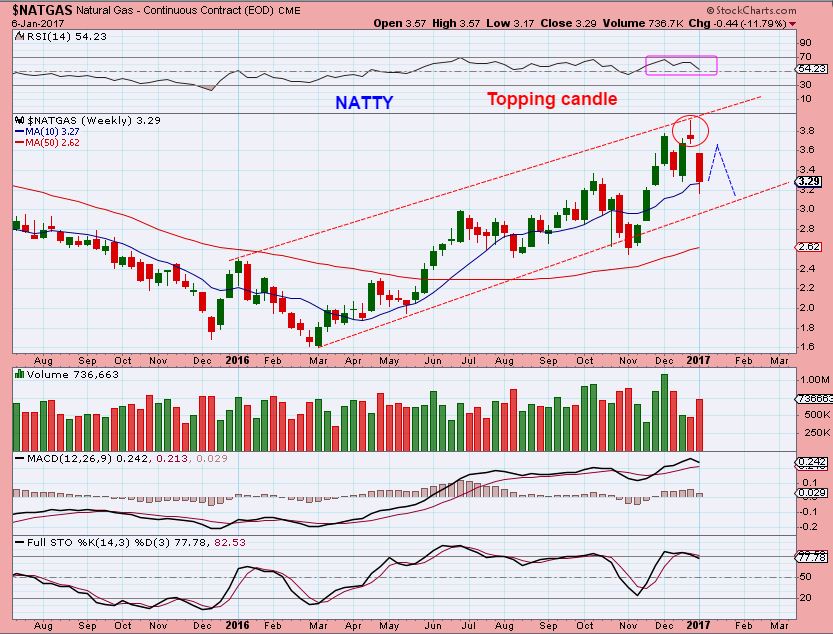
NATGAS – Support at the 50sma, or just a pause? It is oversold on a daily and can bounce, however…
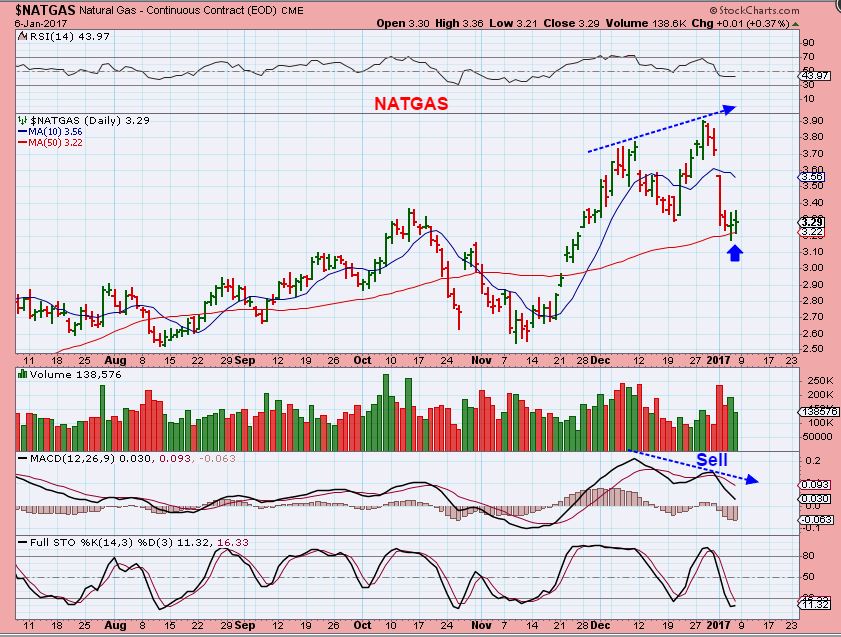
NATGAS WEEKLY – That is a topping candle on the weekly chart last week and the selling could have further to go. Maybe a bounce and then a drop to the lower trend line area?
GOLD & MINERS
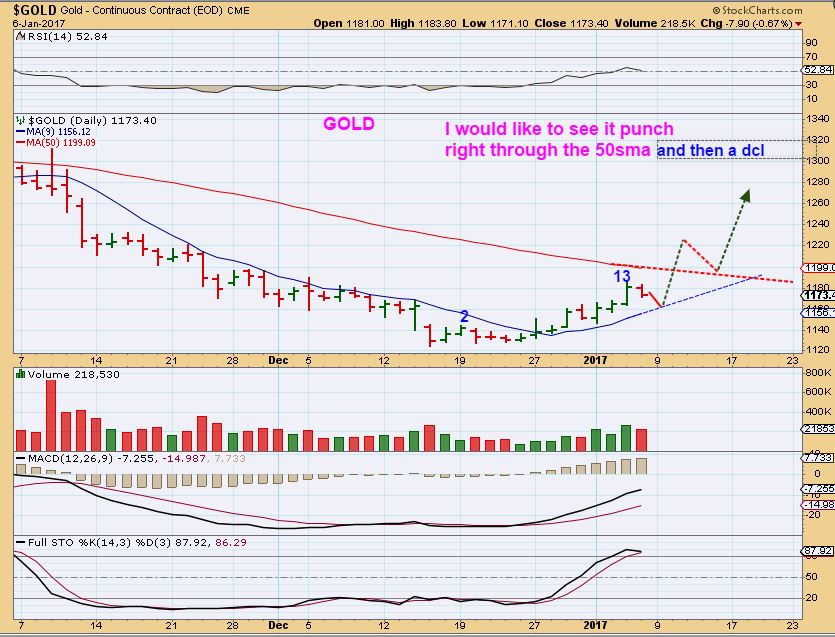
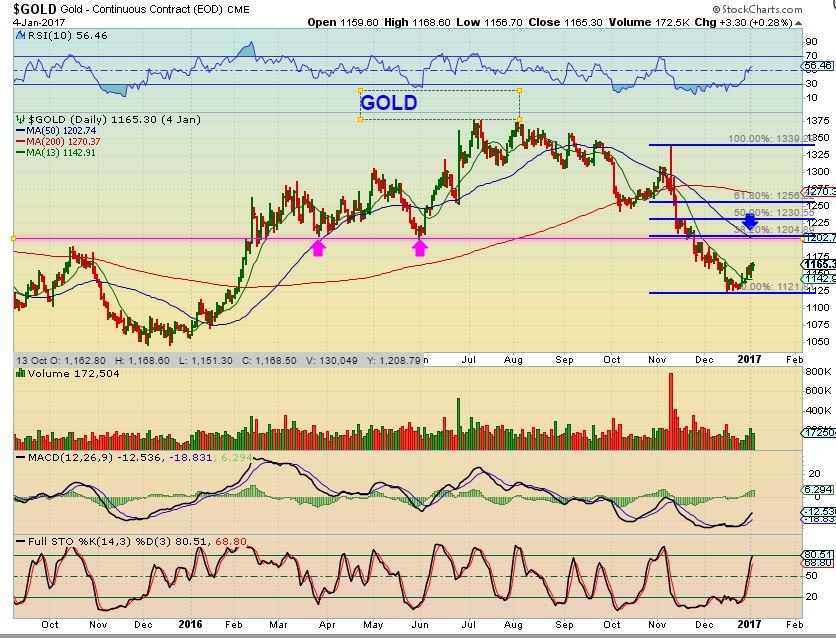
GOLD – Was Fridays selling bad? No. Gold is climbing higher and I’d really like to see it exhibit strength next week, pushing it above the 50sma as drawn here, rather than linger under the 50 until we get a dcl.
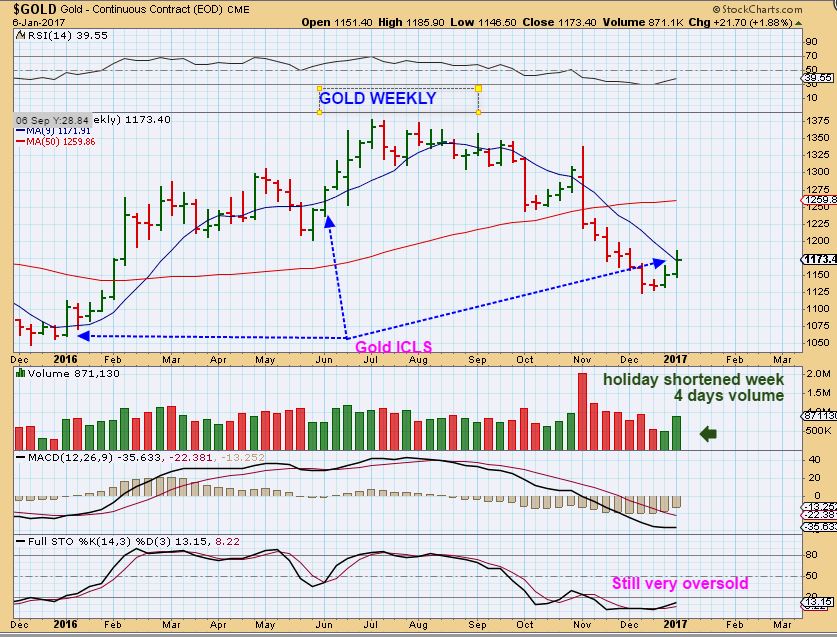
GOLD WEEKLY – Gold has 3 ICLs in this chart. So far they all look similar ( Bullish) and GOLD remains on track.
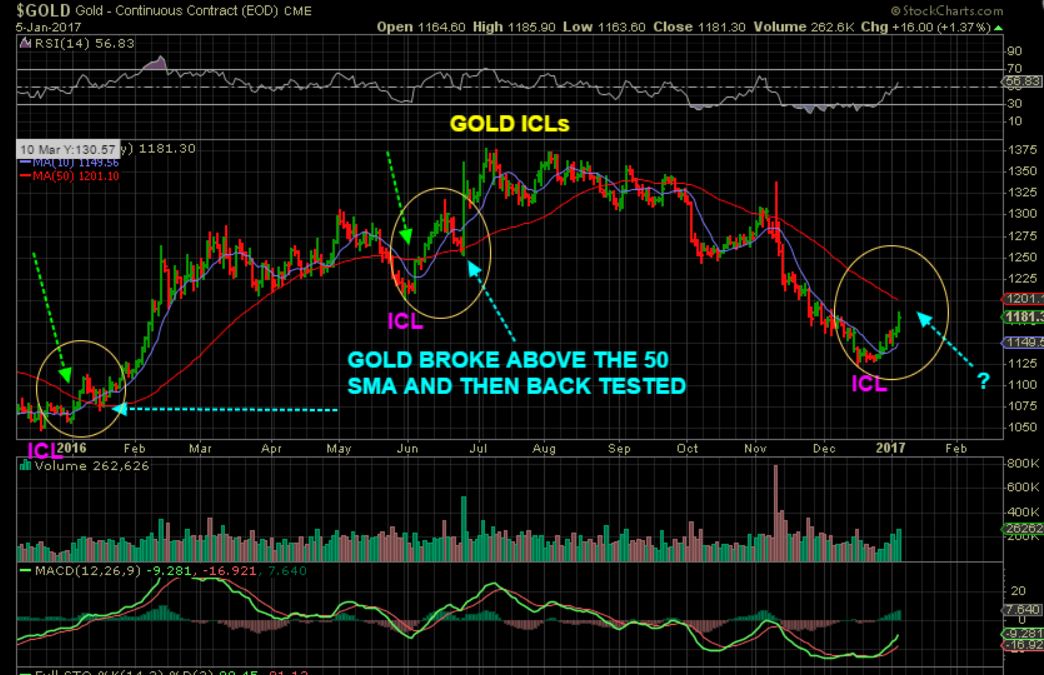
GOLD ICLs on a daily basis – The last 2 ICLs saw GOLD break above the 50sma and then back test. That is why I said that I would like to see that now. This would be bullish.
GOLD short term target? Roughly $1200ish and that would mean that GOLD wouldnt break above the 50sma, because the 50sma is currently there. So if Gold DOES break back above the 50sma and back tests, it is very bullish to me. That would mean that it also recaptures the MAY ICL and gets above a strong resistance ( Magenta line).
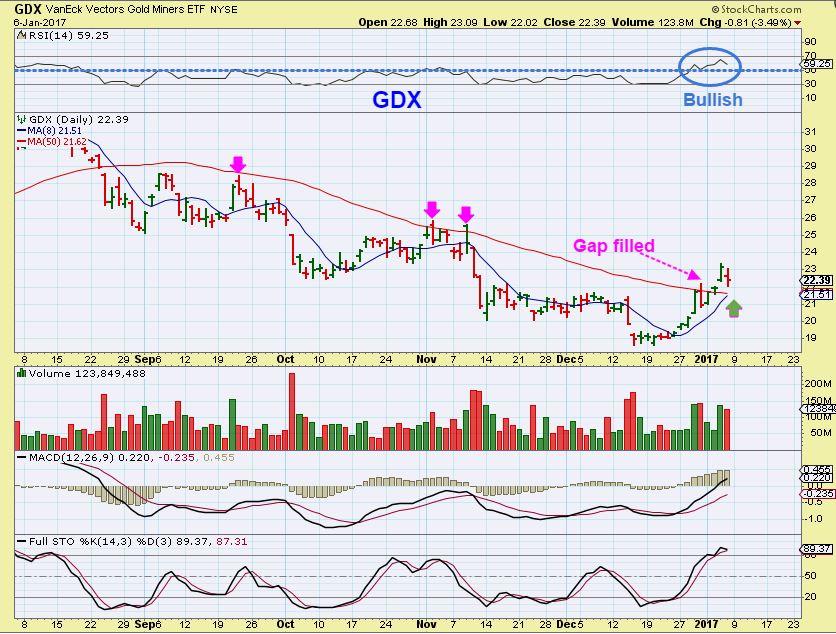
GDX – Was Fridays selling ugly? No. We see a gap fill and a possible attempt to tag support at the 10 & 50 sma. This is normal action and it could even drop Monday to test support. Things remain on track.
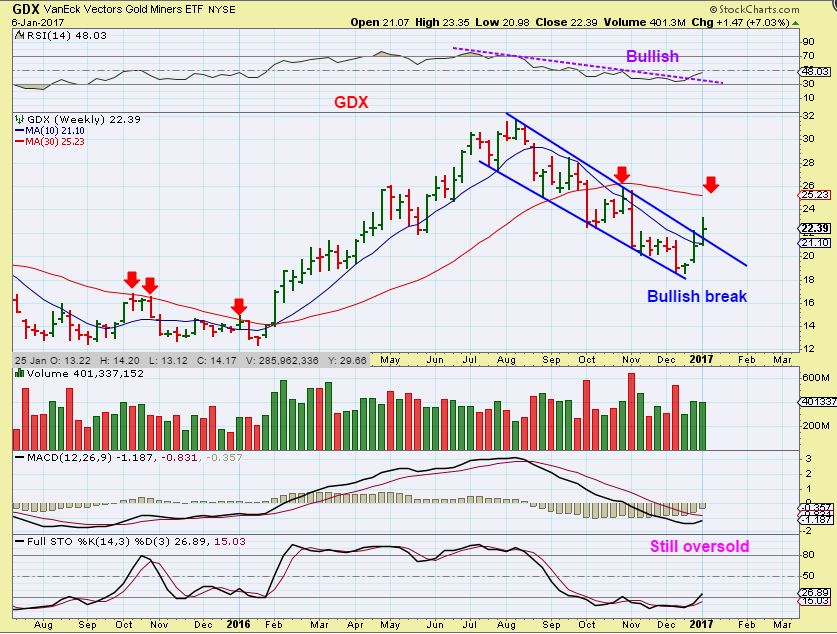
GDX WEEKLY – We see a break out upward from the downtrend. GDX remains bullish and right on track. Resistance is coming in above with the red line around $25.
MINING THOUGHTS
MUX – This certainly looks like a bullish break out. Notice how many weeks in a row MUX went higher in the past. This is why I said that getting too cute and trying to trade around the run out of an ICL / YCL could cause one to lose position. Mux ran up about 500% last Dec through July.
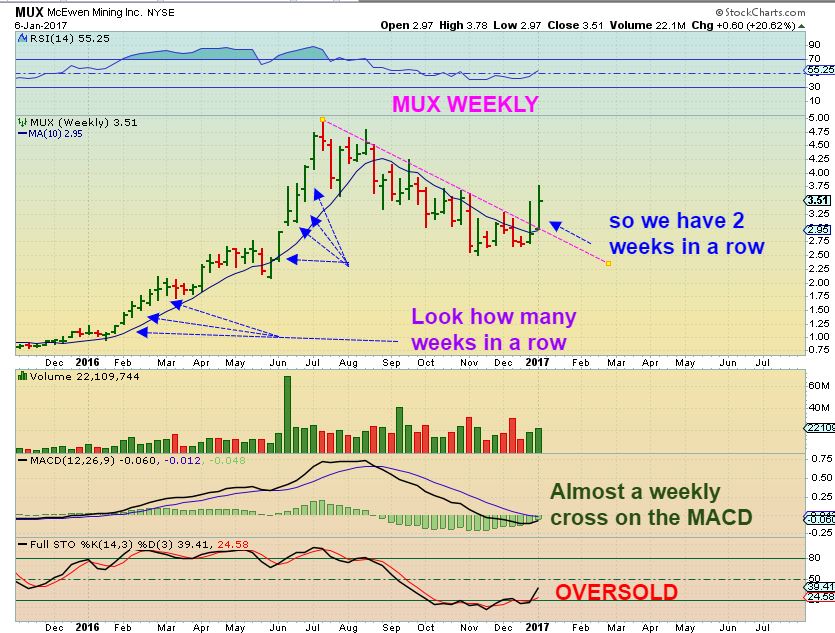
MUX WEEKLY POTENTIAL – Read the chart
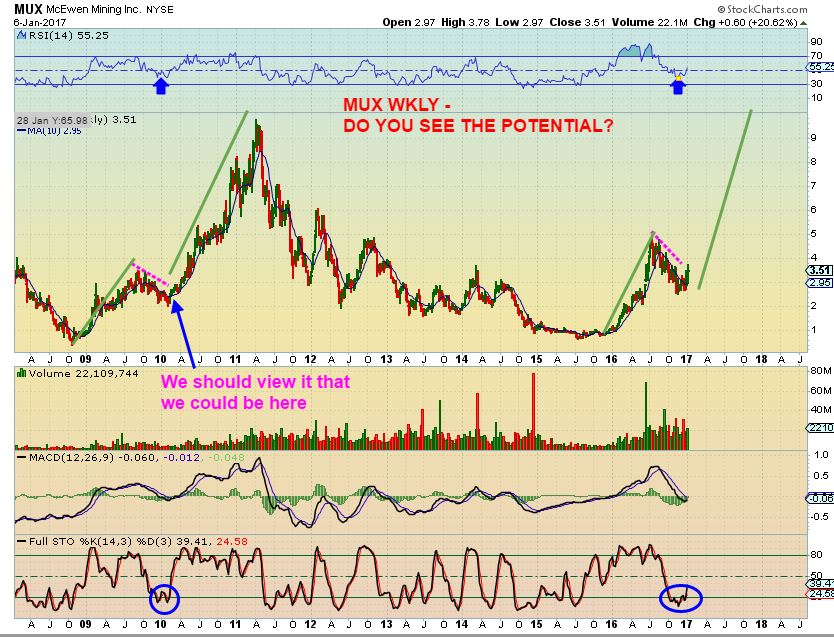
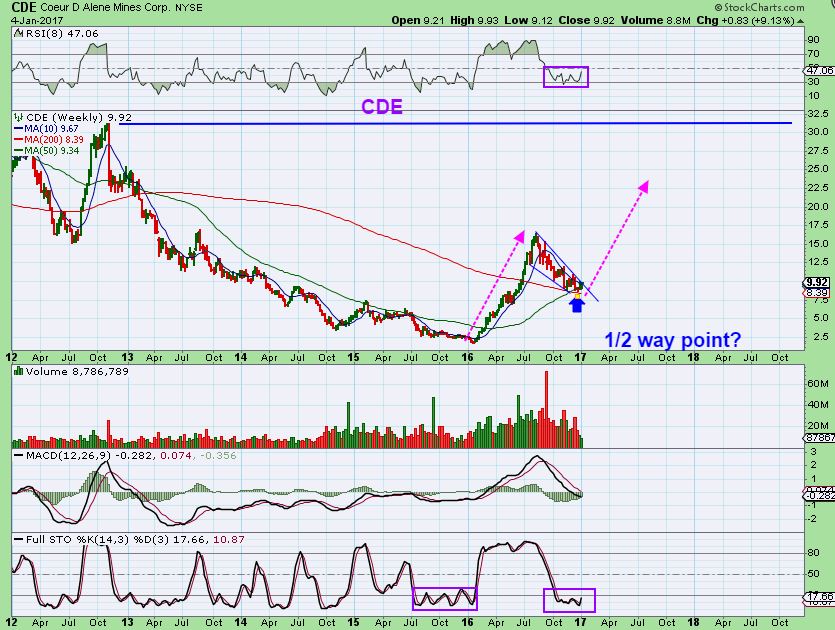
CDE – Again the potential is exciting. Once CDE got running in 2016, it was difficult to buy & re-gain position.
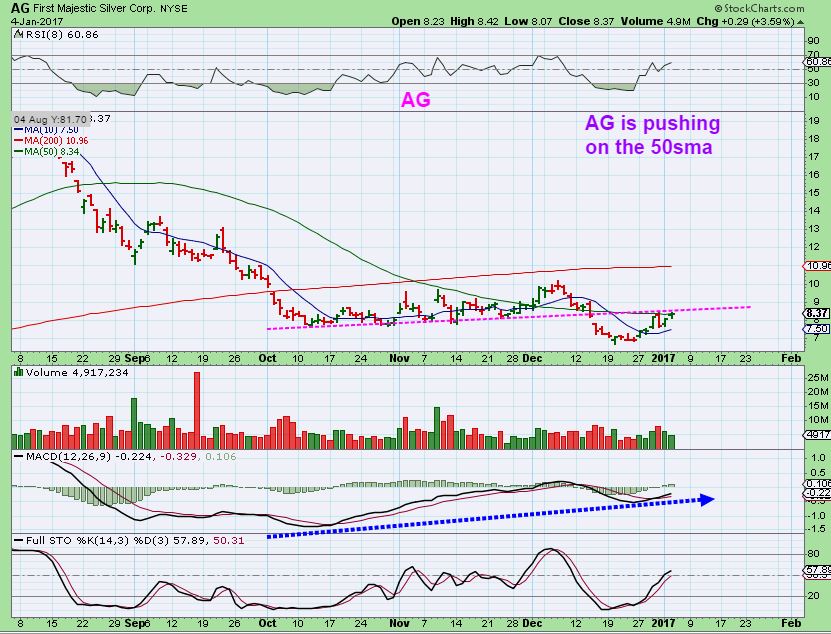
AG – This was my Jan 4th AG chart. Regaining that 50sma is bullish and would draw in buyers.
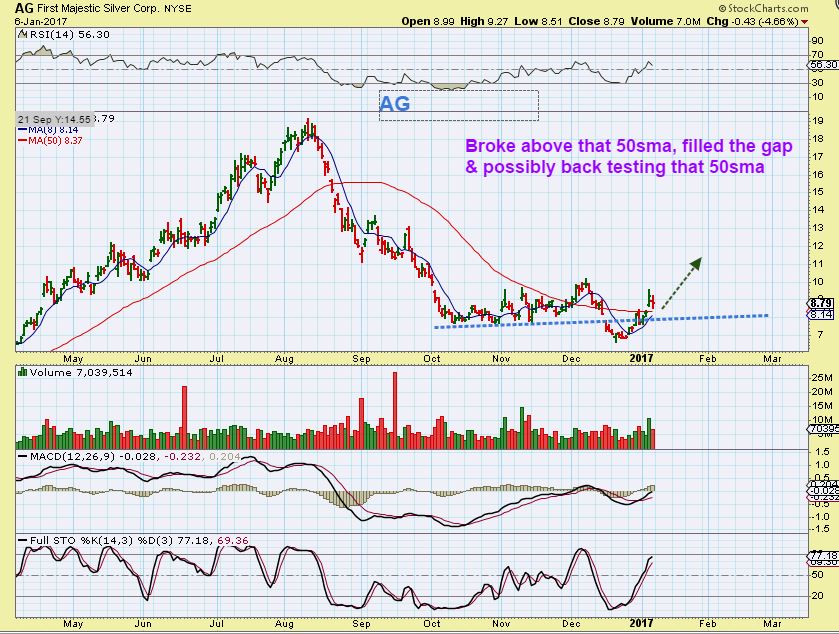
AG – First Majestic surged over that 50sma, and sold off Friday. is it still O.K.? Filling a gap and back testing the 50sma, it remains on track so far. You can see that it too could drop further on Monday and be fine.
IAG – I drew this on Jan 5th, it sold off a bit Friday. This could form a cup here, and it may or may not put on a handle, but the targets are much higher. Let’s take a bigger picture look too.
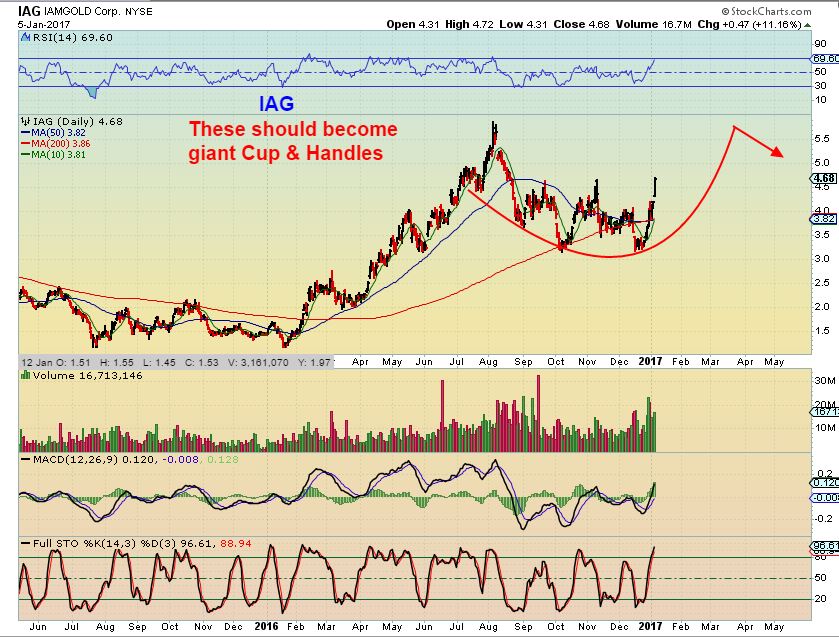
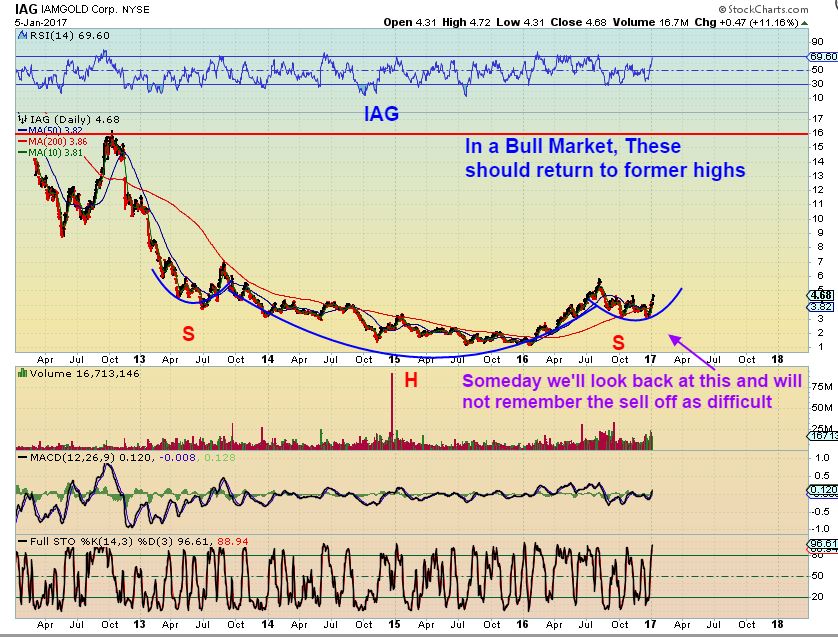
IAG – The big picture potential helps to filter out the noise or wiggles. This chart shows that IAG could go from $1 in January 2016 to the former highs of $16 over time. Huge potential. This recent sell off would eventually just look like a great place to load up, and not a scary sell off like many have viewed it.
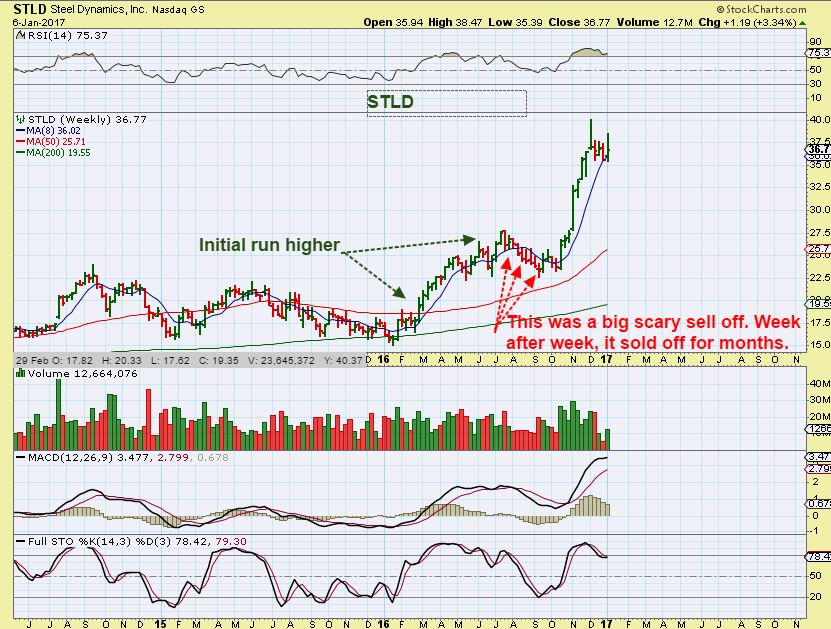
STLD – We have seen Steal, Aluminum, and Copper stocks break out and run rapidly higher. They too were experiencing sell offs week after week that had many hating them. This chart shows you that in hindsight, those sell offs fade away if the rally follows it. Doesn’t this consolidation / sell off last summer look similar to the one above in IAG last fall? This is how our Miners could look this spring, as long as…
-THINGS STAY ON TRACK.
So far, things do remain on track, and I plan on continuing to track this sector and looking for low risk set ups on pull backs to help readers here to be able to buy the dips. Enjoy the rest of your weekend, thanks for being here at chartfreak!
.
~ALEX
.
Finally:
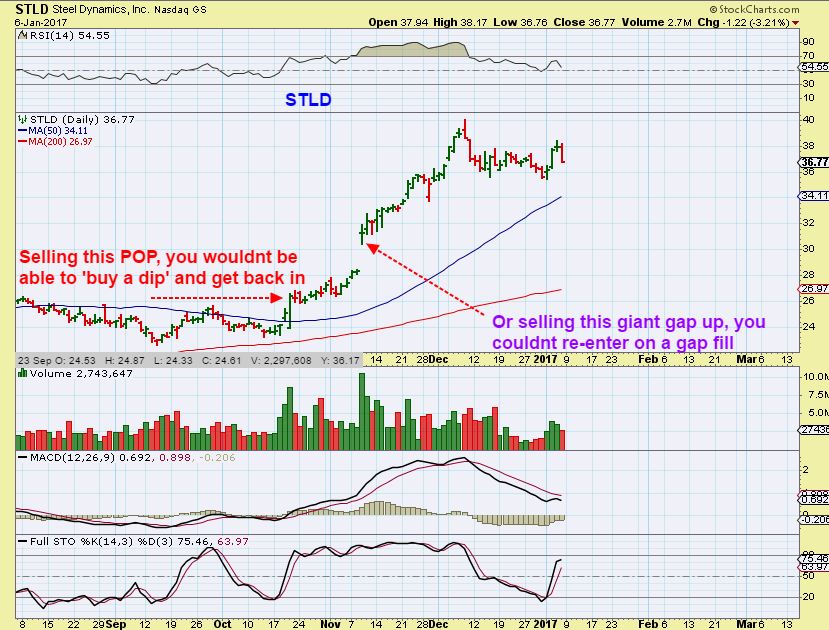
STLD – This is that weekly chart again. Going back to what my last report was pointing out about the danger of getting ‘too cute’. I do sell partial positions when a rally has become extended, but selling every Pop day to day may or may not work out in the types of runs that can come from beaten down markets coming out of an ICL. Notice that STLD ran higher from October for 8 straight weeks.
STLD DAILY – Notice that we do see 1 or 2 day sell offs here and there, but under these types of moves it is very hard to sell a pop ( Scalp gains) and get back in lower. I am simply saying that with our Miners, we could see this type of move too, once the bullish run catches fire.


Thanks to Alex, we have lots of good stocks to buy. I looked at WEEKLY Heiken-Ashi charts for many of the stocks that were
slow and steady movers from Dec 2015 into Aug 2016. I limited my lists below to at least doubles. I used the TC2000 H-A setting ‘Open vs. Close’, colored up bars green, down bars red, and filled the down bars green/red. I encourage you to look at these if you can and watch the colors change. I also added the 10wsma. Take a good look at the 27charts below. There were some pullbacks, but they were not too bad. For those who did not sell in August 2016, these charts may be especially insightful.
Below are the stocks I will be buying or adding to if I already hold them. One added bonus, the first ones on my list, labeled A+, are relatively stronger than GDX on a weekly basis, though this can change as stocks rally. I favor them – why buy an A stock if GDX is doing better? If someone finds some that I missed, I would appreciate having them. I, like you folks, want to be in the strongest stocks.
‘A+’ list for slow and steady movers from 12/15 into 8/16: ABX, AEM, AGI, AKG, AUY, BTG, DRD, GORO, IAG, RIC, XRA, BVN, MUX, AG, CDE, EXK, PAAS, AXU.
‘A’ list for slow and steady movers from 12/15 into 8/16: NEM, RGLD, SAND, KLDX, FSM, HL, MAG, SLW, SSRI.
I may have written the following before:
Either we are beginning a wave C of an ABC in a bear market or we could be starting a wave 3 in a bull market. Thus, I believe that we should see a rally for 3-5 months into May with pullbacks along the way. Although I don’t have a perfect crystal ball, given the sentiment figures and seasonality, I don’t think that we will continue down in a bear market now. If we do, I will get signals to sell from my H-A charts.
Thank you Glmus. Look forward to more of your sharings.
Hey Seer
If you are using the Heiken-Ashi charts, please share a few here. I dont use them, but I’d like to see how you guys are benefiting, whether it is lagging or predictive.
Thanks!
I use stockcharts. Not familiar with the Haiku. Love learning new things
everyday. Keeps one “young” too – alert mind!
Here is the chart on stockcharts.com. Both the RSI and MACD would have been helpful too. https://uploads.disquscdn.com/images/cae5fd195c63b622304cfef04cf2e9c781c519dc575b44c7a706dfbb186bbacd.png
Good looking chart. Add Williams% to it and OBV and full Stochs . . . .Good volume compared to 2014 volume. Neumeyer is commencing a lawsuit on price fixing, too.
Hey Glmus-
For the readers here, maybe you can you post a chart or 2? You wrote ” I encourage you to look at these if you can and watch the colors change.” Then you wrote ” ” take a look at the 27 charts below”. I see no charts. It would certainly be helpful to me and others if you gave us a chart and we can see what you are talking about.
After all, we are CHARTFREAKs. Words just back up the charts. 🙂
Thanks in advance!
Hi Alex, I believe I understand what he meant. I counted 27 tickers in his list. He wants us to look at those charts ( that’s how I read it). I like the H-A candles. They are easy to read and they indicate trend among other things. When a Haekin-Ashi candle changes color and wick direction, its a possible early signal for trend change. They use averages from open and close to determine plot points and I believe that’s why they don’t gap. I am not an expert by any means but they are very user friendly and interesting. Thank you Gary (Glmus) for such thoughtful post! Alex thank you so much for the weekend report! It is so good to be on track! And thanks for creating chartfreak.
You have made the coolest place for us to help each other!
Alex you da man!
Yes Johnny, and thanks, but you and I are not the only readers here. I am familiar with them ( Rarely use them), but what about the hundreds of other readers I have? Some may use H-A, others may not even know what it is. A chart is so much more helpful, in my opinion.
I was hoping he’d post a chart or two of his favorites for visual for the readers that do not use it. Thanks though for the explanation though, Maybe that too will help some of the others.
I have now posted 2 charts. Readers using an iPad need to click on the uploads to see them. Using freestockcharts.com anyone can look at the other 26 tickers I posted to see what a wonderful run we had and where we could have exited. These were stocks you recommended. Johnny was correct – gaps don’t show up. What I do is put two charts side by side, one HA and one traditional candles where the gaps do show up. If a stock goes to fill a gap, the HA candles will be red. Once filled and a green HA candle shows up, it is likely time to buy. Very cool.
Thanks for the charts.
Ahem..*maria is cool. ;-D
#paypal
Totally!
Thanks J-man
I have not been able to post my TC2000 charts, but I have posted some Stockcharts.com charts. Anyone who has the capability to chart in H-A can follow what I wrote. Below Johnny was able to see what H-A charts can tell a chartist. Just one more tool in one’s tool chest.
Or you can email 1 or 2 of your favorites to me, and I can post it for you if you would like? It’s up to you.
Hey, I posted 27 symbols. Any of them should work. I did not allege the HA charts were predictive. As Johnny pointed out, they are great for trend following and help alert folks to possible trend changes. Based on many posts, lots of us missed the August top, but perhaps HA would have helped us sell. If subscribers don’t follow TC 2000, I think what I have suggested is available on freestockcharts.com. I will see if I can post a chart from that site to help. Thanks.
No worries 🙂
https://uploads.disquscdn.com/images/24392f798dbcebba9a4cafbd896b655ed32ba37e344852b2d060ce31382584c0.png
Hey I figured out how to post my TC2000. It is a little different than freestockcharts.com. Still fantastic though.
Thanks for the challenge. I was able to get the chart of AG on freestockcharts.com. I also noticed that the front-weighted ma seems to work well on this one. An extra bonus.
https://uploads.disquscdn.com/images/a2bef5392d7e511f32d8156213b82deea9a3c58a3ed4e47c77d92660075e69c5.png
I just checked my TC2000 and all the candles going up were green, even better. The first red candle appeared at the top just like this one. Hopefully others will want to get on freestockcharts.com to see the other 26 symbols (not charts) I posted. Let the eyes be open. 🙂 BTW, AG was the sweetest one of the bunch, but the others were pretty good too – it was a great run. Sadly, HA is not perfect. It turned up in Nov then did the Trump swoon. But now it tells me that it wants to go up. One thing about HA charts is that the wicks are mainly on the tops of the green candles and the bottoms of the reds.
Thank you!
those are cool to look at now …. but …me wearing my skeptic hat ;o) — remember we are looking at those charts in hindsight … just as with EW — i can quick mark up a chart of ‘what was’ and say … what the heck Maria –that was so obvious… BUT in ‘real time’ these charts look very different. Let’s say you have a red candle showing for a week …. sure it looks clear as day & obvious now..but in real time — was it realllllllllly that obvious??? I’m leaning towards ‘no’ … just a thought….
thanks
M
So much to say so little time…….. 🙂
But I will say this: I do Not look at a chart in hindsight at all. Natural ebb and flow future movement to me with defined risks / rewards.
Oh yeah….. Do tell….. .ye of little faith who pick cf… Over muahh in a horse race… I mean CF.. Come onnnn… We’re tslkn this guy ..the one who only points to the bull like ckn little…vs. The chick who actually takes the bull by the horns…..;-) https://uploads.disquscdn.com/images/9b2af5ff31b2edc6c82950c50e330341e8305e794b71f432ae5de2bc531100ec.jpg
*with an awesumly hot fannypack to boot!
Set up HA charts with whatever charts you like now side-by-side. That’s what I do so I can see gaps for example. If the HA charts don’t help you, don’t use them. These charts are ‘real time’. They are constructed using the present and previous day’s numbers. You can use any time frame. They are just as ‘real’ as candles. What about point and figure charts? They are used extensively. Are they ‘real time’? The point is, they both give information that is helpful to various folks. For example, I think the $BPGDM is based on the underlying point and figure charts. It is not a perfect timing device, but it provides information – currently it is pointing up. If you can read candle charts with precision, you don’t need HA or P&F. Personally, I find HA to be very peaceful. Green bars in an uptrend are tranquil. I don’t see lots of jumping around. When I see a red bar, it tells me that something may be amiss.
Thanks, G
Gary, if you’re on Windows just open up “snipping tool”. It’s built into the OS. Save in any graphics format (bmp, png, etc.), place in a specific folder then attach the same way with the button in the lower left of your chat box.
Thanks, Cason – great idea. I will try this next time.
What a helpful post Gary…..thanks!
We do have new readers here, so I should clarify for the record.
I remember saying repeatedly at the end of the summer, late July , Early August that I was selling Miners or raising stops ( except for my core positions picked up from January 2016, and I allowed NAK to ride onward) and that I expected a sell off into an ICL. I would sell if I am expecting a sell off into an ICL. I mentioned that timing wise – It would be late Sept or early Oct that we would look for a low and monitor it going forward, to see if it was the ICL.
We had a low , I bought it and rode it into the elections , got stopped out.
I dont know why anyone would ride positions from the first July / August all the way down, when I always encourage using stops to preserve funds.
My fault. I missed your sell warnings. In any case, my H-A charts make it easier for me now. Thanks.
He only states “for those who didn’t sell in August” and doesn’t mention when it was purchased. If this was a ‘core’ then this would have been directly aligned with received guidance.
Awesome report, Alex. I think it really helps when you point out things like AG could even go lower but the charts are still as perfect as they can be. It allows traders to prepare and not get scared out of positions for what should be normal gyrations.
Yeah Ralph, I agree. That is kind of why I pointed it out. If we were to drop a bit more Monday, it definitely could give some the feeling of “Here we go again, they’re going to sell these off to the lows again”. Deep selling happened in OCT and NOV , so many are cautious right now, understandably so.
If I can post the chart and show that possible support at the 50sma still hasn’t been tested, but it might , it can help readers to know where things are still ok, or where it might be time to be concerned.
We were certainly short-term overbought Thurs, but I was still surprised by the magnitude of Friday’s drop- all of the high volatility 20%+ moves recently. Thanks for putting I perspective how all is OK. I did know that, but seeing it and discussing still helps build the ole confidence.
Alex, Thank you for filtering out the noise of Friday with that retracement in miners, while not unexpected it was none the less disappointing, having witnessed our supernova of Thursday. (In a musical theme I guess we were blinded by the light.) One question, however, concerning the weekly gold chart: how is the third ICL that we just suffered through still bullish? I realize in the daily chart that follows all will be cancelled by a break of the 50 SMA and retest of that line, if we are fortunate. Thanks
Hi Edward,
The ICL is the intermediate cycle low. When that low is in place, it should lead to at least 2 daily cycle rallies , even in a bear market. So here we see week 3 and the volume is good ( And that was only 4 days worth of volume with the holiday week). Being as oversold on the weekly as it is, it still should have a long way to go before it gets overbought. We would like to see continued follow through to break above the 10 ma ( I had the 9 on that chart), but it is a bullish set up, not a bearish one at this point.
Thank you, Alex. I understand now it is looking bullish but in the context of real time, when that ICL was just printed in the weekly, would not that be bearish with a lower low than the May ICL, the low we hope to break with our first DCH out of this ICL?
No, it was also a YCL
Thanks. That little distinction allow my needle to still point north. LOL
I thought the one in Dec/Jan was the YCL…..? I’m probably just missing what you’re saying here….
That is correct Tammie. That is what we are talking about . The last one is a YCL/ICL
So, I thought Edward was saying since this last low here in December 2016 exceeded the low of last May 2016….that maybe it shouldn’t have gone lower than May….? And since it went lower than the low in May is that a “problem”? Maybe that’s not what he was wondering….but I’ve been wondering….:)
Yes, exactly. The Wave 2 retrace went below the 61.8 in GDX and below the May ICL all across the board. Which was crazy bearish. Which caused folks to short into the hole. It’s that form of extreme sentiment that allows for a YCL/Wave 3 here. That was 1 of my basic tests. I wanted to invalidate the Dec breakdown, which we did, as proof of the ICL being in place.
It wont be bearish if it recovers, but I’m not waiting for that, since even bear markets rally out of ICLs for weeks. Breaking down trend lines, etc
Look at a 3 yr weekly chart of the SPX. Prior summer lows from 2015 were taken out , AND the lows of Oct 2014.
Yes indeed.
Not familiar with Hieken-Ashi charts. Excited about anything that
will help predict next moves or confirm.
You may even be able to buy & hold Mux & just relax on that vacation. 🙂
Indded! Well timed…or happy accident?
Meow 🙂
Hi Alex, Once again your pics outperform. My thoughts have been the risk of missing upside, waiting for POG as well as the indexed miners, not dropping much after breaking their respective ~ 50 ma’s.
But I’m an old turkey including a couple of your pics, and caught the bottom YCL ICL with some leverage. Thanks again. Bulls tend to forgive entry timing. ala these incredible general markets.
But what’s mr. general market to do? And what’s the risk of missing the first aspect of this YC in PM’s?
How might one of us quantify that risk of loosing upside. Especially at a YCL?
Thanks Beek ( Nice to hear from you again )
I’m certainly liking the action that I see so far, but that 2nd daily cycle will help up a lot, in seeing how strong this next move will be ( return to bull or was that trend breaking sell off the start of another bear sell off). A few individual miners are breaking the downtrend and GDX did too, in the first daily cycle. Looks good.
I just noticed that MUX filled a daily gap on Friday.
Just FYI – for any following the marijuana stocks…CBIS announced Friday they’ve entered into a collaborative research agreement with Harvard Cancer Center – maybe that will be something to propel the stock forward – Friday only had average volume (44M) but was up 9% – as always do your research 🙂
Thanks Tammie! I’d like to hear more comments about these MJ stocks. The idea that we diversify and just buy and hold some of these is appealing.
I agree with H50.
Thanks Tammie!
You’re welcome! I have 2 right now…EDXC and CBIS…just have tiny amount in each and sitting on them and not worrying about ups and downs unless I see some news that warrants attention and possibly selling – I did get out of MJNA about a week ago with a tiny profit …news came out that sent it down and since with these you never know what might happen I decided to shed it for now…I see since it has recovered some but still not back up to what it was so just watching for now – they did have good article come out on Friday – I might get back in it at some point – I’m trying to research these different companies when I get time – I’ll post what I find out 🙂
Cool…thanks again.
Of the 10 weed stocks CF mentioned last week what 5 to 8 would you consider holding long term currently with the mind set of finding one or two “leaders” in the sector? MJNA is out due to past legal “issues”.
Of the ones I have researched so far…..the ones I have circled to look into further are CNBX, CBIS (I have some), NDEV, GRNH, EDXC (have some), and LXRP that Alex mentioned in a comment (not in the report) – these are ones I am interested in based on what they are doing…not based on any chart/technical analysis (I’ll be looking at charts/technicals before buying any more (when I say I have just a little…I mean like….$350 worth…so really little…)…plus…maybe waiting on inauguration to take place and search for any Trump tweets about marijauna : 🙂 🙂 🙂
Briefly:
NDEV – insurance for cannabis patients – covering dr. visits, diabetes, general liability, workers comp, etc. –
CNBX – research being done on affect on cancer, showing some promise
GBLX – is supposed to be moving to a revenue generating stage – they got registered for their large cultivation facility – when operating at capacity could have 20M in revenue per year on the growth of plants, etc.
GRNH – cultivation technology – systems and designs – for indoor or outdoor, so can cultivate all year long, hydroponics systems/information, consulting, plannning, etc.
EDXC – has the pet line product for anxiety, etc. – in works to acquire PhytoLabs who is the owner of Amrita drink – hoping to have phyto labs as a subsidiary I think – EDXC might have line of oils and tinctures already or in the works….unclear on that part….also offering inventory management, tech solutions, regulatory compliance info, etc.
CBIS – R&D for development of medicines for various illnesses and general health; focusing on government approved pharma
LXRP – has teas and protein bars – focused on gourmet foods based on infusion technology – technology developed to aid absorption and bioavailability
I’m trying to watch these for news that comes out….
As always do your due diligence…these are just ones I’ve researched so far that look like they could have potential and that interest me as far as what they are doing – but in this market I’m sure there are lots that will never make it off the ground – none of these have good financials…..I do wish I’d jumped on the LXRP last week before it popped on Friday!! I need 2 of me, well, really 3 …one could keep up with metals, one could keep up with other stocks, and one could go play all day…..:)
Good job Tammie. You’re way ahead of me. I’m just started to read about these.
You have to see the chart of NTFU.
It had tiny tiny volume trading at 3 cents , suddenly they made a few deals for their product and Ba-Boom!
It is way too extended right now obviously, but I just thought you all may like to check out that explosive chart.
LXRP was a nice cup forming and nice volume on the recent move higher.
http://seekingalpha.com/article/4012874-canopy-growth-cannabis-etf-surrogate
When I see NTFU, all I can think is “Not For You?”
Thanks Tammie, great info. I wonder if there is an ETF for these yet? I’ll take a look…
That’s a good question, but I wonder if it wont exist because most of them are Pink sheet or OTCBB?
TWMJF is broadly diversified into many aspects of the medical and non-medical marijuana industry. Therefore, it should participate in any developments in the cannabis industry in the foreseeable future.
It actually resembles a lot of the MJ stock charts.
Thanks Bill.
Thanks for sharing Tammie…I got distracted too.
Thank you Tammie !!!
I knew you would make a good “fund Manager”. 😉
Hi Tammie, hi everyone. I’m fairly new to CF but I must say I am impressed with the community feel here – it’s great, and I just wanted to post to thank you Tammie for the above summary on the budding marijuana stocks. Very helpful, and of course personal due diligence is always in order. 🙂
Hi, Evan, welcome! Thanks for the kind words – everyone here loves chartfreak – Alex is great and I’ve been learning so much from him (as well as from everyone else that is here!) – so much more yet to learn! Yes, due diligence on all these stocks….risky and things change so quickly! 🙂
Thanks Tammie!
Oh I was also interested in TRTC…had a little but sold and now I can’t recall why….have to look back into it…..
Ok…was just reviewing LXRP that Alex mentioned last week I think….had researched it a bit after he mentioned but got sidetracked watching metals….geez….it went up 19%….6 cents – Friday….man. I was thinking about getting some…..argh. I’ll have to see if it looks like too late to jump right now…wait for a pullback or what….they have cannabis infused teas and also a protein bar….I had read about it last week and now can’t remember all the details….wow, wish I’d jumped on it when I was reading! Check out their website…
Nat Gas, favor the 2nd chart Alex show above. Expecting a ‘B’ wave up here but likely to get a lower high and then an lower low in ‘C’ next before wave 3 Up later in winter. Bearish weather forecast starting Thurs, but that’s baked in already. Surprises likely the upside, for now. A next low in the $2.9- $3 area would be a ‘buy’ in the future.
Early in the overnight session, dollar up/gold up marginally. Silver flat. Energy lower, indexes up slightly.
Glmus,
It would be helpful to all of us if you throw out an actual trade with a chart stating why you entered when and why you did and where one may want to place a protective stop…..best way to watch/learn your trading style…..so much clearer imo.
Here is a simple method. If you have a rising string of green HA bars, especially weekly ones like the ones I mentioned, leave after two red bars form. If you like stops, throw in a stop below the first red bar, perhaps reenter on the next green bar. Simple. I have a more complex leaving strategy, but let me have my evolving little secret. It works for me. Look a many charts to see if HA is helpful especially on losses you may have had. If not, don’t use it.
Thanks, G
Thanks G,
Do you ever use HA on the Daily time frame ?
Absolutely. They are also really useful in hourly charts when I buy pullbacks. I have a checklist in my watchlist that shows me whenever a green bar has appeared after a red bar (hopefully a series of red bars down). Then I look for my confirming buy signals. I also have columns that have green dots to show that the HA is still going up for the hourly, daily, and weekly. What is very cool is when I see green dots in the daily and weekly and a red in the hourly. That alerts me that either there is a change in trend coming or an hourly pullback is coming. I then watch for an hourly check to tell me that the hourly HA green bar has formed and then buy. Here is a chart of the current pullback of STLD. I should be watching for a green check to show up in my watchlist if I want to buy this stock. Clearly the one green bar was not sufficient to give a turn up yet.
https://uploads.disquscdn.com/images/0963c0e003a37f45db18e3ab74d86b5f809835f49dc1144ff6645233ce710869.png
CF:
Are you considering the need to “adjust” the number of DCL’s possible in Golds 6 month ICL’s ?
I’m not sure if I understand this question, so I will answer it 2 different ways.
1. The number of daily cycles in an entire intermediate cycle does and always has varied, depending on strength or lack of strength. For example, in a strong run , you can have only 3 or 4 daily cycles ( And you buy the confirmed swing low with a stop in place, because it is uncertain if you will get only 3 or a 4th ). In bear markets selling, we’ve seen 5 daily cycles, making buying the 3rd or 4th daily cycle swing low frustrating, but eventually you get to the extremely oversold ICL point..
2. If you mean do I want to do a re-count and see if we have 5 daily cycles in the current sell off for GOLD? No. Some cycle guys might decide to add a DCL to a chart later in hindsight, because they havent seen 40+ days , etc. They could be comfortable adding a dcl to a mini bounce that they go back and look for after a certain number of days( 30), but for my analyses, the rule for a dcl is to be honored. If it stretches to extremes, so be it…it is an extremely stretched daily cycle without a clear dcl that would have been bought ( If we had No swing low & close above the 10sma, I can’t just label it as a dcl later on).
So realistically during that extremely stretched sell off that we had, If you didnt see a clear swing low and a close above the 10sma and preferably a trend line break, it should not have been bought or viewed as a dcl. Day traders may take those bounces as trading/ scalping a quick an oversold trade, etc. – but I cant re-label it if it didnt occur under the conditions that I look for.
I hope you understood this answer. Basically, we just had an extreme sell off , sentiment clearing drop in GOLD. We watched for it to break above the 10sma, and it didnt for weeks, so I have no reason to go back and place a convenient dcl in the middle at some mini bounce. To me, it was an extreme sentiment clearing correction. https://uploads.disquscdn.com/images/9c61ddab6e8bbb525234e3e7cd6cd378f2e421d45dd1c7f6d1ed03375bea9fcd.jpg
excellent explanation professor … i only had to read that once 😉
#MiracleOnIce (it’s freekn FREEZING here 2day) ;o)
No kidding, it was 9 below with the wind chill here today, and they are saying 55 Wed, Thurs, and Fri.
Thats a little messed up
Thank you for the explanation CF.
I am seeing Six DCL’s in the current ICL for both Gold and Miners?
Hence the question or maybe the https://uploads.disquscdn.com/images/342daf499fffb67b851e5d585187aac961acd170af6620065701e2b8ad6c89e6.png confusion. 🙂
I do not count the last 2 that you have on the steep decline – they do not qualify for me. Those are unconfirmed swings that quickly failed and never closed above the 10 sma
That would be one long a** DCL from early Oct. till mid Dec.? But if so, I am still seeing Five DCL’s ?
Yes, VERY extended. nd yes, 5 was how I counted it. Thats what I was saying in my first reply- some people look for a dcl when it isnt there, simply because 30 days or so went by or we had a bounce for 2 or 3 days, but I wont call it s daily cycle low if it doesn’t fit the criteria. I think it is an extreme sentiment changing sell off that extends that cycle.
Are ICL’s more predictive (thus maybe a better signal) vs. DCL’s if dcl’s can extend out to unknown lengths ?
Well, an ICL starts as a dcl.
It isnt an ICL until it gets its own confirmations over time, but you do begin to see signs that it is an ICL and not just another dcl. Since an ICL is the one to buy for sure, we try to wait for a swing low confirmed as a dcl in a sell off and buy it…just in case THAT 3rd dcl proves to be the ICL in time. If it rolls over L.T. the 4th DCL could be the ICL. ( I’ll add that I often jump the gun personally, I dont always wait for complete confirmation of a dcl, I don’t always wait for the swing to cross above the 10sma, because in a sideways bottom, that can take days- but that is a proper way of allowing it to play out),
Not sure if that makes sense or not. It’d be easier to explain in person for sure.
Time “to do lunch” ay? 🙂
The current 5th (poss. 6) DCL’s in this current Cycle is throwing me off a bit but I understand: keep playing the 4th possibly the 5th dcl’s with the anticipation that it turns into an ICL……
yes please .. lunch …learn .. dinner .. learn .. party..oops i mean learn
…. repeat as often as needed
… take 2 aspirin & call me in the am ….
LOL…We finally have winter here in FL! It got down to 41 overnight and now it is about 68….bbbbrrrr! I am all layered up. Mid 70s for the next week. C’mon down Maria!
oh… I’m counting the days … T minus 13 and counting ……..
CUE peter paul & mary ….
https://youtu.be/CXTqr2ZkGn8?t=13
OH man! It got to 16 degrees (maybe lower?) over the weekend here in north alabama…..I’m ready for spring….
#notacoldlover
uhhh yeahhhh…………………………………………………………………………………………..
Lol…….Haha u joshn or did i miss a comment?
Alex, all, good morning. I took a position in LABU when it started breaking out. I see a possible AB=CD run here. Anyone have thoughts on upside? I’m thinking as high as $54
https://www.tradingview.com/chart/LABU/SJIb9jGU-LABU-IBB/
Looks good Bill
$54? AB=CD
I would say that it could get to $54, especially because these moves can extend – but I also dont usually do price projection the same way on a 3x etf as I do in the underlying ETF, because they pull back deeper than the regular ETF and may or may not not get the full c-d.
What I do is enter the trade ( LABU) and watch XBI or IBB – and when they finish their move as ab=cd, I get out.
I do that with GDXJ and JNUG for example. When GDXJ finishes an ab-cd, JNUG is dne too no matter where it is.
As a side note, c to d can fail if the sector weakens on the way higher.
Perfect, that’s the kind of feedback I can run with. #Sageadvice #HB
lol
how about somethin like thissssss ….https://www.tradingview.com/x/OK2eQefT/
#HB
how about somethin like this… #HB
https://www.tradingview.com/x/aWEW4iGT/
I could definitely see that. Nice job Maria. I am looking for $54 currently, I’ll sell if it hits, and look for another pullback or sector. #HFT #HB
This is why it pays to read the comments. Good questions, good answer. Thanks folks! *bort*
CANL – BOOM- 65%
EDXC – 22%
NAK 🙂
aghhhh! CANL is one I haven’t looked at yet! wowsers
Hey Alex….look at CNBX…does it look like it might could do what CANL just did?
It’s a nice base, riding up the 50sma.
It could, but it may or may not. Its a tricky sector
Alex, Any thoughts on TAHO? It had a strong day thurs but gave it all up and then some on higher volume Friday. Today it is underperforming as well. Is this a weak play, do you think there is a better silver miner set up to take?
It acted a bit funny, I dont like it when they break above the 50ma and drop back below it, but we’ll see i it can recover today. Many Miners sold off Friday and today, and are now recovering.
Look up the news on TAHO. Record silver production, paying a dividend in a week or so. It should be fine, I’m not sure why it is acting oddly. I think I’d give it a bit more time. It just ran from $8.30 to $11.40 or so. It’s still just a normal pull back to the 10sma so far.
http://www.marketwatch.com/story/tahoe-resources-achieves-record-silver-and-gold-production-in-2016-announces-2017-financial-and-operating-guidance-2017-01-05?siteid=bigcharts&dist=bigcharts
http://www.marketwatch.com/story/tahoe-resources-achieves-record-silver-and-gold-production-in-2016-announces-2017-financial-and-operating-guidance-2017-01-05?siteid=bigcharts&dist=bigcharts
With the merger with Lake Shore last year, and Rio Alto the previous year, Tahoe is as much a gold story as silver now. McCarthur is a solid leader… they just added Chuck Jeannes (former Goldcorp CEO) to the board. Mines are Guatemala (silver), Peru(low grade gold) and Ontario Canada (higher grade gold).
A more pure silver play is First Majestic.
Thanks GlenFidd………………..ich 🙂
Fundamentally it it solid. Have some long term I’ve been holding.
I see it’s production guidance for 2017 was disappointing.
just recvd alert on mux…flat top bo? vroom vroom….
Were sitting nice on MUX right now! Holding VALE, MUX, IAG, JNUG and GORO.. Loving the reports CF
the force is strong in her…..
now if TRX could follow suit…
I’m loaded up in TRX and I do believe that it just tagged that 50sma 2x.
Enough of that, now it’s time to move up 🙂
giddyup
Yes, club MUX is poppin’ today. Membership has its benefits.
inDeed! mommy skimmed some membership dues and is on the phone as we speak booking massages during vaca………… dang… ;o)
Remember the words of wisdom: Dont get too cute ( At least in the 1st 2 daily cycles. 🙂
J/K – Congrats on a good trade- reap the rewards
yes daddy….. but .. but … *giggle .. i needed the cash …;o) i dont believe in cc debt.. Ima pay as u go kinda gal………………………. my trading act i do skim to ‘reward’ myself for burning the candle at both ends…. this was my “trading act” not my holding…swing act …
swings remain untouched…
https://uploads.disquscdn.com/images/49ac9f1bf0f0dd4199cd1bd830f0d79ba1483a94edbb1e837e11c5a120399505.gif
Went ahead and jumped into some LXRP earlier even though it was up…..so far so good, surging ahead right now.
Miners looked a little weak at the open, and following Friday, that could have shaken some out…now an afternoon ramp up into the close would leave some behind.
except us… here in CFLand …. of course… ;o)
#FearlessLeader
https://uploads.disquscdn.com/images/5816c142fdeab6597674e751b3da646c273902f69fa30a881e1943105201166e.jpg
Oh my- where in the world did you come from?? lol
lol
8-D
The 8th dimension? 🙂
https://uploads.disquscdn.com/images/58dc1c60595d4665a6aaa99cd04a8e1a2fca2b910e81ae2b97bb98e1d511e0dd.png
I worked for Ingersoll Rand my first 10 years as an engineer in their construction and mining group. I’ll dispatch some jack hammers and dynamite, should be done by Spring!
excellent!!
Talented, Connected group we have here…………………………….. ;o)
lol- As soon as I wrote that, my DRD sold off . : – )
That’ll teach me
FYI….I researched CANL that Alex mentioned earlier today…since it was up so much….so far what I find is a lot of controversy with the person that started it, she resigned at some point – I’m finding some things that say it has dissolved as a company – so not sure what is up with this one…..papers for dissolution were filed in July but just now being put out in the system or some such….this from a place called “investorshub” where folks are saying the Colorado Sec of State shows where the papers were filed….I don’t know if any of this is true or not….don’t know anything about investorshub place….so…..if you’re interested in this one you might want to do some research…I’m assuming that the CANL I’m reading about is the same CANL that has gone up so much today…I’ll have to do more reading to see what is true and what isn’t…..the stock is up 63% today….!
hmmmmmm … so far so good tracking 1/16 bottom….. verdddddddy innnnnteressssteeeeen
https://www.tradingview.com/x/YKuYE5Cp/
We’ll hit a DCL before 13 Feb so likely you have a bit of downside before the right side of this chart. Question I, where is the near-term top? (Sure hope it wasn’t this afternoon!!)
Maria, What am I looking at her and what is its significance? Would appreciate a lesson. Thanks
hi Edward … I guess you could call it a “study” of price &time??? Not sure – I don’t have a name for it — lol but i just I like to look back on previous price movements -take a snapshot of the candles/moves and overlay them onto current candles to compare/contrast movements. It really freaks me out sometimes to see such similarities. not a prediction by ANY means.. just an FYI for myself of ‘what happened during the last impulse wave up – or corrective wave down. sorry if that’s confusing.. if it’s any consolation, I confused myself too… ;o)
for instance: here is Gold comparing last Jan16 … overlaid on this Jan17 move.
https://www.tradingview.com/x/Oazq2juB/
what the… is there realllly a 10% difference btwn JNUG/NUGT?
i was trying to wrap my head around that as well.
AEM is weAK today. That’s part of it but the juniors are particularly strong. I have many 5+% gainers. GORO up over 10%.
Nope, not anymore!! 🙁
URRE – very nice turn
It’s in my next report, as a follow up. Good potential.
been in since the 200 sma break! starter position
Yes, me too. I expect good things 🙂
sweetness……………….
CF, I think I have a good handle on GOLD and a lagger miner TGD – re-entered at .28… What do you think about TGD tho? Its been moving at a snails pace (huge float I know) but thoughts? Im up really nice on it right now with a big share position but this thing wont budge
AUMN = very disappointing right now. Must be good friends with Timmons!
yea… Ive been back in TGD since .28 with a large share size… Didnt want to sell inn the .35 range thinking we would get some continuation… Back to 32 land we go… I cant complain being up, but With the drops, i feel like we are going to fall below the 28 makr.. Looking for an exit and wait for re-entry
TGD makes it very hard not to be a cutie esp when other miners appear to much more stable.
I mentioned EDXC earlier and also in my medical Marijuana report as having the PHYTO BITES. A soft dog treat designed to help with animals that get separation anxiety, fear in thunderstorms, Hip or joint pain, etc.
Today they announced 145 % annual growth and is now up 30% today.
http://www.marketwatch.com/story/endexx-announces-145-percent-annual-revenue-growth-2017-01-09?siteid=bigcharts&dist=bigcharts
Thanks for the special report you did outlining some of these! 🙂 My EDXC is now slightly green 🙂
man…VGZ look like it’s about to bust a move?
Alex, sorry if you’ve already answered this…but what do you think about ones like EXK…? I watched it go up just to come back to break even at end of day…think I’ve watched it do that before….is it because it is trying to break out of a certain zone or is there some underlying weakness in some way? Gold still up $10, silver up by same percentage…but it can’t hold onto a gain today?
Most are selling off into the close
If you own it, just watch the 50sma. I would imagine that it should hold above that .,
Something is happening. All of my golds are in hourly pullbacks as if someone just sold a lot of GDX. Any news???
What’s with this selloff?
opportunity? ;o) jnug catapulted of that 34 on the hourly
Someone must have said something
My acct is coming back, but that was scary. Did Donald tweet something nasty again?
No nothing new from Donald since the morning.
WTF? What time heck happened? At 3PM I was looking real good. Came back after the close and everything got smashed all at once. Man, that SUCKED. I was really rolling this AM, man.
I decided to get some JNUG right before that happened…..it was me! 🙂
This is clearly a manufactured move in miners, especially in GDXJ. Gold up while miners erased all the gains from morning ?
I am not familiar with a manufactured move. My gains were cut by 75% in a flash. My gains ended down about 2/3 for what was going to me a great day. What spooked me is how it hit every stock in my account all at once. I have never seen that before. Can you explain what a manufactured move is?
Not a conspiracy theory but when big boys want to get in, they smash the price down and create artificial entry point for themselves. How come everything goes down at same time? And that too when gold moved only ~ $1?
Wow! What a shock. Like you say, all at the same time.
Everything including ETFs, miners, jr miners gave almost 2/3rd back from 3:00 pm eastern. I’ve never seen anything like this before. Perfect coordination. Literally, everything started going down at the same time. I am still scratching my head. :O
Conway said that there is no need for an independent investigation and may consider rolling back sanctions.
They won’t get much support from many Republicans on that one.
Algorithm traders at it again. Self learning programs. The guys that programmed them don’t even understand them now. Computer against computer.
Sold everything today and waiting for the next setup.
Researching another cannabis stock…OWCP – shot up 30% today – Israeli company, sublingual tablets to deliver medicine for several diseases….has another division also that I haven’t looked at – 6 month and 1 year charts….looks like was big cup and then shot up out of it today…buyers stepped in at end of day …
Thanks!
UgoGirl…..;)