
Wednesday Jan 25th
Some of our trades are running and others have paused. We’ll discuss this as we go through our market review.
.
SPX – This looks like an inverse H&S and looks to be breaking out higher. The SPX and Nasdaq did hit new highs.
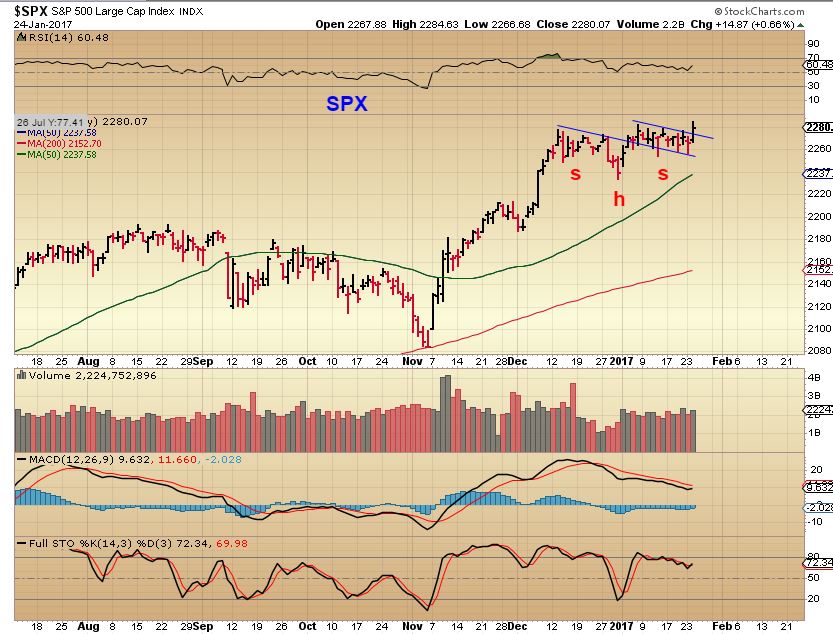
Let’s look at the Dow Jones ( Dow 20,000?)…
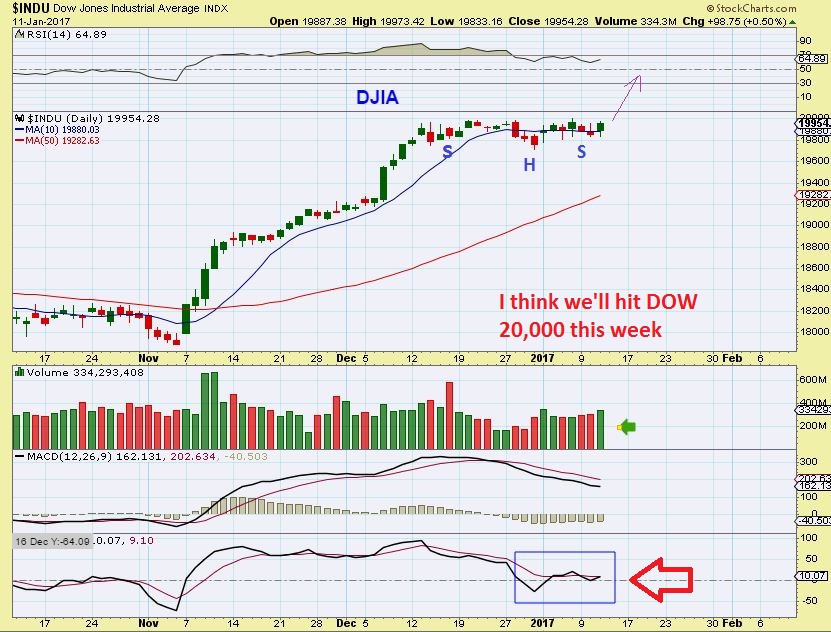
DJIA – This was Jan 11th. I thought that this set up would hit DOW 20,000 back then. I was wrong. We did not get the follow through then, but was it just a temporary Pause?
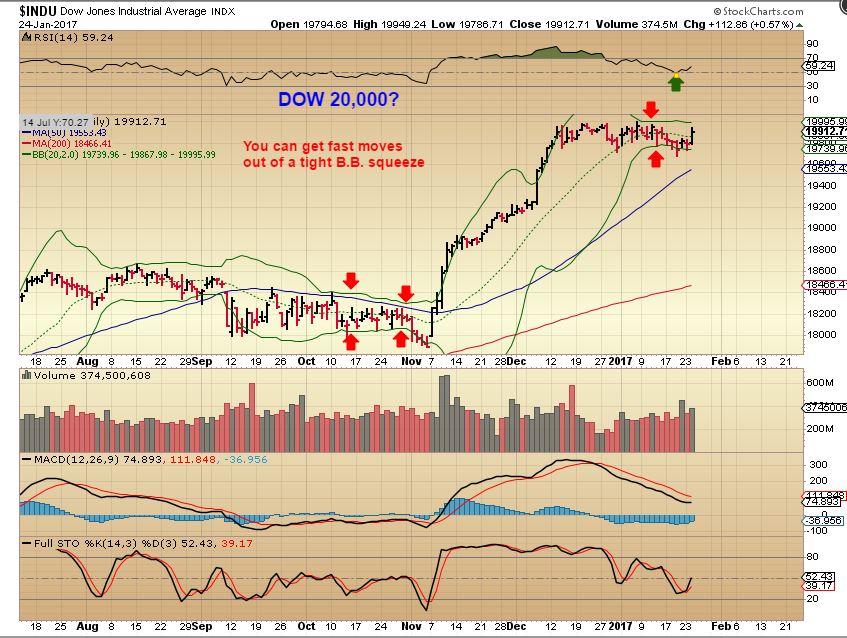
DJIA – Well, with this B.B. Squeeze we could get quite a burst higher. I think that this set up is very bullish, but we do have the VIX down a 11, so it’s tricky. A break out MIGHT BE a false break out over time, but it would be worth a try trading it with a stop below these lows and raise it as it runs higher ( For those inclined to trade the general markets). The set up just looks bullish at this point.
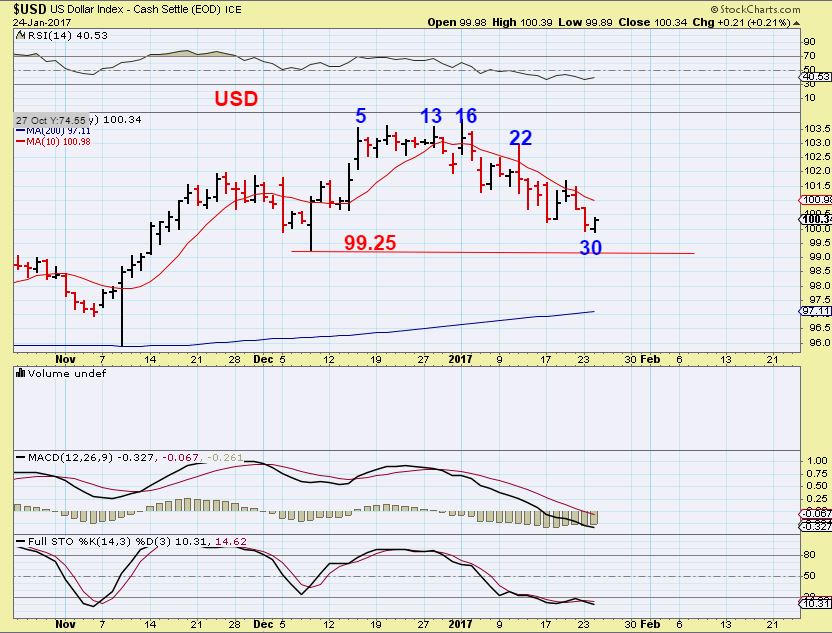
USD – We could get a swing low anywhere around here, and if so, I would imagine that we would dip down into our dcl in Gold & Miners. I’d love to see the USD drop below 99.25 over the next few days instead.
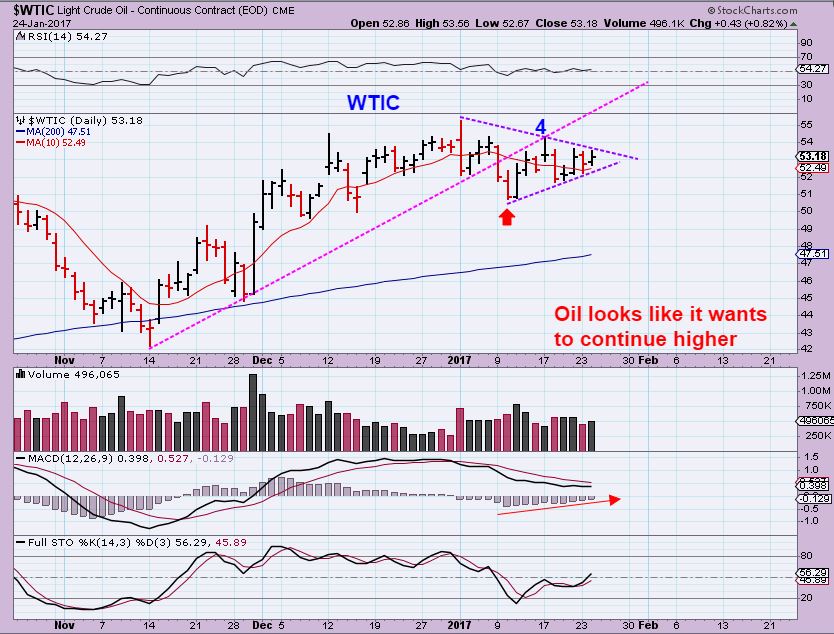
WTIC – Oil looks like it wants to break higher. Oil and the general markets have moved in sync often, so we may get a move higher in both.
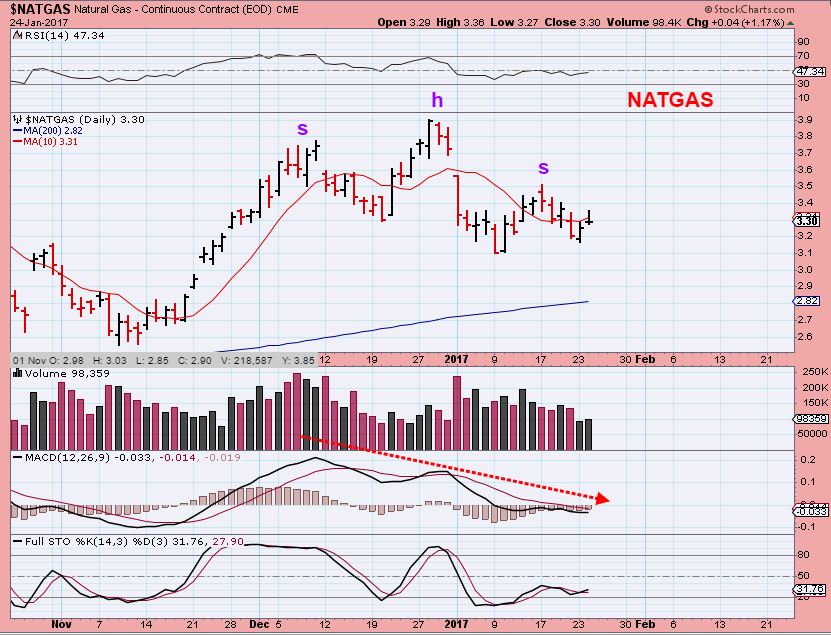
NATGAS – This looks bearish to me.
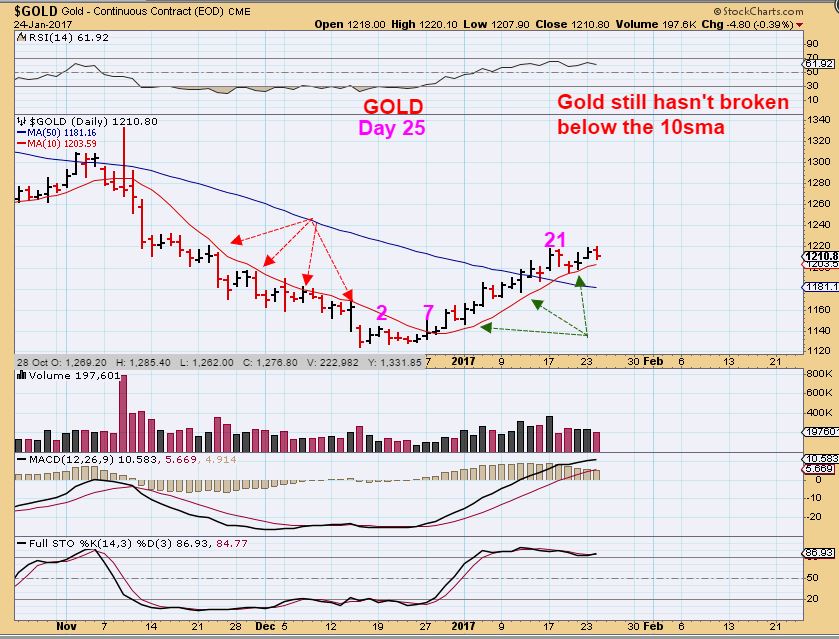
GOLD – No change at this point. Cycle wise, we anticipate a possible drop into a dcl. Technical analysis wise- this is a bullish set up and we’d expect it to continue to move higher. I’m watching the 10sma, as mentioned in prior reports.
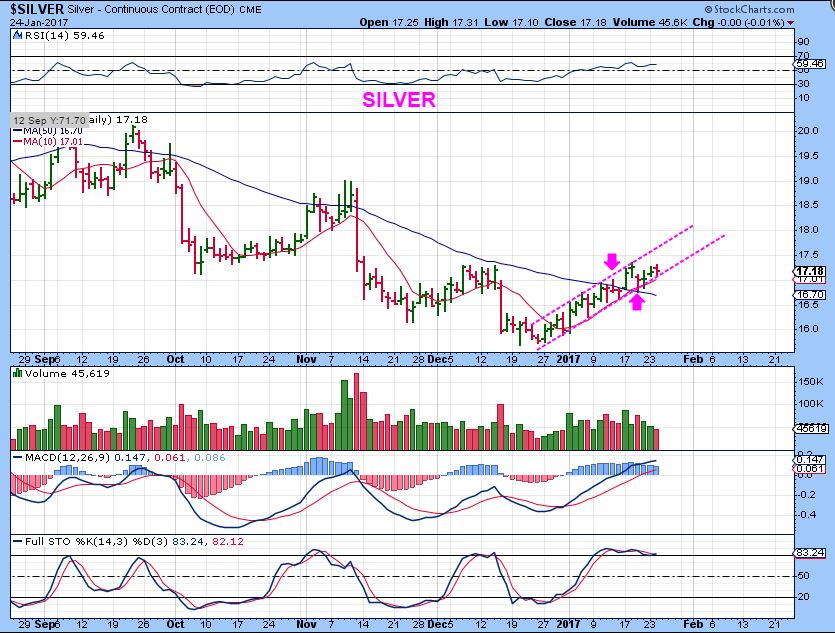
SILVER – Broke the 50sma and back tested. Remains Bullish do far.
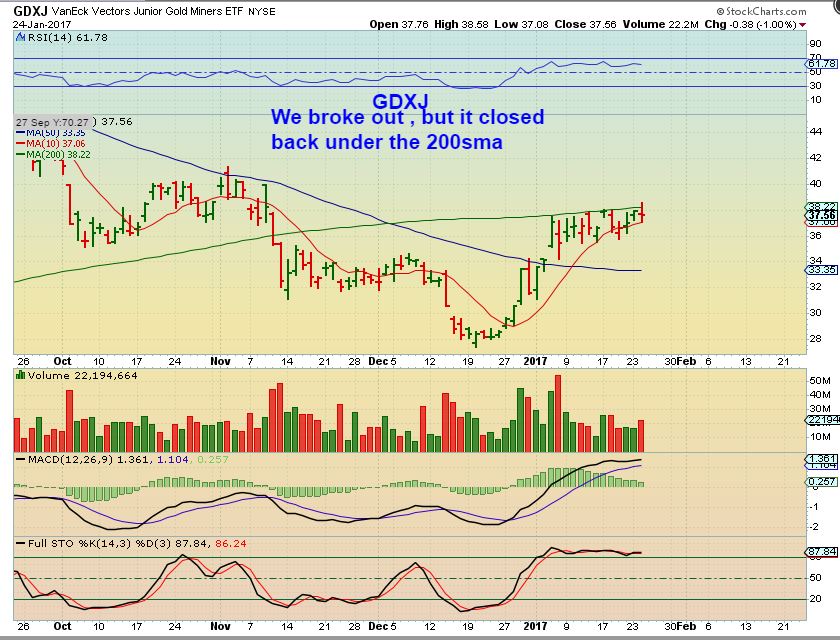
GDXJ – Still pushing against the 200sma and also holding above the 10sma ( so far). This type of squeeze action can produce a sharp move, lets hope it is higher.
.
Let’s review some trade ideas – past & present
.
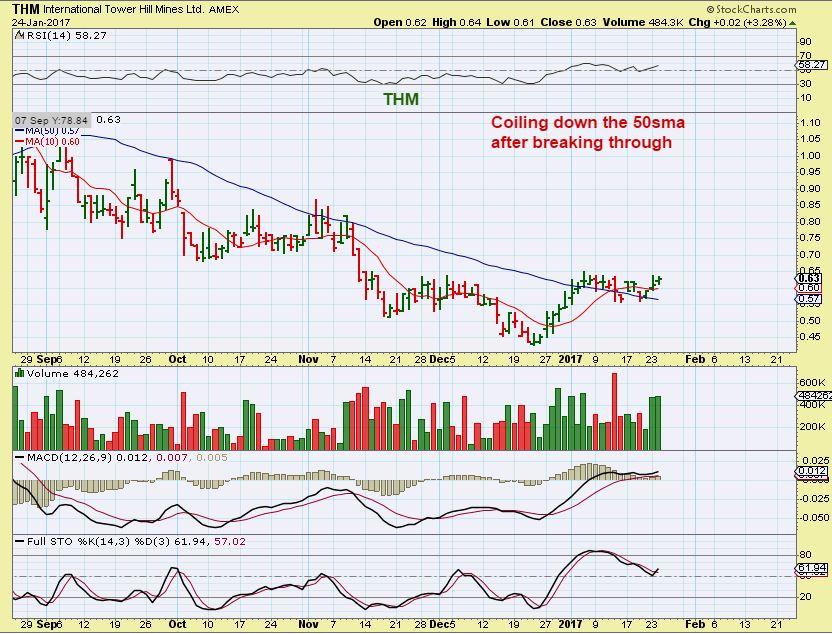
THM is a stock that looks like it wants to break out higher sooner than later. I have started accumulating it.
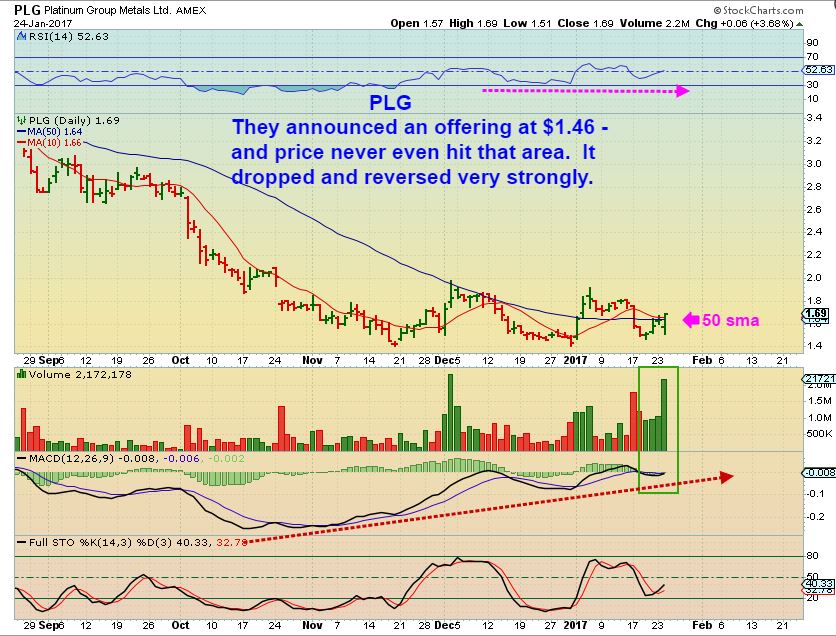
PLG – THIS GOT INTERESTING TODAY. The stock was halted as they announced an offering at $1.46. Usually price immediately drops there and digests the news for a while (see FSM, they announced one too). PLG dropped to $1.51 and reversed, closing back above the 50sma. The last ( and only other ) time I saw this happen, it happened to NAK, and I loaded the boat. I felt that investors considered it a fair price and also think that price will be higher later. We’ll see what the rest of the week brings.
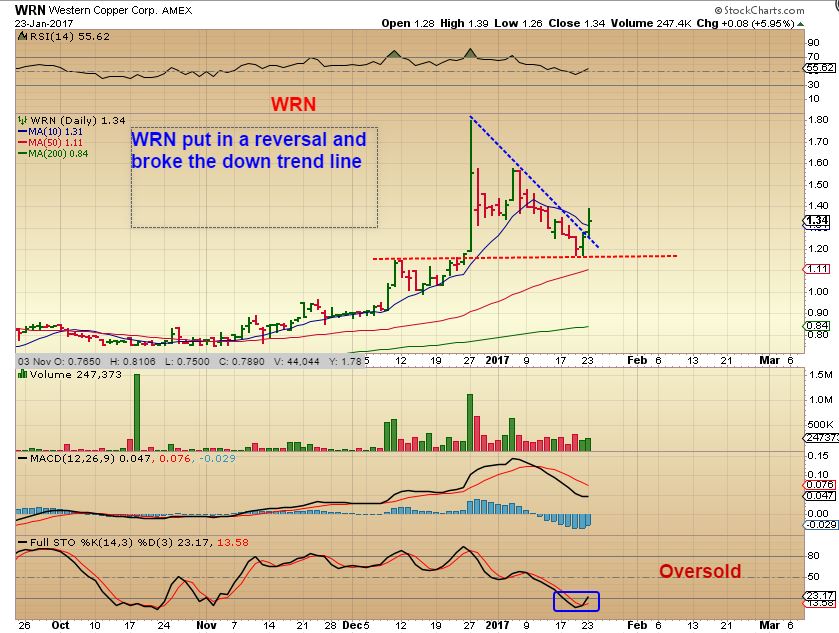
WRN From yesterdays report – a reminder. I’ll discuss this a bit more later in the report.
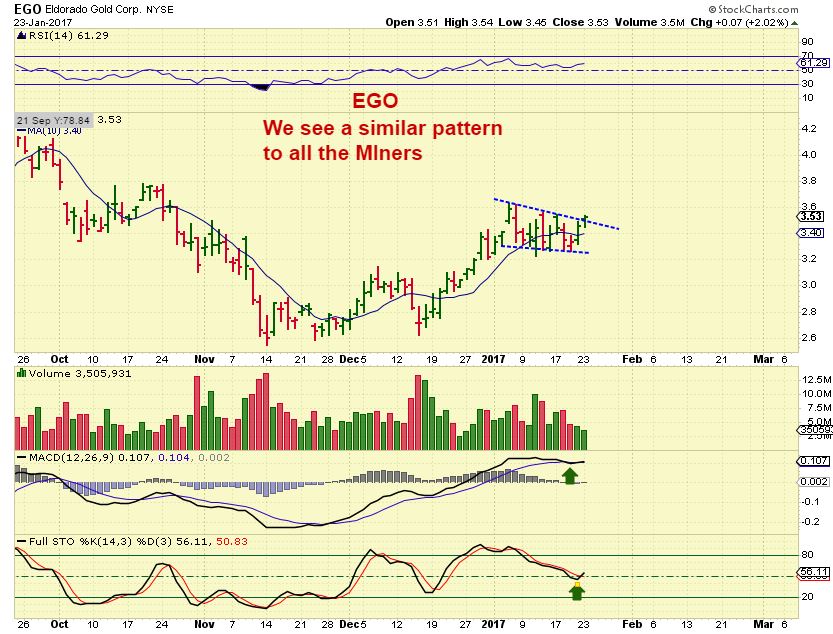
EGO – From yesterdays report, many are consolidating sideways.
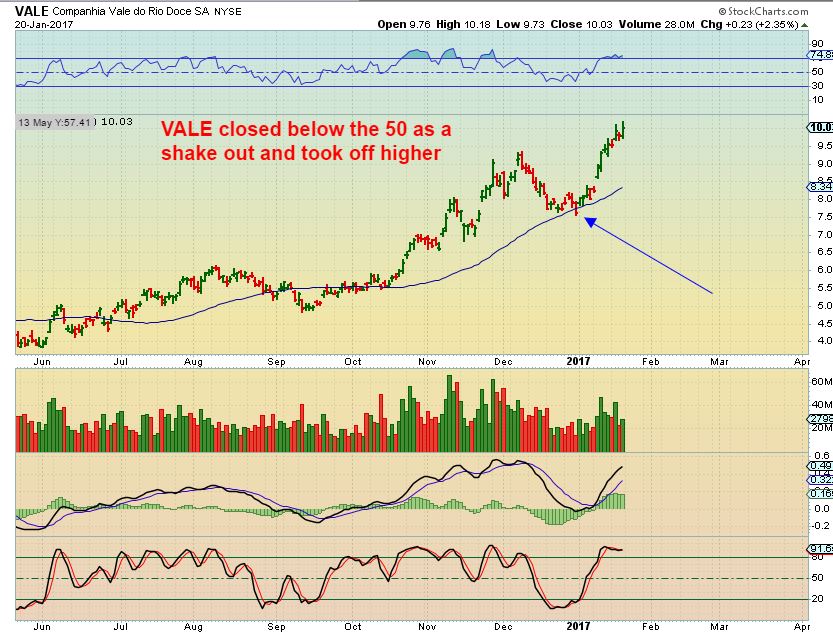
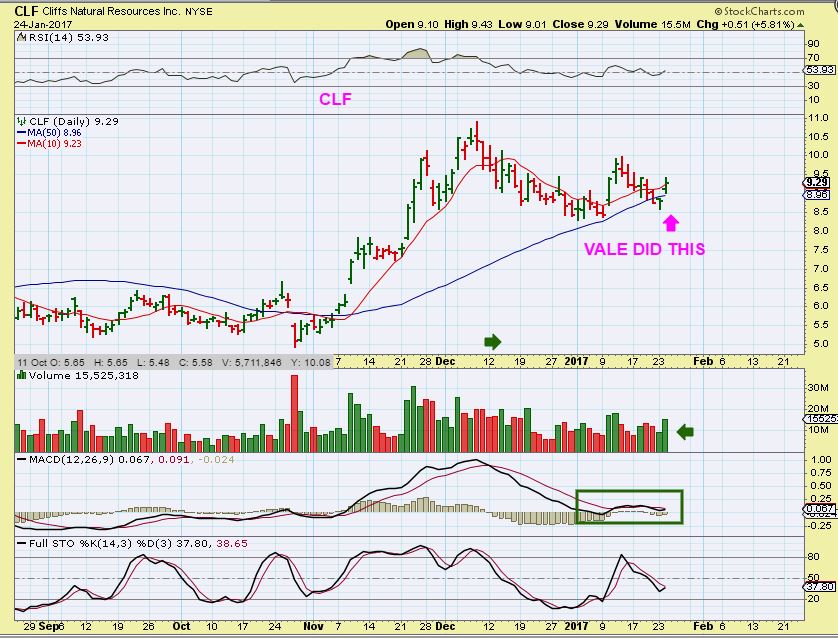
VALE – Reminder from yesterdays report, sometimes they break the 50sma as a shake out and then run higher. Vale did this. I mentioned this because CLF closed below the 50sma.
CLF recovered its 50sma ( I mentioned both CLF & AKS yesterday, and AKS gapped open and closed lower ). AKS Looks ugly but it could be a final engulfing.
The COPPER plays are running. See TGB, WRN, FCX, TGB, ETC
.
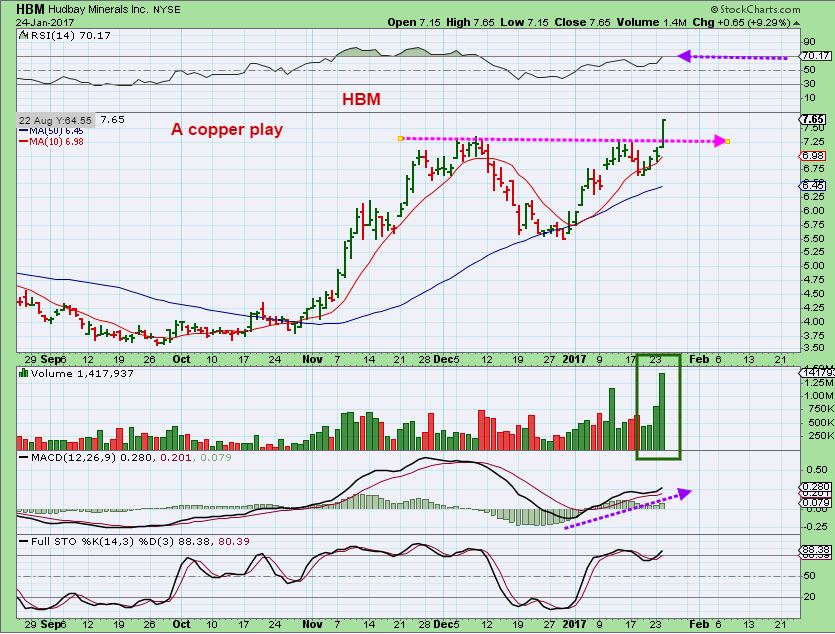
HBM – On Jan 4th I pointed out this copper stock. It also broke that 50sma, but did a perfect 50% fib pull back & reversal. It was a buy with a $9.50 target and some readers told me that they took it. Congrats, I wish that I did, because …
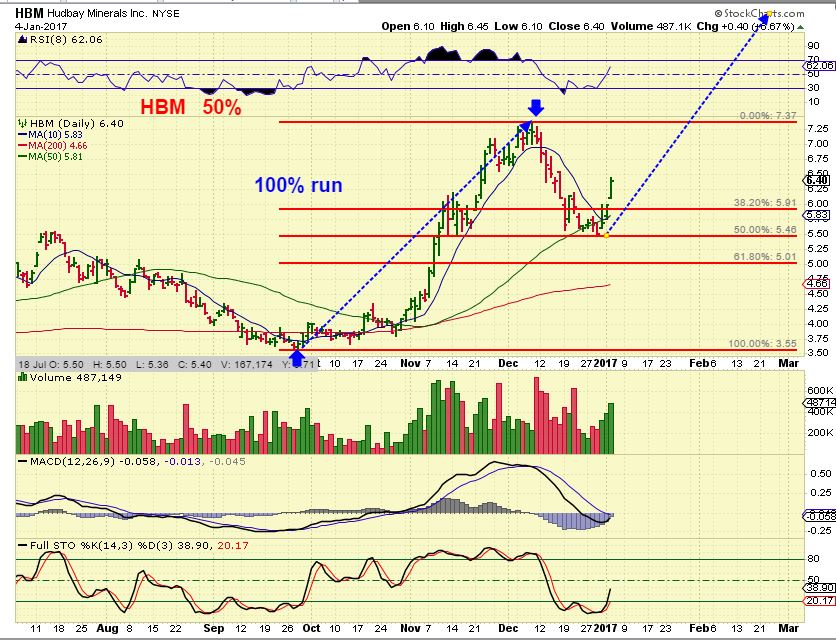
HBM – Now it’s breaking out with excellent volume. This now has a minimum target of $9.50.
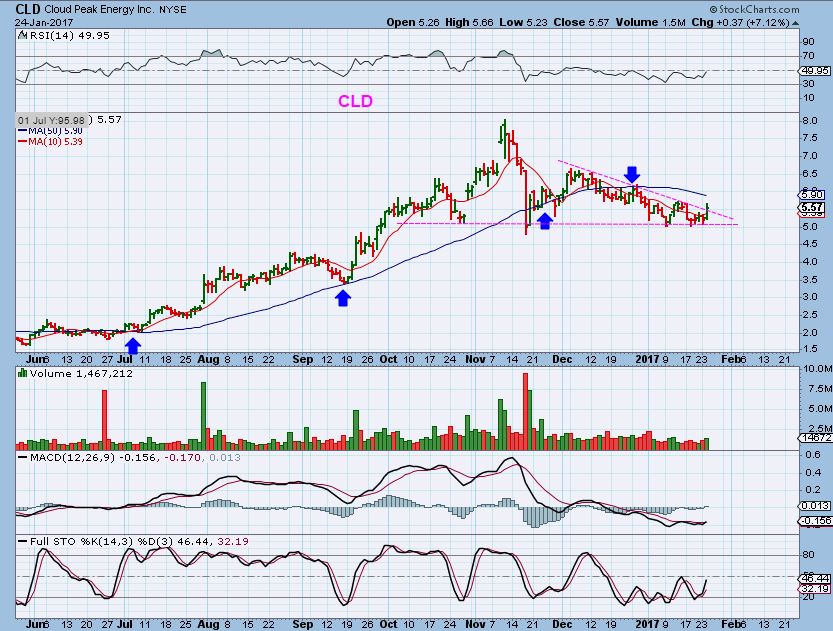
CLD – This is trying to break out too. It’s on my watchlist.
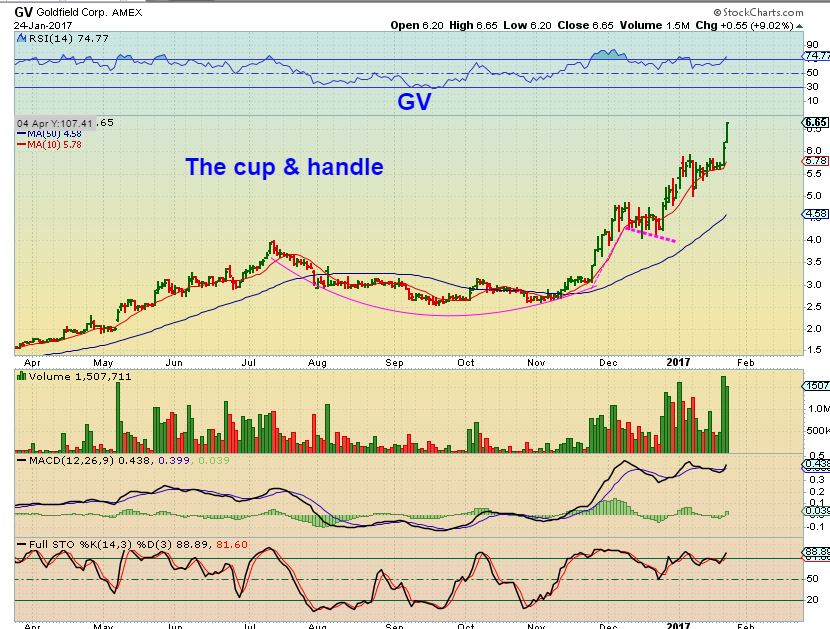
GV– Notice this CUP & HANDLE. I pointed this stock out a while back, but did not take the trade. I really like the old CUP & HANDLE, because that cup is a solid base to eventually launch from. It bores investors and the sellers bail out & move on.
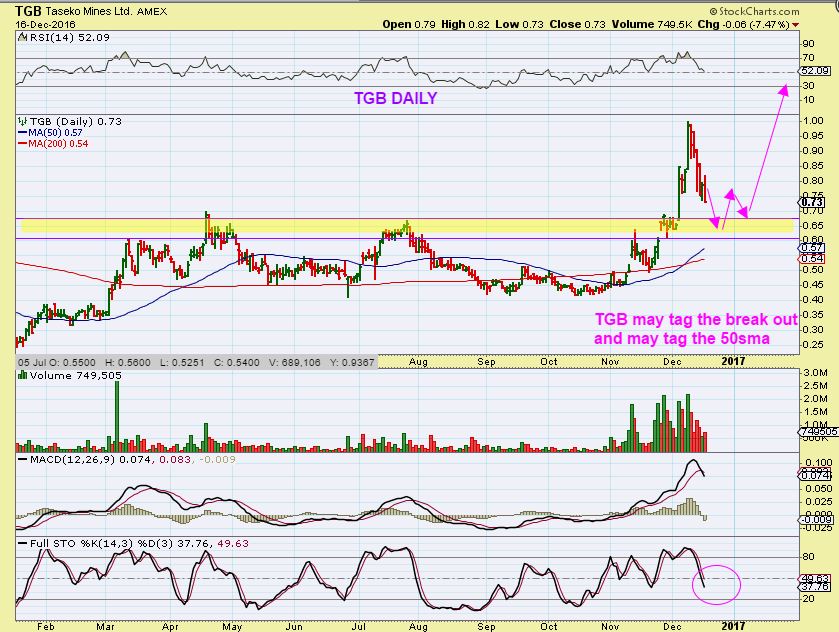
TGB was forming a cup and handle when I posted it in November and this Dec 5th chart shows that it popped in a big way. There is more…
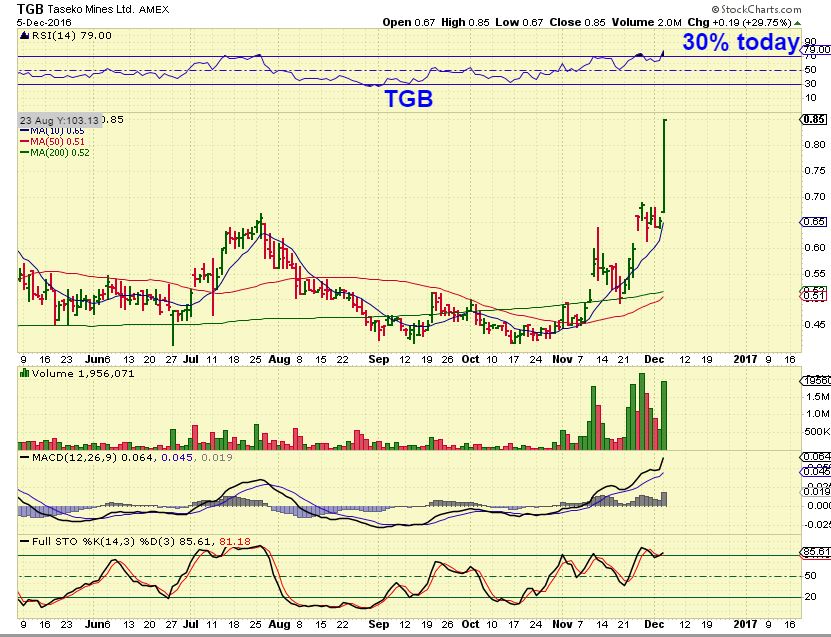
NOTICE : I pointed out that this new pop could turn into a larger handle too, in the bigger picture. It was still at 70 cents.
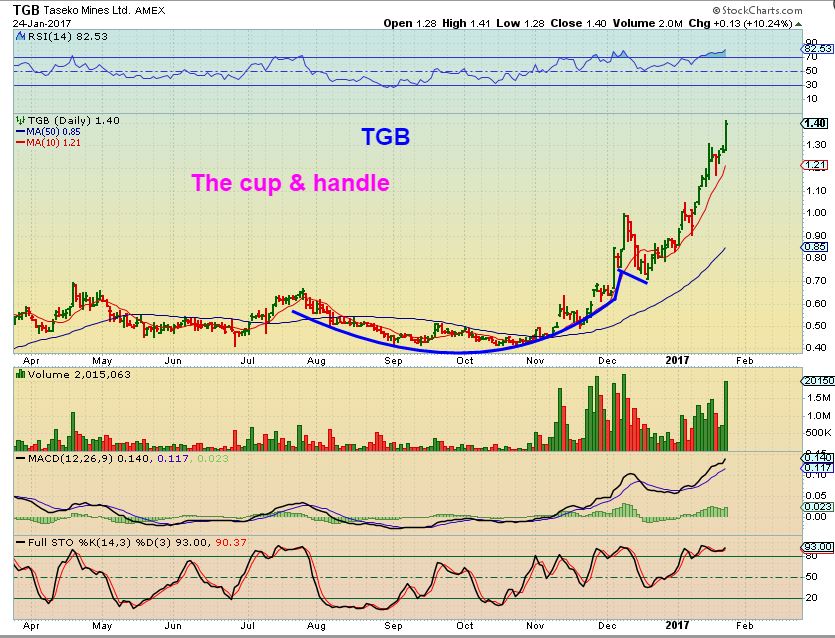
Notice TGB did form another type of cup & handle and then ran to $1.40 so far. My point? These are reliable bases and patterns.
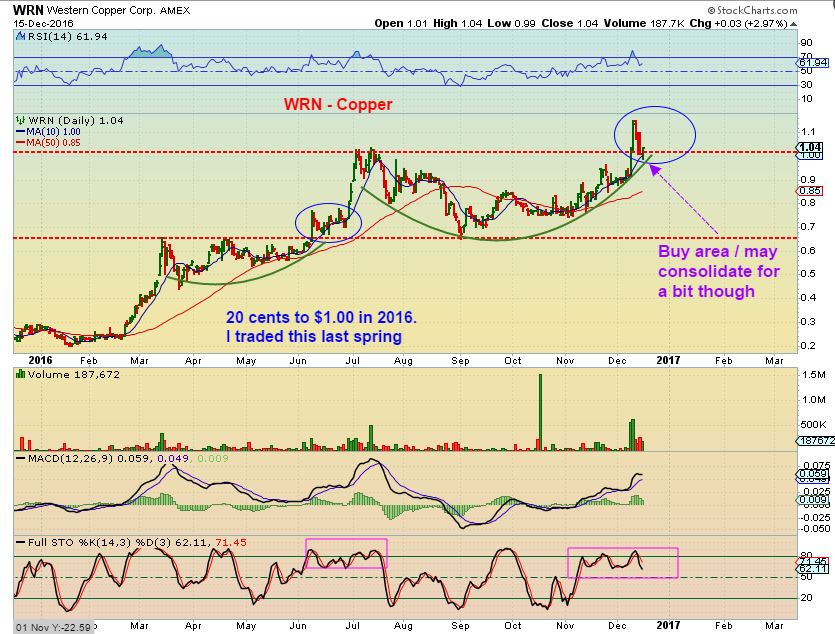
WRN– So I posted and bought this and a few other charts along the way of WRN forming a cup and handle. We accumulated it at around the $1.00 area and it Popped to $1.80 quickly…
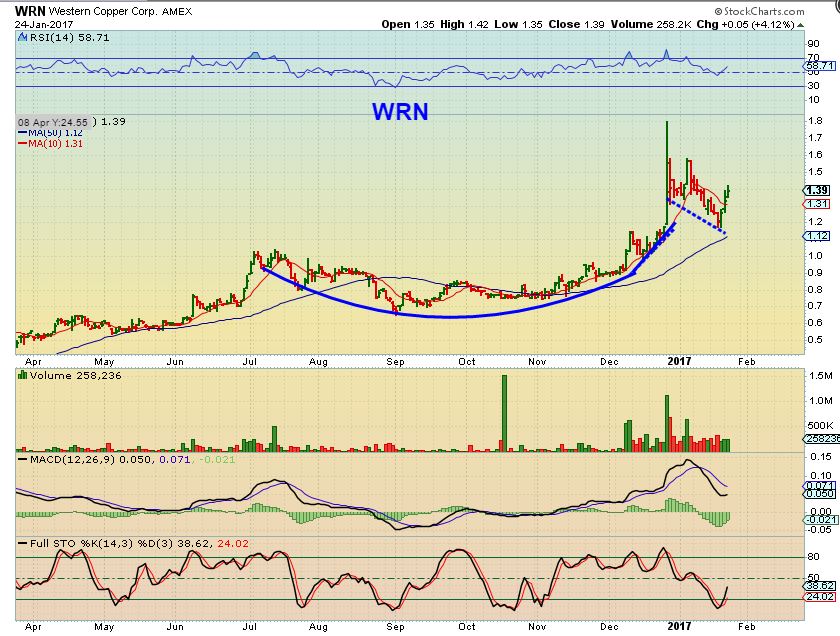
WRN – And that POP has consolidated into a possible handle of its own. This could be forming another larger handle and run the way TGB did.
AND AGAIN, THAT WAS LIKE THIS .
SO we see a lot of nice set ups forming. I like to show how some are playing out, to build confidence that others may play out that way too. Also I am still invested in Miners and monitoring GOLD & the MINERS as things play, still looking bullish in the long run here. No change at this point.
.
~ALEX
.
You can skip this part if you don’t care about NAK possibly getting into a parabolic move–
.
I do not know if NAK will go parabolic, but I pointed out that it might, so don’t get too cute and sell off your entire postion or you may get left behind. I have been asked about a possible parabolic run in NAK, and how will I sell? I don’t always know until I see what we have, but I’ll try to explain. I have been able to ride a few of these runs in the past, and you will never forget it. If you have been riding NAK from 30, 50, or 70 cents to now, it may already be that beautiful trade that you will not forget. Now let me try to address selling, and you may learn from my mistake in the past. I tried to get too cute with one trade, if you know what I mean.
.
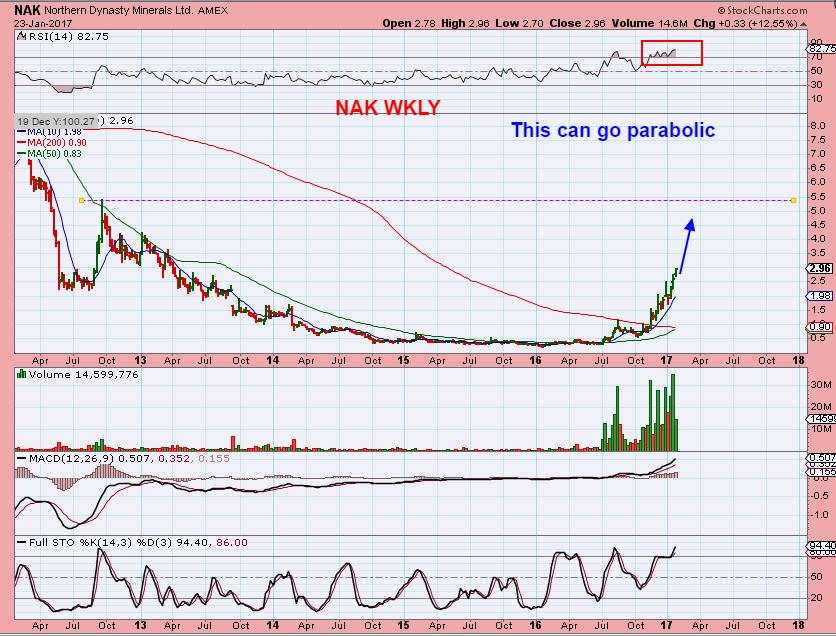
For starters: I posted these 2 charts of a possible parabolic NAK move.
.
NAK WKLY – It went from 2 weeks up, 1 week down, 2 up, 1 down and then changed into 3 weeks higher now. I was successfully trading out around 25% of my position on each top, and re-buying even more on the dips.
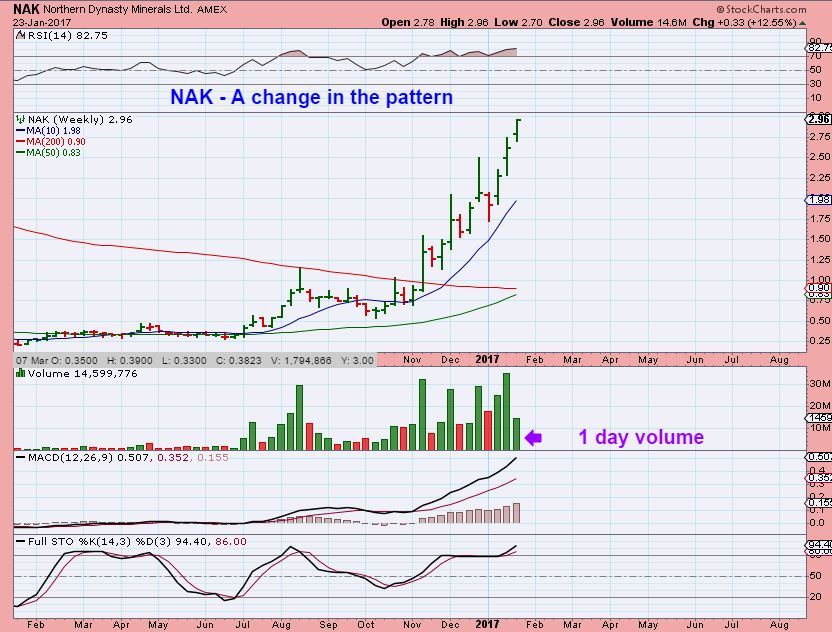
NAK – However, if this gets parabolic, it could get a bit crazy.
So I will never forget 2 parabolic trades that I rode in QTWW and PEIX in 2011. ( QTWW has since been bought out). I bought, traded, and rode these. This is where I learned the hard way, not to get too cute. I sold my entire position a few times and had to re-enter higher twice.
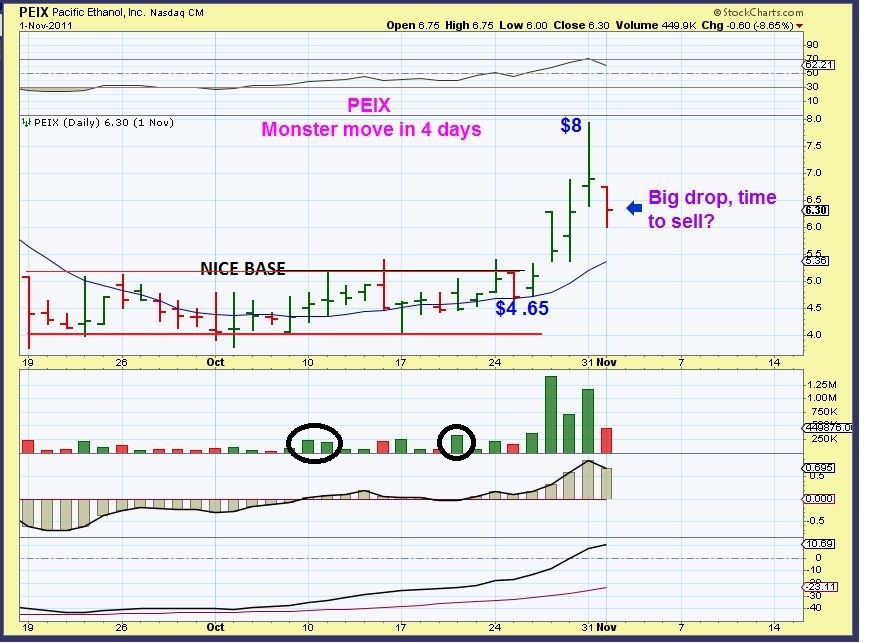
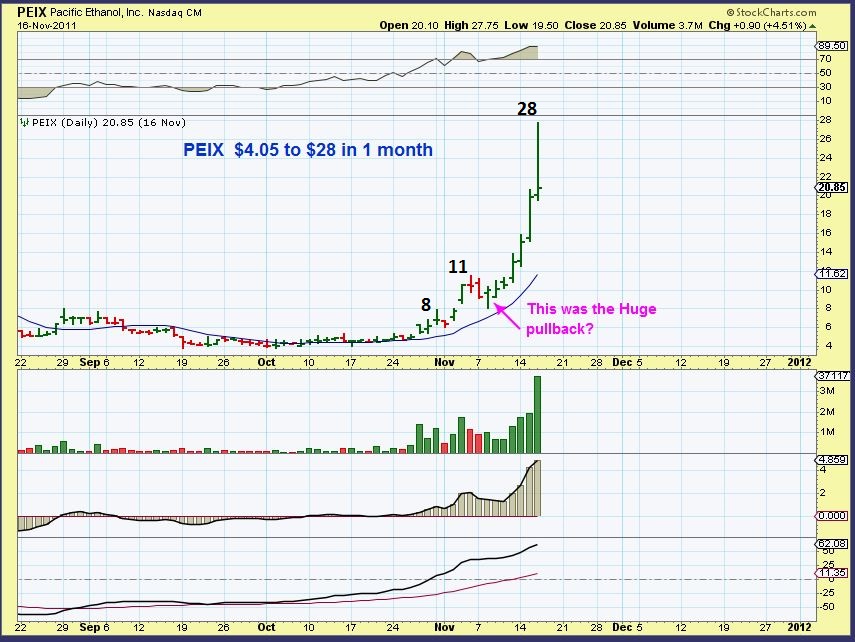
This was my PEIX trade. I CANNOT REMEMBER MY EXACT POSITION SIZE, SO THIS STORY IS ACTUALLY WHAT HAPPENED, BUT THE POSITION SIZE MIGHT HAVE BEEN SLIGHTLY DIFFERENT.
.
CHART #1 – I bought the base ( You know I love to do that when the volume pops). Notice that it moved from about $4.50 to $8 in 4 days! Let’s just say that I had grabbed 3500 shares and they almost doubled in 3 days, but then got cut in 1/2 in 1 day, as shown. I sold everything. I thought it was done rising even though volume selling was light, I was out near $6.50 or so (Nov 1st). I didn’t get my double…
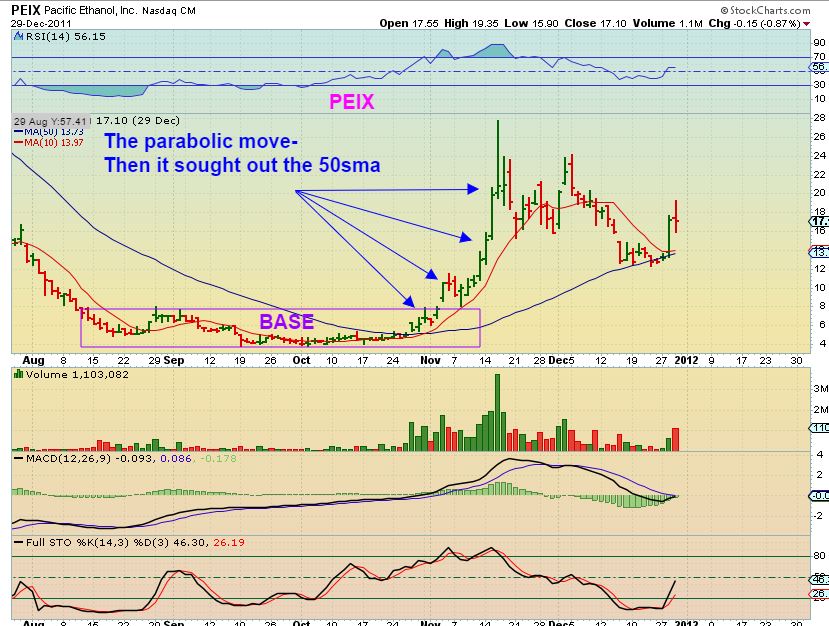
PEIX CHART #2 – The very next day you see that it gapped up from below $6.50 to almost $7! I jumped back in , buying it back higher near $7 , but now I didn’t dare to go as heavy ( Maybe now 1600 shares, less than 1/2 of what I held before). It then ran to $11 and did a reversal candle at the top as shown, so I sold it all near the close. Well, 2 days later it put in another huge reversal candle intraday, it reversed from $8 to $10!! It was acting crazy, and could go parabolic – I bought it back where I just sold it, but I was nervous because it was so jumpy. This time I bought even less shares. It was now a lot more expensive, so now I had MAYBE 800 shares. I’m thinking maybe 1/2 of the last amount.
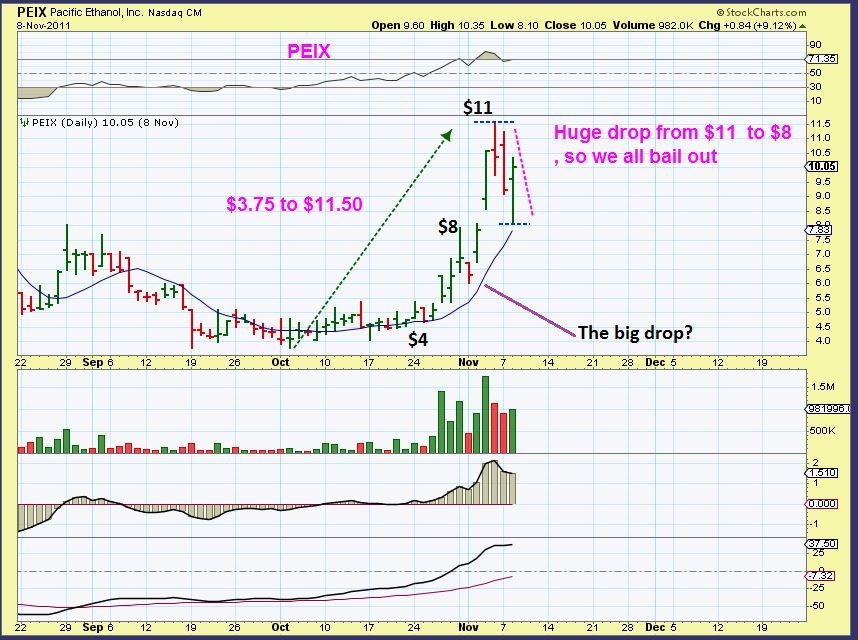
And it never looked back. Imagine if I held on to the 3500 original shares? I would have had 3500 x $28 in just a couple of weeks! A parabolic run can get whippy, and since I sold it completely a couple of times, I had to buy it back higher. I was nervous with each higher entry, so I bought less. Now it was more like 800 shares. Still a great trade, but I sold at $21. The final trade was closer to 800 shares $10 – $21, rather than 3500 shares $4.50 to $28 🙂 TRADING a parabolic run is tricky. Sitting tight may be more rewarding despite the whip saw moves, until the top comes. Easier said than done!
Yet it looks SO easy to ride in hindsight. The pull backs look quick and uneventful when you look back, real time it may be scary. There is no good answer as to when the best time to get out will be. You will NOT sell the exact top.
This is why I learned to buy & Hold coming out of the base. Buying NAK at 30 cents, 40 cents, add at 60 cents, etc makes this easier to ride now. If you bought at $2.25 it gets a bit trickier. Nak is now at $3.32 and could get a little whippy.


Thanks, Alex,
Great thought provoking article as usual!
The thing with parabolic moves is that they move quickly. Maybe writing a call option with a fraction of the money it would cost to buy the stock outright might be another way to play it?
Sure, that could be a good way to control emotions too.
Of course, not everyone here uses options, and I was mainly addressing those already in the trade asking me for selling advice… how to get out with good profits. As the price goes higher, even those calls also get expensive anticipating higher price, but it is a fraction of the initial entry and it is a way to minimize the amount of risk for anyone entering into the trade. ( If that makes sense?) 🙂
Well if you’re writing calls expensive is good. The way I see it I’m synthetically selling some shares at $4.85 and raising capital (and controlling emotional decisions to the max). If we pull back, there may be an opportunity to rebuy those calls at a fraction, or buy more shares. Only time I do this is even options are so expensive (big momentum play with massive out of the money premiums).
I always remember what my teacher taught us, who traded options daily..
” Options are like fish, the longer you hold them, the more they’ll stink. make sure you are correct ” : )
I know you are probably a good options trader, readers here should be aware of the risk though.
I’m not recommending everyone to start buying options. I don’t think selling covered calls are very risky though. It’s the only options allowed in most retirement plans for that reason. The only risk is the stock falling below your entry or it going to the moon (I’m ok with this part because I have the shares to ‘cover’ the position). Selling naked calls would be absurdly risky.
Writing covered is fairly conservative. Writing naked calls would be a different story. Thanks for sharing, hard to do on lower priced stocks so I hadn’t thought of that with NAK, thanks.
I alternated writing calls in down/consolidation times and outright buying calls on moves up in OAS late 2016 and was really able to juice my profits that way. Doubled what I would have made on stocks alone!
I’m selling covered calls on nak as a way to sell some but keep the shares. I got half of my money out by selling august 4.0 calls at .85 during the craziness yesterday. That’s another 75% move from here.
Will probably buy more shares with the proceeds on a pullback :D. Just another way to play it if you don’t mind “owning” the stock.
Or if you love owning the stock 🙂
Nice idea s by you and ZigZag, Bounce. Thanks to you both for sharing with the readers here
yeah .. mmmHmmm ……. what he said -(me shaking my head up&down w/ wide eyes) ….. you are always verrrry thought provoking…..
*oh ..& ur Charts&Analysis … greatStuff ;o)
Nak is trading at $3 in premarket, so we may see that gap fill today, and we may have even seen a temporary top.
That would lead to a buy the dip opportunity in time.
Thanks Alex. Great as always.
Thx Daz
HI Alex
Did you have any update/comment on Seadrill Ltd. You featured it a while back
Rgds
Mike
Hi Michael
It did break down below the 50sma(s) and the n did a small reversal yesterday.
On a weekly chart it is on support from the 1st week of Oct, but it is questionable.
If I owned it, I’d be ready to sell if necessary ( further drop wouldnt be good).
If I wanted to buy, I’d wait for a recovery of the 50sma.
anybody with ideas by NGD got played like whack-a-mole at eod? can’t find any news??
I see no news, but it loks ok premarket so far
thx. Lots of volume yesterday and that was a good down day…maybe another bought offering coming up??
I really wanted to highlight PLG in the report, and it just kind of ended up lost in the mix.
The chart looks really bullsih, and announcing an Offering for $1.46 and price never dropped there is kind of a big deal.
I only saw that happen in NAK.
I will be watching PLG for the rest of the week with keen interest simply because of that offering. Will it drop or hold up?? (And I do own it).
chart
https://uploads.disquscdn.com/images/0e6d08bc247c12bf48dda0b7fc8c45f0a66336c8aae29ac86d36f80d82b7ec5d.jpg
Hi Alex, small question – would you be looking exiting gold miners at this point waiting for the DCL in the context of USD making swing low? or do you have enough confidence in the gold miners in the midterm (weekly charts..) that it would be fine to hold through the DCL…more of a buy and hold strategy, not active trading. Thank you!
I’m not selling , I believe that the 2nd dail;y cycle would be greater than the first.
I trade as a trader, but in this case, we havent even broken the 10sma by day 25. That is a nice first run.
Thanks Mr. Freak, especially on the NAK info. All of a sudden I have 1/3 of my portfolio in it due to price. I have not sold a share yet. I intend to lighten up by 1/2 a little before that $5.30 Ish. tread line. Then play to somewhere under the old $21 top. We must remember gold was @ the $1900 top back then. Let us pray.
Also back then only 90m shares were outstanding vs 370m currently (including recent dilution). Math tells me that we are near $20 equivalent
Great point, I don’t know, maybe drop back 5 yards and punt? Thank you sir.
THM – Never gets much PM activity. Had a buy to 66 with 1800 in vol, then 110K in vol to bring it down to 57..
Miners (GDXJ/JNUG) are a “sell” this morning on my 15 min charts. Another BTFD opp … or the beginning of a dive into the DCL? I’m looking for a reversal in the first hour or two of trading to maintain the consolidation vs DCL theory.
Steve, if it is not proprietary what do you look at on a 15 min chart to indicate a buy or sell, indicators? Moving averages?
No problem if you don’t wish to reveal your method, I respect the effort it takes to come up with a trading methodology.
was wondering the same thing. 15 min for entry exits
It’s not a purely mechanical system, it’s a combination of signals, looking at recent chart patterns and experience watching the moves. I have developed a “feel” for what I think will happen. Please understand I SUCK at day trading, so I don’t even try to do that. But I watch the 15 min for entry and exit points. I think there is a good chance that today’s action is a buying opp rather than the beginning of a long decline based on the action I’m seeing so far. One tip I can give you is to watch the 9 EMA and 10 SMA moving averages. A cross of the 9 EMA above the 10 SMA is a “buy” and a cross below the 10 SMA is a “sell.” It’s not quite that simple but it’s a valuable signal to watch. I look at 3-minute and 5-minute charts to try and get a jump on the 15 min if I’m going to buy, but that can be very risky. Best to wait until the 15 min confirms the “buy” (UP trend). Also keep in mind that signals on a 15 min chart can flip multiple times during the day. And the 9/10 cross can give false signals, so it’s a combination of watching charts and experience. Again, it’s just something I watch and post here if/when I think it MIGHT be a “buying opp” so others can check your own charts and make your own trades, and of course, follow Alex’s advice over mine!
Thanks Steve, sometimes I do cash secured puts on a weekly option and if I can get the trend right the premium decays real fast.
Or Credit Spreads…….
I started using this too when you mentioned it a while back. I like the combo. Good tip, Steve. *bort*
Pretty cool, just created a chart. I also like using CCI indicator it will often give you good positive and negative divergences at the turns. MACD crosses seem to line up well with the changes in direction.
Right now GDXJ there is a nice positive divergence in CCI as well as the 9ema crossing the 10sma, looks like MACD wants to cross up as well.
Thanks again Steve!!!!
One more tip on using moving averages, the ANGLE of the MA’s matter. The MA’s should be angled up if you are in an UP trend … if the MA’s are flat or angled down, that is a topping signal even if the 9 EMA happens to be above the 10 SMA. As I said, the 9/10 is not a mechanical buy/sell signal it is an indicator I watch along with other things like TSI and recent chart patterns.
Alex, what are your current thoughts on CENX?
It will eventually go to $30.
Alex, what do you think of CRK?
Still my largest position. Think this move is still in the early stages. I’m speaking fundamentally.
Thanks for the input.
CRK Exchanged long term bonds for equity around 12.60 (when it the stock gets there) will create a lot of stability on the balance sheet. They’ve hedged ~30% of their natgas production at 3.30+ which gives them an extremely favorable margin. They’re in probably the most profitable region for producing natural gas (CRK & CHK are the options). CHK has done a horrible job hedging at lower prices. CHK sold some property in the region to create liquidity and that value helps prove how valuable CRK’s property is. CRK’s 2017 capex and production should blow 2016 out of the water. They also started a joint venture with another CO to drill for them. Also insider confidence and large T. Rowe Price stakes are a confidence builder.
Good Chart, improving balance sheet, increased production, management team, insider buys, improving returns.
Thanks! Great info! When I saw Alex’s concerns on NAT GAS in today’s report, I was thinking of locking in some profits….glad I didn’t!
wow ok i had no idea you thought that can you give me a quick summary of your thinking?
I like it, it is putting in a constructive consolidation- The upside potential on a weekly chart is great ( it did do a 1:5 reverse split recently, but it is a good set up).
Thanks…almost dumped this morning when I saw your chart on NATTY…but glad I held.
HBM grabbing 8$ today, great play on that CF
$9.50 minimum target too. I think that it could easily see more.
Im looking to add more, but cant seem to find where to do it – thing is a monster hahaha. And THM, we hit the 200 today
Yes, and unfortunately that was my first target, the 200sma….but with this volume, it could blow right through it soon.
Todays move is with a sell off in Gold. If Gold moves higher, it should get right through it , I would think.
In 2015, being a chart freak nerd, I drew the yellow trend line on this daily gold chart – turns out it has acted as strong support and resistance – except when slicing right thru it in Feb. ’16. If/when Gold gets decisively above 1225, sure seems like that level should hold for a long time
https://uploads.disquscdn.com/images/19ab8860a019ec44e31b36e208ec7f0d2bb82de3b2a3eaea372a7c480a5a6457.png
Heavy buying volume coming in on JNUG/GDXJ. Already a “buy” on my 5 min charts and headed that way on the 15 min chart. The BTFD guys are buying every dip, so I continue to believe that miners will rally once they break out of this sideways consolidation rather than dropping into a “DCL.” I’m not buying or selling today, I’m already “all in” on miners and just riding it out. Just posting my two cents, take it for what it’s worth and make your own trading decisions.
That’s good stuff, Steve. GDX dropped to and so far is holding it’s 10day MA.
IMO the 10 day SMA is usually a good spot to buy/add IF miners are in a bull trend. Currently GDXJ/JNUG are below their 10 and 13 day SMA’s … so would be a really good buying opp IF this move reverses.
I am hanging in there too Steve. Miners are heading up. Have to have a down period on the way up.
Trump faces the trillions of debt and obligations yet to manage and foreigners know the US$ dollar
is going down so they are selling their Treasuries off in a managed way . . . . bingo!
Thanks for the call on IPI Alex
oooh, Very nice. I hadn’t see it yet, been away today. I was hoping it would follow MON, MOS, POT, etc with some upside, and it broke that downtrend line today – Held at the 50sma…. I like that!
NAK big bounce. This thing is built like a machine
Wow Showed a low of $2.75 didn’t see it trade that low.
That was a great buying opp for NAK today, bounced off its 9 day EMA. I have a few bucks left to trade I would have bot that dip if I had been paying attention. Unfortunately, I was watching GDXJ/JNUG
yep, just like last week, that slam down was bought back.
TGB ain’t too shabby either!
IVPAF, slow and steady…didn’t even blink this morning
Good ole Ivanhoe- I lost track of that one when it changed tickers. Very nice.
Do you guys know what’s the story on WRN? Is it similar to NAK? I know they submitted assessment for permitting, back in Q3 2016. But really that’s all I know. Anyone could shed some light?
ill do some work on WRN i know nothing about it right now
Thank you sir. I did some preliminary research and couldn’t find more information. I will continue my research as well and if I know I will share the info here.
THX
Nice report Alex
Thx RG
I love the SCP.TO chart, especially the weekly. Seems like a chart Alex would like. Correct me if I’m wrong 🙂
Correct – The weekly looks pretty nice.
TLT (20 yr. bonds) Count:
Watching closely……I think the 116.50 will hold and since “I” 🙂 think bonds are correlated to the Metals currently and if my count is correct then this would be positive for the Miners.
I will be playing TLT also and buying the first tranche at the blue c to play the wave red 3. Stop will be below 116.50. (shack out possible below that level if she gets there btw) https://uploads.disquscdn.com/images/00425883fe83ac44f5e6ff0100bd41e1b29abfa35ea045a15aa0aef755c4cdff.png
2.3 % risk currently so the risk/reward is excellent, you will also get the 2.6 % annual dividend payed monthly.
I am Not in ……. yet. 😉
Great set up, Ken. Thanks
Your welcome Ed…… 😉
are u playing this with tmf ? 3 x etf – that’s how i m doing it – so if once in a while you have a chart of tnt with your ew counting – u make me happy : )
lol ok I just gotta remember to update.
I am Not playing the 3x I will be buying straight up……although I may throw in a June Call Option ?
Since the total % moves of TLT are low compared to other equities (like miners!), the implied volatility is lower. Less time premium so I love calls on TLT, they can go deeply intrinsic quickly.
That HBM was a very nice set up in Jan…….missed it though, maybe a second chance soon ?
I think CF Mentioned he added again at the 13 touch… pretty nice bounce from there
Wave 3 of 3 currently…….
I kind of think that it goes right to $10 and wont look back from there.
I may be wrong, but it recovers a break down ( 5 yr weekly) and these copper stocks are being scooped up since the trump Victory.
Aluminum all of a sudden just took off higher too ( AA, CENX)
Not complaining… I own THM.. Just odd, all miners red and THM just shruggin it off…
And of course, I sold it yesterday.
I closed 30% of it yesterday, was expecting a bid drop today like with other miners – dropped to 59 and bounced..
Wow.. Im not complaining at all right now. Finally broke that 65 wall down.. Next stop, 200 sma
We must have read the same book. Lol.
Wait a whoa whoa whoa 🙂
I recommended THM and said that I liked the way it looked and was set up….I also said that I was buying it, and you guys were selling me YOUR shares??
Lol. That wasn’t a dig at you CF. *bort bort!* My comment was a general one about my ability to buy/sell at the wrong time, not a specific comment on THM. Actually, I hadn’t owned THM since 2012 and bought today. Also got stopped out of NAK today (trailing stop) for a mere 112% gain. So, yeah, pretty much kicking ass with your help:)
No – I didnt take it that way at all- i was being funny 🙂
Ah yes, the amazing power of asynchronous text to reconstrue humor. BORT!
U were? 😉
You sure ? Well….. 😉
Just 112%? Hmm, we’ll beat that in 2017 ( woohoo!) or ( BORT BORT!)
Lots of ugly for dow 20k, AKS,CLF, FCX
FCX was up premarket after earnings report then cracked at the open. But nice recovery off of the lows. Below $16 today was an add, but missed it myself.
CF – Thoughts on PRKR? Got a nice base it looks to be breaking from.. Thought Id share with the Crew here
Not sure what to make of CLF. “Fake a move to make a move” or just plain weak? I guess we’ll see how we close.
Volume is steep for CLF on this one day sell off
Yes. i cut it.
I’m giving it a little more room but one more moderate down day and I’ll be stopped out.
That volume is a tad heavy, but MAYBE a gap fill.
Alex, how bout a French Curve for NAK . . . .. . wowee for those who hold it . . . .
Hi Alex & All.
If gold closes around this price, it looks like price is on its way to find the DCL. Remember that DC#2 is the one to ride hard as it is almost always the one where price makes its largest progression. Don’t let today and the next few sessions spook you. All is well.
Even in a bear market sell off, we often see a great 2nd daily cycle.
I agree Rob – Nice to hear from you again. I’m using the ICHI too ; – )
Away from computer most of day so haven’t been able to keep up with comments…but…just checked in on one of the cannabis stocks…CBIS….report out today that they sold out of the inhaler they just released as a test run…..helps with breathing issues related to cancer, COPD, etc. (I think….have to read more…) – so they are ramping up production since they didn’t expect to sell out like they did….just FYI for anyone following some of these…
And EDXC : )
Ah! Hadn’t seen that yet! Geez, it’s been a crazy day in my world today, haven’t been able to hardly look at a computer…..:(
Me too actually- I was gone all day until about 2 eastern time. I was just using my phone once in a while,
Crazy how much happens in a day 🙂
Yes, feel like I’m totally missing some moves right now with being occupied at work…:(….next 2 days will be crazy as well but at least I hope I’ll be nearer a computer…..
CF – Currently holding quite a few of our plays here including HBM – Im dying to add more but a pullback isnt looking likely…
HBM should be a straight line move to $9.50
internals looks strong again, we haven’t had this many highs since beginning of Dec 2016
THM chowing down today – great alert CF
This is one I have had for awhile and was red…I bought more this morning after the report to cost average down…still red, but less so. Go THM! [and all my other laggers]
I sold 30% yesterday expecting a drop due to gold.. but when it bounced, I added more at 61. not to shabby right now. Although I wish my position was larger than 2k shares.
It hit the 200sma and stopped right there today, but I believe that it is just getting going. After all, GOLD is selling off today and this one is very strong looking.
THM great call.. i didn’t add.. since i own a lot of it… Forget the guys name but big HEdge fund (John somthing )owns like 20% or more.
my partial sell didnt fill at 74 which is odd as it hit 75… Not trying to be a cutie but was trying to secure some profit
Yes, I think you are thinking of John Paulson – I believe he funded them recently.
I saw the chart 3 days ago and ran 2 of my private indicators on it, and it said ” Ready to pop” 🙂
I believe Uranium may have put in a Wave (1) top. Corrective Wave 2 starting very soon.
I think so too
After lingering near the lows most of the day, miners starting to show some life. Would love to see strong buying in the last 30-60 minutes of trading, like yesterday. As of right now, about an hour to the close, my 15 min charts for GDXJ/JNUG are a “buy” … come on guys, BTFD! LOL
Thanks for the update Steve!
I can see it clearly now!
The biggest lesson I have learned (the hard way) is to trust my charts (and Alex, of course) and look at the big picture. In the “old days” I probably would have panicked out near the LOD today. But instead, I held tough and was rewarded with an EOD reversal. Bears can’t seem to hold the miners down for long.
Agree Steve- the selling has been light volume and then it bounces off of the lows, or recovers 10 /13 sma.
So far so good
You da man Alex! I foolishly avoided the PM sector last year, but now I’m back on the bucking bull!
Yes, your account will be rewarded if this thing acts anything like last year !
And by the way- I can see that you are enjoying the ride more than in the past when we traded together
nice job
As I told you recentlyI have learned a LOT since the old days back in our private trading forum. As you may recall, I always got nervous “watching the wiggles” and made some dumb trading mistakes. LOL
The biggest change I have made is develop my own charting system to compliment input from trading services like this. I’m much more comfortable when my charts match up with yours!
We all do until we get enough experience to see that the sell offs get bought back at times, etc.
Your moving averages intraday ( 15 min charts) has added confidence to the way you see sell offs now. That will pay off if it keeps you in the trade during bull runs
Yep! Most of the mistakes I make is getting emotional or scared and selling out, buying high without consulting the chart first. Def been there!
One you mentioned middle of last year that looks great on a weekly: TK
Yes, it does…Shippers – I was looking at SB, NM, DCIX, TNK, and more . Shippers wee perking up.
I just bought a shipper last week, and sold it today for a loss ( DCIX) : )
oh well, I’ll find SOMETHING better to do with the left over cash -lol
TDW, and NMM (you might like NMM) got a saucer forming
I tried DRYS yesterday and caught a 10% bounce before stopped out at my entry. Worthless stock & company, but man those miracle pops were tempting. Deleted it from my watchlist 😀
I was watching that, thinking it could bounce to $10 – crazy .
Today GDXJ recovered the 10day MA before the close – and GDX never lost it. Hope springs eternal
That it does Cal – They seem to be accumulating on the sell offs
“They”?
Yes, so buying at each mornings lows and slowly accumulating seems to be a great tactic that will work right now. Just add a little bit at each dip and in a few weeks? Boom!
WG & HK – Booom with Oil down
And NADL , CDTI, TPLM, EMES, ANW and quite a few more look bullish today
Alex, hats off to you on this report. B/c of your lesson on parabolas I decided to experiment with NAK. I know it was a lot of luck but got filled with a limit order (since I can’t watch the screen all day) $0.01 from the bottom today only to see it shoot back up! Like I said it was an experiment so only enough to pay for a big mac but it was a great lesson in trading that I would have never been able to implement before this. So thx!
Sweet! You could have bought a big mac, and instead you bought our Big NAK!
I was experimenting with that PEIX trade when I was trading it too. I had ridden parabolic moves a little bit before, but this one always stands out in my mind, because I was a bit jumpy and nervously sold on the way down rather than sell on the way up and buy on the way down. Until it ramped up above $10 it just kept on going.
I don’t know if NAK is going to go parabolic, but the sell offs are all being scooped up, and congrats on that grab today. That was quite a trick!! Glad the report helped.
can you shed some light on this?
I am leaving right now, so I’m out of time right now, but not sure what you are asking.
I explained that trade at the end of todays report, if you havent had a chance to read it yet?
I think I typed that in the wrong box haha disregard CF! and thanks!
Nice work, Don’t! I should have added. I didn’t expect it to pull together from this morning so quickly. I still have a bit I’m riding, though.
No news on THM again, but look at todays volume. SOMEONE KNOWS SOMETHING. I bet You’ll see the news later.
Watching ADAP, NMM, TDW and PRKR (liking this one a lot) – looking to add to HBM and TGB, but feel like im chasing at this point
AGI news: .Alamos Gold (NYSE:AGI) -4.3% AH after announcing a bought deal financing of 31.45M common shares at $7.95/share for ~$250M in proceeds, with an underwriters option to purchase up to an additional ~4.7M shares.
AGI says it plans to use the proceeds to help repay all of its outstanding US$315M senior secured 7.75% high yield notes maturing 2020.
AGI says it will be debt-free upon completion of the offering, with ~US$200M in cash and US$350M in available liquidity
go ken….;)
very nice Ken
You mean CENX, TGB, WRN, CX, GV, etc wasnt a part of it ? LOL
That train isnt at the station anymore
Time to get on at the first stop then I guess. 😉
In “hindsight ” the infrastructure train left the day after Trump’s nomination to be honest, I just was not sure Trump was going to follow thru on his pre election policies but the past 5 days is enough proof for me he will try to follow thru.
Yes those stocks are part of it for sure and should be part of the list, I am more leaning towards more long term diversity in blue chip construction, equipment, materials etc. in the US….. ??
To your question: Do you feel it is too late ?
Yes, it surely did take off with gusto when the election results came out.
To your question: Not too late at all. Though many are getting extended from the November Trump rally. When you said “time to jump aboard the infrastructure train” – Timing is the key. We’ve been buying pull backs in metals, and some stocks like GV, GMO, TGB, and others we have already been on board. Might be time to sell some and buy the dip.
Big Picture….years of gains ahead, and most bottomed last January/ February when we caught the lows here in CLF, VALE, HBM, FCX, X, CENX, etc.
The charts for commodities were screaming bottom. 🙂
Even CAT / BOOM etc bottomed in Jan / Feb. 2016 was a great year, 2017 looks to be setting up the same way.
I am certainly not stating you/we were Not part of the commodity price increases the past year or so, I am looking for more diversification in the US infrastructure growth…..long term.
Timing of course is always the key to any stock/etf/commodity/sector purchase….I.E.:
I am struggling with when to enter the MM sector, if Sessions is voted in soon he will Not pro MM so …… ?
Maybe it is best if I just let it go…….which I have no problem doing.
I’mma gonna send a letter to my senator bout marijuana…:)
Well….couldn’t hurt. 🙂
That sector will certainly have growth in the future, just not sure of the timing or vehicle to use presently.
Please don’t stop the research Tammie it is very valuable to us all….thank you for doing so.
Thanks, Ken! I won’t stop! 🙂 I think it has great potential in the next few years….like you said, figuring out timing and vehicle…..challenging! 🙂
It is challenging. Probably why I enjoy it so much. Lol
Ya, me too! Actually, I love being able to pop into one in a day and sell same day up 15-20%….doesn’t always happen but on these sometimes the charts are set up so nicely……but there can always be surprises……that’s why I try and watch the news on them every day if possible….a least on the ones I’m following at any given moment…it’s been good practice for me anyway. So far I can figure these out a lot better than gold…..
Go get em Tammie !!! 😉
https://uploads.disquscdn.com/images/7bd3fff54dbf19073cc6361d0ba5864acffe2e22ec176ea2b518b2ab3a8e901c.png
Lol……
Good night ya all. Till tomorrow….
Nite!
I look forward to your list tomorrow –
so far the MM stock charts are bullish
What does MM stand for? Marijuana….M?
medical m
OH yeah, hahaha 🙂 🙂 Duh…little behind the curve today…
Yes true…..over bought actually imo.
Look at CVSI….could be ready to pop? maybe….
CF, I remember we traded IPI a while back. Looks like it could be poppin’ again here. What say you? *bort*
Yes, I think we talked about it yesterday and earlier today ( Scroll down to earlier comments today ) , it is in tomorrow mornings report.
Really loving the set up on NMM right now… Any thoughts? Looks like a great base and starting to break out above the MAs
Charts all marked up – Report is pretty much done, just need to proof read in the a.m. and fine tune
long day, pretty tired, going to bed. G-NIte all!
The new report has been released