JANUARY 11 – COPY / PASTE
As I was gathering charts for the report, I realized that many of the charts for Tuesday looked just like Mondays. That means there really isn’t a whole lot new to say in some sectors, so let’s do our review and then discuss some stock picks.
.
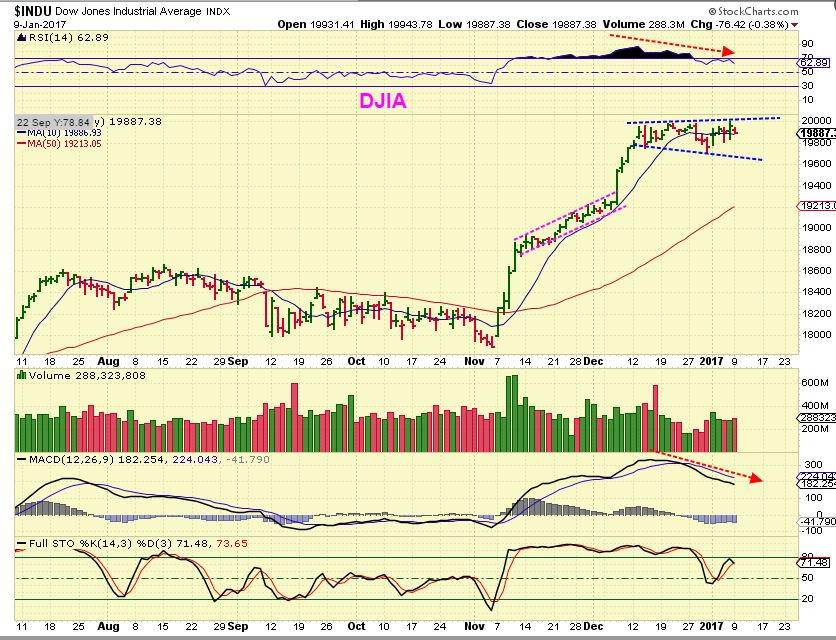
From Monday – no Dow 20,000
No big change – Copy / Past

USD MONDAY – bottoming (Dcl) near the 50sma?
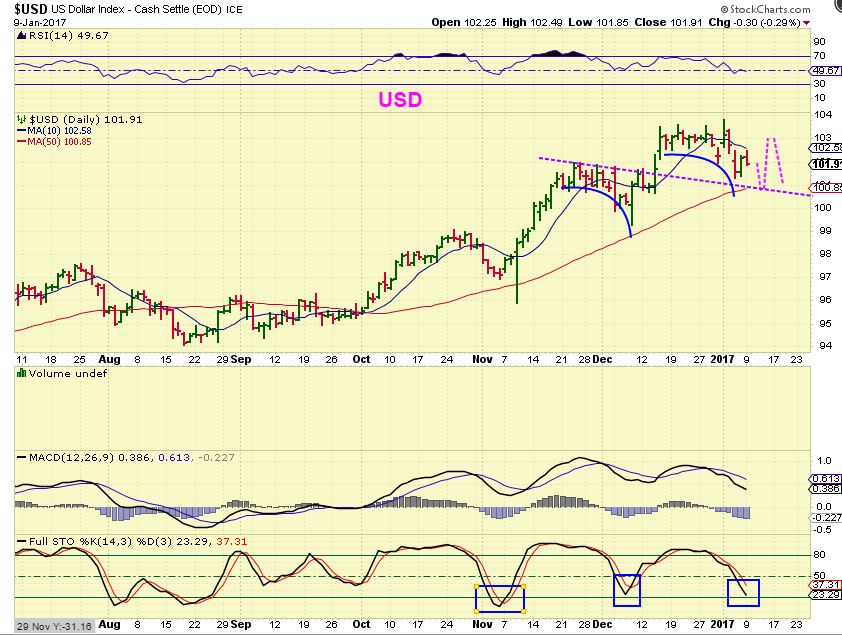
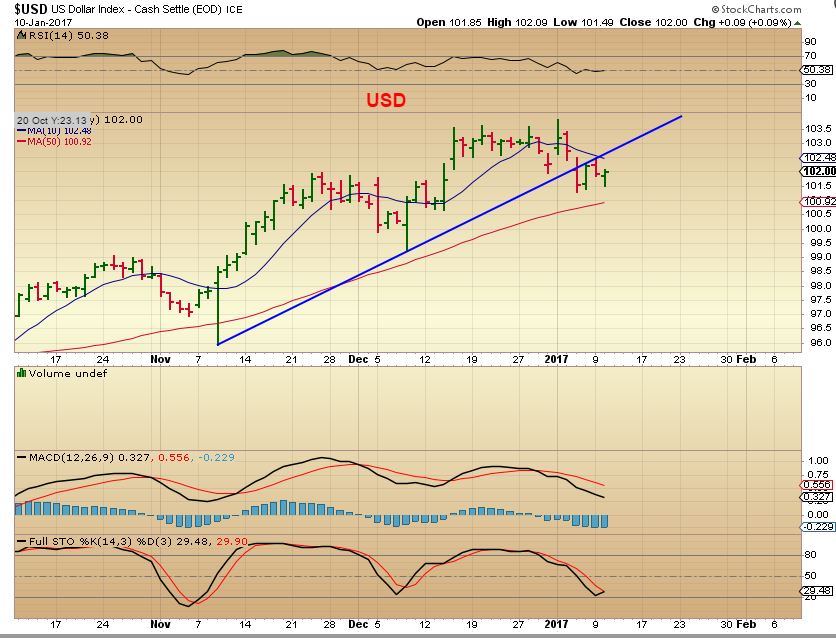
USD – Bottoming ( Dcl) near the 50sma? This could bring about our dcl in Gold.
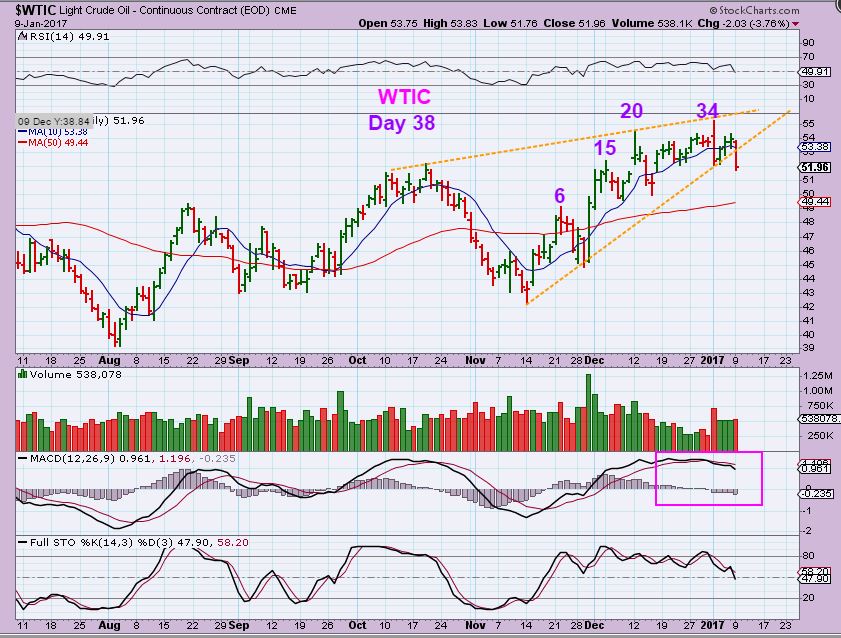
WTIC Monday – Breaks the trend line and starts a drop into a dcl.
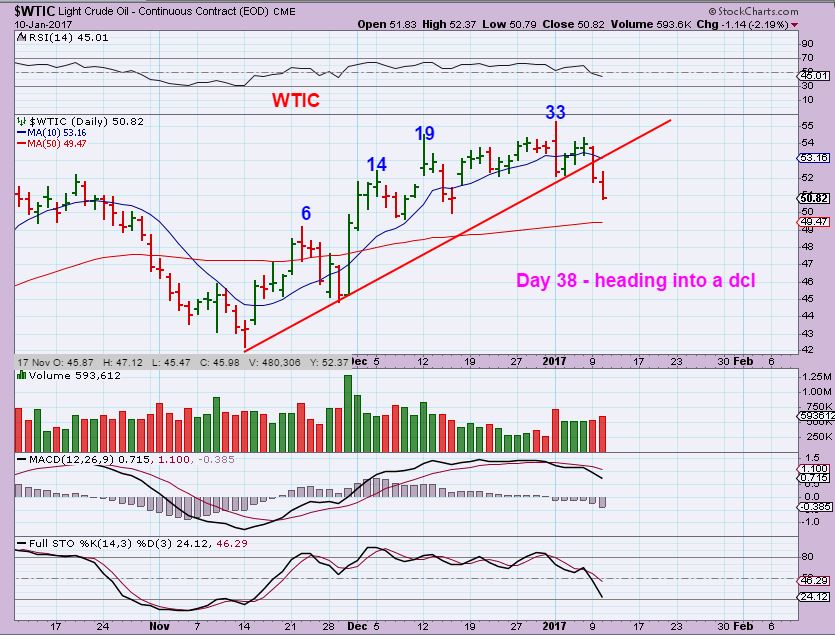
WTIC Tuesday – Now on day 38. I noticed that my count went off by a day on Mondays chart, other than that? Copy / Paste . Drop to a dcl, watching the 50sma. We had a very right translated daily cycle, so I should expect a break to new highs. Due for an ICL soon, it may be a false break and roll over by day 10 or so, si I will be watching for and expecting that.
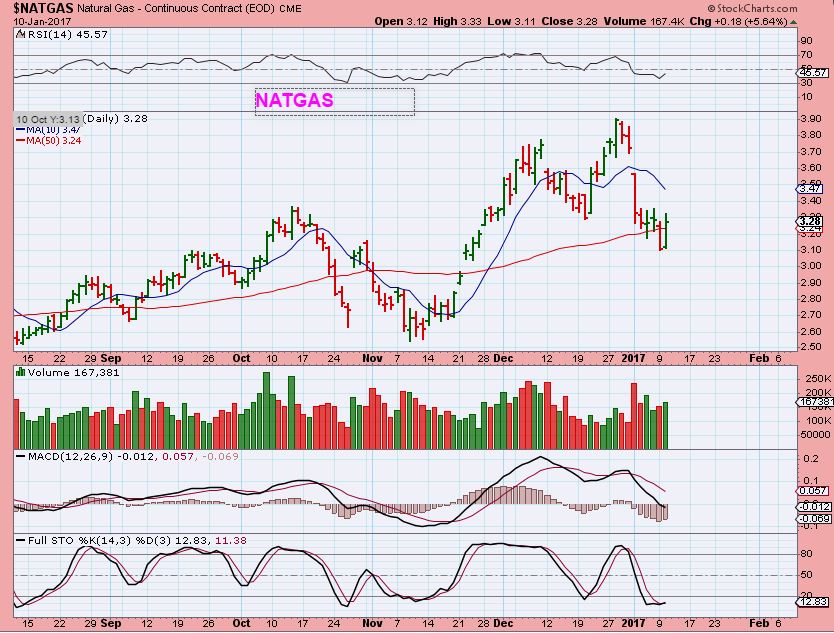
NATGAS – This one changed. We had a reversal and possible shake out at the 50sma.
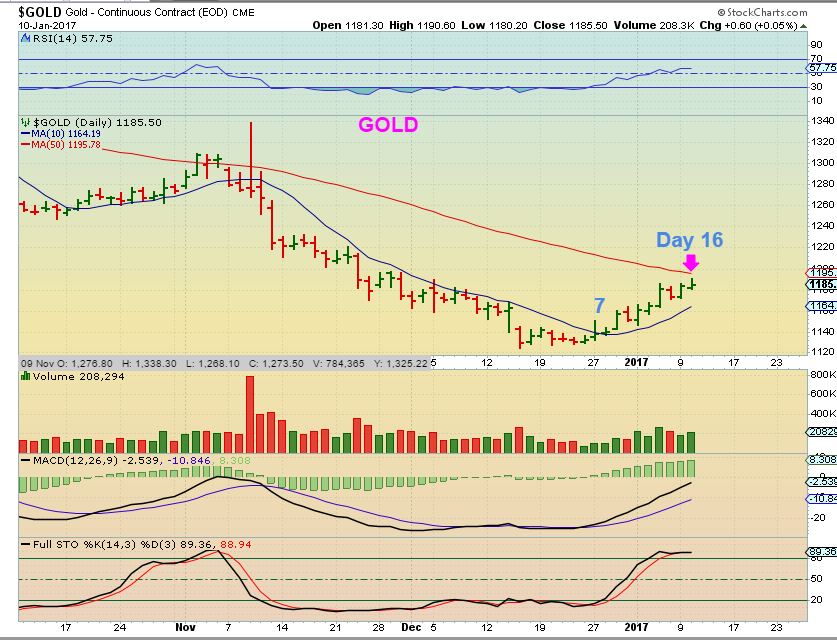
This was my chart of GOLD recently, pointing out that a run from the lows to around 1200 was in the cards for the 1st daily cycle. Note the Magenta line and the the 50sma is there.
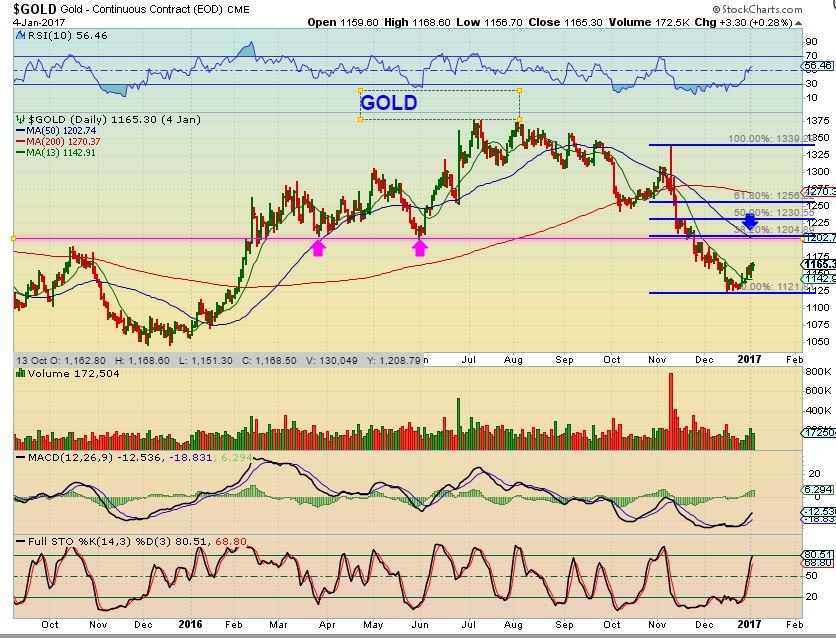
GOLD – Day 16 and we are at the 50sma area. This is a possible resistance area, so we could see a number of possibilities here. I CAN NOT tell you exactly what is going to happen, but I did say in December that I expect 2 daily bullish cycles minimum, and so far we have seen the first one acting bullishly. See the chart below and then we can look at possibilities…
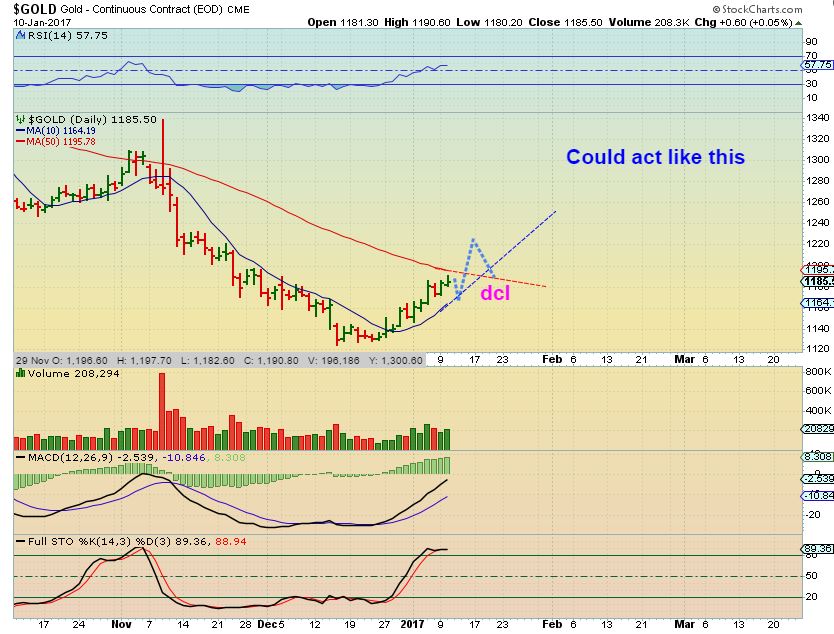
GOLD COULD ACT LIKE THIS – A break out into, let’s say, day 20, and then a dip into the dcl for a back test of the 50sma. This is bullish.
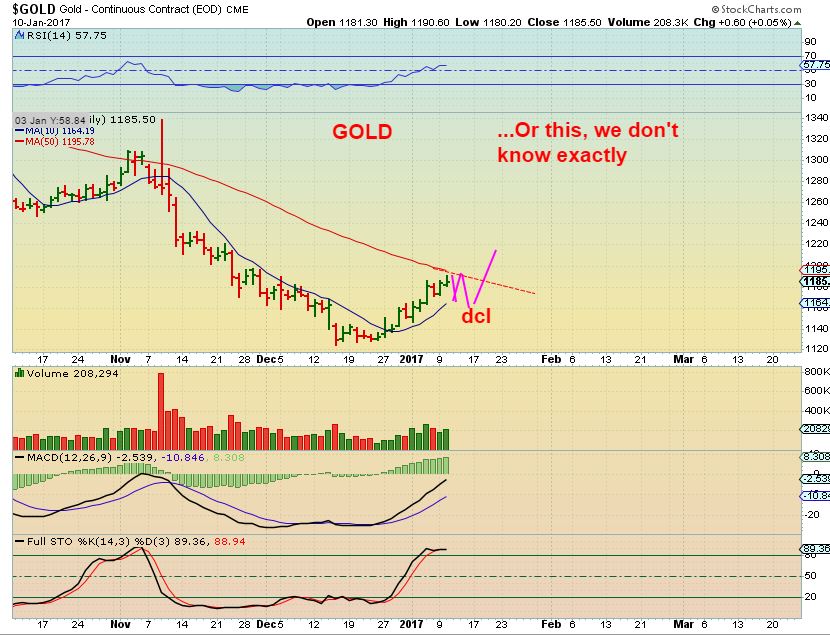
GOLD COULD ALSO ACT LIKE THIS – It could start the drop right now and still remain bullish
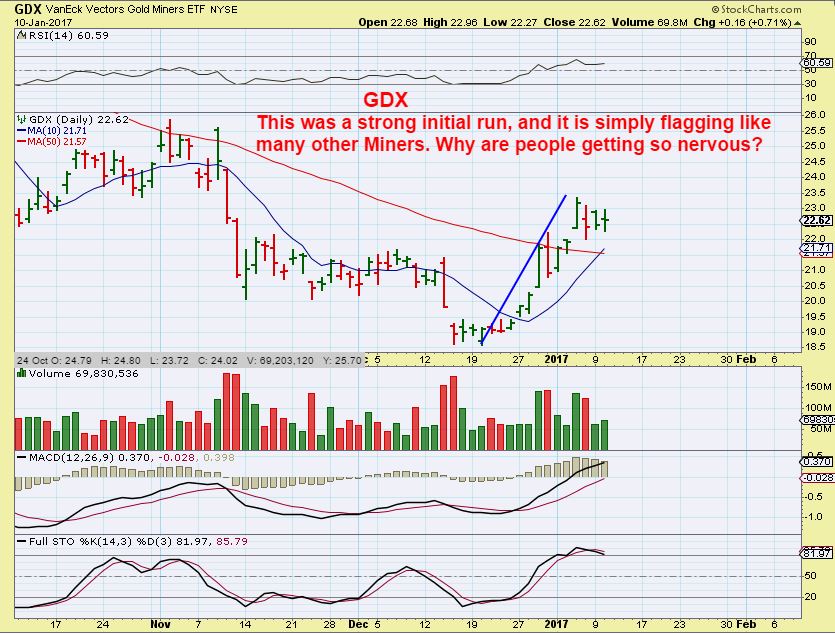
GDX – People are complaining that Miners are going no where. Please be aware that in a dcl, they are known to break below the 10sma.
As you know, I have been watching various sectors for set ups. Miners, Uranium, Industrial Metals, MJ stocks, etc. Let’s look at a few set ups pointed out and see what they look like now. ( I am not going to look at all of the Uranium stocks listed yesterday. They exploded in a big way and now one needs to wait for a pull back).
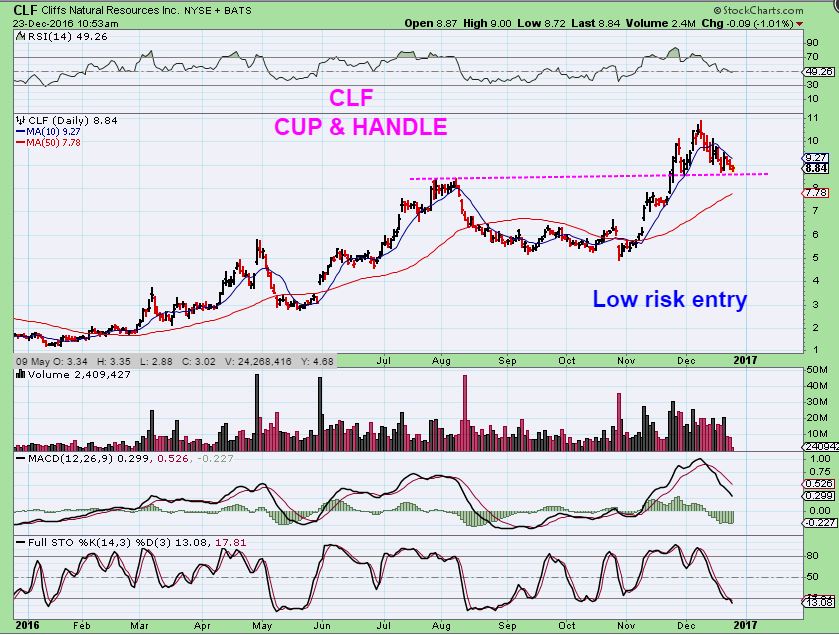
CLF – DEC 23rd, this was a cup & handle and could drop to the 50sma, but the set up is favorable for another move higher, into the teens. I believe usually wait for a break above the 10sma, or take a partial and add on that break.
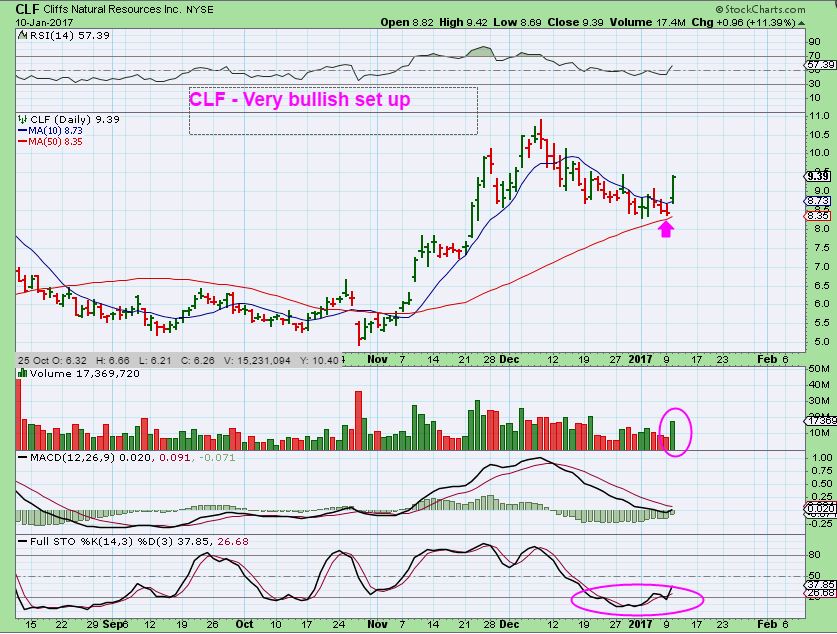
CLF – There is the break and close above the 10sma. I think that you will see CLF in the teens in the coming weeks.
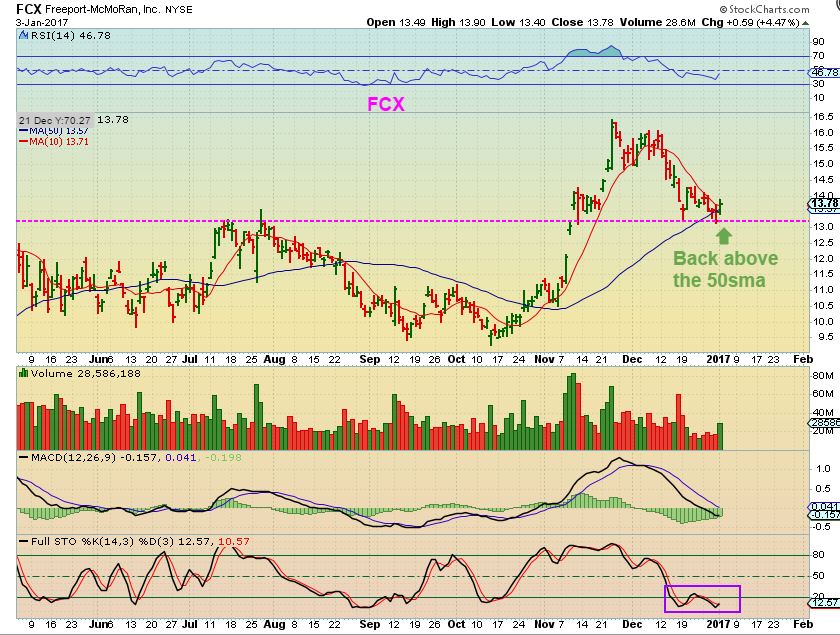
FCX – This was a buy ( Shake out ) and I have heard from a few readers that bought it here and have been patiently waiting for some upside.
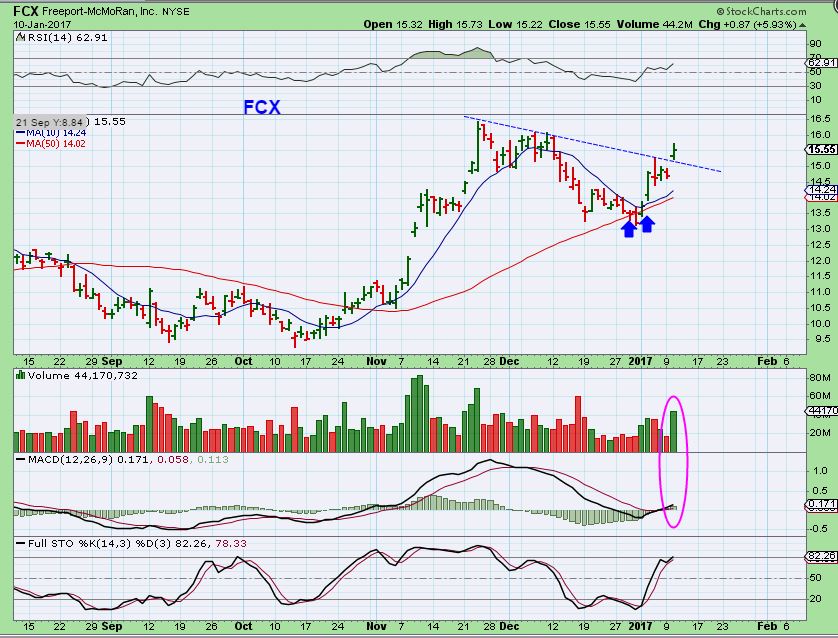
FCX – I do believe that the wait is over, however we see a gap 🙁 It doesn’t have to fill, but if it does, it could be an opportunity for others to enter the trade or add to your current position.
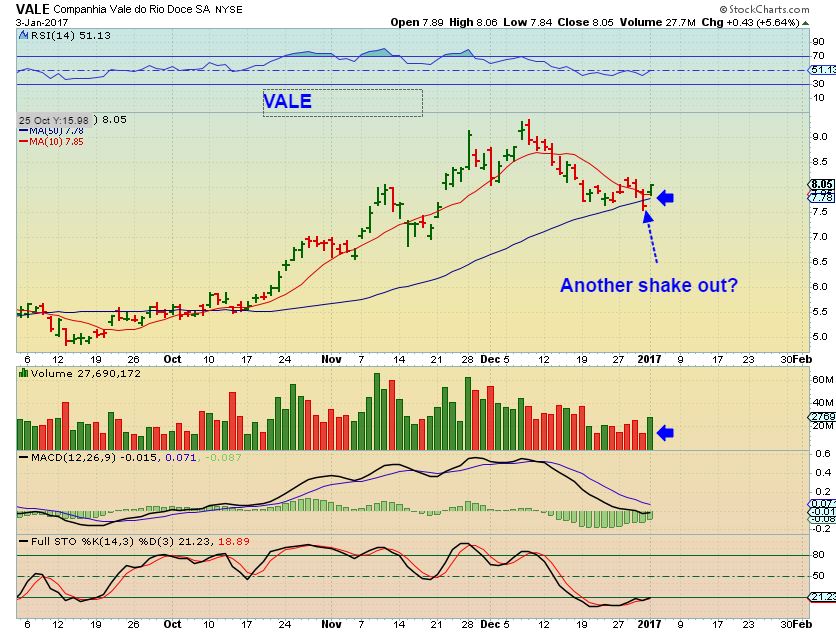
VALE – My chart from Jan 3rd. This did a shake out and closed above the 10sma. A low risk buy around $8.00
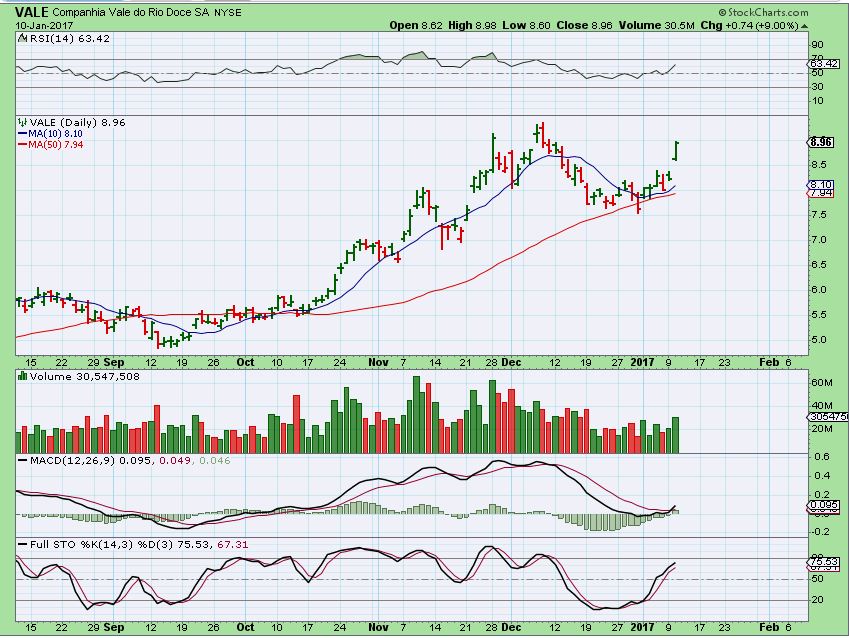
VALE – This took a while too, boring those who took a position, but it never stopped them out, Never closed belwo the 10 or 50sma again. The patient ones did see this jump 10% yesterday. I see this in the teens in the near future too.
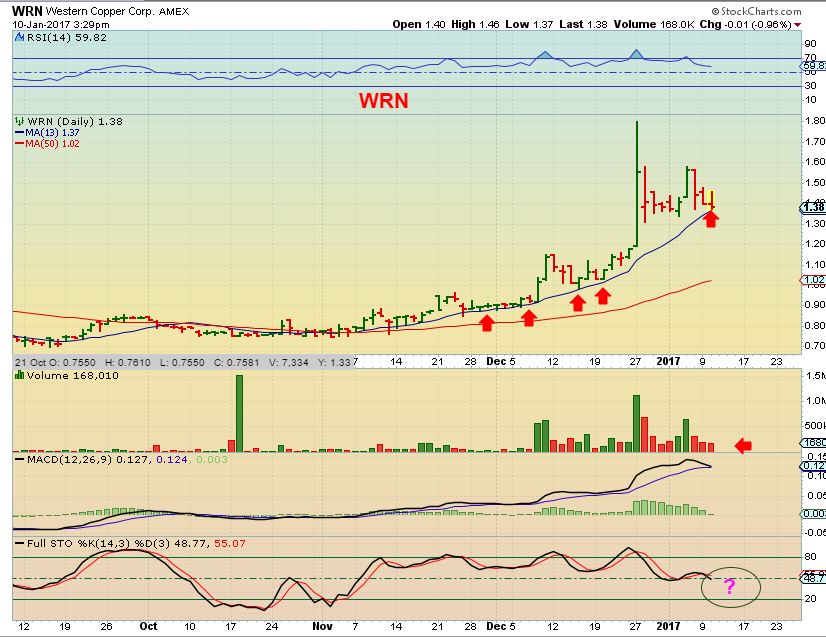
WRN – I still own this one, and was surprised that it didn’t jump yesterday. Is something wrong? I do not know. As usual, I sold some ( of what I bought near $1.00) when it popped and now added again on this tag of the 13 sma yesterday. Copper was taking off and FCX, TGB, etc were too, so why not WRN? I do not know, and that made it hard to add on this one, but the set up is a bullish consolidation and selling volume was light, so I had to take that chance. My mental stop will be deep, since I own most of it since $1.00. My stop will be (painfully ) $1.20 if it drops.
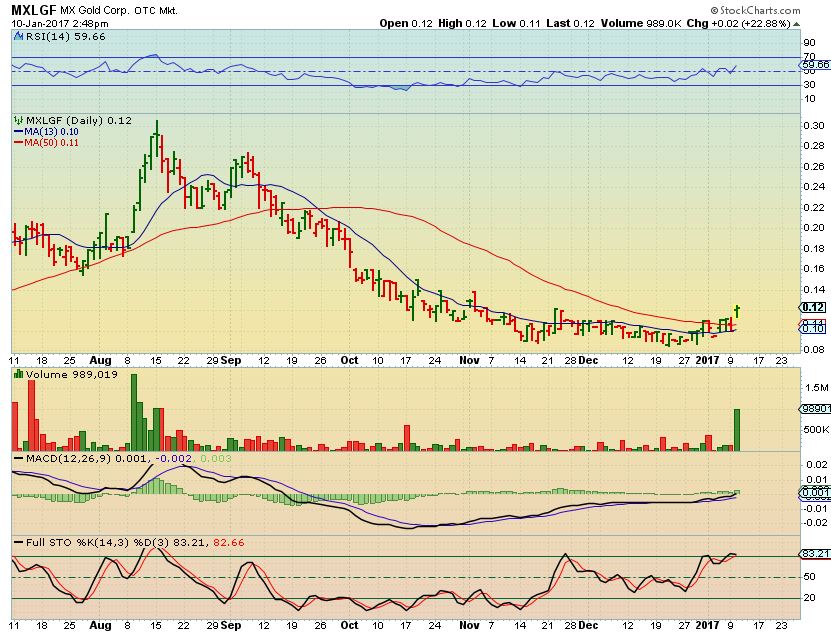
This is a Gold stock that I never mentioned due to the consistently light volume (And it was $0.09). This pop may be indicative of something good coming. I researched it and they do have property and recent purchases, the base is very nice. Maybe throw on a watch list? Small lottery ticket type buy & hold? This is OTCBB, so be cautious.
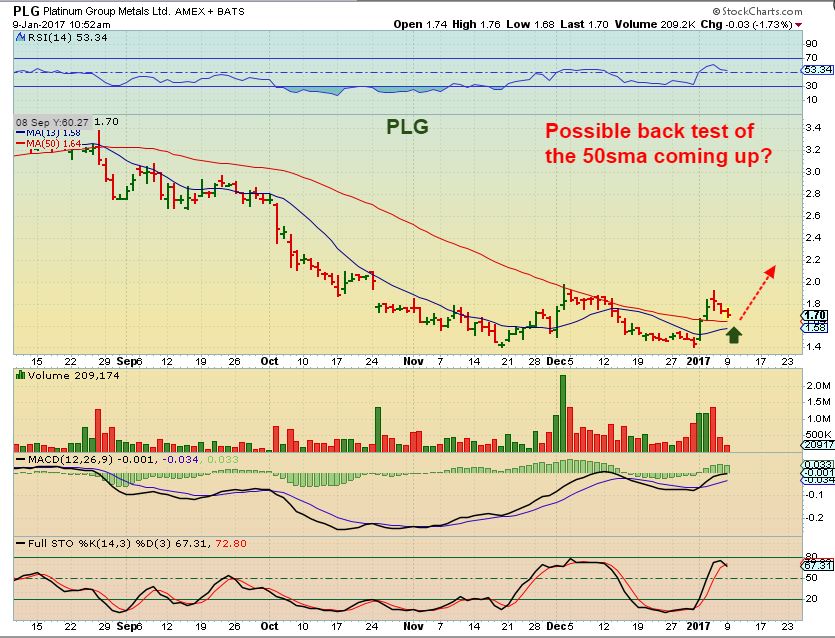
PLG – I posted this yesterday and just wanted to re-post it. This is a bottoming process that looks ready to launch.
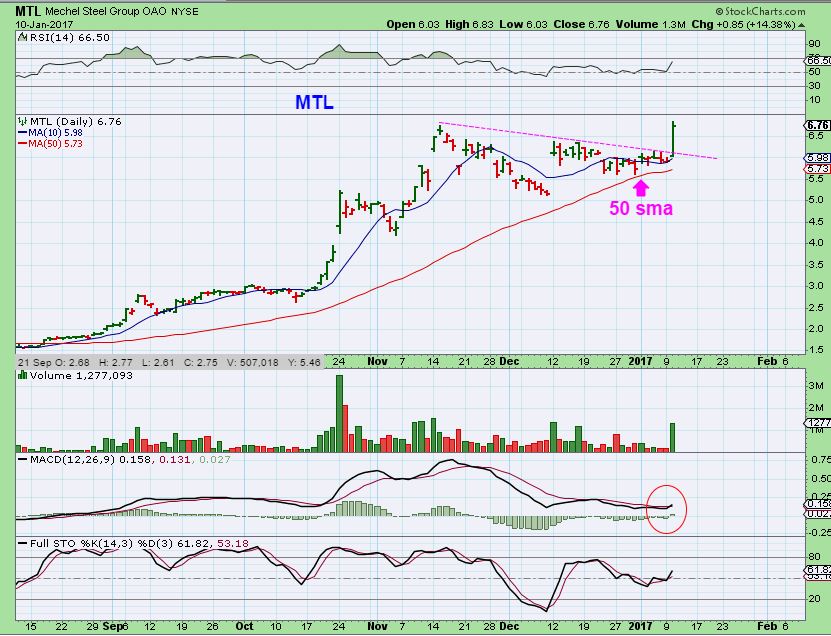
MTL – I had been watching MTL inside of this long consolidation. It had an exceptional run higher along with CLF, VALE, etc. and was now consolidating gains toward the 50sma ( not shown on this chart). On a smaler time frame, I saw it break out and bought it at the $6.15-$6.20 area and posted this in the comments. Big volume was coming in on 5 & 15 minute charts.
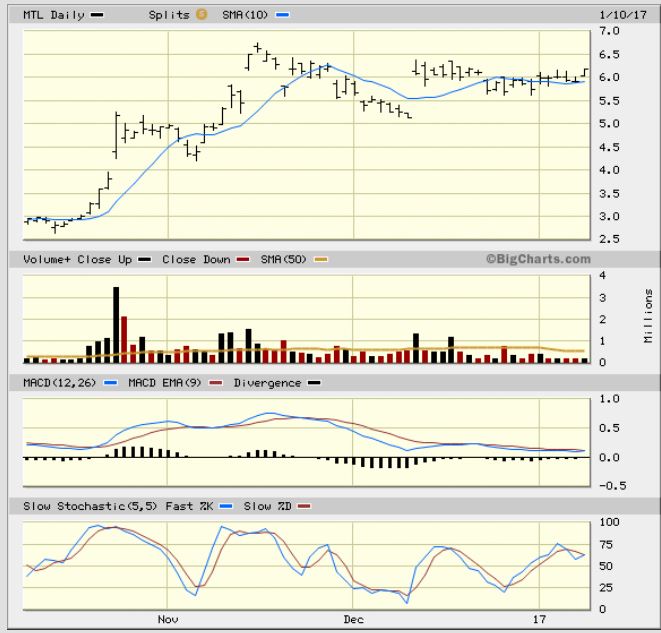
MTL – When this one moves, it really moves. I did not get to add to my position all day long. I was hoping that it would dip down a bit, but it ran higher, went sideways an closed near the highs. NOTICE how this ran in Sept, Oct, & Nov. I want to add to my position. See the next chart also.
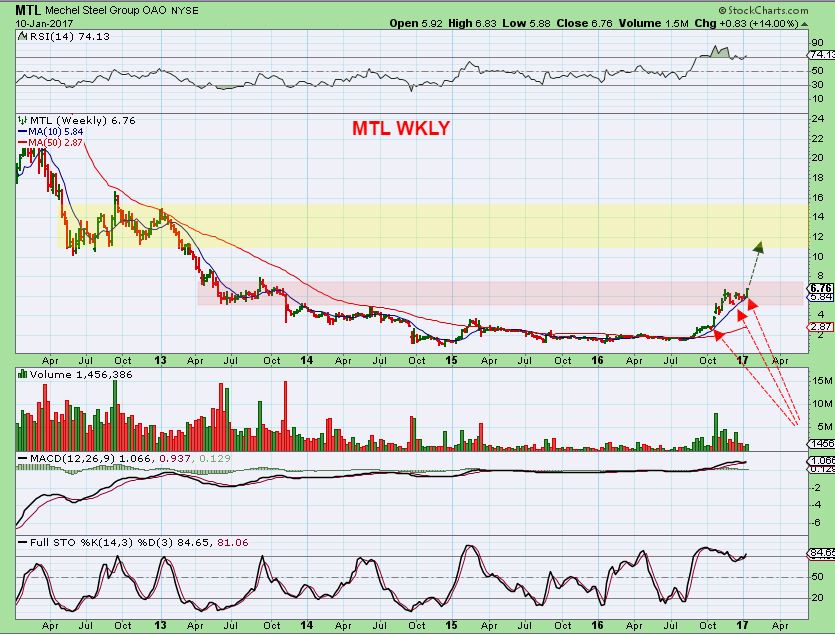
MTL – MTL has a huge base and if you’ve been here for a while, then you know that I LOVE buying & Holding stocks that have a big long base. The move upward can be very profitable for the patient ones. This looks ready to break from the pink resistance area (consolidation) and into the yellow one. 🙂
The above charts of CLF, FCX, MTL and so on could still be entered for a move higher, but your “low risk” entry is no longer very low risk. You may have to endure a little pain if they bounce around before running higher. Again, I want to add to MTL, and I may have to add higher than where it traded Tuesday.
Conclusion: I am really liking the various set ups that are forming and leading to explosive moves higher. I also do like the way precious Metals are acting. I dont want miners to run straight up and collapse, and this has been a healthy move out of the lows. Many still do not believe that the move is real, and that is what I like to see. As a trader, we are in a traders paradise, able to buy low and ride trades for days and weeks, not just ‘a day’. That is what I love to see and I think that 2017 is going to be a great year of gains if we…
STAY FROSTY! 
~ALEX
Oh, O.K. more set of chart.
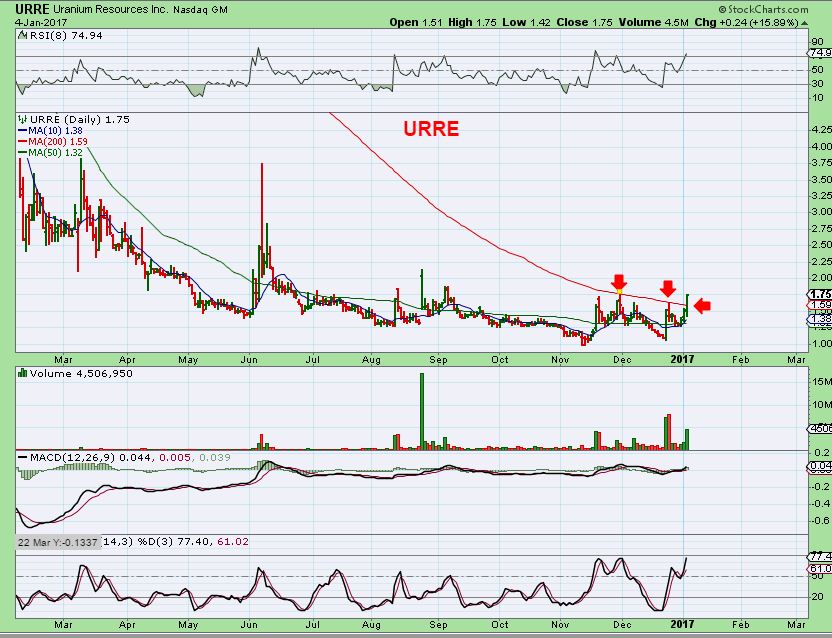
URRE – January 4th, I have been pointing this out as low risk buy and bullish break out. It was a buy.
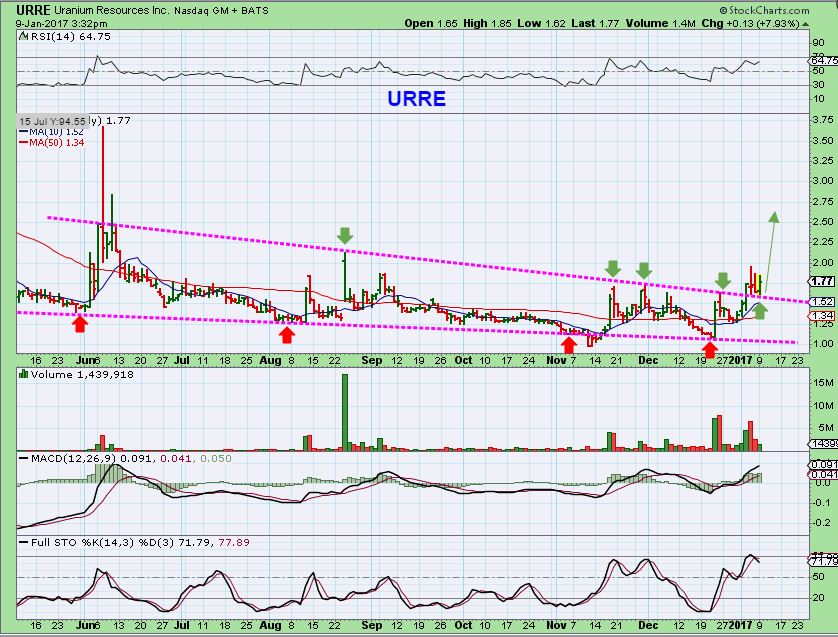
Once again, it took patience to allow it to find the follow through as it back tested the 50sma successfully, so I posted this chart to offer another buy on Jan 9th.
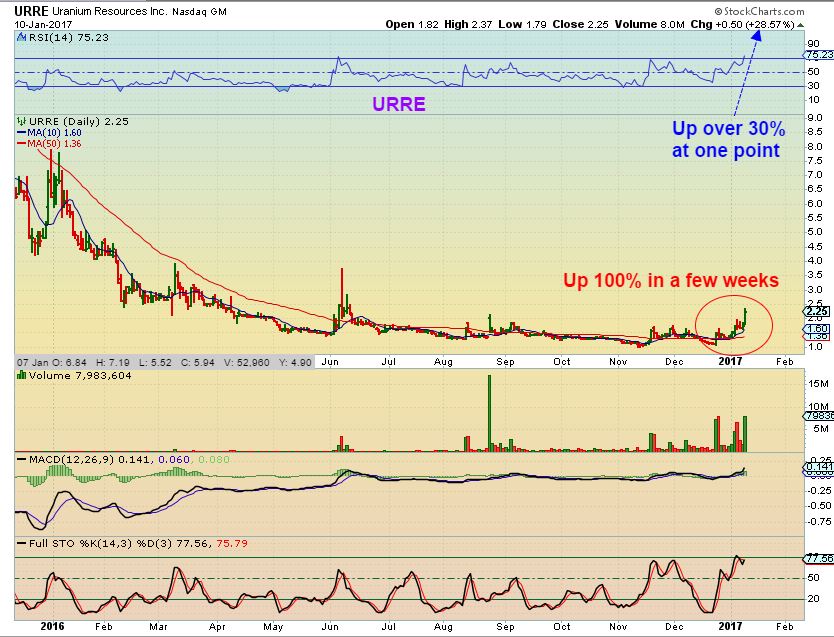
JAN 10th. Congrats to anyone that grabbed this set up. A big burst like this can bull flag, pause, or even pull back, but I’m letting my position ride for a bit. It looks like the Uranium sector as a whole has bottomed and there is not a lot of competition after the recent bear market starting in 2011. CCJ is the best of the breed, and it is also moving nicely higher. A safer buy & hold.


CF, got my first email alert in well over a week and the browser certificate errors have cleared. So looks like we are good to go. Thanks to the support folks for getting that fixed.
Alex, I know you have been asked these questions before, but for the sake of newer readers and a refresher for me: do you have separate accounts for your short-term and long term trades? I know it varies depending on the current market action, but how many open positions do you typically hold in your accounts? Do you have a maximum % for each holding per account? For example, I know traders who will not put more than 10-15% of their account into any one position. As you know, I don’t have much time to follow the markets during the day so I mainly invest in ETF’s and limit myself to 2 or 3 open positions at a time in my 5 accounts. Currently I’m very heavy in GDXJ with some AG and SLW for exposure to the silver market in my main retirement accounts. I’m also very heavy in JNUG in my trading account.
Separate accounts.
Trading : I like to keep 1 – 5 good positions trading & some cash much of the time to keep it manageable, but
I may have 10 at any given time if markets are setting up exceptionally well. Also at ICL’s I am all in by some point.
If I see a really good set up and I own10 positions, I’ll choose one to sell before I buy another, based on the charts.
I also dont care what (reasonable) % I put in one stock, if the set up is right and the company is reliable, I will go in heavy with a stop and peel some off on the way up.
I run through the charts of the stocks I own constantly and monitor them – if they are not acting correctly? I cut the ones that are no longer doing what I thought they would when I purchased them. No emotional attachment or ‘hope’ this comes back. I’ll sell for a loss to enter one set up to gain, rather than ride a loss for an unknown amount of time and miss a good gainer..
With that in mind, I repeatedly tell myself this –
Owning more than a 8-10 stocks is as easy as herding cats. Picture trying to manage 20 cats running around out in the yard. They go in all directions, and so do stocks. It gets unmanageable.
Thanks, that’s good info!
Good question Steve–good answer, Alex. Thanks gents!
Alex, good morning. I’m curious if you are able to get a cycle count on uranium. I know that many commodities are difficult to count. Should you have a count ,could you please share. Fine job for the company!
I have never had any reason to look into it, and it takes a long time to determine the cycles timing by going back over the past 17 yrs or so. It can be done, but also if it moves from a bear market to Bull market, Daily cycles lengths can change due to short cover & bullish sentiment stretching things out, so off hand… no, I havent looked into it yet.
Fair enough, it’s not like your hard up for something to do. I haven’t a clue how you keep up on, and continue to learn every day the way you do as it is.
Thanks. Uranium stocks are having a melt up mode currently . Maybe when it settles down I’ll look into it.
Sizeable dip in gold this morning.
Alex, URRE!?!? Thx!! Never have enough on these ones and always too much on the duds! Oh well…
I know. It sat there on that 50sma, so I added, but I would like to have piled on. up another 30% when I looked.
Also URG, UEC, DNN, UUUU, CCJ – the entire sector is on fire, short cover and buying I guess.
Up 40%! I think I’m going to explode before URRE does!
It is SICKENING and WAY OVERSTRETCHED on a 3 month daily.
And then you look at a 2 year weekly… and it looks like it could run for weeks 🙂
Another down day for miners, don’t be in a rush to buy this dip IMO. Miners are still in a “down” trend on my 15 min chart and may continue dropping for a while today.
I see that, lower lows and highs
I was going to post before the open that miners were a “sell” (down trend) on my 15 chart but I was busy. 30 minutes into trading they are STILL a “sell” so this could be another day like last Friday where miners keep dropping until late in the day. If I have time, I will post if/when miners flip back to a “buy” on my 15 min chart today, like I did last Friday for JNUG.
Appreciate you sharing your ideas, thanks Steve. Just curious, When you say MINERS are in a 15 minute down trend, are you looking at a handful or GDX & GDXJ? Thanks.
I just look at GDXJ/JNUG primarily, sorry I should have clarified that. I primarily trade the ETF’s . I have my own charting system that is combination of moving averages, TSI, RSI and other readings. It’s part mechanical, part “feel” I may post here from time to time. Check your own charts and make your own trading decisions, I’m just adding adding food for thought.
It was good comment – I just wanted to look up the trending on the 15 minute charts, but I wasn’t sure which miners. GDX / GDXJ – works for me.
Thx
GDX I think, that’s what I was looking at. 15min chart
Are you using MACD cross?
So I looked at URRE and a few other Uranium stocks. I just know that someone wants to ask me where to sell. It’s kind of that battle between greed and fear. Greed tells you to hang on, it just keeps going higher. fear tells you it is too extended and you’re going to lose on a gap down soon. Also these could run up and bull flag for weeks and then you have a hard time getting back in.
My answer is that you have choices:
1. Sell some to lock in gains, let some ride?
2. Sell it all and be happy you took the trade for 60% in 2 days? Buy the next dip.
3. Hold on and see wait it does based on that wkly chart and that base.
If you choose 3, you would do yourself a favor and look at the chart of NAK in August through Oct ( boring but worth the wait)
Or look at MTL in September – Steady consolidation that allowed moving averages to catch up.
Or look at a 1 yr of WRN – Painfully long consolidation after the June 2016 run higher.
These are not easy decisions in trading, but be thankful for the opportunity to have such a dilemma 🙂
lol! read my mind…option #1 and #2 (later) worked for me this am. Nothing like a good night’s sleep…no regrets. Thanks again for all your work!
Congrats! Great trade : )
Looking at GDX, it seems that we are breaking the uptrend line on this daily cycle. We still have the 10SMA beneath us, so it’s not a confirmed swing high, right? What are the chances that this is the beginning of the drop into a DCL, or could this be an HCL that reverses to put in a new, more right translated high before dropping into a DCL around inauguration?
Looking back through the report, it looks like you sort of answered this graphically wrt Gold. Never mind…
Too late 🙂
haha, awesome. appreciate the insight.
Hi Dave, It could be either, but if we are dropping into the daily cycle low here, it may be a short daily cycle.
I have been thinking about this, because the last daily cycle in the sell off was so long, that it could balance out by putting in a short first daily cycle now ( Let’s guess 20 days) and hold the 50sma.
I tend to use the Gold cycle count over the Miners, because the miners bottomed a bit after Gold, but either way is fine.
See the attached chart. It is basically looking like a normal pull back , even a bullish flag, 38% or 50% is bullish.
https://uploads.disquscdn.com/images/997af73012be1d35b2cce2faf7e1820d14cc197d3762b0d69fc2e8fd3fe259f4.jpg
http://seekingalpha.com/news/3234672-uranium-producers-surge-top-supplier-plans-production-cut
Uranium production cuts funny for the news follows the charts. Also dont forget LEU it still looks bullish to me
I have a feeling URRE goes to 20$ these reverse split low floaters are where its at right now
I’ll take that : )
MGAFF starting to move too. Was up about 50% yesterday. And REEMF rare earth back from the dead. From about 4 cents to now 19 cents in about a week.
I wondered about the rare earths, great volume on that run too. Thx.
GDX Jan 5 gap closed…true?
URRE trade is really getting sick now 🙂
Better than options !!
awesum awesum ….
Coffee (JO) Update:
Adjusting stop to below the gap shown, I may want to adjust lower depending on how deep the coming corrective Wave 2 is. Very confident the low of 18.81 will hold though…. https://uploads.disquscdn.com/images/87fb30d04b14a985769184e3872ece6634338dde6ccd04327ff3e23eea0ca303.png
Hi Ken- I’m in Jo and see the 50 day is about to get hit from below. Are you expecting at wave 2 starting about there?
Very possible Ann, I am expecting a corrective wave soon. I am not but maybe take a few dollars off the table is always a good option as CF has stated a few times.
Thanks, Ken- good luck!
Your welcome Ann……
yes.. stock up on coffee now folks.. (unless u r mr. wonderful and make ur own) lol
Enjoying a Guatemalan as I type…..cheers. 🙂
i still say u should send me some…..
not sure exactly what i could send u in return… hmmmm (me tapping my chin)….
ohhhhhhhhh … I GOT IT…. !! ;o)
*sinisterLaugh
UT O….. lol
Here is the thing though by the time it gets to you it will no longer be “fresh”, that is truly the key.
Hi Ken. I bought this to cover my latte’s for the year. Where are you thinking of selling? Near previous highs? Thanks for this!
My plan ( for today 😉 ) is to add at the bottom of wave 2 correction due shortly, getting overbought currently, then letting her go for the next 3 waves, where that might be I have no idea.
Thanks Ken. You are the coffee expert and I’m with you on this one. Reloading my Starbucks card.
Your welcome Carl……
Sounds like a great plan to me!
Nice trade, could form a nice inverse H&S on a pull back
Thanks. Yes Agree….
Yeah, next pullback is a buy based on this chart!
peeps ask me quite a bit what i am doing w/ my candles when i overlay them .. and it just dawned on me this am while explaining it to a friend …. by looking at past moves (where i was likely shaken out lol) it helps calm my nerves and says to me ‘yo maria… look.. here is where u were shaken out last time on that impulse wave up” … ;o)
take GDX – last two impulse moves up on gdx … 4/1 and 5/25
https://www.tradingview.com/x/2TiGryGE/
im hoping for the purple pattern myself… lol and look at that Trump is speaking … perhapssss…..?
Yes, please. I need one more big up day!
Kicking myself for being a Cutie with URRE. Was expecting it to cool off after yesterdays run..
better to have luvd & lost ….than never to have luvd b4….
;o)
Lol I guess
I agree with this, but I realized that I’m not good at exiting trades without moving up stops. If you’re good at it and got cute, that’s something else… but when you haven’t got the jedi eye yet, gotta have a system (maybe?). *bort*
FYI, JNUG, GDXJ have flipped back to a “buy” on my 15 min chart about 10 mins ago.
I should mention that obviously a 15 min chart is very volatile, so it can flip “sell” then “buy” and back to “sell” within an hour. I use it primarily to look for entry points on days when I want to add. GDXJ/JNUG are you now getting close to a “sell” again, but still a “buy” at this point. Also “buy” and “sell” is my shorthand for an up or down intraday trend. So check your own charts and make your own trades. I’m posting for entertainment purposes only, please no wagering. LOL
What just happened to gold? Did Trump say something?
Happened just when he announced appointment for vets admin.
Hmmm?
Back down now. He’s still talking.
Did you guys see BIO? I had missed the trade in LABU from last week. I was stalking an entry, but think I want to see 1 or 2 more days of action before I just jump in.
Bill, stopped out today or were you up enough to keep it loose?
woo …. look at daddy long legs
https://www.tradingview.com/x/lWI1CWHb/
USD/JPY dumping
Trump not mentioning Nukes will probably start the pullback in uranium stocks. No worries, he’ll tweet something scary again eventually
Looks like our Copper buddy TGB decided it was time to join in the fun
The Jan 10th second DOW chart above has a Stoch crossover down. Inverse to miners.
Could URRE be setting up a head and shoulders intra day on the 5 min?
if it is, back to 2…
I like the way you examine your charts 🙂
It could be ( But that doesn’t necessarily mean a crash down will come. Keep in mind that a H&S on a 5 minute could fulfill to the downside in an hour or so), and then price could consolidate sideways – keep dropping – or go even higher over time. It is a way to get out though…selling the right shoulder ( or partial) just in case
Good eye, Ann!
So far so good on the intraday reversal in miners, GDXJ/JNUG remain a pretty strong “buy” (up) signal on my 15 min chart. I added more JNUG to all accounts on the dip this morning starting around $8 and bot more between $8.10 to $8.20. Sorry I didn’t post in real time but I tried to give a heads up that my signal had flipped to “buy” shortly after 8:30 AM PT. I’m pretty much “all in” on miners now. This was just “topping off” some accounts. Good trading to all! Gotta get back to work.
Thanks Steve. (Same Steve from Bob’s room?)
I don’t know, there are a lot of “Steve’s” over there .. I’m the only one who posts my full name and pic because Disquss is linked to my Gmail account.
I am Xman. (or Frenchie over here too ). USD/JPY is dumping
;O)
agreed. GDXJ is getting ready for its 200MA launch which should bring some players in the game.
Sold MUX. Might sell CDE too. Hmm… Switched NAK to trailing stop. Wish I had some URRE like alz youz ninjas.
I’m keeping MUXie for the long haul!
Me too….like the leadership and property.
Don’t know about the rest of you, but I get the distinct impression that our small miners are being acquired by stealth so as not to run up the price of GDXJ and drive all the prices up before they have been accumulated by strong hands. AUMN is case in point this morning.
Wow – look at that AUMN chart.
I’ve been sitting in this since Dec 8th and at times with -35% to show for it.
GSS too. Moving the last two days.
After 12/20/16 it has been dead in the water due to the increase of $5 million in shares. It going to take a lot of time to absorb all this extra and be placed in strong hands. Hope I’ve got the patience.
I completely agree…they are playing with the price of gold and accumulating…they will let it run when they are ready…but it does seem like it is getting harder to manipulate.
Could this be our long awaited weakening of the US$? Wow quite a plunge!
Yes, today’s move in gold was all USD which, for today, at least, was all headline news. Not sure if there is quite as much we can learn from it bc of that. BUT, great to have it roll over. I was worried when it shot up to almost 103 this morning, that would be a problem!
MINERS charts reversed back to higher. They are having trouble selling it down and as EDWARD mentioned in his post, it could be selling to accumulate.
And OIL – UCO & USO look like reversals at the 50sma area.
And GOLD near $1200.
Great markets, I think I will go for a walk. 🙂 ( Added to MTL and did sell partial on URRE in the $3.50 area, just in case it stalls for a while, staying in it in case it gets stupid on the upside )
BALMF. I think this moves now. good news today also BALMORAL
Took my 53% profit on URRE. Nice trade Alex!
Very Nice Jeff – In at 1.58 for me out 225.. Shaking my head every way possible about the 3.94 run….
Or you could have missed the entire run like I did bc your job expects you to “work” during the day instead of trading. Sheesh!!
The NERVE! Work at Work? Baaah – what an idea
I know, right? At least not when JNUG is up and down like a yo-yo and uranium is up 100% in 2 days! Maria would never stand for that at her work, trust me!
UUUU complete retrace back to start of day….just got back to computer….I didn’t have any uranium stocks…maybe now good time to get in or still going down?
Getting some good volume coming in today – JUNG over 66m now. NEM over 8m. Some of the smaller stocks seem to be getting a lot of action.
It was a good bounce back, that is for sure. Gold new cycle highs, but not so for GDX/J.
Hi Alex, hi all. I’m fairly new here and haven’t posted much yet but, like I said in a previous post, I love the community feel of this site and check in several times a day. Alex, just wanted to thank you for the URRE suggestion and Ann for pointing out the 5 min chart. Just sold half for +96% (in 1.71 out 3.38). Tammie, thanks again for the MJ summary the other day. I’m looking at moving into UUUU now, but like you haven’t decided yet. Looks like it just about filled the gap from Sept. Does anybody have any thoughts on this one?
Yeah, I just walked away for a few minutes and back now…now it’s up .08…..wondering if I should have grabbed it when it went to up .04….watching it…just…not ….sure…?
Yes, this one is ambiguous to me as well…
VIX close to breaking 11 again ….
NAK news out tonight:
Northern Dynasty Minerals announces a $25 mln bought dealannounces that it has entered into an agreement dated January 11, 2017 with Cantor Fitzgerald Canada Corporation, TD Securities Inc. and BMO Capital Markets, as co-lead underwriters and joint bookrunners, on behalf of themselves and a syndicate of underwriters to purchase, on a bought deal basis, 13,520,000 common shares of the Company at the price of US$1.85 per Offered Share (the “Issue Price”) for aggregate gross proceeds of approximately US$25.0 million.
Thanks LTL
Funny, I just tried to trade it in after hrs and the bid / ask is still in the 1.95 area ( I didnt want to trade it and didnt, I was just looking at where it is at since the offering is $1,85) . It should drop down to that offering price tomorrow.
When I read this story I actually find it encouraging, though it is a temporary bummer. They could have done this offering at $1.35 and raised a ton of money too, but Cantor was WILLING to pay where NAK traded last week ( This deal would have been in discussion last week I would imagine – so they were willing to pay current prices, when so many people are complaining that NAK doesn’t make any money yet? ).
I think that this endorses the ‘value’ of NAK at current prices. They bought a TON of shares, and I’m sure they are planning on price going higher in time.
agreed…
a litle more data:
Northern Dynasty Minerals (NYSEMKT:NAK) -9% AH after announcing a $25M bought deal purchase of 13.5M common shares at US$1.85 each, with an underwriters option to purchase up to an additional ~2M shares.
NAK says it plans to use the proceeds to address the EPA’s regulatory action against the Pebble Project; prepare the project for the initiation of federal and state permitting; environmental monitoring, engineering and environmental studies related to the project; among other corporate purposes.
Yeah maybe good long term but negative short term for current traders. This has been pretty common for my holdings recently!
Oh well – will get hit tomorrow probably back to the $1.85 offering price. Showing a bid/ask of $1.91/$1,93 now down .20. Maybe good for an add soon. Alex what do you think?
I see the after hours price has dropped by .20…..taking it down to $1.91….the bought deal offering is for price of $1.85….so maybe it won’t fall much further…? I started to get back in it today, glad I waited now.
CF – with your update on Oil, you have any thoughts on ORIG? Ive been holding since 1.56 and fought tooth and nail not to sell at 2.85… the 50sma is crossing the 200 on the daily and its been moving sideways a bit.
Don’t forget about LTBR one of the best looking Uranium charts and a low floater
Updated cycle counts:
GDXJ is on day 15 with a high on day 12
GDX is on day 15 with a high on day 11
GLD is on day 18 with a high today on day 18
CF, any thoughts on L/R translated. Gold seems near guaranteed to be R translated but potentially unlikely GDX/J without a new high in the next few days? GDX chart looks like a bullflag to me, though. I would have loved to have ended the day higher once the $$ dropped allowing gold some room to run, but that did not end up being the case (though this is WAY better than where we were early morning!!). Any thoughts?