
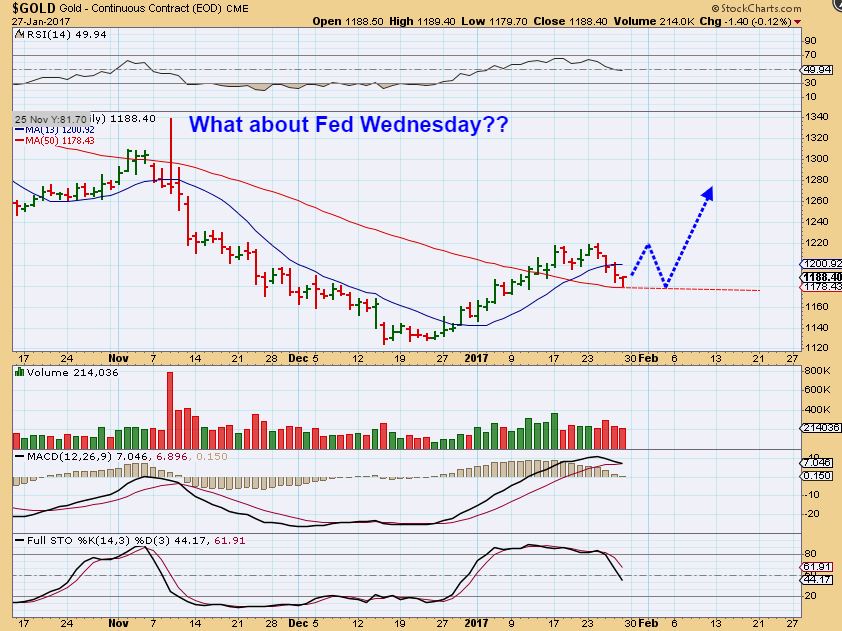
FED WEDNESDAY IS CLOSE
Let’s discuss Monday and keep in mind that we are closing in on the FOMC meeting Wednesday.
.
SPX FROM THE WEEKEND REPORT – After the break out the VIX was below 11! I expected that we could get a drop and not a continuation higher for now.
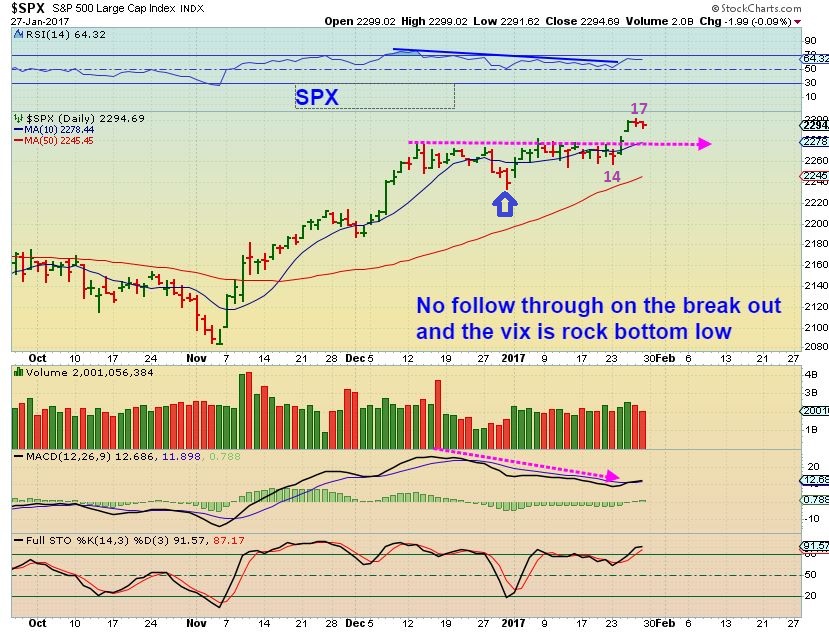
I posted this in the comments section near 11 a.m., the VIX was popping and the markets were dropping. This looked like the markets could be rolling over going into the Fed Meeting.
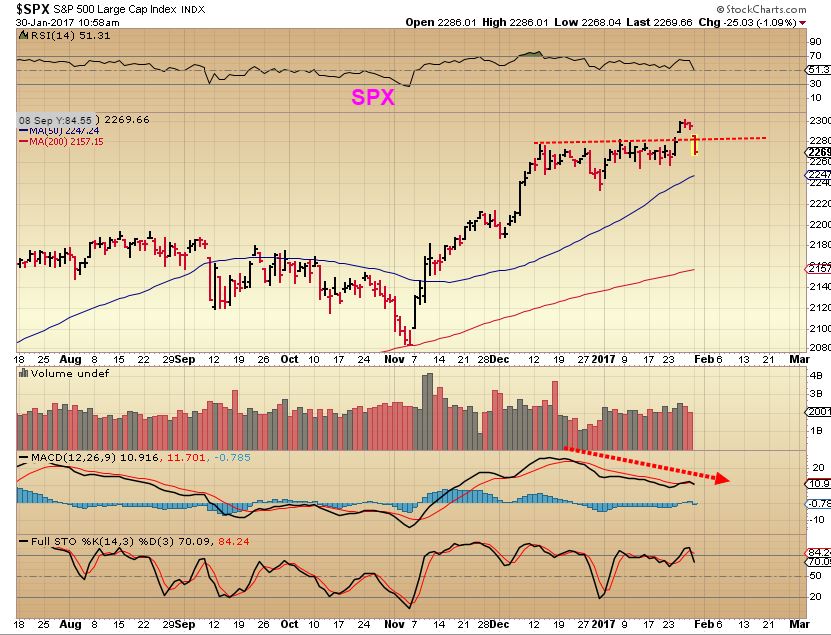
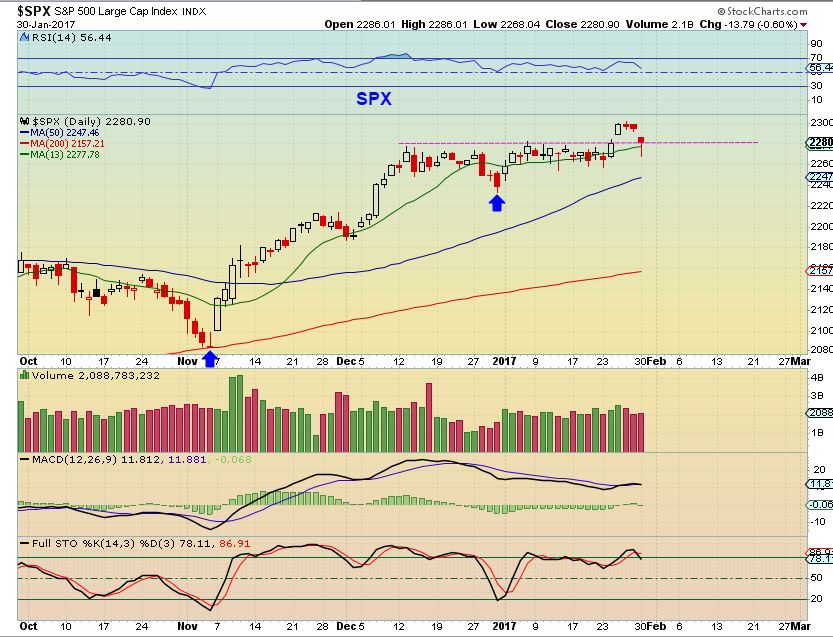
SPX END OF THE DAY – Then the markets reversed and put in a pretty big reversal candle. It recovered back to the consolidation highs, but it was still down 14 points. The jury is still out, but anyone that jumped in long at the break out or short as the day sold off have both been schooled a bit. The school of volatility.
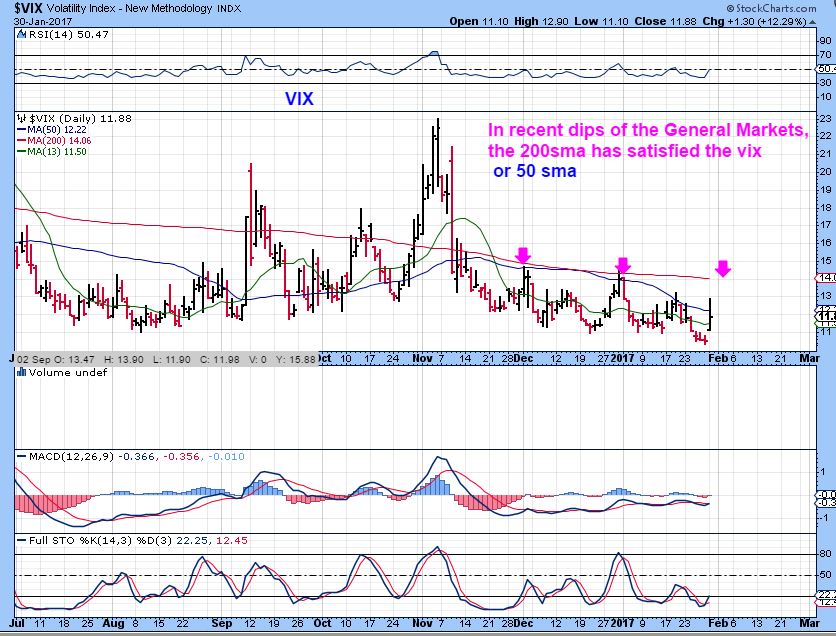
The VIX – It was very low near 10.50 last Friday and Monday it did pop nicely. Is it done? It has moved to the 200sma in the past, so Tuesday may give the markets a bit more downside. Either way, I am not in this trade.
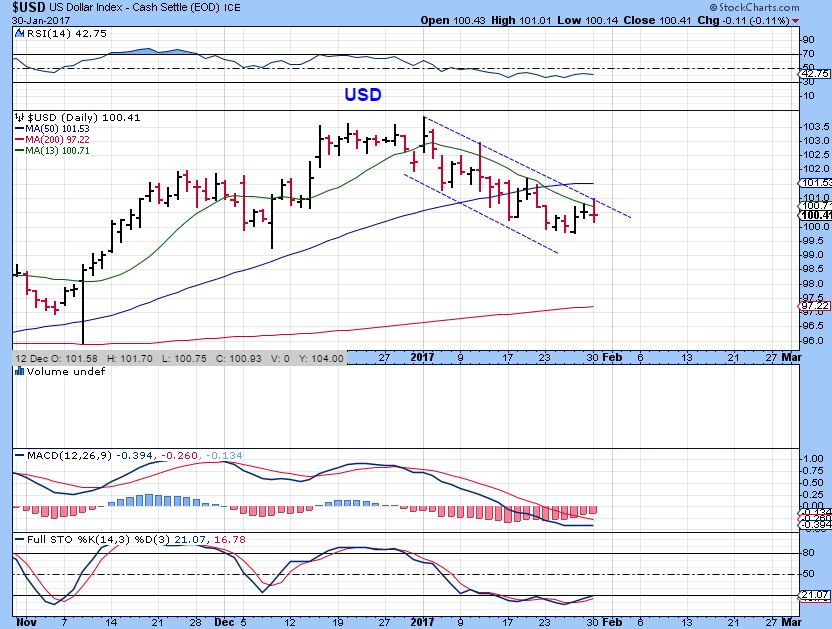
USD – From the weekend report, we are due for a dcl. Day 32 may have been it.
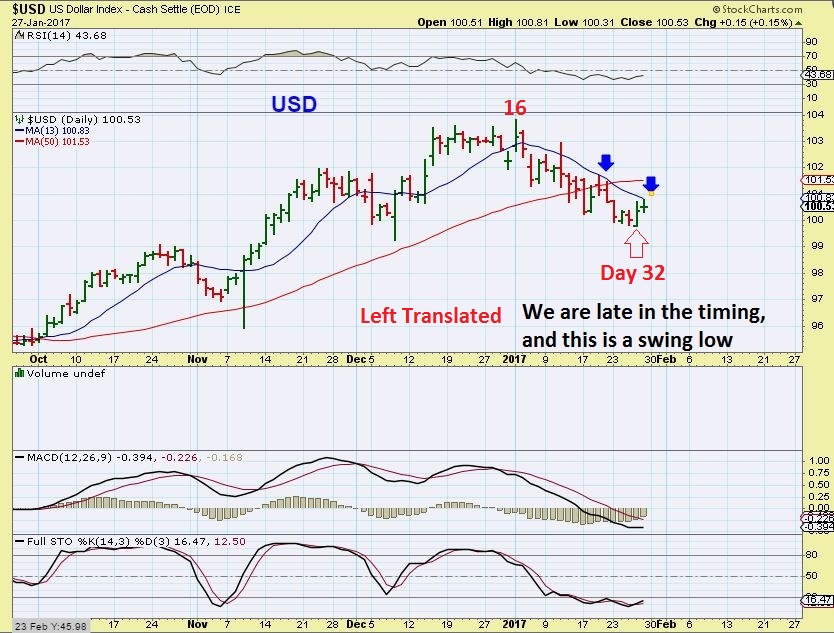
USD – The Dollar is having trouble bouncing here . In December it Popped on Fed Wednesday and Thursday and then rolled over. I am starting to wonder if we will see that again.
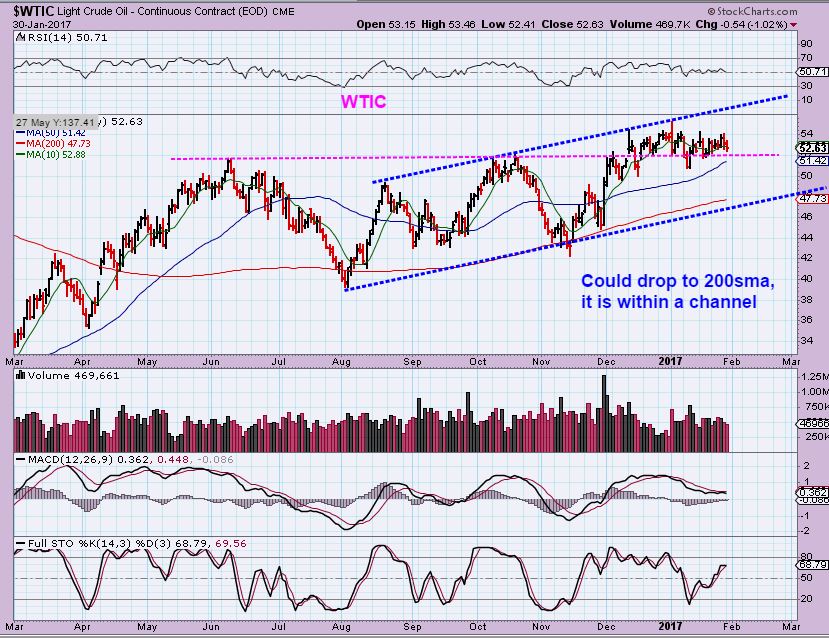
WTIC – Oil is hinting at weakness and some energy stocks dropped Monday. I expected a pop higher before dropping, because I thought we were somewhat early in a daily cycle, but that MACD is weakening as a cautionary note…
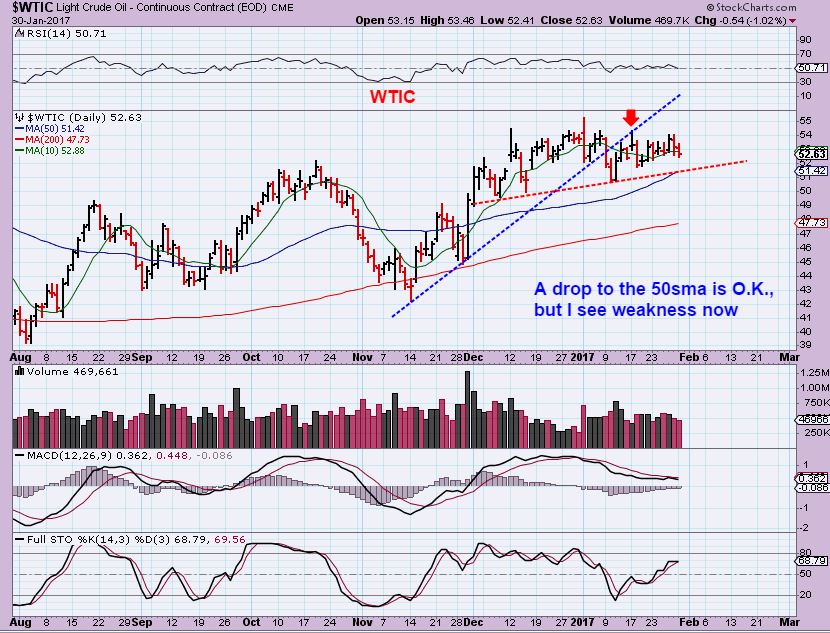
WTIC – I expected a Pop before a drop, and that upper blue line was a target that I expected. I’ll keep an eye on it going forward, we are right in the middle of a consolidation really.
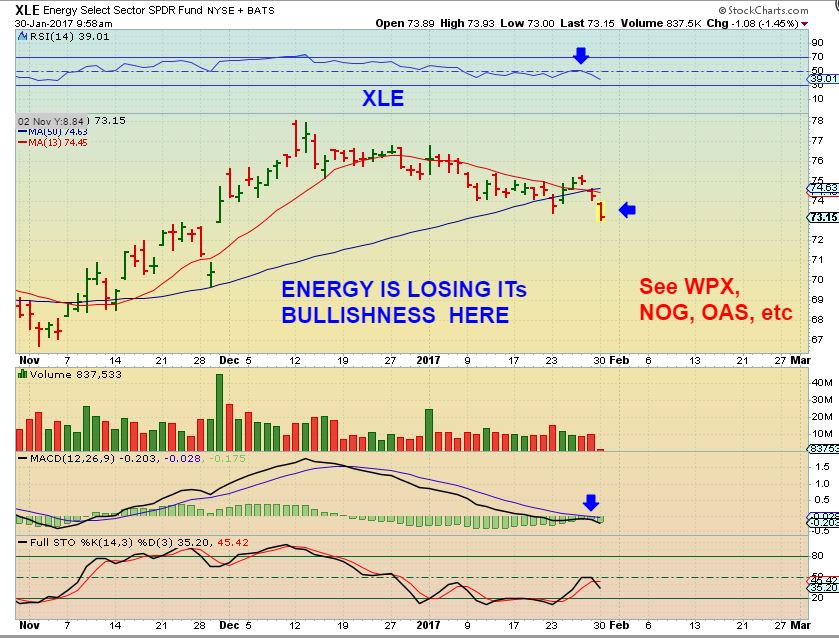
XLE – At 10a.m. the XLE broke down and I pointed this out in the comments section. It closed a bit lower at 72.87 and the MACD and a few other areas are starting to look weak. Are these stocks leading the way? They have in the past.
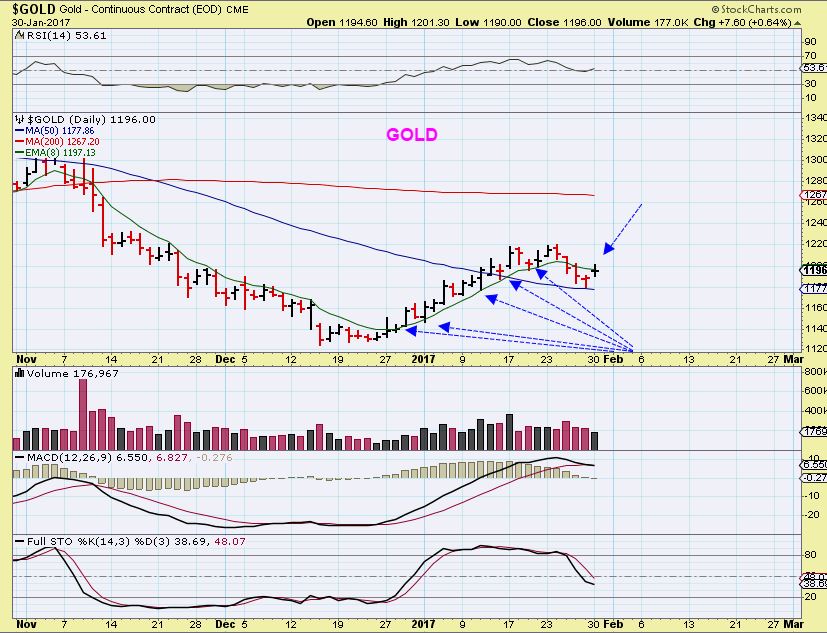
GOLD – No real change from the weekend report. This is Mondays action and it stalled at the 10sma ( 1202). I am watching that area, but we are still pre-fed and anything can happen Wednesday and Thursday.
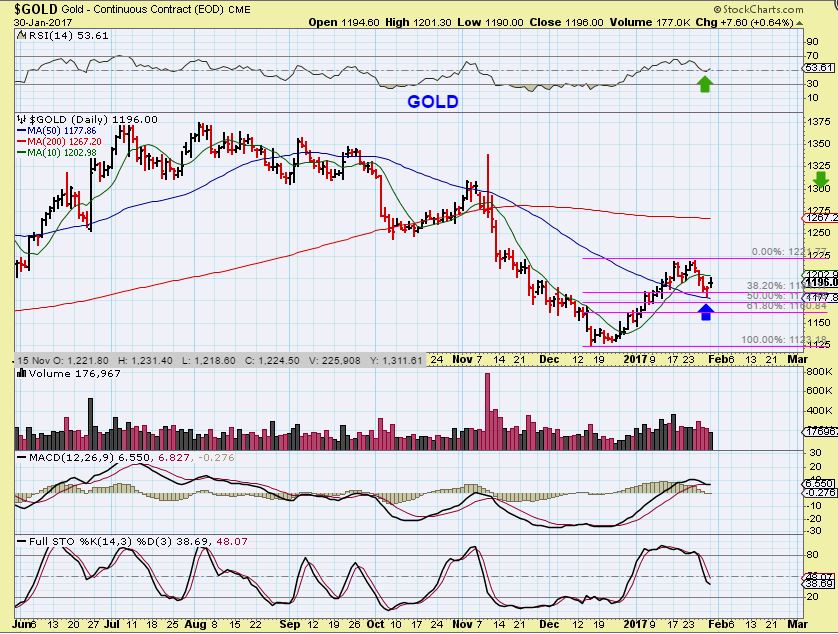
GOLD AGAIN – We had a doji Monday. Notice the 8 ema on the way higher. We are almost breaking back above it.
Reminder charts – These were from the weekend report
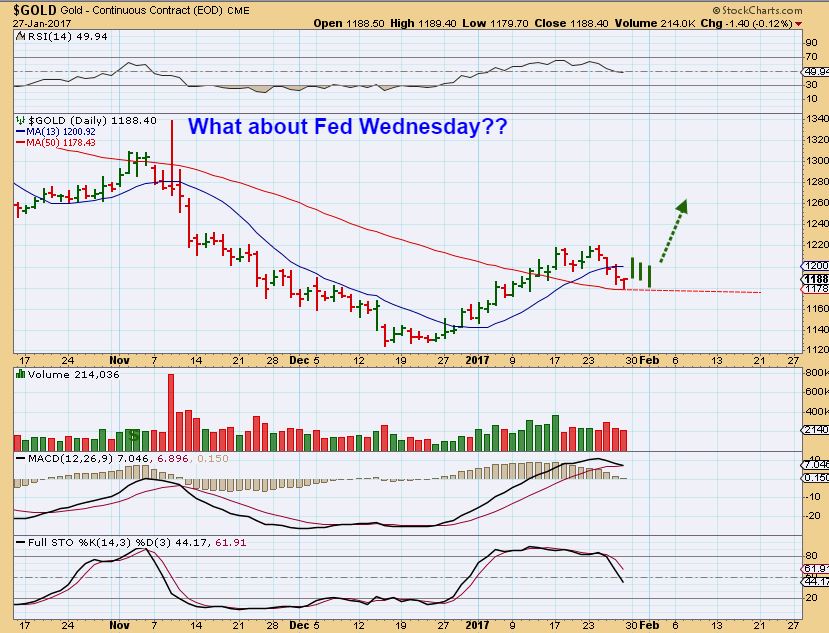
GDX – Friday we might have seen a swing low. No confirmation and Fed Wednesday is ahead.
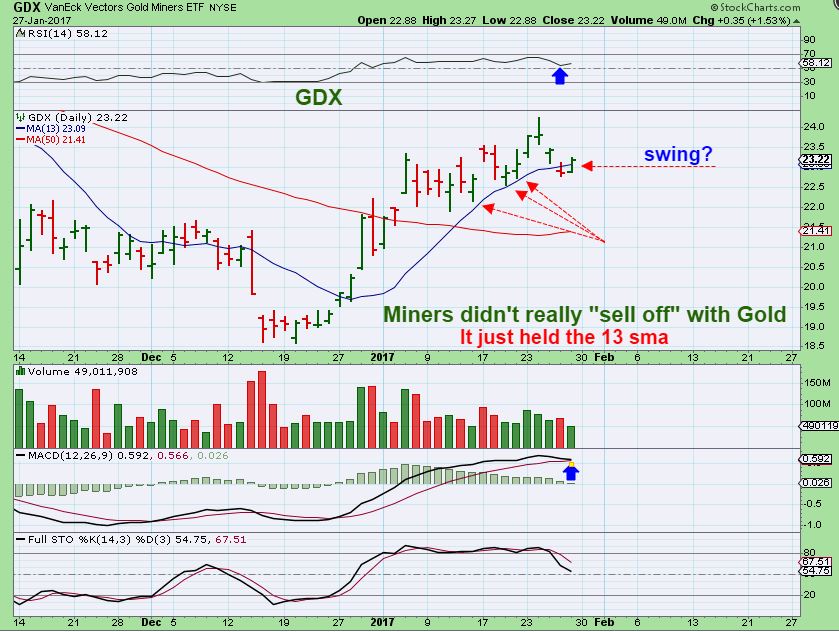
I JUST WANTED TO POINT THIS OUT IN CASE WE GET A QUICK DROP AFTER THE FED WEDNESDAY ANNOUNCEMENT. IF GDX DROPS – We had a 2 day false drop on Dec 14th, THE DAY OF AND THE DAY AFTER THE FED – And then the lows were in. Could it happen again this week? It might look like this.
We are pre-fed, what can I say? These are the charts, I am bullish Gold, Silver, and Miners longer term. We are looking for a dcl, and might get a dip after the Fed meeting, but I haven’t been selling and the wiggles are not scaring me. Enjoy your Tuesday trading.
.
~ALEX
.
THM dropped on Monday and I was asked, ” THM sold off today, did you sell?” Let me answer that, “No”. I didn’t buy it as a short term day trade, I bought it for the next run higher, and at this point it remains above my buy point.
THM Chart #1 – This is where I recommended THM. It crawled along the 50sma after breaking above it.
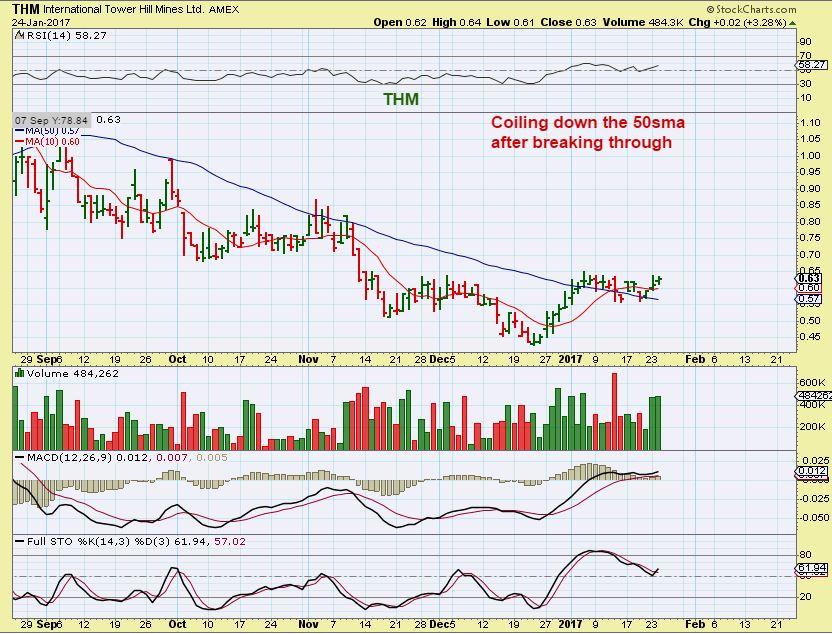
THM Chart #2 – THEN it popped and started to possibly flag. Looks good.
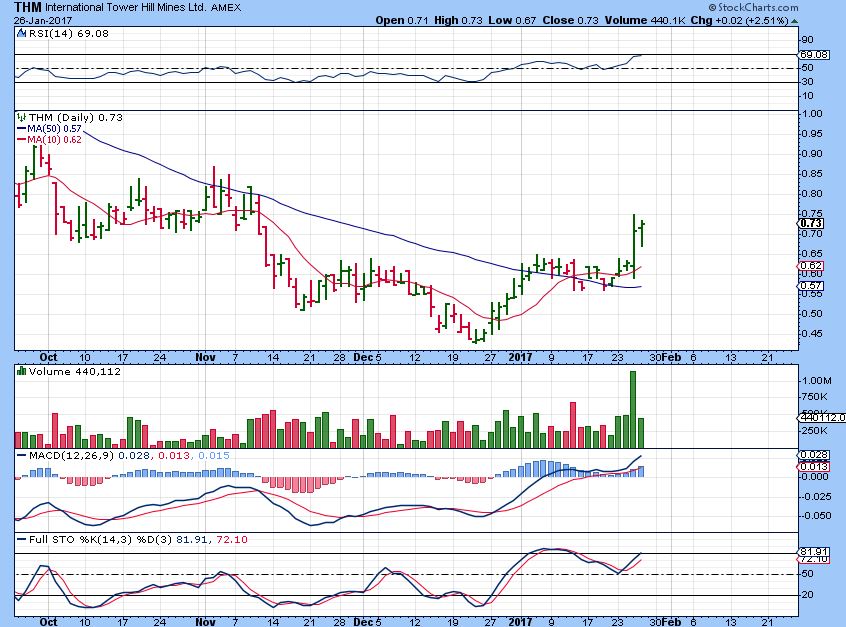
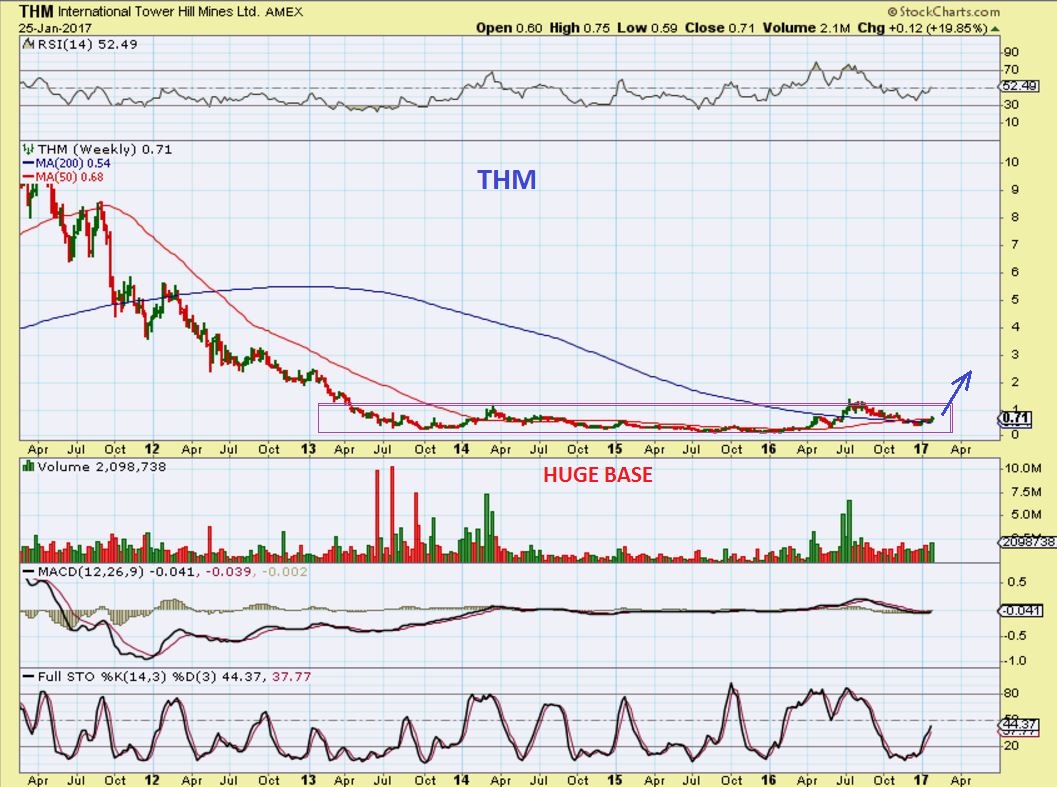
THM Chart #3– I showed the BIG PICTURE. We made good money on THM in the spring of last year and this could have great upside potential if we remain in a bull market.
THM Chart #4 – DID I SELL IT, because it dropped today? I accumulated it at the 50sma for the next run higher. Monday it dropped to the 10sma and basically back tested the break out of the inverse H&S. I am not selling the wiggles. In fact, it can drop to the 50sma on Fed Day too, and I still will not sell it.
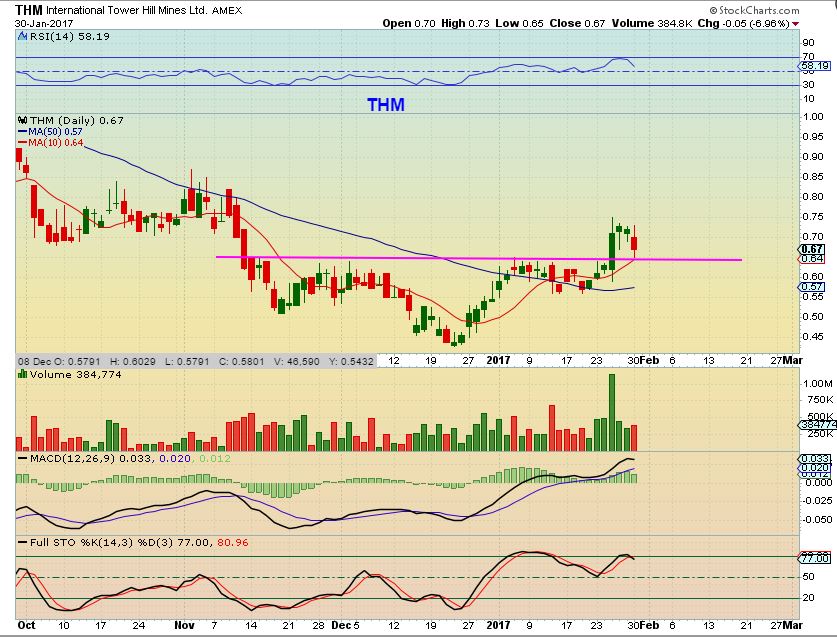
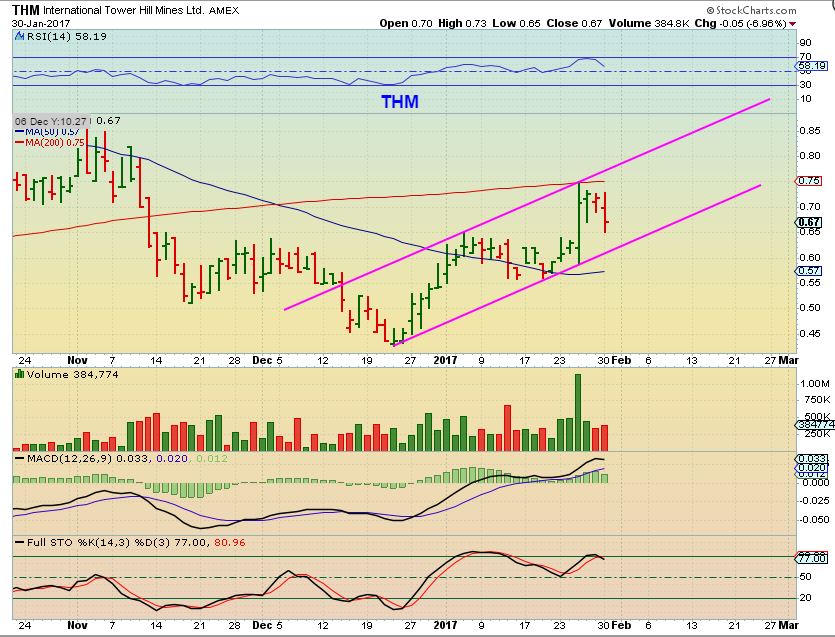
THM Chart #5 – ANOTHER VIEW- It can drop further and there is no damage to this uptrend.
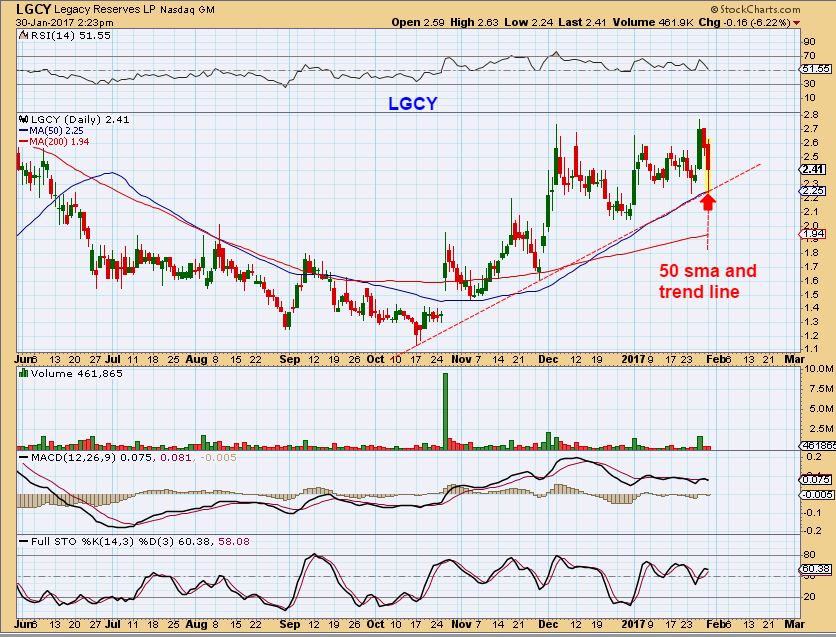
LGCY – Energy concerned me a bit today, and LGCY dropped too. It landed on the trend line and 50sma and bounced, so it remains in this uptrend and I’m still in this trade.


Alex, thx for the ‘calm’ report! GC trying to get above the 8/10ma this am. Wondering if it’s trying to get some space between the 8/10ma only to have a good plunge back down post-FED surprise hike and shake the bulls and get bears lathered up (and then bounce off the ma)? Leaves both confused and in the ‘DUST’? Just seems like the most painful thing that can happen to everyone right now…
…so it probably will. Love FED days….NOT.
The Trump administration just fired the first shot in the US-European currency, and thus trade, wars when Trump’s top trade advisor Peter Navarro accused Germany of using a “grossly undervalued” euro to “exploit the US and its EU partners”, the FT reported noting the comments are “likely to trigger alarm in Europe’s largest economy.” News of the statement sent the EURUSD surging and the dollar tumbling to fresh 2 month lows.
http://www.zerohedge.com/news/2017-01-31/euro-surges-after-trump-trade-advisor-accuses-germany-using-grossly-undervalued-curr
..another day….another dollar ……
#HB
Thanks for the news “effect” Bill. More to come . . . .
TX CF 🙂
Thanks CF, nice reminders!
DRYS ….. lol ……That will teach me !!
Miners don’t seem to be following gold in this surge higher…? At least mine don’t….
Hi Alex..
With Silver making new highs…do you think that was a half cycle we left behind…only to roll over, to starting a decline to a DCL either after FED or unemployment friday?
thx
Curtis, do you have any silver miners in your pocket you can share?
I have just been holding onto AG…but fully leveraged.. If Golds gets to 1240 I’m out on first sign of reversal.
Unemployment numbers will be worse – loss of xmas season jobs and snow . . . .gold goes higher.
Coffee (JO)
Moving Stop to the PSAR 20.88.
Currently in a wave 2 correction, hard to say how deep it will be….at the 38% Fib this morning.
Curtis,while this is not my primary view, it is in my opinion a possibility. The absence of a clear half cycle low until
perhaps here, plus it being an only 3 day dip instead of a week bears watching.
RIC looks great. Golds are up nicely, but not wildly – JNUG only up 7%. Is this a first hour fooler rally? I would like to see JNUG up 10% by the end of the first hour and staying up thereafter.
Another observation. GDX is up more than GDXJ. Could it be that bigger money is moving into the bigger stocks? Don’t know, but interesting. I have the buck on a new daily sell and gold/silver on daily buys. Another good sign. My acct is all green, up about 2.5%, between GDX and GDXJ. I am still concerned about what the rest of the day brings. JNUG now only up 6%. Should be up 10% IMHO.
Agree, I noticed that the miners aren’t really buying this rally in GOLD. Time will tell. Going to be a volatile week.
We are past the first hour and my acct is holding up and all green. JNUG is still up only 6.4%. I will be a happy camper to end the day up 2.8+%, but I still would like to see JNUG at 10+% to call it a great rally.
I hate to sound like a broken record, but JNUG is still only around +6.6%. I would like to see 10%. My acct, golds/silvers,TLT, is all green and up to +3% which is nice.
Just got back from lunch. Looks about the same although JNUG is at 6%. In an hour or so, maybe we will get a pullback?
Just noticed that although I am still all green, I have dropped to +2.3% up. JNUG is down to +5.1%. Maybe the pullback I mentioned above has come early.
Well, we got a nice rally very near the end. JNUG finished up 7.8% – nice, but still not 10. I finished up 3% between GDX and GDXJ) which is fine. Have a great evening and may the Fed be good to us.
Perhaps, Gold just catching up to miners.
Dollar made new low, but gold didn’t make new high. In my opinion, we are going to have to wait to see what happens with the stock market, whether this is just a short-term pullback or part of a larger correction. If it is the latter, we should see a bigger move in gold, since it has been trading inversely with the stock market lately.
TLT (Bonds)
Moving stop up to below the Wave 2 below 118.32.
Looking good…… 😉
Big move in TLT. I never play bonds.
Lol thanks for the input Bill.
Ya, I have nothing of value to add. Looks like a good call, enjoy
I actually would never do it either, however TMF is 3X etf which is ok making it worthwhile
the COT’s are great for TLT, Jap Yen, and gold
So that should be good the next couple of weeks
Do what lol ? Your still investing in 10 yr. bonds but with leverage…..
what i meant is that TLT is indeed a slow mover, so the profit might not be great
tmf makes it more worthwhile as it’s a 3 x etf
actually it’s the first time ever i m investing in bonds – the main and only reason i m doing it now is because of the COT s
Calls. You can play TLT calls bc the implied volatility greatly lowers the time premium.
I know. You don’t trade options. Maybe one day. And you are now armed with the information when you need it!
Thanks, Ken. I have TLT on an daily buy, but not on a weekly buy yet. TLT should move with gold for the near future. Bill, the advantage of playing TLT is that the moves are more serene. If you have enough cash and good timing, you can bet more with less stress. 🙂
Thanks Glmus, I guess that is what I was wondering. Why play TLT?
becuz……………. he is …… Bond………………………………………… Jammmmmes Bond ……………………..
*and his ‘tranches’ are the size of the Titanic…. slowwwwwwwwwwww moverssssss
*lmao
J.Bond is “trying not to respond” and your not helping !! 🙂
easy big guy… ;o) im just finishing lubing up and heading O..U..T. so ill be out of your hair…
doing my do diligence w/ the sunscreen…mommys cheeks got a litttle pink yesterday and i dont mean … well .. nevermind ;o)
#ShakenNotStirred
Wear that new hat and shades of yours…..looking good !!
Enjoy the sun and waves MVT. I could use a little sunshine ……
Thanks, Ken.
Your welcome Ed.
Theres TGD (insert smiling face)
NAK…making me very sad.
daily chart still looks healthy to me, seems to be an orderly pullback the same as it has after breaching the upper Bollinger band for the past 2 months. Let me know if I am not seeing something and should be more concerned.
Anyone want to invest in the future of mining the moon for Helium-3, Gold and Platinum ?
lmao drys…..omg
I know right !!!
BAA to a major dump on bad news
ouch
Hi all.
Is there some one in FCX ???? How does the charts look ???
Thanks a lot for your support.
I think a few of us are in FCX. not sure what youre asking about how the chart looks.
Currently in a wave iii.
Thanks for your response Bay. My question was; does FCX looks still bullish or bearish? (Is the charts healthy?)
Don’t own, but looks good to me. One could argue that there is a long inverse weekly head and shoulders complete and we are moving up, maybe a target of 23????? I have a weekly buy and today am getting a reinforcing daily buy.
THANK-you guys !!!
Looks like could zig zag but is a main player to hold long term, imo.
CDE weekly chart – looks great . . . . another main.
Also in FCX. 🙂
Silver (SLV) Count: https://uploads.disquscdn.com/images/3ad894ee0de38b32ff00e1f87a19ab7ea5f8c6256fdc51687ecab890bdacd8de.png
Right! Same that I have for gold. Question- what degree of waves are you tracking here? Could this be minor 3 of intermediate 1 (of primary 3, cycle 5)? iii (1) leaves us a lot more room to the upside, doesn’t feel like iii (3) yet.
Concurrance that Primary 2 should have just ended. In that case primary 3 should rip, and for some time. Still in intermediate would line up better with the current sentiment, imo.
Just wanted to mention this as I did not see it posted, but last week NAK announced that the Trump administration would approve their permits, the stock hit a high on that news of 3.45 the following day. The article also mentioned that the permit process takes 4 years!! So, I sold most of my NAK, down to 1/4 position. It may keep going as it technically still hasn’t broken, but that gave me some pause as I doubt Trump will be in office 4 years from now and they may never even get to start mining if the next administration prevents it! Either way, 4 years should give ample opportunity to buy dips, as they’ll need to raise cash, etc. It may get bought so there’s always upside surprise as well but I guess I thought it might slow its roll : ). I really hesitate mentioning a stock because I always jinx it when I do, but VITFF is a Canadian mining co that has all its permits and is ready to go with no controversy such as NAK has with environmental issues. It has started to act well and I don’t see it mentioned a lot. Do your own due diligence of course! Good luck everyone : )
Great piece Ann, thanks. I don’t buy and hold anything. Currently, NAK is on a pullback. There is a nearby double bottom on the 2 hour chart at 2.75. I would be concerned if that breaks. It is on a daily sell for me currently.
Of course, Ann, another way to look at it is that it used to take four years under a previous administration’s EPA. And I wouldn’t bet that Trump will not be in office through four years.
I will sell when it quits respecting the daily chart Bollinger bands (2stds,20sma)(pull back and consolidate after breaching the upper band to the 20 SMA and then move to pierce the upper band again, rinse wash and repeat). When it closes convincingly through the 20 SMA I’m out, and the weekly chart does look extended. But as a story and speculation stock at the moment with unfathomable real world riches, there are so many more headlines that can lead to explosive upside over the next 4 years (Pruitt confirmation, Pruitt mentions NAK, permitting process begins, infrastructure separate of Mining begins being built, NAK partnership, ect.) That I’ll hang tough with my 20 SMA plan. I could trade the swings, but I cant predict the headline timing. That’s my plan anyway.
TAMMIE – Sorry for the late reply, I just saw your question on yesterdays post.
CNBX – yes, it very much looks like it wants to break out & run higher, but with this sector there is added risk ( unknowns) so take it as simply a ‘chart read’. The chart is quite bullish.
Yeah, started to get it this morning when it was up 3 cents…but had to go to a meeting…came back…boom! I’ll just have to find another that looks like it’s gonna pop and not delay next time 🙂
It was around .84 when I saw that it had the volume that it needed, and the set up on intraday charts was good too. When I wrote this to you, it was only .84- .85 .
Believe it or not, The set up is one that makes me think ( Barring any bad news) it wants to go back to prior highs over time, Just about a double from here.
Yeah, the delay wasn’t on your part…:)…..I watched it this morn and started to get it…..but thought I’d go away and come back and decide…hahaha…but looking at it, yes, I was thinking it looks like it wants to keep going…
…and it’s still going……!
I hate to even tell you this, but I bought it when I looked it up, and sold another that had doubled for me since buying in Dec when I did my report. I dont like to hold too many of these, so I sold one and I still own EDXC and now CNBX. Medicinal reasons, I like the sound of the product. I did some research on CNBX – They have mentioned infusing Cannabinoids in a way that minimizes the buzz, but give the positive results in pills for cancer patients, etc If legalization of recreational MJ is ever threatened – this one may be OK with its medicinal value and lack of BUZZ.
http://www.marketwatch.com/story/cannabics-pharmaceuticals-announces-specific-ratios-of-cannabinoids-led-to-apoptosis-in-mda-mb-231-breast-cancer-cell-viability-2016-12-01-9183300?siteid=bigcharts&dist=bigcharts
I should thank you for asking me at the perfect time. That consolidation was set up nicely. You said ” I started to get it this morning…” SO I’m thinking you bought some, and didnt get as much as you wanted. Maybe this pop will consolidate like some of the others. MCOA always POPS and then goes sideways.
Also they are still tricky, you asked about CVSI – it popped ran , popped and dropped. So I am not going in too heavy, just holding a couple as they move higher.
I didn’t get any….:( 🙁 I am crying……..up 40% right now…..
Studied it last night……looked at it this morn…..had to leave….#wishicouldstartthedayover
Groundhog day is Thursday!! ( if you saw the movie, you know what I mean 🙂
hahaha! If only that worked in real life!
anyone think TRX is looking dodgy here?
these are the bottom 7 from my list as far as MA strength is concerned.
i dont like the company its keeping
https://uploads.disquscdn.com/images/1d5bc66df5eb5c93010190986a9669df5bd3594e8791c0a9ab728cfc08e31322.jpg
Recapitalization announcement by BAA today not going down well with investors. I bought last Aug for long term hold and they are way way into red. What does future hold? would love to hear other’s view.
any idea what happened to MGH ..now been delisted?
This is on Marketwatch: The Company decided to delist its common shares in light of its proposed change of business focus from mineral exploration to an investment company strategy as publicly stated on November 16, 2016, and after discussions with the NYSE Mkt. The Company’s common shares will continue to be registered with the SEC under Section 12(g) of the Exchange Act and, therefore, the Company will continue to be subject to the SEC reporting requirements pursuant to Sections 13(a) and 15(d) of the Exchange Act.
Dog for me as well…..Any thoughts
Dog for me too. Red. Very red. And I compounded it by adding more shares in Aug to get my cost basis down.
ill look into it
Would you like a new perspective? : ) I’m NOT yelling buy it, or if you own it, I’m not saying “Don’t sell it” if you want to free up more cash before Fed Wed, but especially …Read #2
I own it and I understand what you mean, when Gold takes off I also would expect it to be up a lot more than 2% today.
Here is the way I am looking at it
1. Needs to get back over that 50sma to possibly attract more buyers
2. ( You wont believe this) TRX from the Dec 2016 lows to Jan 2017 highs ran up 60% , and is now consolidating those gains.
3. The BIG picture chart is actually a great set up .
I’ll put this in the next report- I’m not stomping my feet saying that everyone should buy it, but I will show why I am holding it.
TRX sucks!!! They have completely sat out the entire move. I should dump but I’m buried. My only really red holding!
was hoping it wouldnt come back down quite so far
Add AUMN to your list as well.
And how about last 2 days in NGD. BARF!!
CF, I ran across NEOT – thoughts?
I personally think the chart is good, but there is a lot more to the pharma sector and I always do more due diligence if I am going to even take a trade. I have bought pharma or biotech stocks with good charts and been slapped around due to the FDA or Failing a trial, failing a test of some sort.
Personally – I would look at that 2 yr wkly chart and find out what happened in Dec 2015 – see if that has been resolved.
Also, OPXA long bullish base…
Surprising that FCX (copper) doing so well, but WRN sitting in the mud. I’ve got both and thinking maybe WRN wants to double bottom before running.
ASM really running nicely today. I only have 1/2 position though…
Me too, I bought it back when I recommended it in a report, and was going to add after Fed Wednesday
PLG also starting to do well again (Paused for a while since my recommendation).
CF, any thoughts on WRN? Thanks:)
consolidation ( could tag the 50sma before continuing higher?)
As soon as I wrote that , PLG dropped from up 7 cents to closed up only 3 cents. I NEED to remember to keep my mouth shut 🙂
SOG used to do that all the time for us as well!
Hi Alex, All! I can see scenarios where gold could go lower.
https://www.tradingview.com/x/TOiuJMY7/
Ans I can see other scenarios where gold could go higher (based on silver).
https://www.tradingview.com/x/C076kmAb/
Somebody debate me on why one of these is wrong.
The one higher could be wrong, because of the FED
The one lower could be wrong, because of the FED
J/K Bill .
I know, right. Pick the right one and youre a hero
If it makes you feel any better, gold is a “buy” (UP trend) on my daily chart. I use moving averages, TSI and other signals. I don’t use cycles. And, of course, all bets could be off after the Fed “news.”
TGD what a beaut today!
Tammie….CNBX Very Nice !! Well done…….
If only I had bought it…..had to leave computer….didn’t decide to jump in….yeah…
Hey look Tammy,
I just went back to my report. It was in my report when I covered a number of them.
Who knew back then, since it consolidated a bit longer. I bought EDXC, CBIS, MCOA back then.
https://uploads.disquscdn.com/images/6c6a61b0ebce74bfd6eb65c6338e9a37386133efe95a4b127867da6e2e118552.jpg
Hey look Tammy,
I just went back to my report. It was in my report when I covered a number of them.
Who knew back then, I certainly didn’t ,since it consolidated a bit longer. I bought EDXC, CBIS, MCOA back then.
https://uploads.disquscdn.com/images/f07dbc2086a64a57d891fcd353d958acd4b9df38b8b6392a7de12fb281e53370.jpg
Yeah, seems I remember it was in your report, probably why it ended up in my watch list….:) As you say, there is always another trade….I have several others in this sector – I need one of them to go up like this one did today!! I read the news on them every day to try and keep up with the latest, look at their charts every night for possibilities – I just should have jumped in when I saw that pattern that looked so good instead of leaving for my meeting!
CANL? 🙂
I was watching that one today…but….very light volume…so staying away. What do you think of PURA chart now? I have some sitting at a loss….but I have a side note to get more at some point (something I was seeing at the time I was looking at it was making me think it would be good…?)…..the 3 and 6 month charts look good (?)……but I don’t like the rounded look on the 10 day….
Actually, several of these I’m looking at have that “rounded” look…and then they pop…..for some reason to me it looks like inverted cup so makes me cautious at first glance…
It kind of looks like it wants to come back to 5 cents if it doesn’t go sideways and consolidate ( A handle formation type consolidation).
Well shoot. Keeping close eye on it since I have some in trading acct at a loss….been trying to pop in and out and not let things get to a loss at all……kept thinking this would drag out of the hole…
It just looks quite extended above the 50sma from that last run. It could go sideways and consolidate, but it is pretty extended. Hopefully I’m wrong .
LXRA…does it look like it wants to pop to the former high from back in 2014? It’s been going down/consolidating….it almost got there on 1/10 but fell slightly short and has been consolidating since then…..I want to get this for my trading account before it pops up there – 🙂 🙂 This company has teas and a couple of protein bars….
I don’t get a clear read on the chart short term. It already popped to the 2014 highs ( It doesn’t really have to hit it to the penny) . Looks like it may be extended and needs to consolidate.
Well shoot, I tried to make a correction and lost the whole thing….ok….I was asking if you think LXRP looks like it wants to go to the former high it was in 2014? It almost made it there on 1/10 but fell a little short of it…….then it fell some……has been consolidating since then….I have this in a retirement acct but want to get it in my trading acct again before the pop up – what do you think of that chart? 🙂
You DEFINITELY have put in a lot of time for research on these.
When you mentioned PURA – I hadn’t even heard of that one, and I had a list of about 40.
What a run that had.
I was watching CVSI since you asked, and today it broke the lower trend line, but I’m still keeping an eye on it .
Yeah….I sold my CVSI yesterday in my trading account because I didn’t like the looks of it…..I still have it in my retirement acct for longer term hold to see where it might go..
CBIS…..someone bought 323k shares after hours – I think chart looks good….they sold out of their inhalers they just released so are ramping up more production…I have this in both accounts – at a slight loss, I think I’ll be getting more in the morning….I think it’s going up…maybe…:)
The thing that I like about this is that it was at 70 cents a month ago on this chart and didn’t really do too much when I posted it. It went sideways an consolidated some more.
You asked about it RIGHT BEFORE it popped higher. I had lost track of it for a while.
It was a good catch, I wish you bought it yesterday when you asked.
Ya, me too 🙁 🙁 I’d have sold and put it to good use 🙂 Maybe they’ll be another.
BAA is not looking pretty I want to see if the dilution was a good move
XBI daily, full range of the pennant today. Likely upside breakout this week. Pull up 2 hr chart, down channel broken this morning.
#BH #HB
https://uploads.disquscdn.com/images/34f75be4abef66e38cd9503dc0365cf730aaf030772c2d14c179800f5b0f916b.jpg
LOL
UAA. Oh My!!!
Remember to check your earnings folks!! Also, not just Fed Wed, we also have Jobs Report this Friday. Time to stay frosty!
Alex….what you think of chart of GBLX? 3 month/6 month looks great…bull flag ready to pop? Deja vu…..I was doing this last night…on CNBX….:)
No…look at SRNA…that is a nice bull flag…..?
Hey so I sat out this whole Mary Jane stampede due to all of the comments about how volatility and potentially risky it was. Looks like I should have just plugged my nose and waded in. You seem to be REALLY into the sector based on your research and insightful comments. Too late to jump in? Have the fundamentals helped much or have you been able to trade straight off charts? Where should I start? Thanks!
No, not too late in my opinion…just getting started! I think the medical marijuana sector is going to be hopping…up, down, up, down – for quite a while! I do weigh heavy on the charts, but I try and pick ones that actually seem to have things going on – either a product or a good test result, something. I am trying to stick mainly to ones that would seem beneficial to people, although I do have some of the ones with infused teas and beverages (not that those might not be beneficial…just not likely very medicinal :)) The list of ones I am currently watching/or have some of: CBIS, LXRP, EDXC, RMHB, GBLX, PURA, CVSI, MCOA, SRNA…..I don’t have SRNA, GBLX, MCOA right now….but looking to get SRNA in the morning depending on how things look…maybe some more EDXC and CBIS. I have several in my retirement acct I am letting sit…..what I buy for my trading acct. I am trying to pop in and out of once I have a profit….I missed CNBX today big time even though I studied it last night with intention of getting this morning….I didn’t follow through….but the rest of the week I’ll have more time to pay attention….:) Sorry for the long rant 🙂
Tammie, do you have a rationale for holding some versus trading others. Currently, I’m planning on just holding. So far I have CNAB, CBIS, EDXC, MCOA and RMHB.
Yes….I am trying to make a little money in my trading account….to pull out and use. I don’t care if I have to pay short term gains taxes on it…..it’s income. In my IRA account I am letting them sit to see if they will take off and grow over time. I do keep an eye on those in the IRA acct and if it looks like they are going to be duds I will cut them loose (I read the news on them, etc.). I usually have the same in both accounts….it’s just that if it pops up and has a gain…I’ll sell the one in my trading acct to get the money out and keep the one in my IRA……kind of like selling partial and holding the rest….but in different accounts. 🙂 Then if the one I sold goes down and consolidates and looks good again…..I will get it again for the trading acct and do it all over again….at least….it sounds good in theory….hahahaha 🙂
I see. Makes sense. Thanks!
I’ve used that some strategy with miners, but not with MJ stocks yet. Working so far.
With MJ stocks, I hold only what I can afford to loose. Thus far one has doubled, another is up about 40% and the rest are about break even Not a big deal though as I’m play with somewhere between 500 and 1000 bucks.
Yeah, most of the ones I get are $500-1000….I started with just $350 and have worked my way up a bit 🙂
Yes, I think that’s the rational way to do it. But I’m sorely tempted to drop 10,000 in just to seen what would happen. Bad idea!
haha! Yes, I’m tempted to do that too!! Just once…?!!? hahaha…maybe not…maybe so….maybe not….
That was great, thank for sharing. I’ll build a chart watchlist from this.
Yeah, I saw the dialogue with CF. You’ll get the next one! A lot of times I skip on the riskiest ones and then bang my head when CF Gets it right and it pops before I buy. That is why I was so excited with NAK when I nailed that one (finally)!
pretty good, may be ready. MCOA kind of did that and didnt pop again yet, it went sideways – but GBLX dis pop and flag back to the 10sma. Also a reversal candle, so it could be ready