
January 10th – Additional Thoughts
After our normal market review, I wanted to share some additional thoughts about the Uranium Sector, since it has also been perking up and showing signs of life after a bear market sell off. I don’t want this to distract anyone from our current focus and trades, but my pointing out a few things here today allows the readers some time to do a little additional research of their own if they are interested. By the end of this report, you will see why I think this could be worth bringing up.
.
DJIA – No Dow 20,000 yet. This really doesn’t seem to be a true magaphone topping pattern, but it is close. A flat top pattern would be bullish, so I’m watching for a break of either blue line. 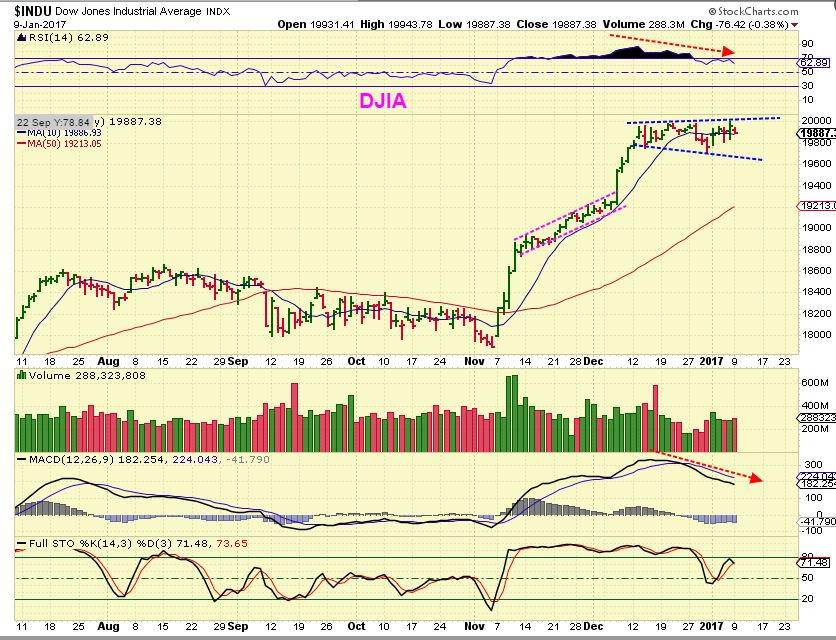
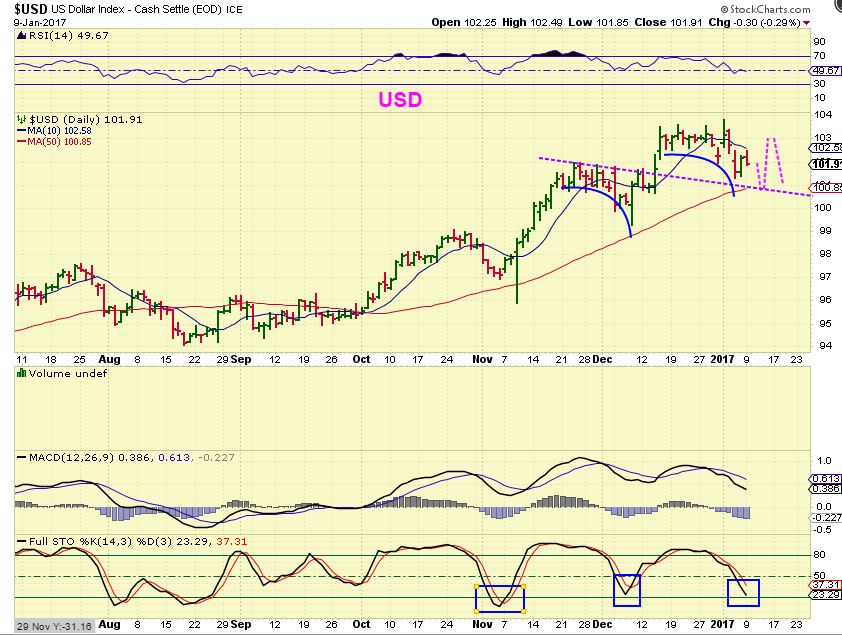
USD – The USD could still drop to the 50sma currently at 101.85
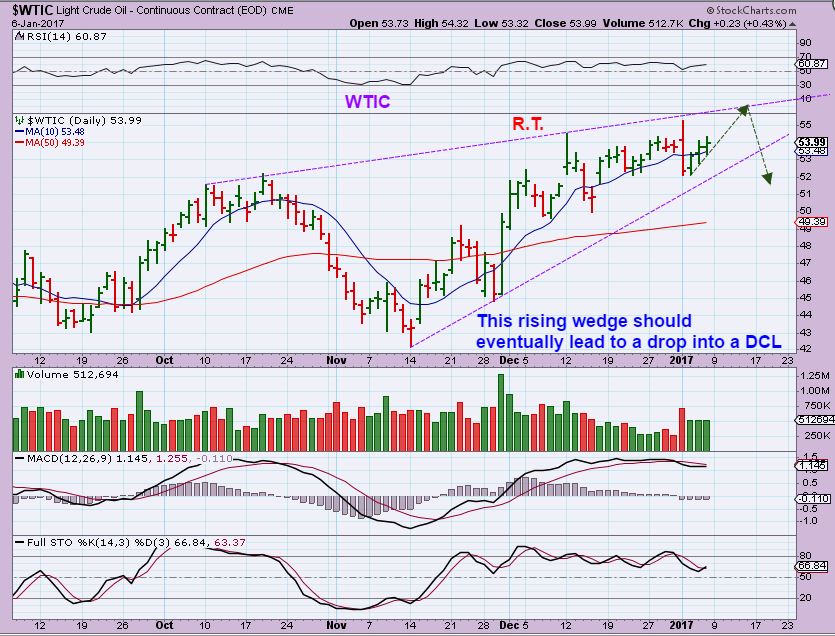
WTIC – In my Jan 6th chart, I pointed out this wedge forming and expect a drop in Oil into a dcl soon
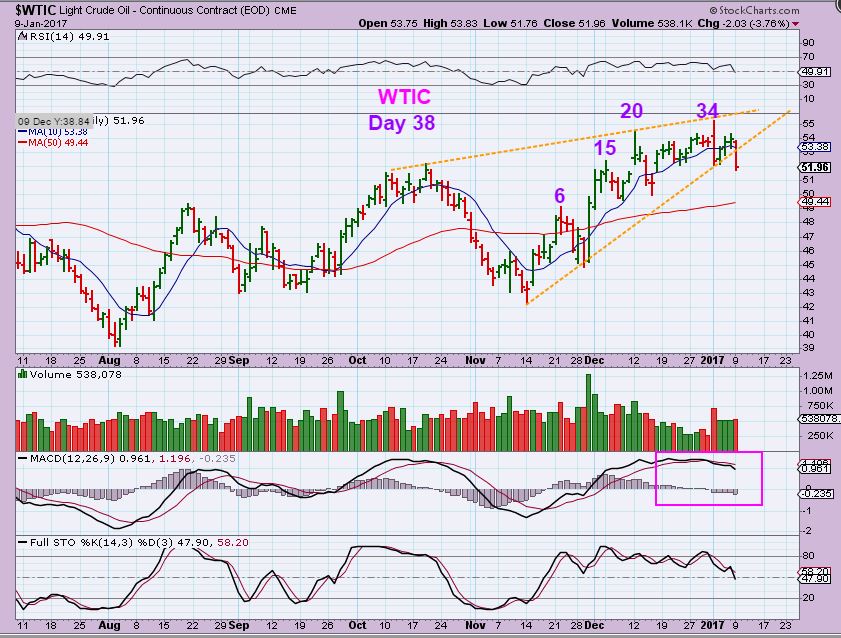
WTIC – On day 38, we see a fairly sharp drop, so that drop into the dcl may be starting.
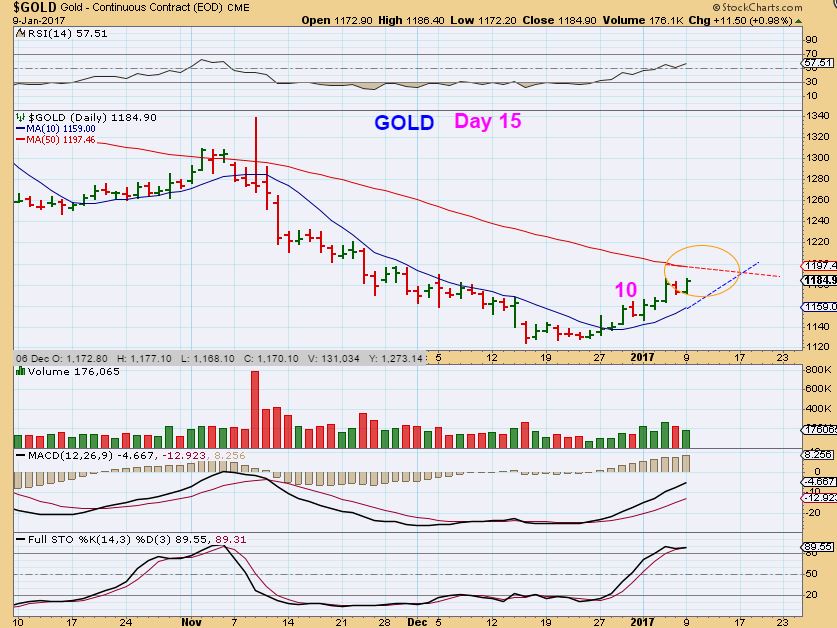
GOLD – Day 15 and GOLD is within the early timing that it could top and find its dcl anytime, but I would picture GOLD actually breaking above the 50sma first ( like GDX has), and then back testing it as the dcl. If it cannot take out the 50sma, it may crawl sideways for a few days.
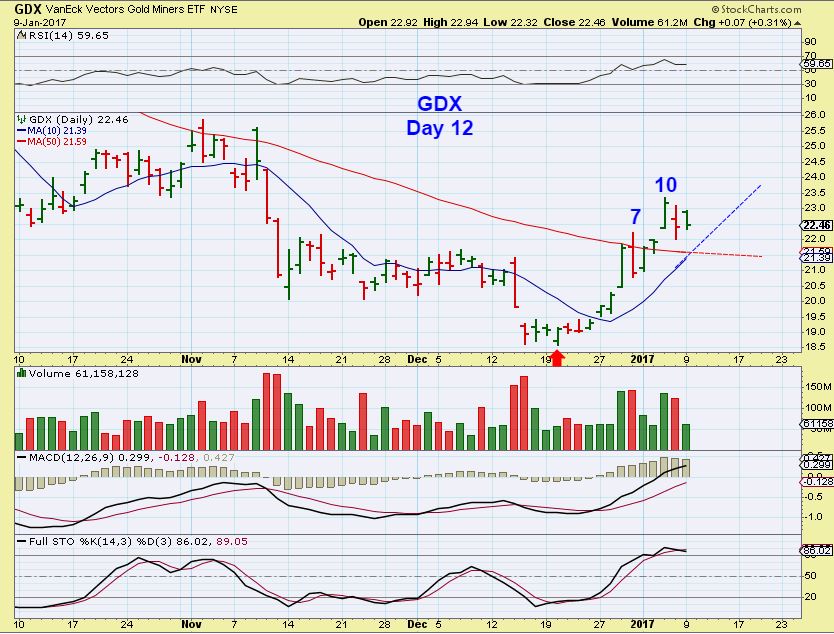
GDX – Day 12 and we saw some selling Friday and Monday. I called for this possibility , yet I also received emails asking how concerned I am about it. I am not concerned. I see them as normal Wiggles and noise at this point. People get nervous and sell when they see a dip like this and often regret it later. Look at this chart. Above the 50sma and 10sma,GDX remains bullish and price always wiggles around. Discipline prevents Fear from shaking one out. This remains a bullish set up and we are in the first daily cycle.
URANIUM
.
Many here know The DOC and respect his work. In November, he actually emailed me concerning the Uranium sector as shown below. His studies were leading him to believe that Uranium was bottoming. I listed the following stocks for us to monitor. I think the DOC was correct. These do look to be bottoming.
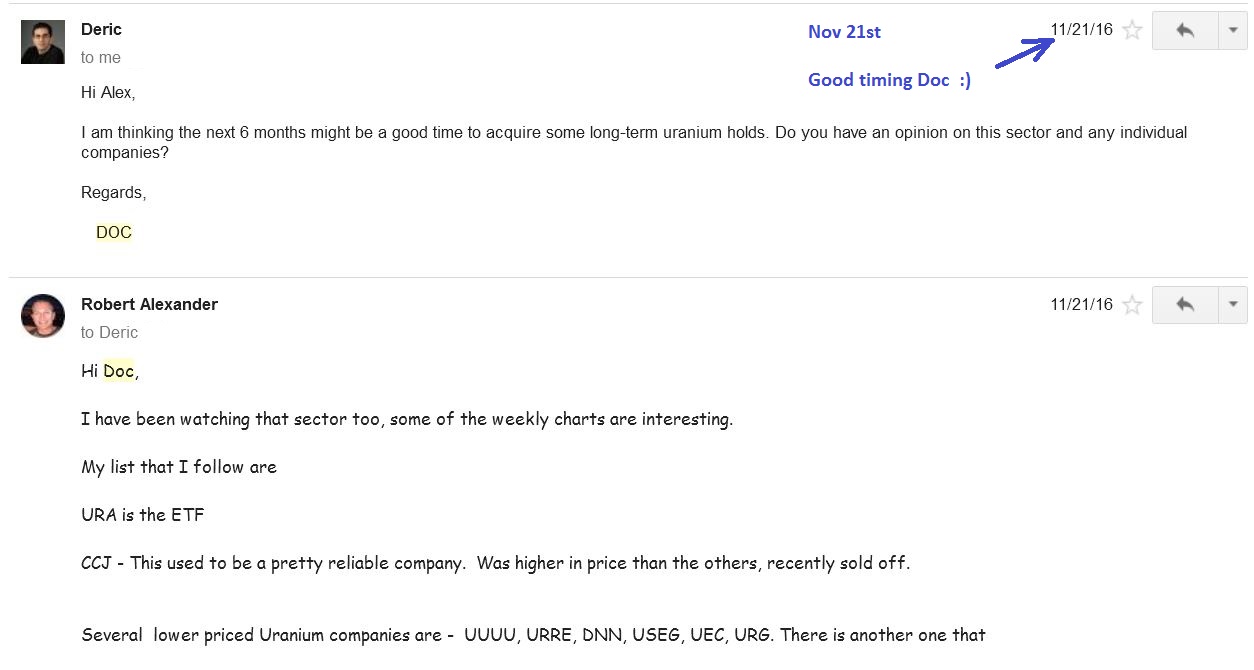
Notice that his email was Nov 21st, and lets see what Uranium has done since then. After a long consolidation in December, URA took off again. Is it done or is this the start of something bigger? Lets dig in.
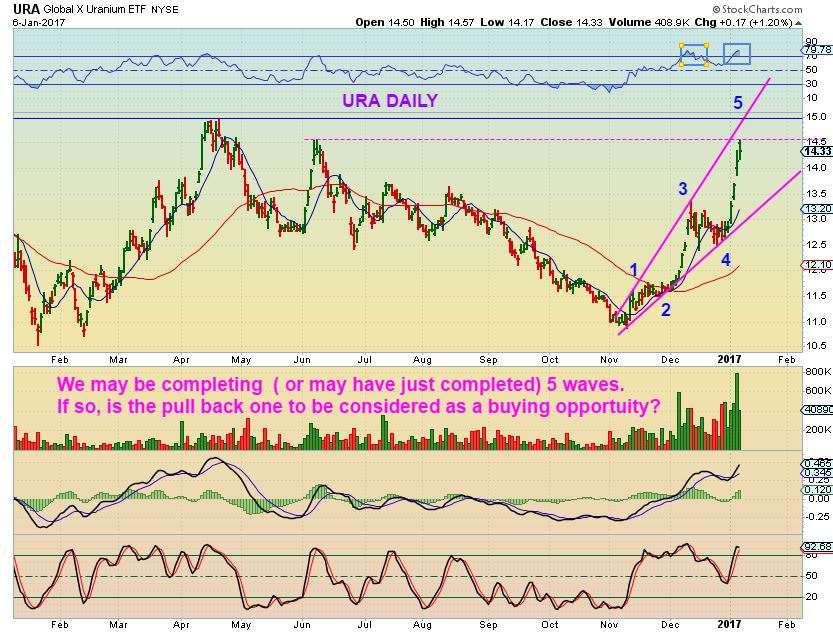
URA – Recently I posted this Jan 5th chart in the comments section ( Thanks to Ken too, for pointing out the recent action in Uranium in the comments section). At the time, I was watching and trading a Uranium stock and thought that we might have a little more upside left in URA, before a normal correction sets in. Notice the Magenta or Blue line would be a potential target(s).
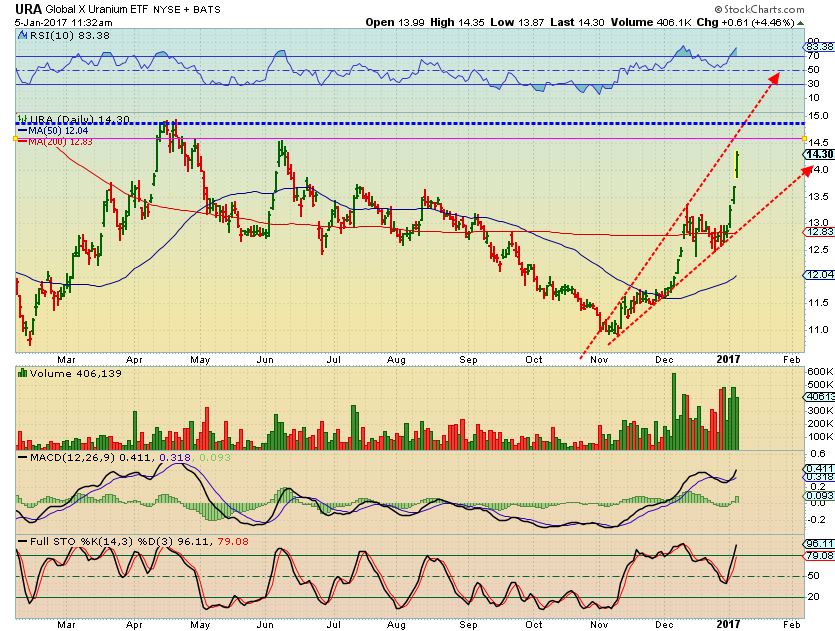
This is how I am looking at URA now …
We hit my first target and we do see a reversal, so we may begin to pull back. The RSI is overbought, but that and the stochastics can actually stay that way, so price could also just go sideways like it did on that 3-4 move. ( After 1-2-3-4-5, you would expect an a-b-c drop, but look at the 3-4 move. I can see an a-b-c in that, so again, we may just consolidate sideways. Why do I see that as a possibility? You will see on the weekly chart in a minute. What I am looking at looks like another cup & handle pattern on the weekly.
What I want to point out is that not only is the URA ETF acting bullishly, but several Uranium stocks are also forming bases or breaking out at this time. Since this sector has been very beaten down and unloved, it may offer some solid upside potential if we get some more short covering or follow through buying. Let me show you some of the progress that this sector is stealthily putting in.
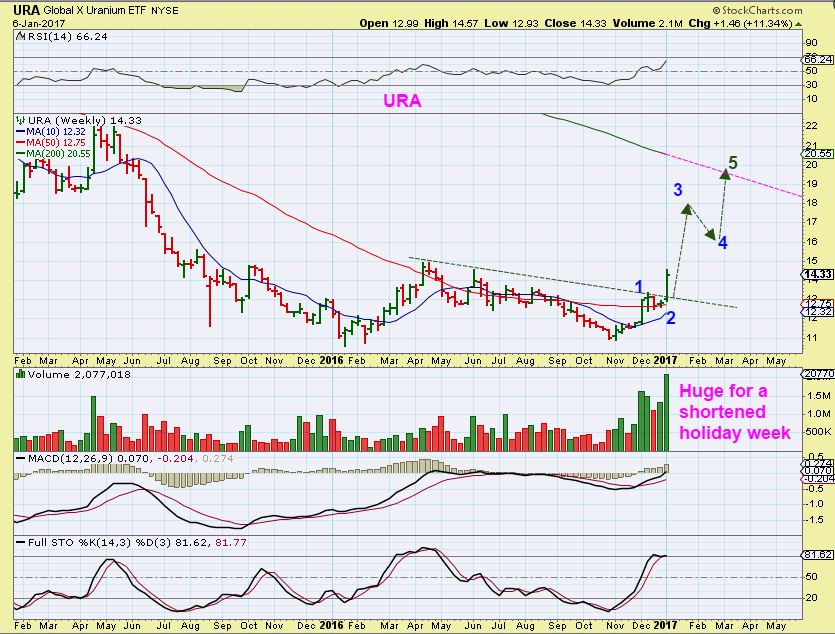
THIS is a chart that really grabs my attention, because the weekly is what I use to tell me a bit more of the big picture or longer term trend possibilities.
.
URA WEEKLY – Look at that volume for 4 days trading last week. This is actually a solid move from a 1 year double bottom base, with a higher low in November after a steep sell off. My 1-2-3-4-5 weekly count may or may not play out, but it would indicate that URA has plenty of upside left over the next few months. The weekly charts are NOT very overbought and this is a strong break out. The break of the GREEN DOTTED LINE is when I decided to bring this sector to the attention of the readers here. It is confirming its bullishness. We are focused on Miners, and I didn’t want to distract readers since the Miners should do excellent, but this sector looks to have double bottomed too.
.
Let’s look at Uranium stocks
.
.
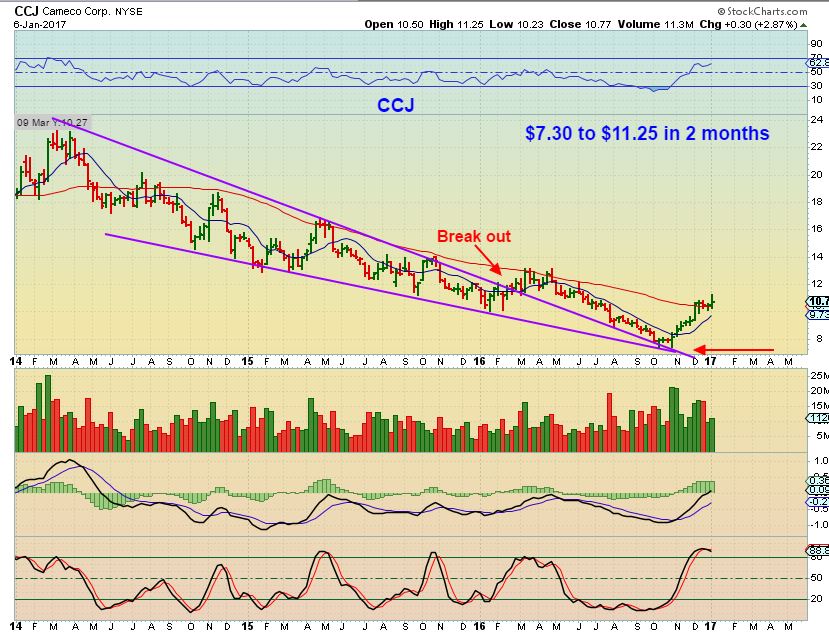
CCJ – For the BUY & HOLD CROWD? I’ll start with a higher priced company, now trading around $10. This could possibly double by the summer of 2017. CCJ was a $40 & $50 stock before the 2011 earthquake in Japan that caused a melt down of their nuclear power plants. That year ( 2011) is when Uranium went out of favor and started the bear market sell off.
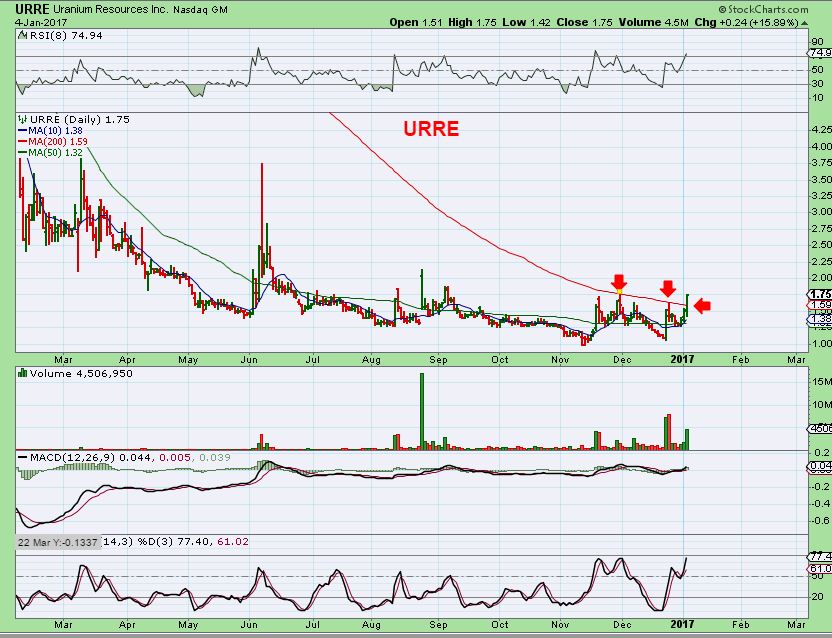
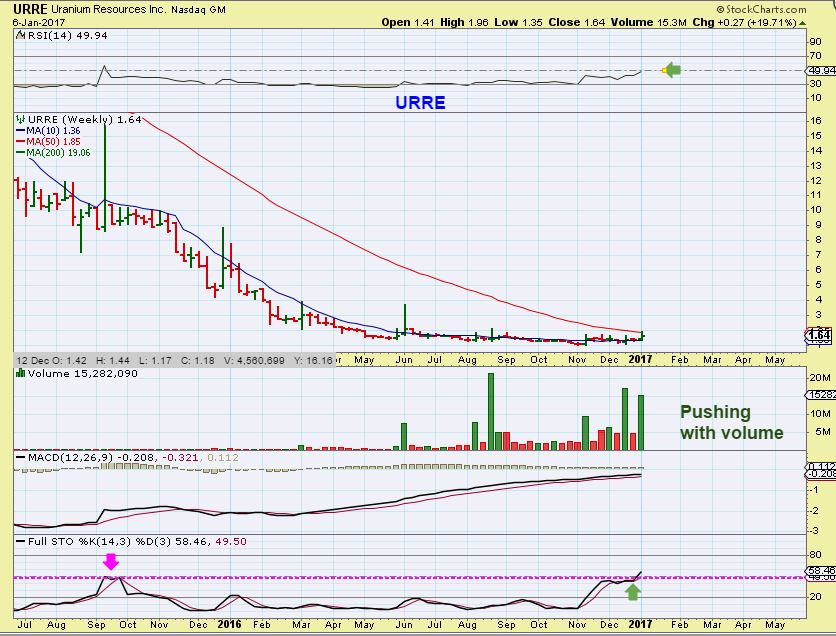
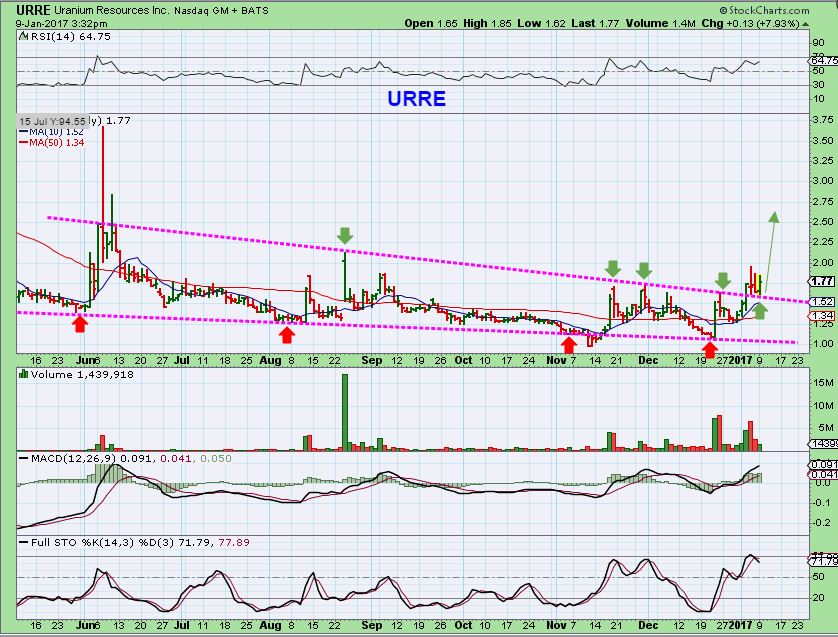
URRE – I posted 2 charts to show a set up that I think has future potential too ( I own it). URRE was breaking out above resistance, the 200sma.
URRE WEEKLY – It is pushing against resistance on a weekly chart and I still like this set up. HUGE potential if this runs strongly.
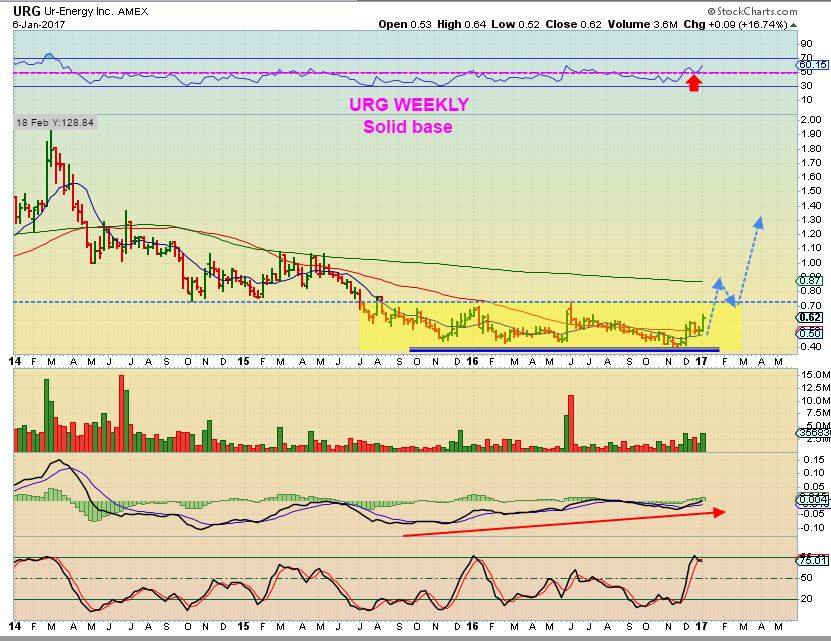
URG WEEKLY – URG trades under $1, but is not an OTCBB stock or Pink Sheet stock. It trades on the AMEX. I see very nice divergence in the weekly MACD. The set up looks like it wants to break from this base and attain higher price eventually.
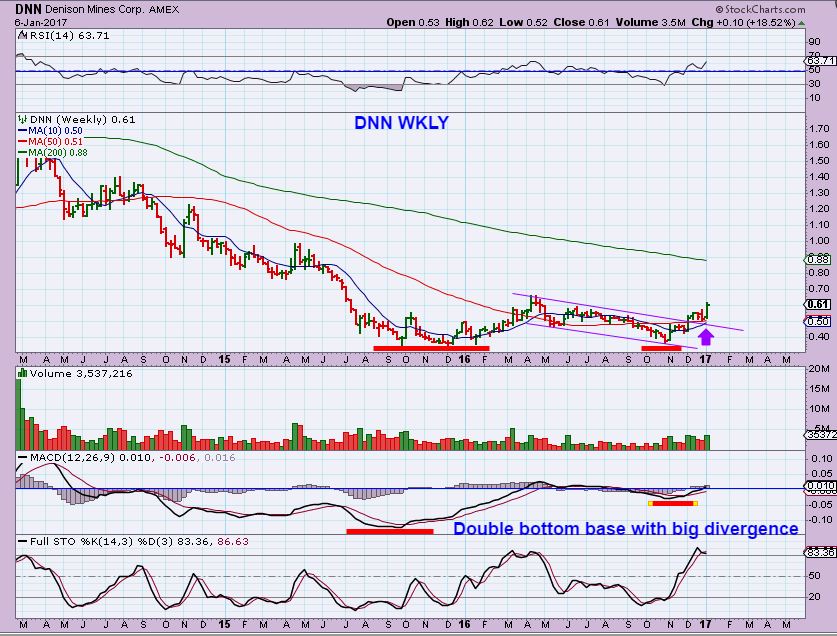
DNN – Also trading on the AMEX, DNN is another Uranium stock with a double bottom / higher low in November. DNN has broken out from a downward channel. These are cheap stocks trading under $1, because we have had a multi year sell off. As always, due diligence is recommended. DNN has popped up, sideways, up, sideways, up (so far).
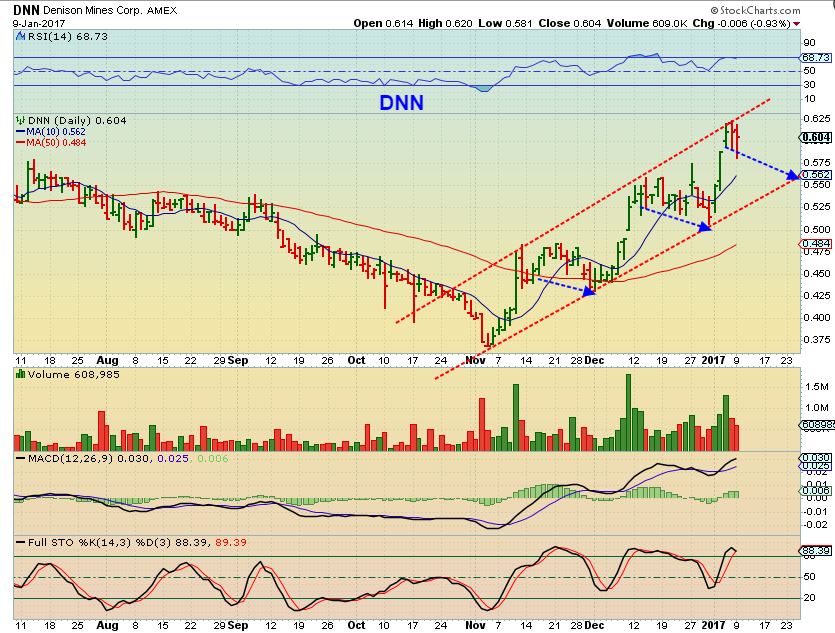
DNN DAILY as of Monday – A pullback may offer a low risk entry in time.
And
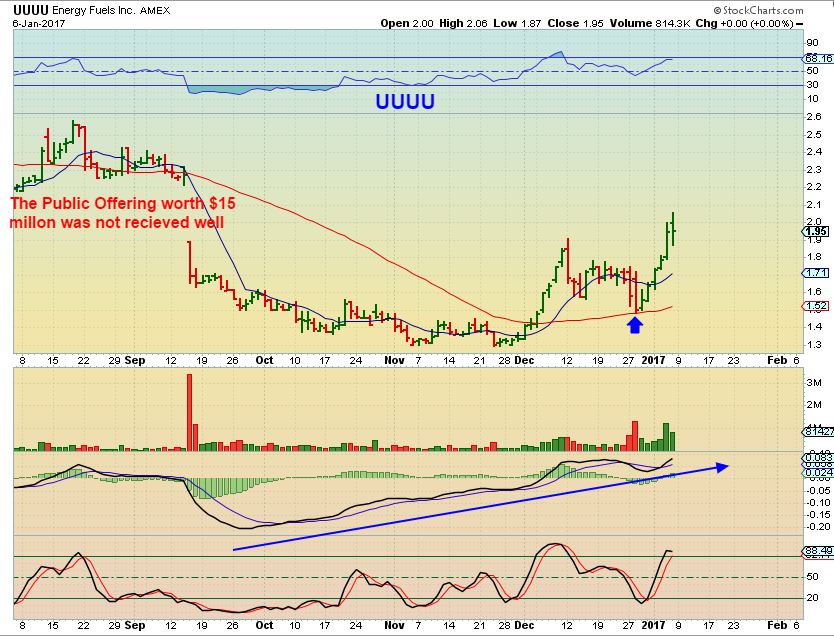
UUUU – Finally this stock. This one is becoming interesting to me.
1.UUUU did an offering and got hit hard in September. Notice the gap down slam on the chart.
2. As a result, management wrote a letter to share holders to assure them that the offering was carefully thought out and in the best interests of the company. Management basically says that they are share holders and have faith in the future of the company as they use that money for expansion.
3. In October UUUU (Energy fuels) intersects and discovers good amounts of Copper on their properties while considering expanding drilling. They now announce that this could be mined and offset other costs. They also find Silver, Zinc, etc.
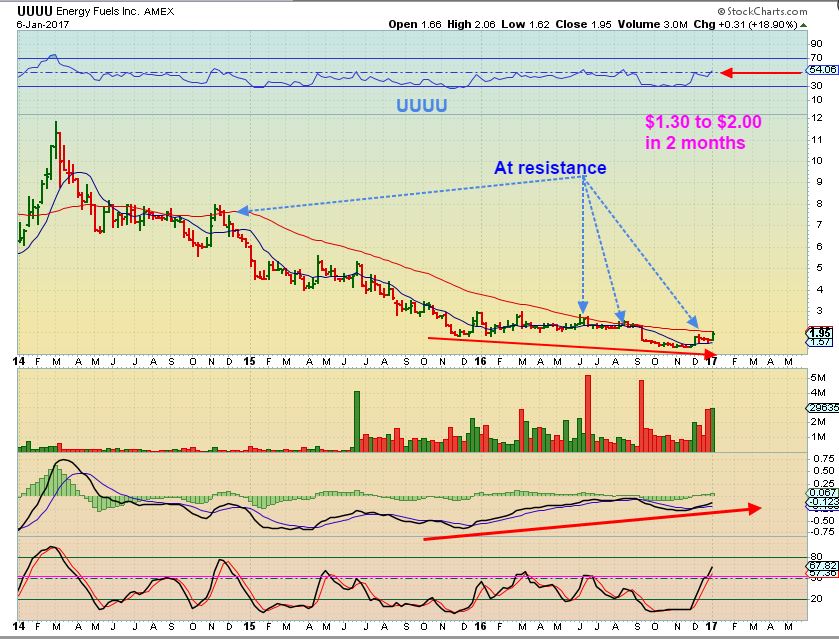
4. From December to now UUUU ran from $1.30 to over $2.00, about 60% in a month and 2 weeks. See the daily chart below and let’s look at the weekly chart too.
UUUU WEEKLY – So now this weekly chart also becomes rather bullishly set up in the bigger picture. It is a $2 stock. If it breaks out above the 50 weekly ma at $2.06? I think that that would really add bullishness to the big picture. Admittedly, it has work to do, but a $2 stock with this potential, like URRE, may be worth a try for some buy & hold. This sector seems to be coming alive.
So again, I am reporting on this sector because it has acted bullishly coming off of the lows since November. It is not just 1 or 2 stocks bouncing from short covering, but instead it looks to possibly be an entire sector that is starting to recover. This allows anyone that is interested to do some due diligence in this area, and look for pull backs to enter. I will try to cover some of these stocks if they continue to set up in a bullish manner.
.
CONCLUSION: I see several bullish sectors setting up to offer great gains to traders and buy & hold investors alike. I am happy with what I see, I do believe that 2017 is going to be another year that offers a variety of bullish trades in a variety of Bullish Sectors, similar to 2016. When Miners consolidated or dropped into a dcl, we went to Energy. When Energy pulled back, we grabbed metals stocks like X, AKS, VALE, CLF, and so on. By being alert and aware of the various set ups that formed, trading was excellent through out most of 2016, with the occasional lull in excitement. Now it looks like we may be enjoying that in 2017 too. You can’t invest in it all, so currently Miners look to be in the place to be. We are likely in the first daily cycle of an ICL / YCL, so Miners have time to run much higher over time, I.M.H.O. Enjoy your Tuesdays trading!
.
~ALEX
.
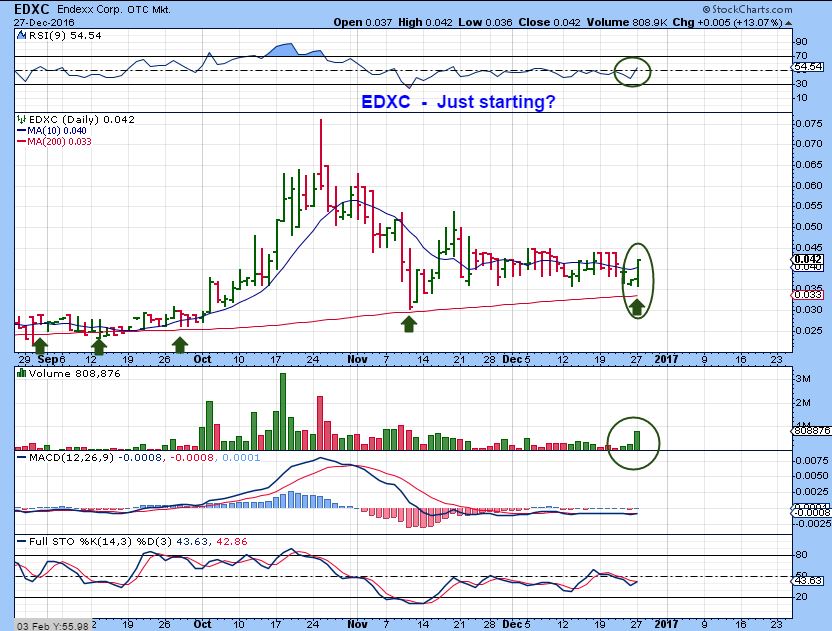
EDXC – From my report on Medical marijuana, EDXC jumped 13% and looked ready to move higher. I mentioned that I liked their story, with soft chews for animal pain and anxiety. Was this ‘just starting’ to break from the base?
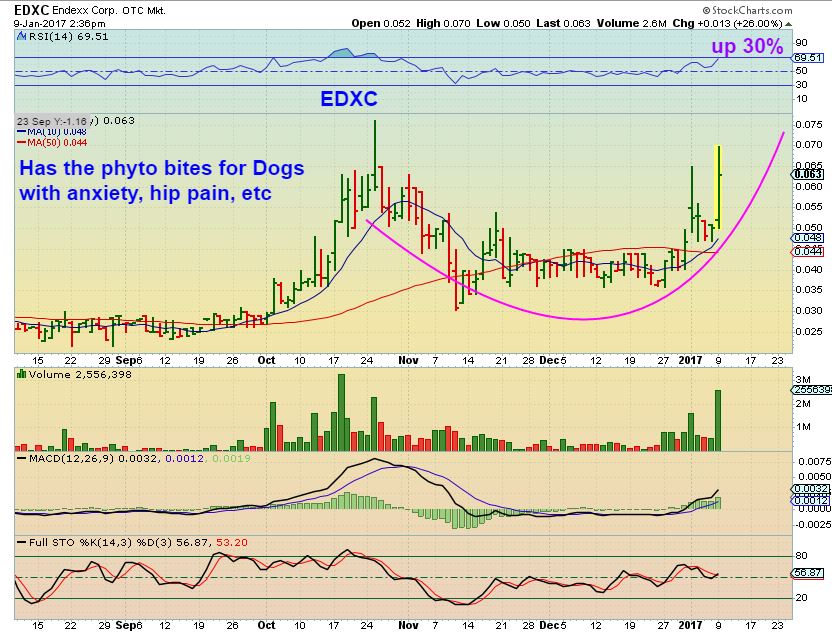
EDXC – Yes, and Monday it popped by another 40% by the end of the day. They announced 145% growth. A Cup has formed.
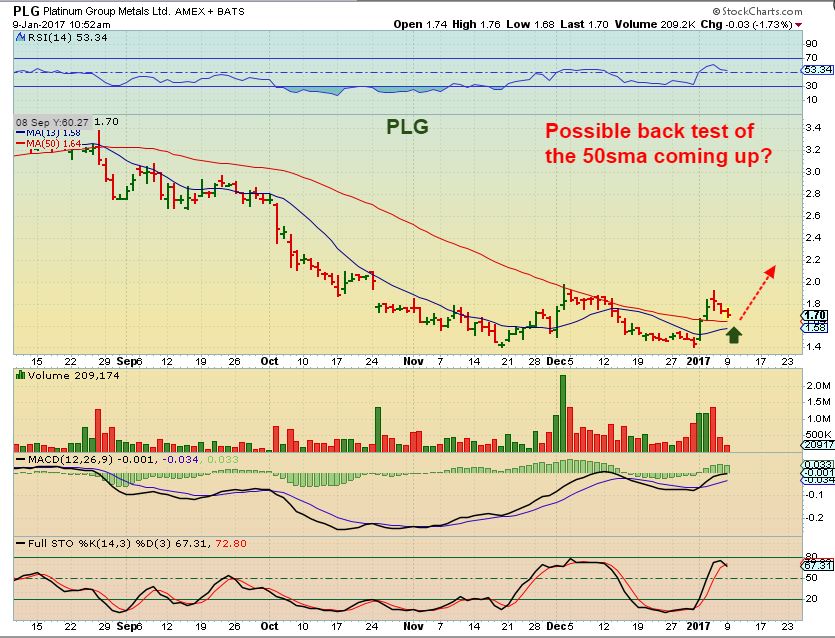
PLG – A Platinum stock. PLG looks like it is setting up for a low risk buy even today. Look at the volume as it drifts down to the 50sma.
URRE – URRE was breaking out above the 200sma, so I viewed that as bullish and low risk and posted this buy on Jan 4th.
URRE has been dancing on the 200sma and this is still a bullish break out.


Thanks for the early report and additional ideas for diversity! GL to all today! Ready for gold to take a run at 1200 now.
Thanks for the extra focus on uranium. They will go on my watch list. This is another reason your letter is so valuable.
Re the last hour gold share flush, it was very strange. I watch stocks ebb and flow, but this hour was different. It didn’t scare me out, especially because I think it would have kept going down if it was serious. Based on your many years of experience, have you seen many flushes of this ilk? Could it be manipulation? Other conjectures herein were computer related and news. Thanks. Gary
Seeking Alpha had an article yesterday about “black pools”…I just skimmed and here is one conclusion:
“Essentially, while retail investors were selling GDX on Friday, hedge funds and other institutions were buying it in dark pools. And over the last 10 trading days, the DPI for GDX was over 50% on 9 of them, meaning dark pool investors were net buyers of GDX on 9 out of the last 10 trading days.”
Though I don’t know a lot about black pools, but I have watched long enough to know the big boys don’t let things run till they are positioned. No prro..LOL….just observation.
Wonderful, Nancy. Thanks. I wonder why retail investors were selling. Why on Monday? Retails taking profits, still bearish,…? As I mentioned, since it came back yesterday and because my daily and weekly charts were not selling, I was fine, but puzzled. IF we have big money behind us, yahoo!
Copper running. Peep nak and the boys today
Just a note about checking the quality of the uranium stocks…I had traded URRE many months ago and it was in very bad financial shape…don’t know about current status. I had 3 oil sector stocks go bankrupt last year so I will always be checking quality this year.
Since Alex did a piece on MJ, here is news that I get. I don’t have a clue if it is worthy.
news@marijuanastocks.com
CLF is running
So are GORO and MUX – own both.
Vale & FCX too 🙂
gold over $1190
Alex, any thoughts on TRX not being able to hold any gains the past couple of days while gold has been up? Just consolidating?
Just went from .40 to .60…broke above the 50sma. I own it, I like it.
Another good day so far, looks like nothing to be done. Just a quick question for Alex, when do you look to buy a stock like UEC, up again today? I have some that I bought maybe a month or so ago until it proved itself, but now that it has, when does one buy? I have a tough time buying into 50% rallies even though I know those can be the best! What do you think?
Re ‘nothing to be done’, I agree. But my gains today are off 1/3 from their highs. I am always skeptical about the first hour, so I mainly sit it out. If we keep moving up in the next couple of hours, it should be a great day.
I kind of play stocks individually, depending on their strength and also depending on which stage of a run we seem to be.
I may add on dips or sideways moves to the 8 or 10sma, add on bull flags, etc – but when it gets too steep, it will eventually break through and possibly test the 50sma, etc. Then that becomes a buy the dip opportunity.
Uraniums are coming out of beaten down lows, and can get a flurry of short covering or buying interest and just go rather straight up like Our miners have in the past.
Its different for each stock with me.
Unbelievable volume on TRX today 🙂
I show 84,746 now.
Natural Gas looks to be breaking higher. Harmonic pattern in play should retrace to the 50% FiBo.
https://www.tradingview.com/chart/UGAZ/3yXviLc6-NAT-GAS-UGAZ/
Bill are getting the same Harmonic pattern in the underlying ?
NGAS? No, not as compelling.
Yep, I’m tracking that wave 2 “A” bottomed yesterday. So, we expect a decent “B” bounce then a washout to complete wave 2 before we get a wave 3 launch late winter. Just a possibility, but lines up perfectly with the chart you posted.
Count Update:
FCX: Wave 1 of 3
Coffee (JO): Wave 1 of 3
Uranium (URA): Wave 1 of 5 ….. very strong this morning but looking and feeling heavy currently.
FCX on wave one, or wave one complete?
FCX count: https://uploads.disquscdn.com/images/086e0107de7a4a1d624380299771b177a67b282b124396d0c6e65a7f5c2271f3.png
That’s quite a move higher to 3!
That blue 3 is NOT a target !!!!
Hmm! What is it then? I don’t know EW but if one went that high, wouldn’t it follow that 3 would as well?
Not sure what your asking…..
I do not have a price target for the top of 3, I have no idea where that will be nor does any one else imo.
I saw the 3 up there and thought that was your target! Doesn’t EW have the 3 wave at 1.618% of wave 1?
maybe ? maybe not ?
Again; I rarely use price targets, I use Sentiment, EW and TA (trying to get Cycle Theory in there as well… 🙂 ) to tell me when to start taking profits.
Fib levels are part of TA so sure it sure could go there but……..
That is often the case, but as Ken alludes it is a guide. Of course, there is really nothing firm or guaranteed in this business. Yes, 3 should exceed the top of Wave 1 when acting correctly.
Very strong volume in URA, now breaking above my second target in the report ( Not sure you read the report yet).
Check out the weekly chart 🙂
Getting there…..lol.
Ahh.yes she broke the April highs, I did not think that That would happen until the 3rd wave, Not complaining in any way. 🙂
Yes, and you see that weekly chart?
If this 1-2-3-4-5 is wave 1 , wow for wave 3.
Taking a little more URA off the table…….
UUUU doing it today.
Alex, any new thoughts on CLF FCX? Look to be starting to run.
Yes, CLF, VALE, FCX, etc looking good after dropping to the 50sma area
FCX , many oppurunities
Taho down 4%, I’m out just in case someone knows something that I don’t know yet
JPM downgraded it today
Yeah, that means they’ll be buying it soon 🙂
Very odd, it’s not acting right.
MTL is ripe for lift off ( See attached)
I bought it for a trial spin 🙂
.
https://uploads.disquscdn.com/images/6b16739dfc7193e7465764a19de611339413c0e3f7494dc4d0d2ebea79d49a21.jpg
And she broke her triangle to the upside….interesting.
I was watching that little bullish triangle on a 5 minute chart if that is what you mean.
Using a 2 day chart, 5 minute, Volume just surged, and now that daily chart has some pretty big upside potential too.
This thing moves.
That is what I meant……
Huuuuge move since August…..
This was at $6.18 when I captured it.
I believe it just passed the $6.50 mark. 🙂
Break that 6.74 high ! 🙂
LXRP up almost 13% today
I don’t know about ya all……but I STILL prefer the Old version of stockcharts.
YES
why, whats changed Ken?
mine looks just the same as it ever did (apart from the recent annotate stuff)
Yea the annotation has changed.
in that case.. yes i preferred the old one
And there goes our URRE. Up 20% and it gave us several opportunities to load up as it lingered around that 50sma break out.
Did I mention in the report that I liked that story with UUUU? : )
Nice looking chart CF.
URG is too ! wave 3 at quick glance
I went scrolling through the Uranium charts and they all have formed bases and now have some good volume buying interest.
I mentioned you in the report with a thx , by the way 🙂
I was watching the sector at a glance, and bought URRE, but your URA post a while ago had me revisit the while sector again.
Yes I saw that, thank you…. 🙂
The use of Uranium is Not going to area any time soon….very large potential imo.
what the…………… kisssy kisssy face
I CAN delete your messages if I want to 🙂
I am moderator – lol
uhhmm .. wassss that a statement.. or a question?
https://uploads.disquscdn.com/images/77fa343943d276de6266c41db0d98f1fbb46e1a411bcf778bba08b2cafbb3f9d.gif
Make her leed singer in your band for a song CF….I would Pay to see that !!!
ha ha ha… I only have sung Karaoke once in my life .. a ‘significant’ bday … i sang “what part of no” by LoriMorgan.. omg what a SCREAM it was… it was hilarious .. I have to say… apparently I thought i was on Broadway – and picked out a guy in the crowd (an old professor at the college i work at!!) and sang that sucker to him w/ every cell in my body… LOL .. omg.. GoodTimes 😉
….so i guess that makes me a ‘pretend’ singer in his pretend band…. ?
*u can be my groupy… HA HA HA HA
Wouldn’t that be fun ! lol
Hi Alex, I am looking to get a position in oil (USO or UCO). As the current cycle is R.T the next cycle should break to new highs based on cycle theory…however I am not sure re oil’s weekly cycles. Do you see anything that one should be aware of? PS: I am reading elsewhere that oil is due for a yearly cycle low hence my question
Well , the Oil COT is heavily short by smart money and we are due for a dip. I dont expect to crash to extreme lows, but I do want to see how the pull back develops before I would know for sure.
In Bull markets you get a YCL every year, but it doesn’t mean new lows every year, right? Gold running from 2000 to 2008 had a YCL each year ( An OIL to $110) , but it remained in a bullish uptrend, so I have to wait and see how things dip down.
I havent looked into it enough, but I will.
Great, thanks!
If you only pick one uranium stock I would choose CCJ. I owned it when trading long ago and did well.
I would strongly agree. Don’t look further. CCJ . PERIOD
Fundamentally and longer term holding, sure.
As a ‘trader’, I disagree.
URRE is up 100% from Dec 22 – less than a month.
I look for explosive set ups and enter at what should be a low risk point.
Many warned me about NAK too, “they don’t make any money”. I made a huge amount of money riding that ‘dog’.
URRE is now up 30% today alone. PERIOD 🙂
Agree. PERIOD :). By the way NAK is ‘horse’ 🙂
LOL… EXCLAMATION MARK!!!!!!
Where would you reduce your position on URRE?
I have no short term targets, so wherever you are happy I guess, but I may just ride it out as a longer term hold.
I believe that the entire sector is bottoming and you’ve seen the weekly chart that I drew. It JUST broke out this week on that weekly chart and it could get a bit silly on the upside. I dont want to miss it.
If I had a huge position, I’d sell partial anywhere to lock in the gains, but pull up a 2 yr chart. This could get interesting with that base. 🙂 ( or not , but I lean toward ‘yes it will’ , want to take that chance)
GREAT call on urre btw cf …. one of hundreds…….
Agree Seer….CCJ is very good but I will say this:
Over the last few years CF has opened up my eyes to smaller junior stocks in a trending sector, the gains can be quite large to say the least.
omg…what an ENORMOUS suckup (me sticking my finger in my mouth)
Be nice missy….. lol ….if ya don’t I might just jump on a third horse in that bare back horse race we are having with CF in the near future !!! 😉
#eating our dust
Pffff…. in ur dreams…. (me snapping a Z in the air)
holy… is this something like u have in mind…. ???? whew (wiping sweat from my brow)
https://www.tradingview.com/x/oa4IxnKC/
Riding it back up to $40 would be nice. It is the healthiest of the bunch.
I would say that if someone only wanted a safe play, they could go with URA too.
hi Alex,
what’s your thought on LIT etf looks like an inverse H S forming or do you see something differently ?
If your talking about a 3 yr weekly, yes, very bullish longer term.
1 year weekly looks like a break out & back test too
I see something very simialr Ray or maybe a possible cup and handle from the May’ 15 peak. Either way, I calculate an approximate longer term target around 35.0 given a clear breakout above 26.0. Thanks for that. Most definitely on my US watch list now. 🙂
Alex – you rock man. Up huge on VALE 7.89 entry) and URRE break of the 200… Thanks again, keep em coming!
You should see him Rocking Out on the drums…… 😉
ok… if u insist..
https://uploads.disquscdn.com/images/d564a60239eab1cc4b499e4632f2f34d33ca09e7760caaa00cd0583da6444844.png
HA! He looks so excited to be playing the drums, too!
We need a CF pic where he is excited. Like, my Uranium just went up 32% excited!
Thanks B.T.
Vale had a nice Pop today – unfortunately a gap that may or may not fill, but above the 50sma it looks good.
Alex, my gains on miners have gone lower each day the last three TDs. Look forward to your next update.
Probably just a breather 1 -2 days coming up before another rise up. . . .
Most everything that I’m looking at looks fine. These were excellent runs if you caught the lows in December, some are up pretty big. They have to pause , it is healthy.
Also – many broke above the 50sma, I ALWAYS get it in my head that they are going to test that area, usually the next dcl.
I should add to this that, yes, it is discouraging when we are coming out of the lows. We just want to get as far off of the bottom as possible and keep the gains to add comfort to the trades.
Most everything that I look at does look fine though, so far.
Alex, all, what do you make of the pennant pattern forming on the GDX hourly chart?
I’m not sure I see one clearly.
How many days are you looking at? I’m on a 10 day hrly – I see a H&S , but didn’t want to say anything 🙂
https://www.tradingview.com/x/QRDpjThg/
Yeah, I like that ! 🙂
Hey Bill. I see a bull flag on the chart you linked! 🙂 #BH
Well, the MACD looks to do a crossover UP . . . . . on GDX
Alex, on LXRP…if it hits th .71 high that was reached back 3 years ago….what is the likelihood it will move greatly after that since there is no overhead resistance? I’m assuming stocks like this will dance around that figure a bit back and forth before being able to push higher…but if it breaks free, is there a “normal” reaction that can be expected?
That has been a fantastic run, it could do anything….it could give it all up ( drop) because it is so far extended above the 10sma and 50sma…or it can bull flag ( see NDEV) , etc. it can iover shoot, – I’ve seen it all, but usually they pull back when that far extended over the 50sma. IN the case of these stocks, there is the exception like NDEV It is just putting in a high bull flag allowing the moving averages to catch up..
With parabolic moves, I always take partial profits, unless it is just a small position and you want to just see what happens.
I sold it in my “trading” account today when it was up by .09…..still holding some in a retirement account…..would love to put it back in my trading account for another run up to cash in on (maybe buy a little more next time….) 🙂 🙂 …but wondering if it hits that .71 …if it’ll run or pull back like you mention…..I guess it’s anyone’s guess …but….I would figure maybe there would be sell orders sitting in accounts that if it hits that price the sells kick in and drop price…..OR….some could have buy orders in if it reaches that? I started to get it again when it dropped down to only .06-.07 up but decided to hold off…..then it ran back to .10 up…..
Wow! Look at the EOD sell off! Glad I sold it in my trading acct earlier…..! But on the other hand….gives a good entry to get back in…but wow, not sure why sell off so hard….have to investigate maybe…
CLF is really a nice set up right now.
Landed right at the 50sma and now looks ready to break higher – Just thought that I’d throw that out there.
Vale too, but I hate the gap
yes… almost bought that CLF… almost… but .. waitn 4 a dip tomoro to snatch up some more miner miner 49ers…..
Yeah, I had some really solid CLF trades in 2016. My last exit was poor, so I haven’t wanted to add back in the consolidation yet. If I had gotten out closer to the top I would have added last week as a few cents here or there wouldn’t have mattered. #StillWatchin
I wish I released that Uranium report 1 day earlier.
CCJ, URRE, UEC, DNN, UEC, URG URA – all having incredible days, but some of the readers may not read the reports until the end of the day.
Traders want to consider buy the next dip
Very Impressive move today…..
URRE +28% today wowsa !
OH so MAD!! I read the whole report by 8AM sitting in my car in the parking lot at work. Decided I was buying URRE then work got crazy and didn’t get to my purchase. Missed it! I need to tell them to buzz off that I’m doing something important – trading with the CF crew! #Trader’sLife
CF, surprised WRN not joining in the copper fun with FCX running. I own both and added touch more WRN today.
Me too ( Surprised and own it) but it does look good when I set up the 13 sma.
Crude Oil (USO)
Wave 4 corrective currently occuring into an ICL possible CF?
I believe the ICL is coming due in the next few weeks?
nice……. that will be exciting.. annnd i will be on vaca and can watch… ;o)
Pool side I am assuming…. 🙂
I will be still playing in 3 1/2 feet of snow ……..
indeed…………………………….. or under a nice palm tree w/ a cooler and a cold one… orrr on the beach w/ a cooler and a cool one .. orrr .. in a .. well (insert anything here) and add “with a cold one” ;o)
cell – check .. tablet ..check .. laptop .. check.. wifi everywhere
#Good2Go
Note2Self: get some sunglassGrannyReaders … lol
Just bght. a pair of those myself…. lol.
Hope you all got a nice rally in the last half hour. Have a great day. Gary
Overall, not exciting for GDX but GDXJ has been up nicely last 2 days without being explosive. As long as we don’t have these murderous 15-20% down days, I’m cool with a slow drift up. Only sucks when you can give 4-5 days of gains back in 2 hours (let’s Not do that).
Alex, would you now put stops under the 50 day on miners, or only hold miners that are above the 50 from here out? Just trying not to take another licking. Taho hit 11 last Thurs, now its below 9 and under the 50 day. Just wondering how you might place stops if you were holding taho or something similar for instance. I know I’ve asked before, but I rode all my miners all the way up and all the way back down this year. I can pick the bottom pretty easily but I’m always giving back too much and I haven’t heard a good method or system for exiting. Thanks : )
Ann, you’re in good company – I find this tough as well. If we have a close stop, you could lose position at the DCL drop and then miss the next daily cycle up. But if you have no stop and we get a suprised (uh, like this past Nov) then you could get in trouble quickly. I don’t have the answer. But, my best scenario is usually having a large enough position to take partial profits then hold the rest. Hard then on a drop the add or stop. BUT, if you take some off the table you get a nice cushion, stop can be looser. Then, for example, we lose the 50 or don’t like chart anymore, exit and you still have 1/2 profit instead of nothing. Also if it takes off upside you limit your total gain but you don’t miss everything either. Not always easy with lower total $$ accounts as additional trade commission will eat into profits.
Good discussion and always difficult. My tendency is to try to cut back fairly severely as we approach the DCL. I then try to add back fast once the low is in. But as everyone knows, the timing is very difficult. So I think holding something is important.
Hi Ann
Taho was a real disappointment. I liked the company and especially coming out of the lows I would have thought that it would do better.
PERSONALLY – I am using mental stops and I dont plan on selling anything unless it starts acting very weak, like taho. Taho has big red volume on the selling and it is weak, so I would just take the money and buy another at the dcl.
In the past ( Like Jan- March for example) the first daily cycle just kept climbing and only did a sideways type dcl. I dont usually sell into a dcl in the first daily cycle bcuz I don’t want to lose position
Thanks Alex. You seem to be able to time your exits so well. I bought Nak when you did, I saw the set up. But at $1 I exited half my position, only to see it rise 50% more before topping out. I was able to add back around 1.18 a few days later (luck) then on the day it topped at 2.60 it never occurred to me to exit at all and rode most of it back to where we are today. That’s my dilemma : (
I didn’t exit Nak at the top either, I sold partial ‘near’ the top. I do take partials , and it is the hardest thing I do. Buying lows used to be hard, but now it is easy. Selling during a strong run? Very hard, because it always looks like it is going to keep going ( And at times it does, remember that CWEI trade that I exited early).
You added back at $1.18 and it’s at $2.08. That is excellent trading . Nothing is perfect, but that was a good trade and over time, selling partials on bigger positions running strong and trying to get back in on dips could become easier.
Ok, thanks. I’ll keep working on it!
GDX hasn’t done much in the last 2 days, at least certainly hasn’t held on to it. So, wanted to look at the GDX:$GOLD ratio. Pulling it up on the daily looks like it’s just working off overbought conditions while fighting with the 200-day. I see a bull flag. The 2nd chart is GDXJ which was had a higher level of relative strength this week. Currently the GDXJ ratio looks more like a running correction.
*F5*
https://uploads.disquscdn.com/images/671c3f5f70fb2b5cae4ec5da676b0e17f91199152787e6e2d59f3adec2450a95.png
https://uploads.disquscdn.com/images/c30914af7ed7b987e16213c829fe86ff9cf32a34afa9235ede8cf73f19f4c30e.png
Yeah no kidding! I logged off at 2:50 thinking everything was great, came back after close and was wondering what the heck happened!
Thanks Maria. And you too. 🙂