This is just a little Friday report to toss out some Reminders about what we will be looking for next week.
.
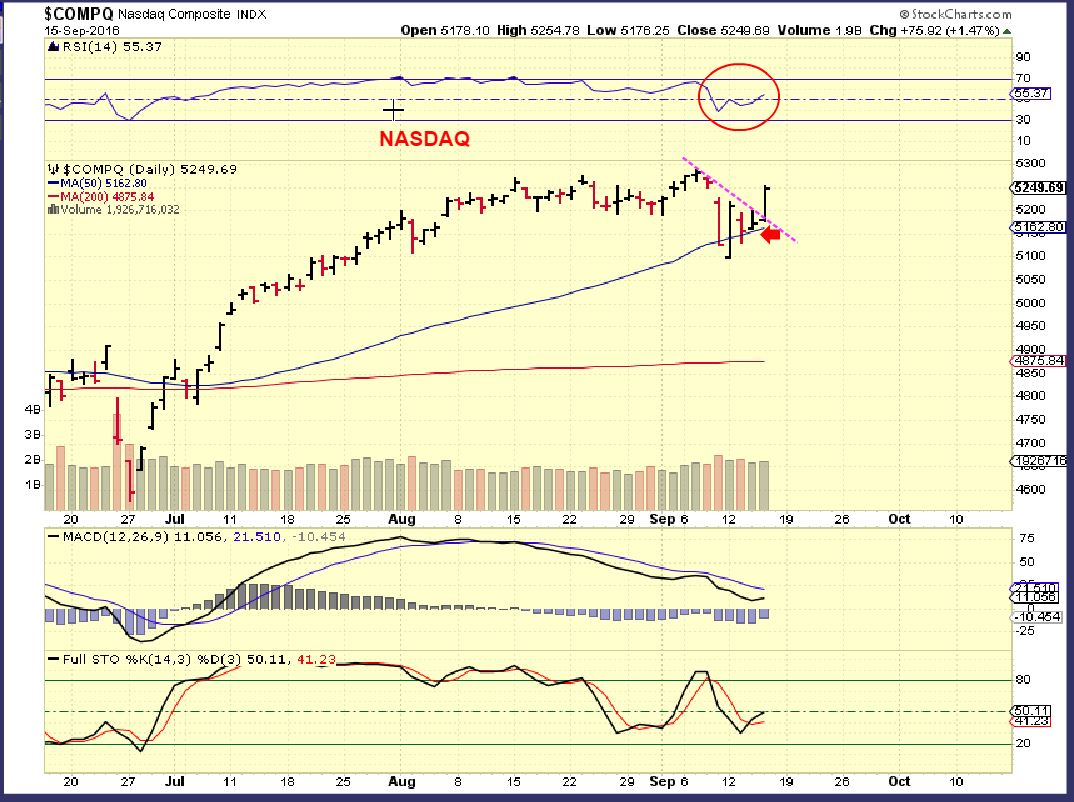
NASDAQ – I have been mentioning that cycle timing indicates that we should have a daily cycle low. We don’t have one in he SPX yet, but the NAZ may be leading the way. The SOX is very bullish, and the NYA, RUT, DJIA, etc have also put in a dcl.
Read more
Volatile markets and choppy sideways action, which way will the markets break? As daily cycles begin to age and the FOMC meeting approaches, it may be best to listen to the words of the gambler – You’ve got to know when to hold ’em, know when to fold ’em, know when to walk away, and know when to run – Kenny Rogers . I am scaling back on trades going into the FOMC meeting next week and wait for the fat pitch, the ICL in Precious Metals.
.
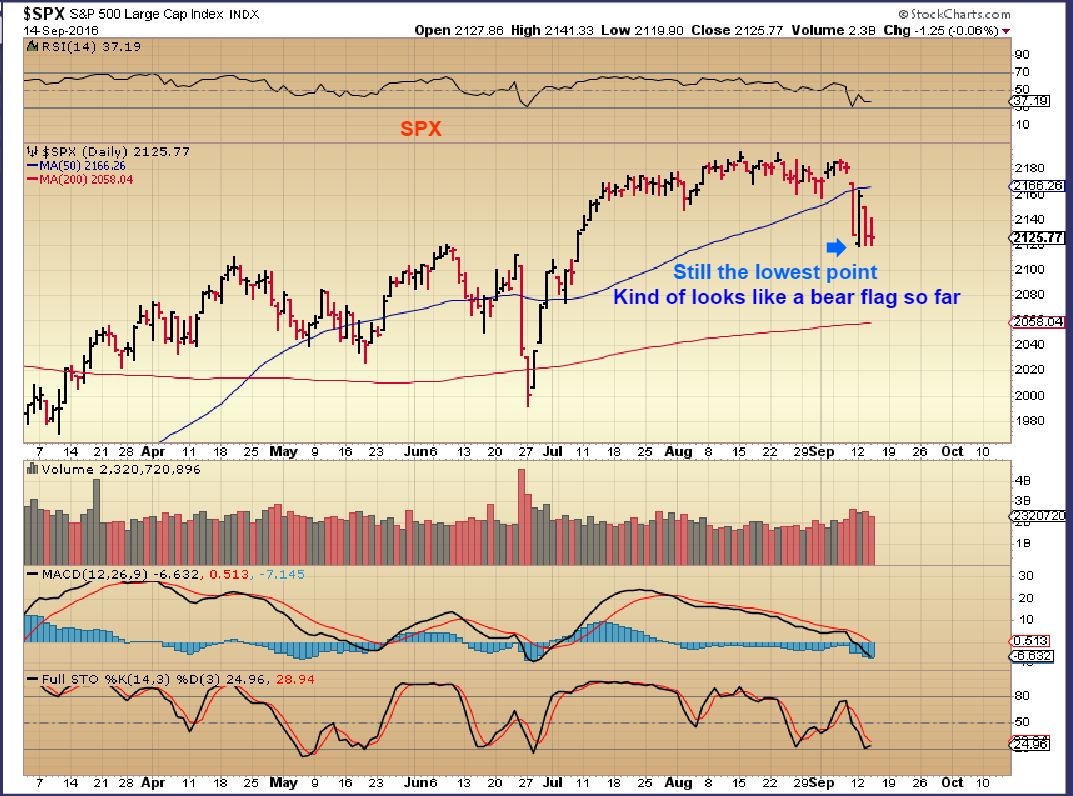
SPX – DCL? Bear Flag? FOMC? The general markets are due timing wise for a dcl, but I’m looking for a sign of strength.
Read more
The Tuesday report was discussing the recent volatility. Sideways chop is frustrating and newer positions are hard to hold, until you get a nice directional move. We are currently seeing strong volatility now. Lets take a look…
.
SPX – The lows from Monday were not taken out, so that still could be a dcl, we just do not have confirmation.
Read more
When the markets get volatile, trading short term can be difficult for some. Buying low one day works out well, and then you may find yourself watching the gains evaporate in a quick drop. Friday was a quick drop and then Monday was a rip higher for the general markets, and Energy and Precious Metals are also a bit jumpy. Lets take a look and see what we can see in the charts.
.
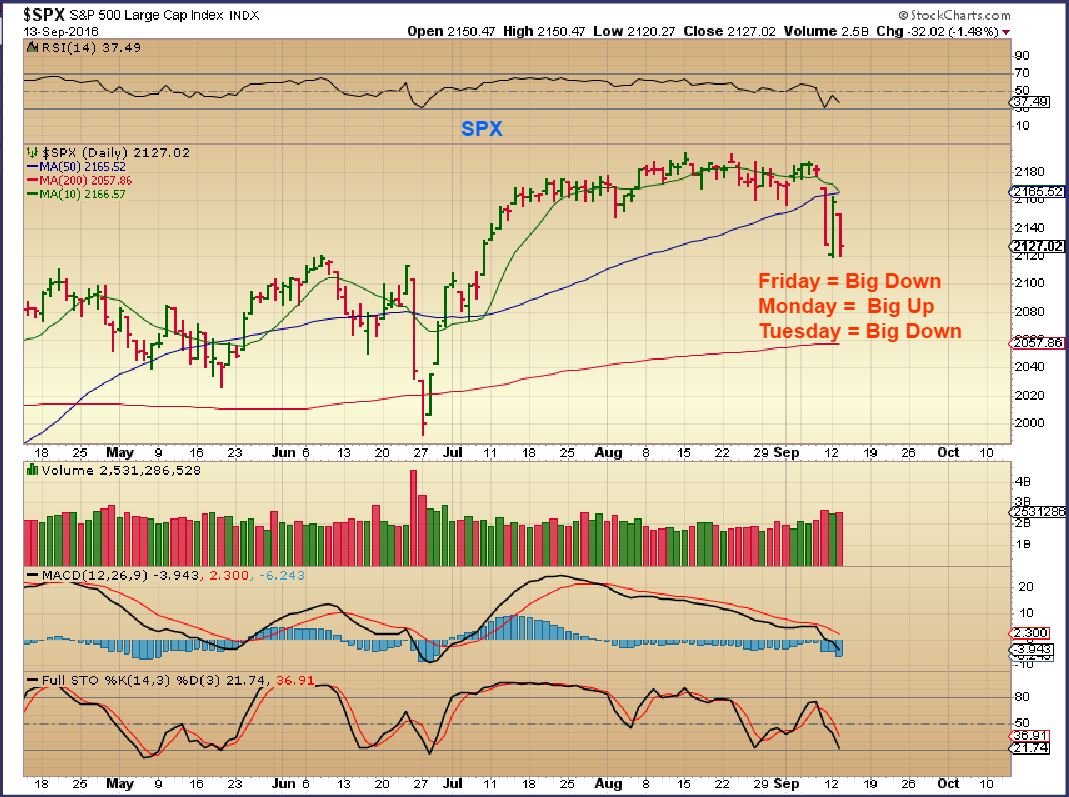
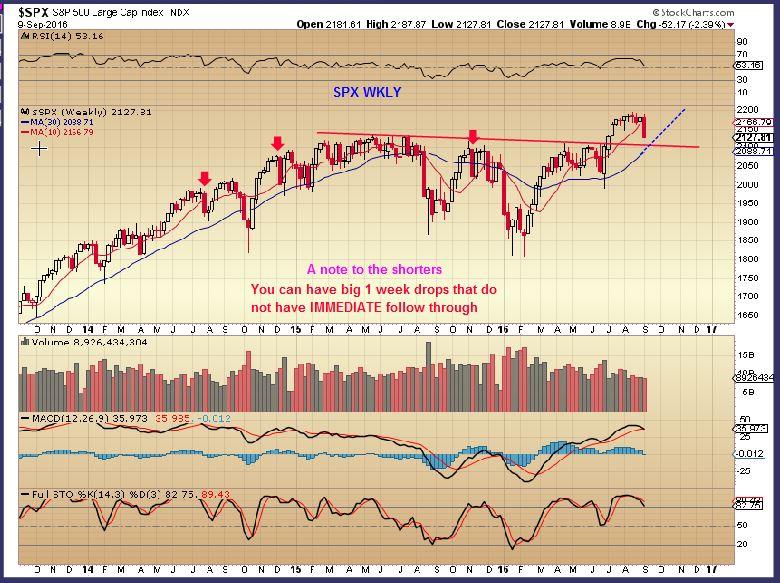
SPX – With Fridays drop, I said in the weekend report that many would want to go short, but WE are looking for a DCL almost immediately. Timing was late for a low, and that could be capitulation into a low. I mentioned obvious support areas for a reversal on this weekend chart.
This chart pointed out that a 1 week sharp drop like we just saw could reverse and not have follow through (red Arrows) .
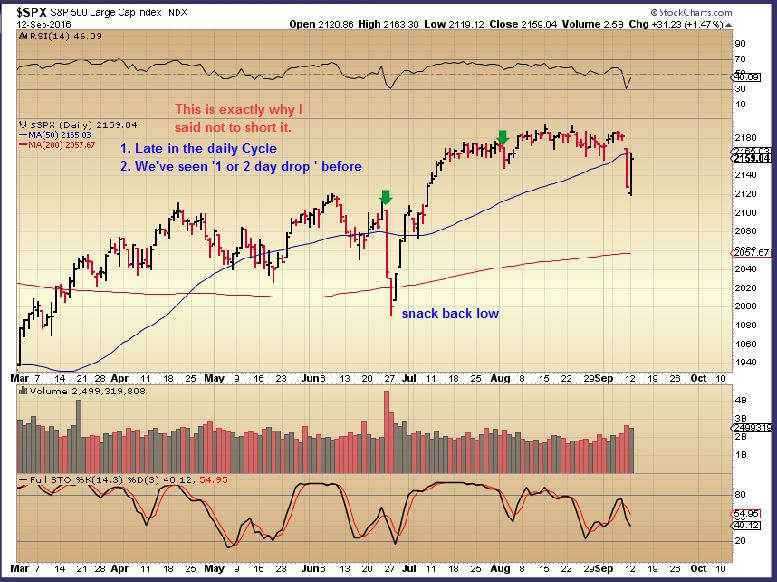
SPX – We got a fast reversal almost regaining all of the losses. Those going short Friday got burned. This may back off a bit and then surge higher through the 50sma in time.
Read more
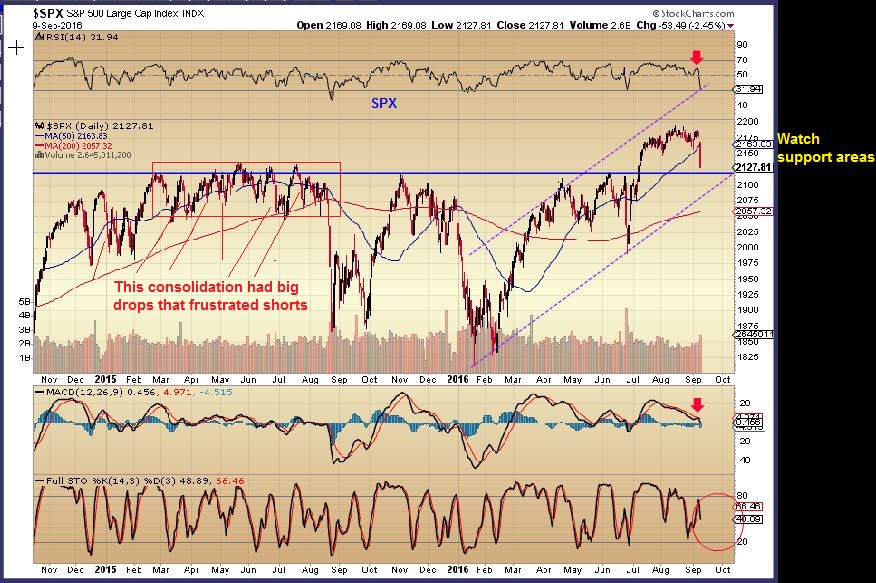
This week ended on a sour note if you were long in various sectors. With the Fed decision coming up, investors seem jittery or anxious to lock in profits. Is this the start of a new sell off , or just another small ripple in the large sea of investments? Lets examine the charts…
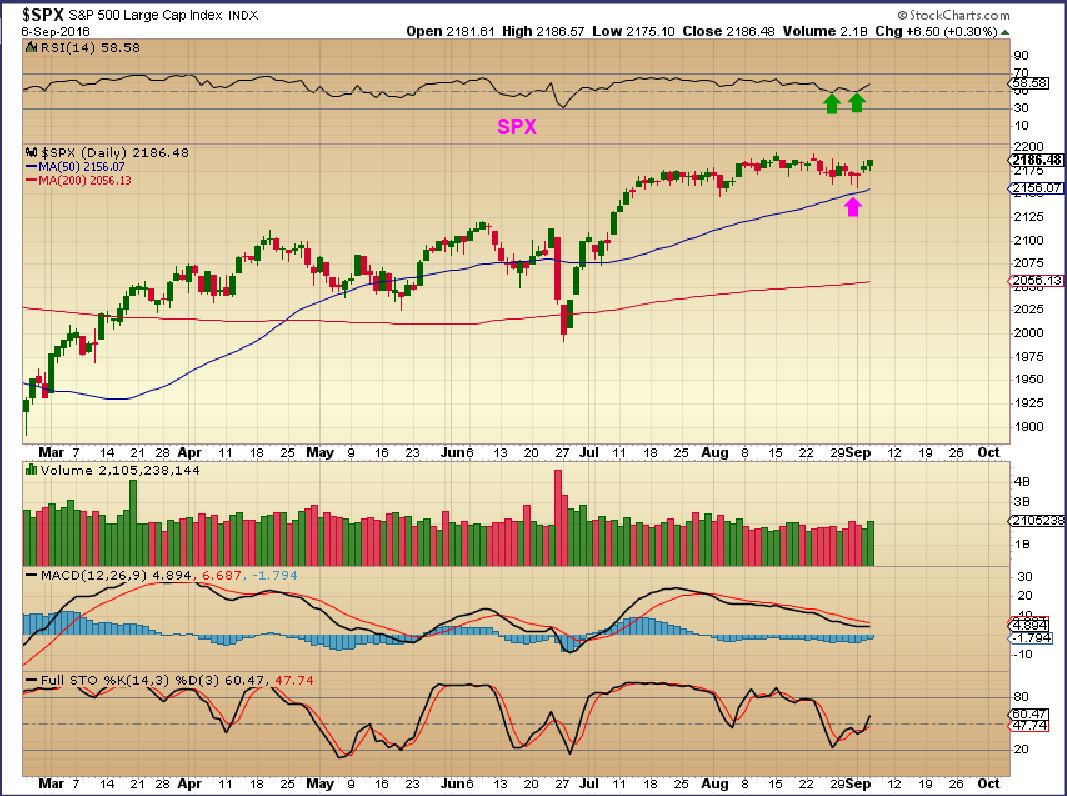
SPX SEPT 6th- I thought that we finally got our DCL on that slight dip to the 50sma, and I will address that in the next chart. This LOOKS like the start of a major sell off, but …
Read more
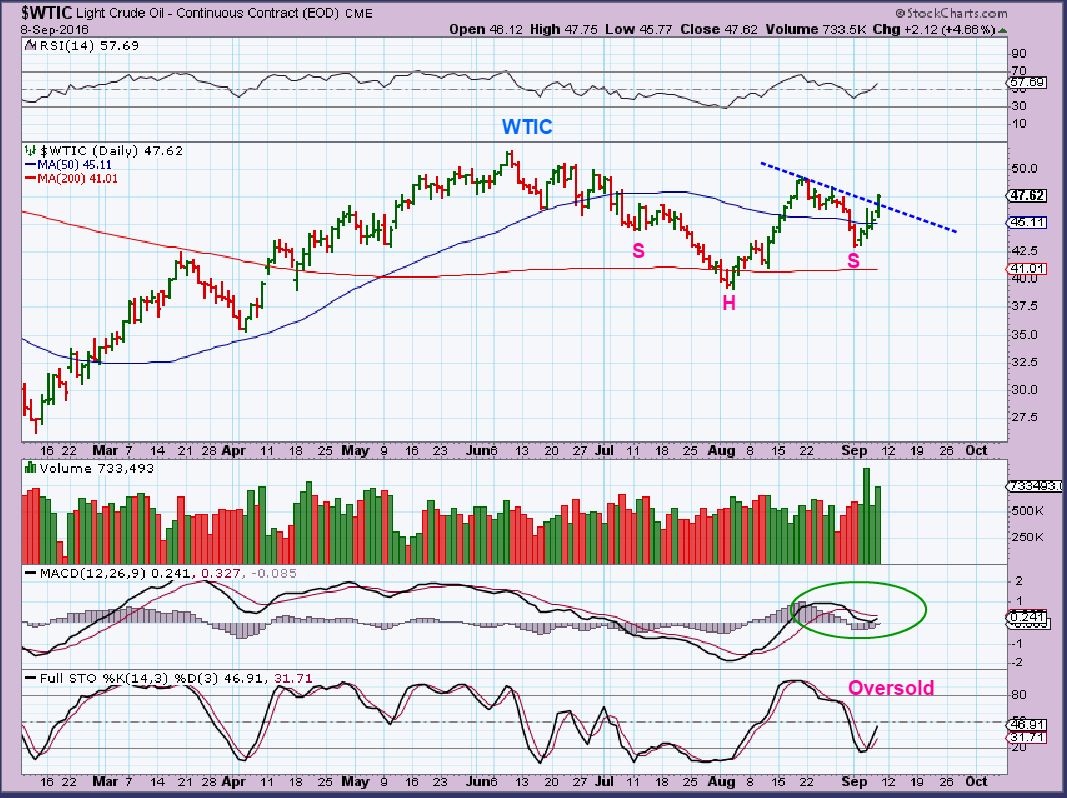
The OIL and NATGAS inventory reports were released on Thursday morning, It looks like we can continue making money from the Energy set ups.
.
WTIC –
NATGAS –
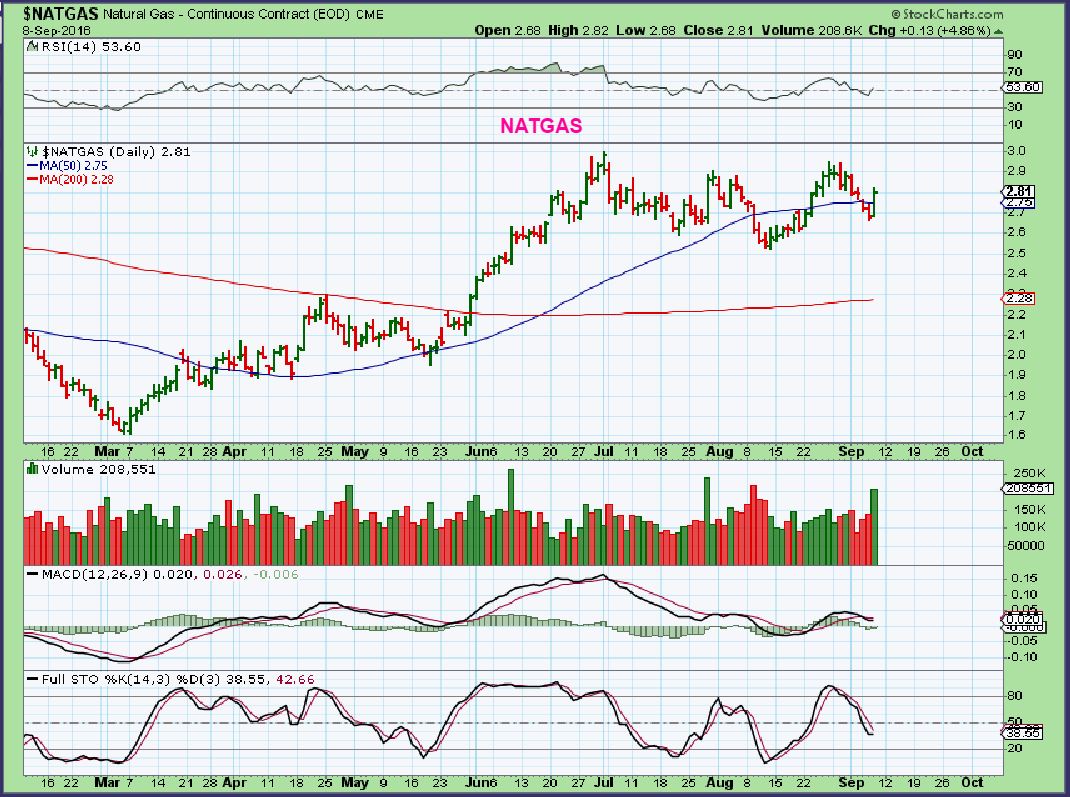
Read more
It looks like a gift so far, but until it is unwrapped, we really cant be sure. One thing stands true though, I dont want to be ungrateful if it is.
.
Read more
We have a good amount of volatility shaking things up, so we want to have a plan and a back up plan. Lets review…
.
Read more
Knowing that my readers are both short term traders and longer term investors, I want to always look at the charts and view them with a long term, medium term, and short term perceptive. At times all 3 views are sunny or all are murky, but in times like these, I also get a mixed bag. Lets review the charts and you will see some good and some questionable things in various sectors. This can help to sort out our short term and longer term investments.
.
Back before Aug 26th and on this Aug 26th chart, I mentioned that we could see price continue sideways until it tags the 50sma, or maybe even break it in shake out fashion.
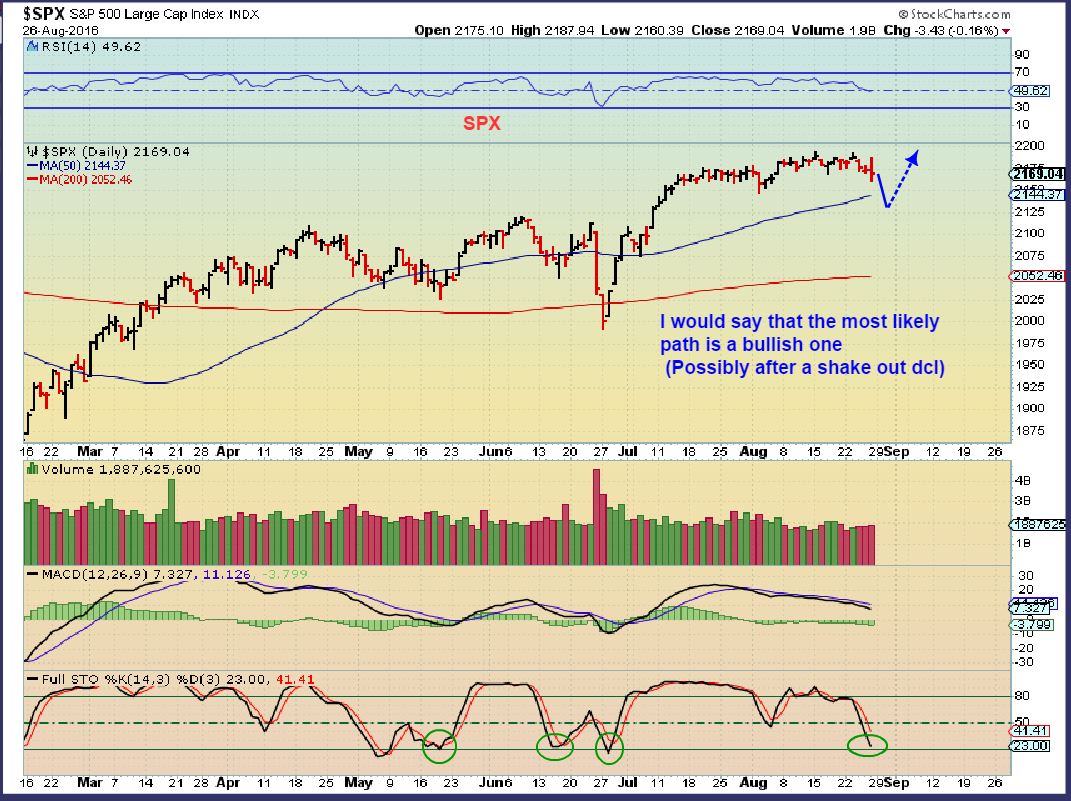
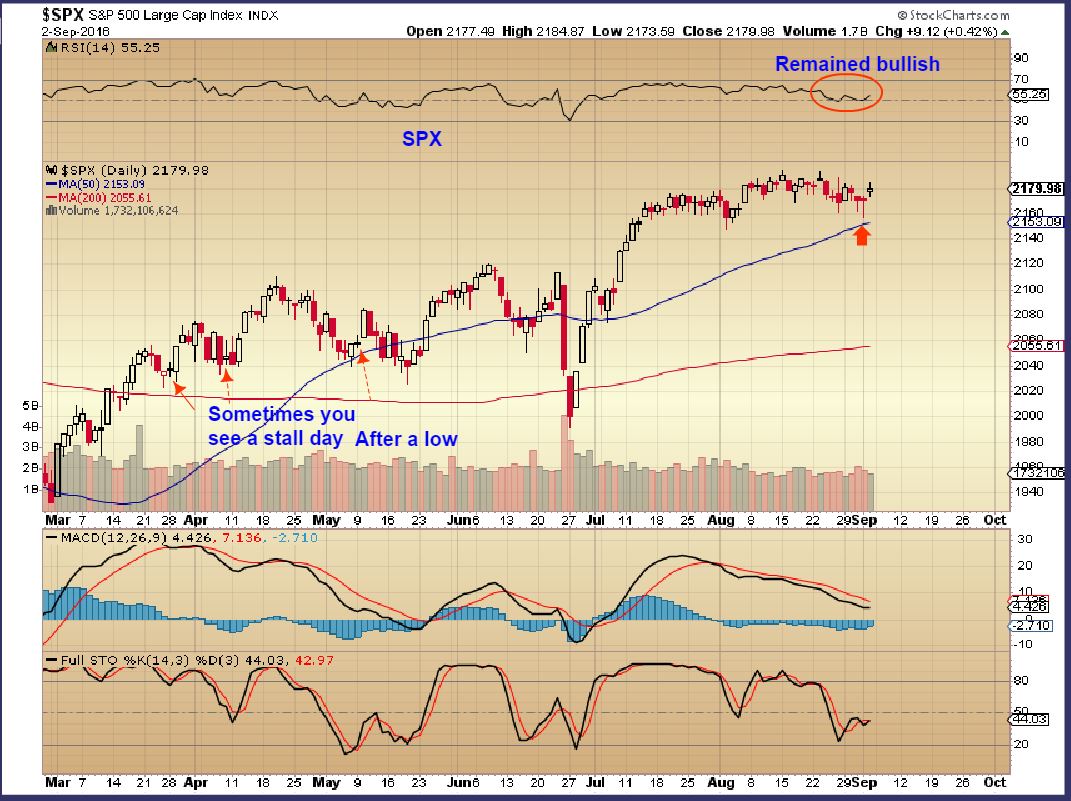
SPX – Each sell off is met with buying reversals, so this reversal with the Jobs Report “might” be enough to put in the daily cycle low. If so, this should break out & continue higher, instead of more of this 2 month choppiness.
Read more
I dont always need to know ‘How?’ or ‘Why?’ it happens. Just like the formation of this flower, grand designs and patterns grow and develop within the markets cycles and within nature. We watch and wait for things to play out and right on time, we get our completed Grand Designs. Lets watch how things are playing out…
.
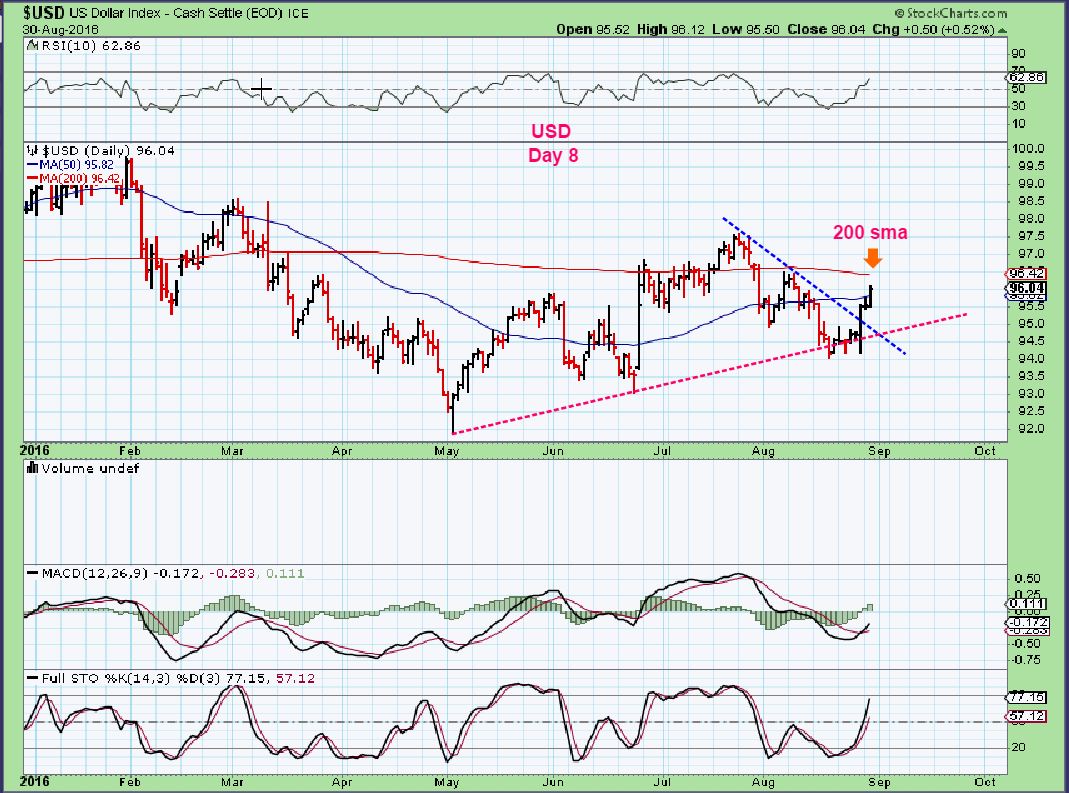
I’m starting with the USD today. In the weekend report, I mentioned that I didn’t really expect the USD reversal to get too far.
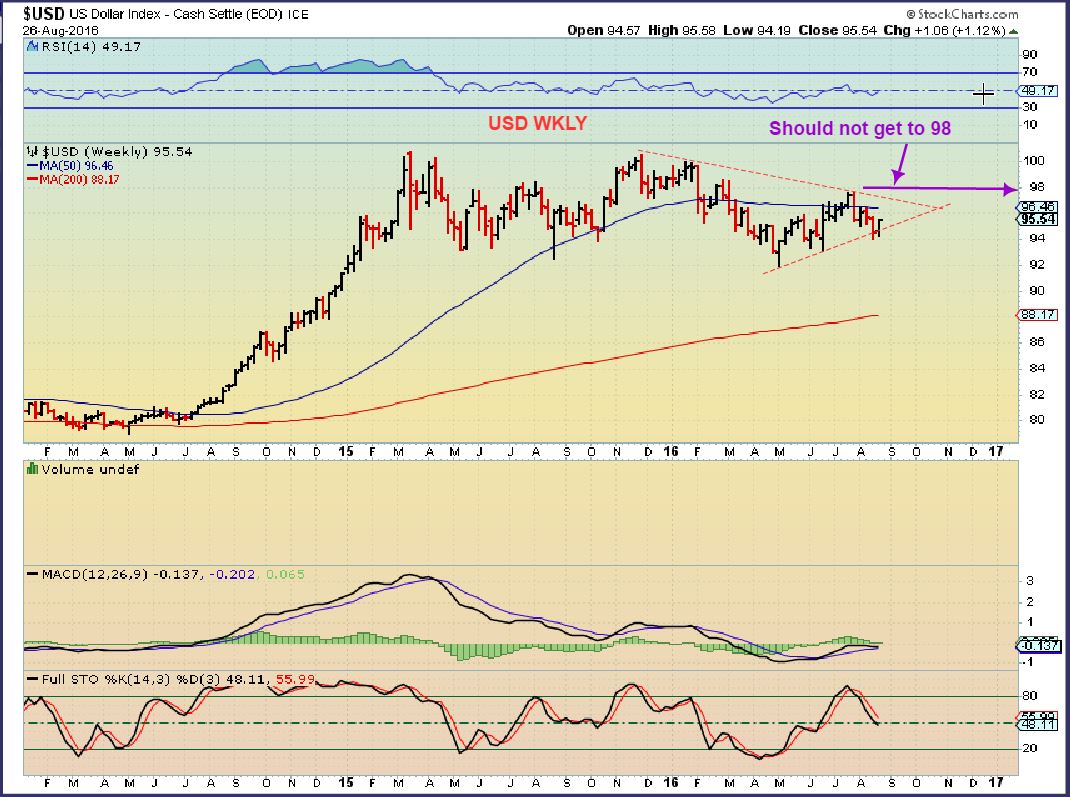
2 days ago we found ourselves on day 8 of the daily cycle. Expecting that it should become L.T. and roll over, we pointed out the 200sma as possible resistance. The chart looks bullish, so will that pattern of being a L.T. Daily cycle play out?
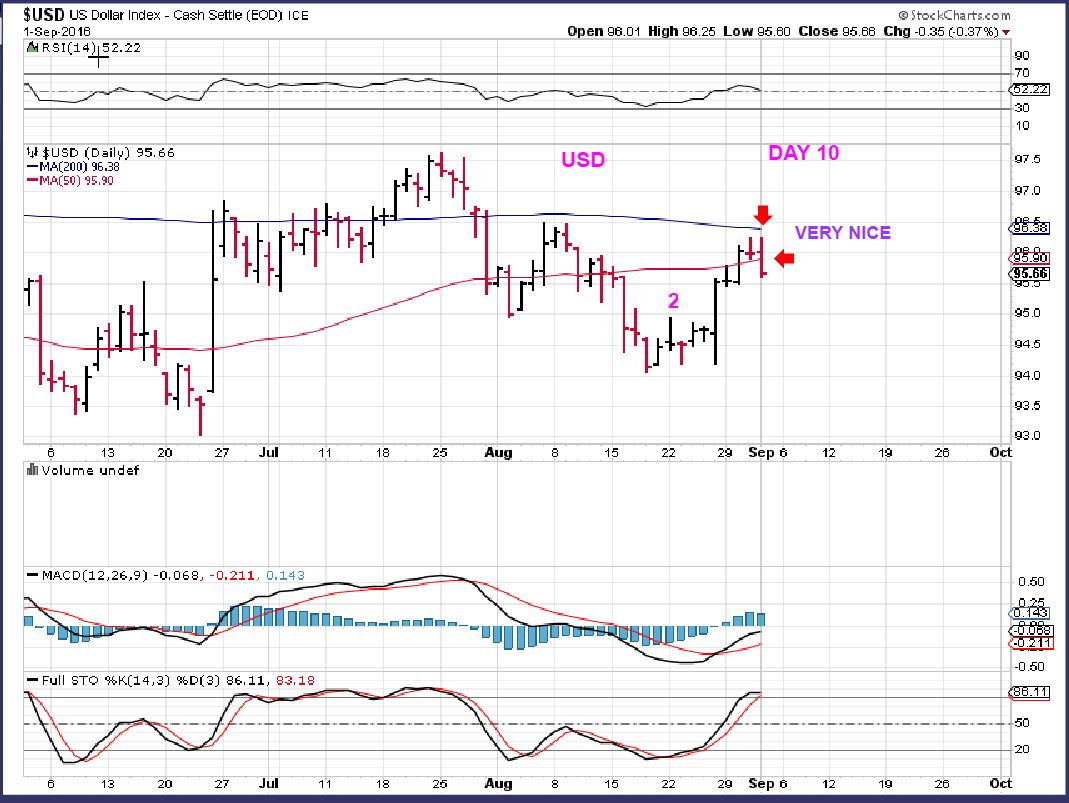
USD – Thursday we saw the USD drop pretty hard and even lose the 50sma again. We’ll see what happens after the JOBS REPORT FRIDAY. This $USD drop bottomed Gold. All we need is a little follow through.
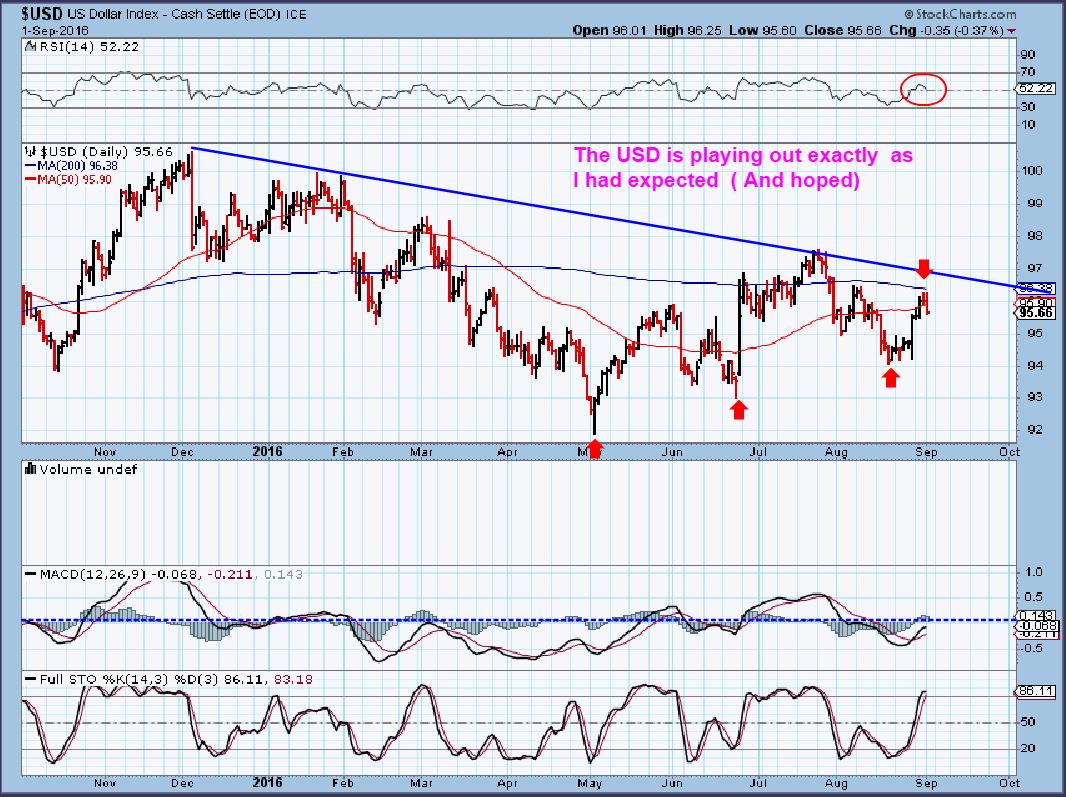
USD LONGER TERM VIEW – Even if the JOBS report gave the USD another burst higher, I do not see it taking out the overhead trend line.
Read more
Scroll to top