STOCK PICKS
My weekend report covers Monday and I usually post full reports for Tuesday, Wednesday, and Thursday morning. Most of the readers at Chartfreak know that when I started this service, I thought that whatever I wrote in Thursdays report would also be able to cover Friday, the final day of the trading week. The readers here also know that in 2016, I got into the habit of posting a Friday report anyway. Today is Friday, so let’s just look at Stock picks!
.
NAK has been on my “must have’ list for much of 2016. The chart set up, that long Base, those Volume surges. I also loved the story about their reserves and their future possibilities. I loved it and was loading up when it was 30-40cents.
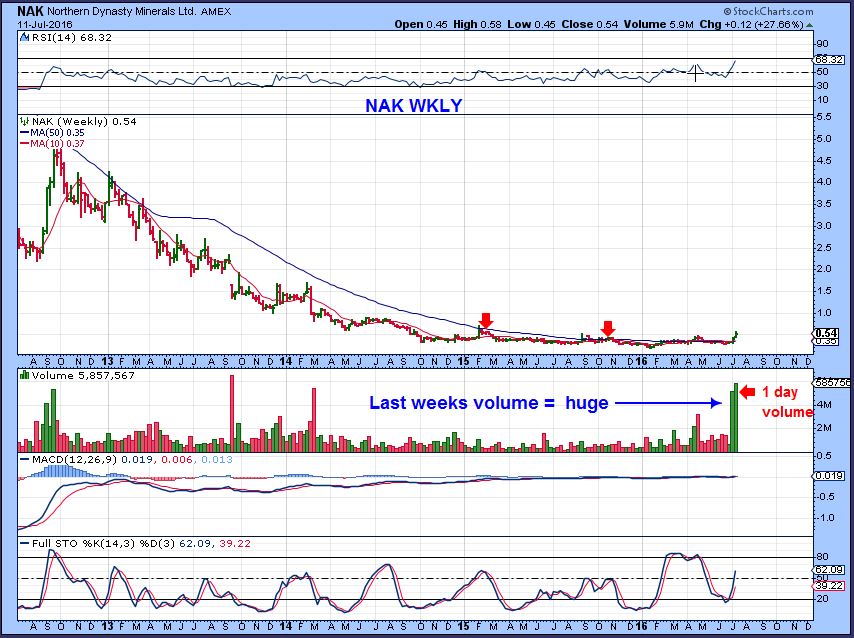
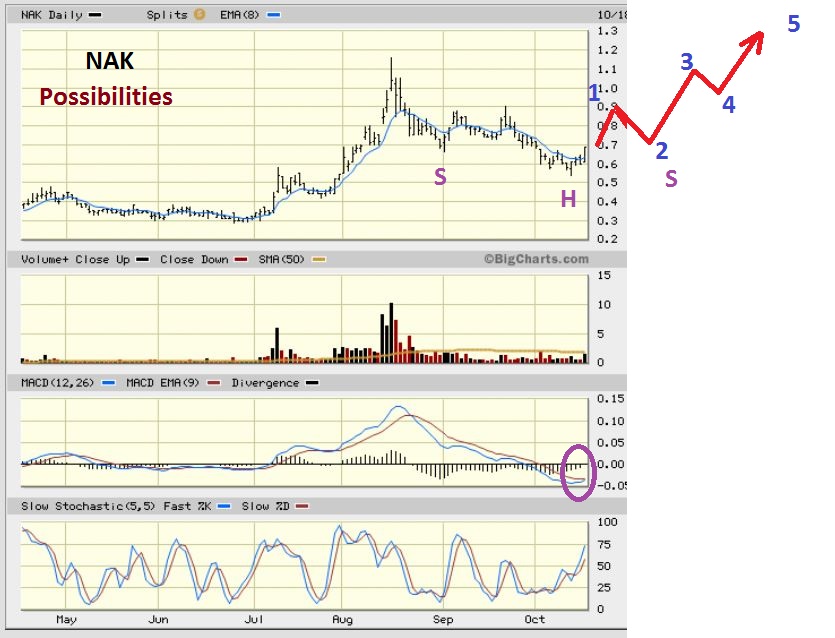
NAK – After an initial strong run higher, we got a normal correction. In October I was trying again to get people to add to this set up. I have 20 charts of NAK from 2016 reports, encouraging low risk buys all along.I expected a possible 1-2-3-4-5 wave move higher.
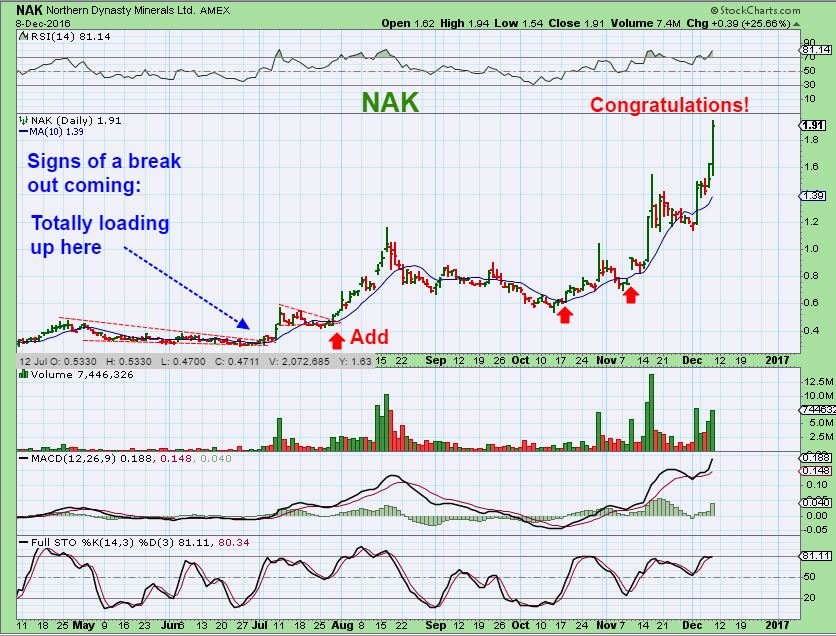
NAK Dec 8th. – The first 1-2-3-4-5 was a run from 50 cents to $1. This could be a larger 1-2-3-4-5 playing out. NAK is up around 600% so far – Congrats to all who caught some of this strong move. I’m only selling a partial, and will add on future dips.
Lets look at some current set ups!
.
.
Before we begin, I want to mention again that just because I post 10- 15 stock picks, it does not mean that you must buy them all. I am giving you choices. Many traders here have some trading experience and want to look at a few different set ups before entering a trade. Some look for a quick swing trade that may last only a few days, others want a trade to hold for a few weeks, others are longer term. Do not let a long list of possible ‘trade set ups’ frustrate you. I will try to discuss a few good points about each, and then you can just decide if you want to trade one or two, or maybe you are waiting to see how the Miners move going forward. Maybe you want to wait and buy those later. THAT IS FINE TOO 🙂
.
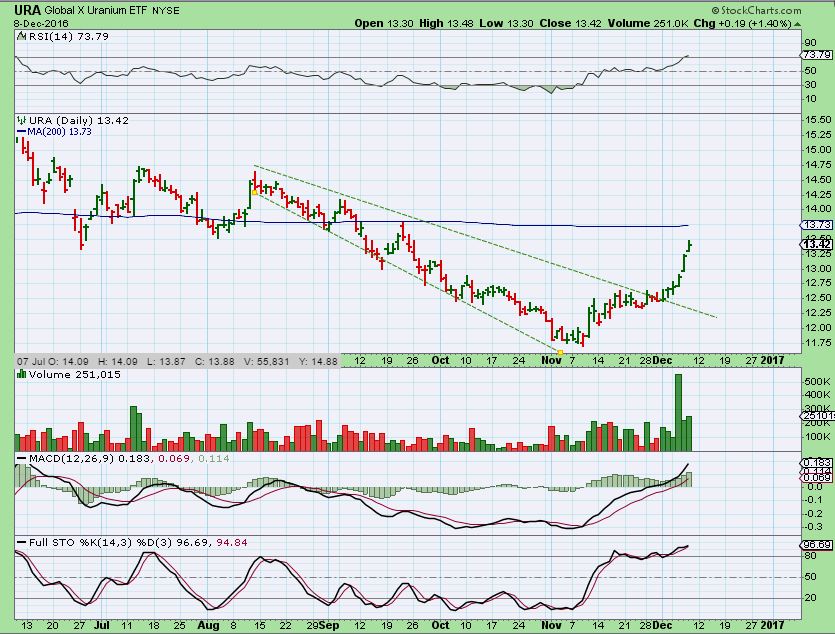
ENERGY STOCKS AND INDUSTRIAL METALS have been doing well. I also mentioned some Uranium stocks that were looking good, like URG, URRE, UUUU, CCJ, URA ( the ETF). let’s take a look.
.
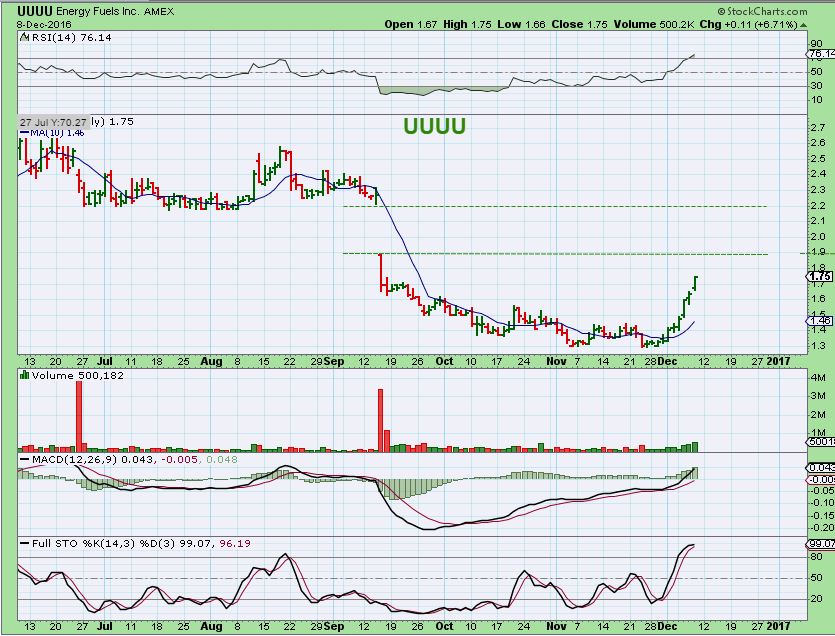
UUUU– recommended at the beginning of the week. I know of a few readers that took this trade.
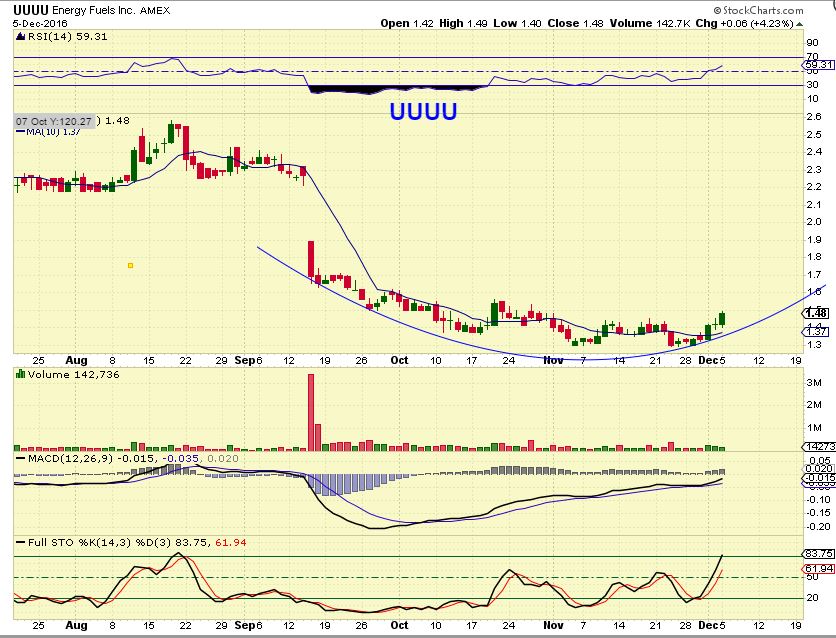
UUUU – This may pause at the gap, because it is getting overbought, or it completely fill that overhead gap. The 200sma is right up there, so price may go up & tag that 200sma (not shown, sorry). That said, I would use a mental stop and take profit wherever you are comfortable OR Just take a little off now and let it ride for a bit longer.
.
URA ( The Uranium ETF) could be finding resistance at the 200sma too. If you bought this one, you can use this as a guide. Can they go higher? Absolutely, but the 200sma may act as resistance and there are pivot points to the left that could also. I would expect it to stall soon.
Since the Energy stocks have been acting correctly, I have been watching those for new set ups. There are many, so we’ll look at some as longer term, and others as swing trades. let’s take a look.
.
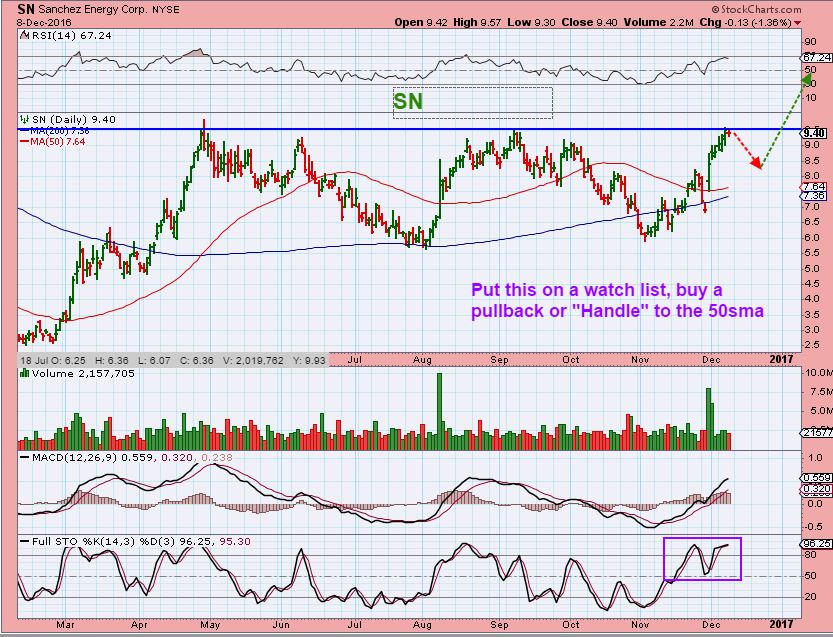
SN – chart #1 – We traded this here in the spring and it went well. SN ran from $2.50 to $10 ish and then consolidated those gains for months. That can be very bullish. Now it looks like it wants to break out, so longer term traders may want to watch this one. See also Chart #2.
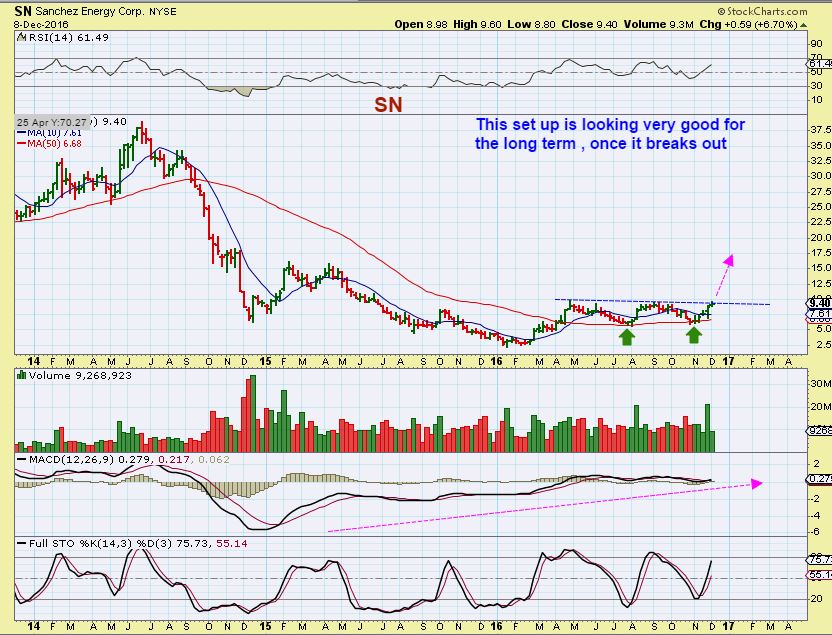
SN CHART #2– If it breaks out, one could buy the break out, but I expect it to pause like oil did first. I’d look to enter around the 50sma if it pulls back. This goes on a watch list.
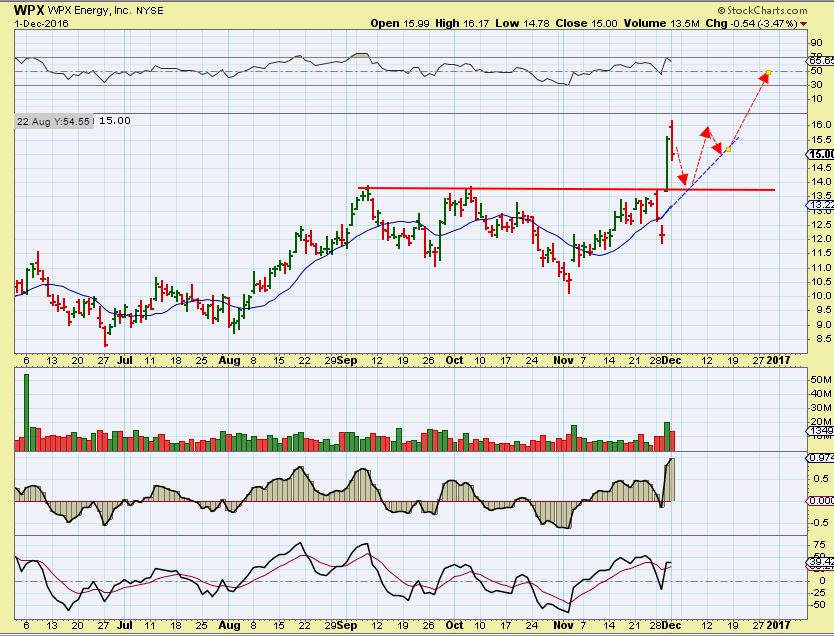
WPX 2 chart – DEC 1st – WPX ran from $10 to $16 in November. On Dec 1st it was at $15 and I mentioned watching for a dip ( to the 50sma?) and then a continuation higher. A possible back test.
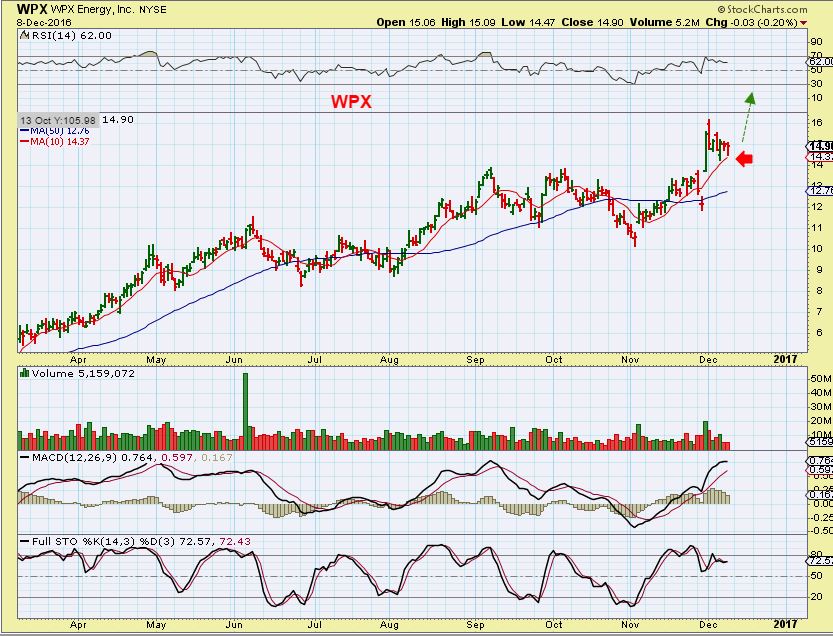
WPX 1 week later, it is still around $15 because it has Bull Flagged sideways to the 10sma. This is a low risk buy, expecting a break higher from this flag. Note: It could drop to the 50sma if Oil pulls back, but so far it has very light volume selling and is flagging bullishly.
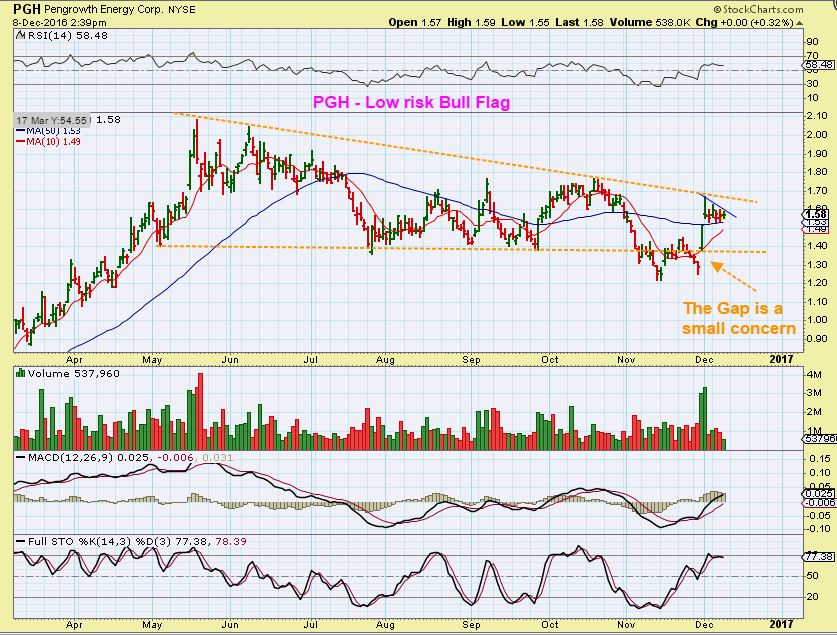
PGH – PGH hit resistance last week, and now this looks like a bull flag. Even though there is a gap below, I think that this is going to break out higher. It can be bought right here at the 50sma with a stop just below your entry.
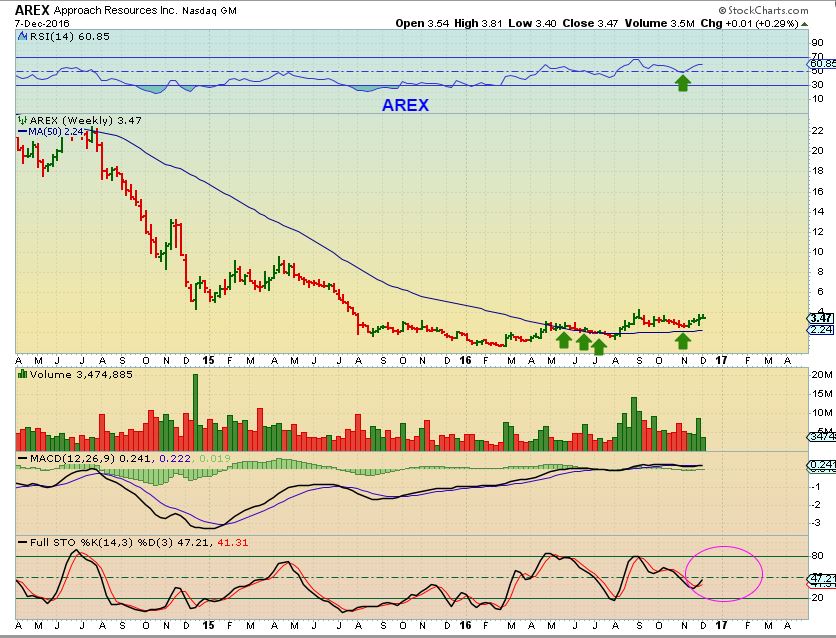
AREX – This is a nice set up on the daily and weekly and I posted both on Dec 6th. Great upside potential.
This was Dec 7th at $3.47, and it shot up Thursday, but this weekly chart shows me that there is plenty of upside once this gets going. The daily price is riding the 10sma. Longer term traders could consider this one too.
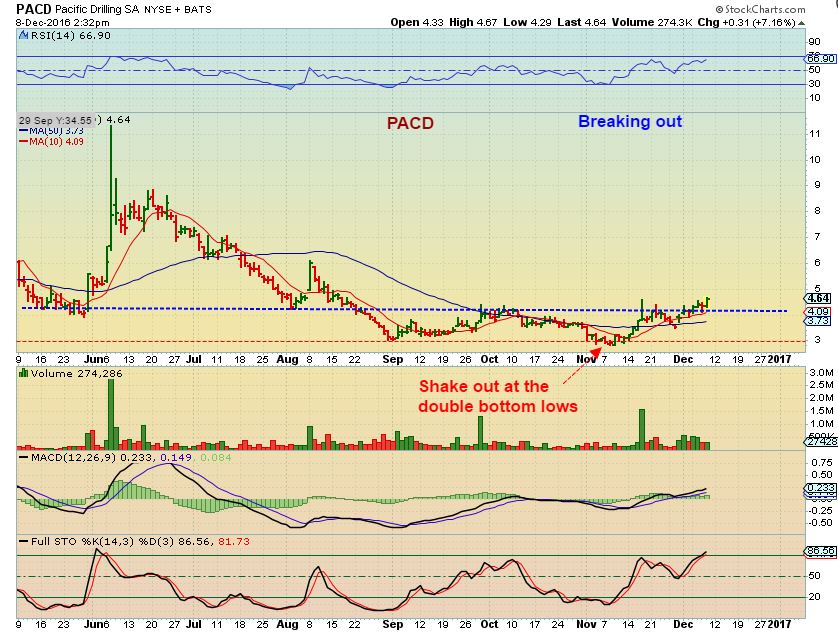
PACD – Finally moving off of a double bottom low, PACD looks good. The daily chart looks ready to continue higher and this weekly chart shows nice upside potential for the longer term buy & hold.
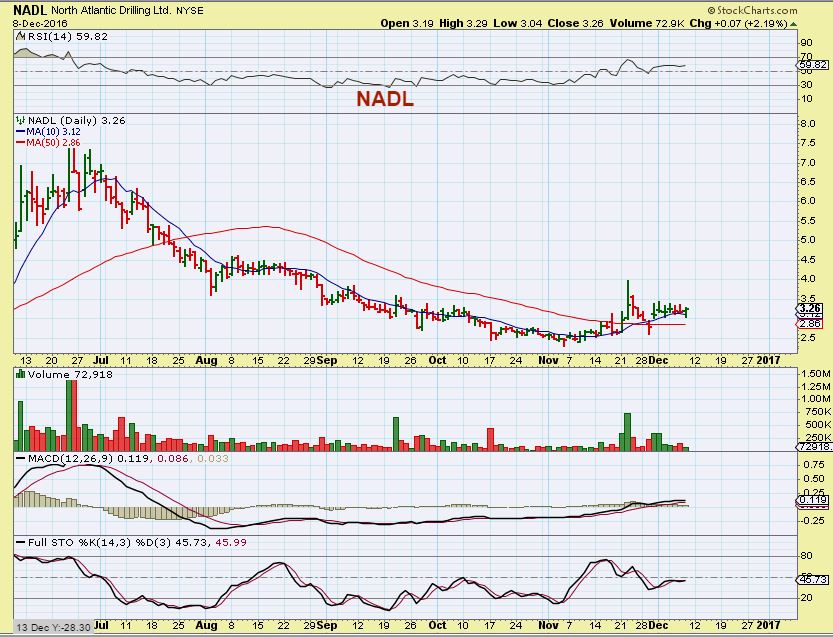
NADL – This looks ready to go now. It could be bought with a stop below the 50sma.
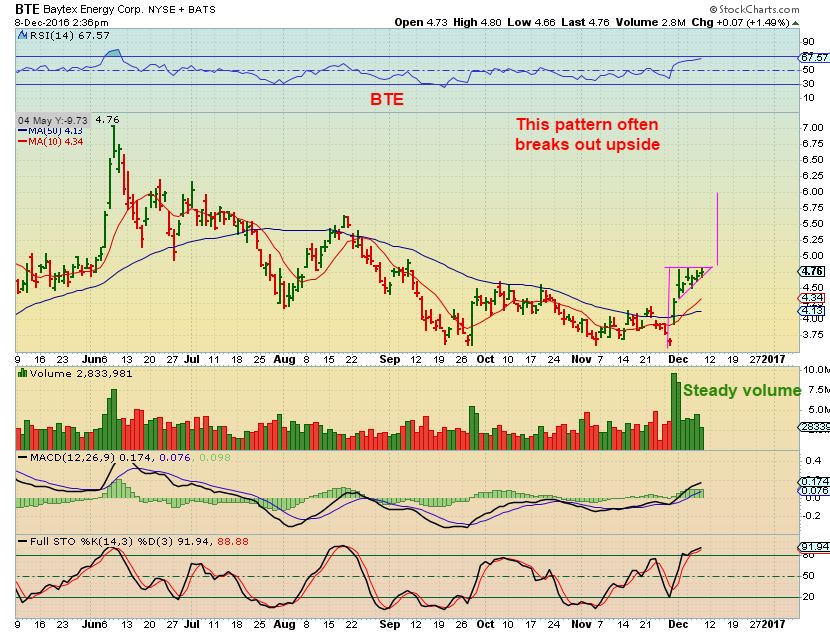
BTE – Possible Bull Flag.
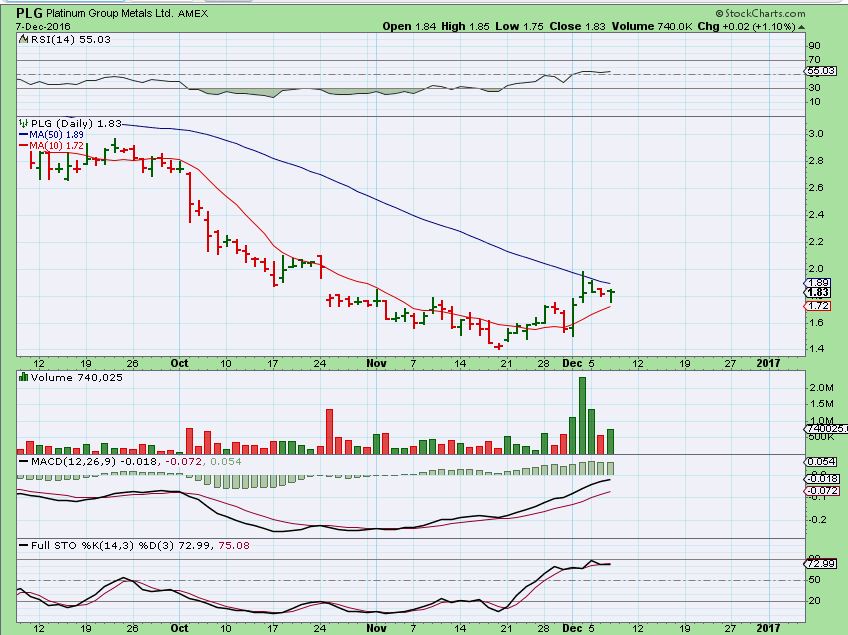
PLG – This looks ready to go, I’d buy a break of the 50sma. Keep in mind that this is Platinum, so it may need Precious Metals to perform well, but this set up is bullish.
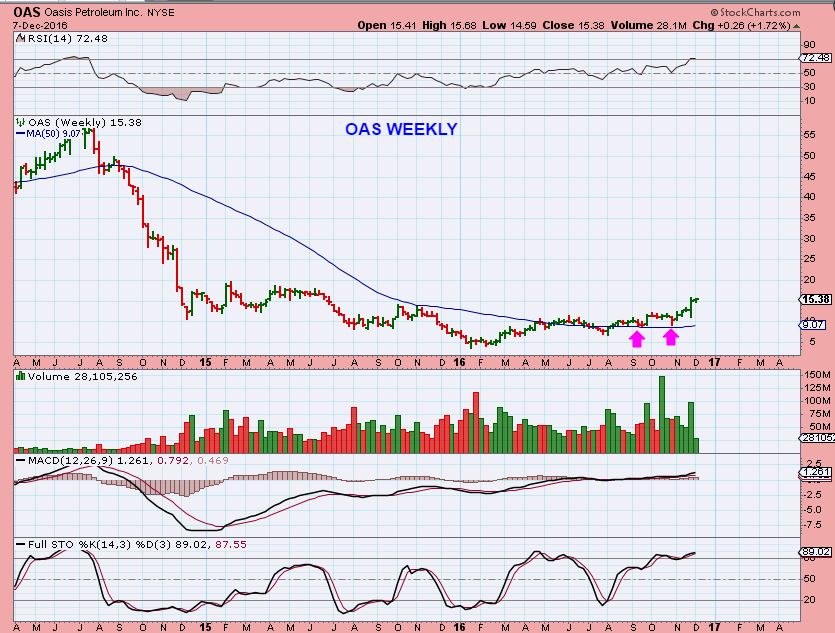
OAS WKLY – For the watchlist? This is a nice set up for the longer term. It may pull back on a daily chart, I’d look to enter on a pull back. I will be watching it.
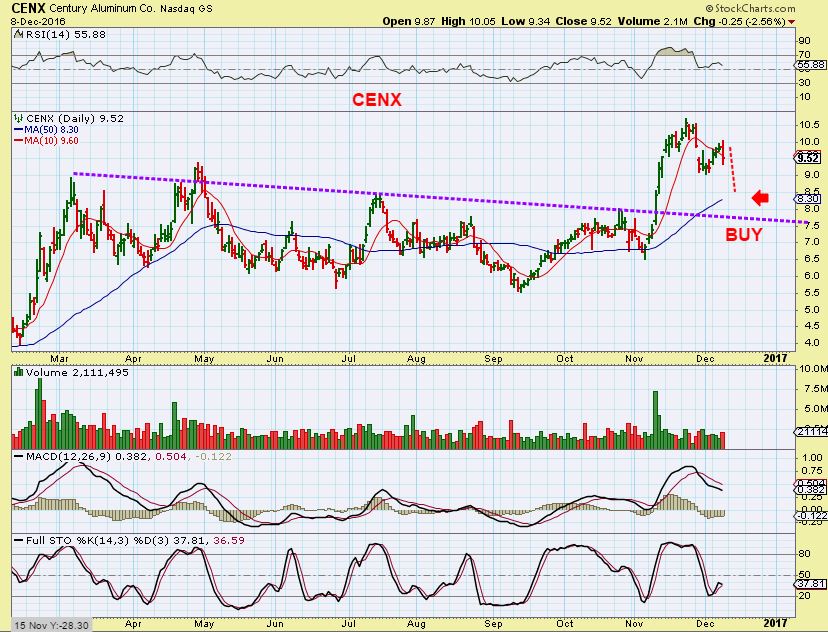
CENX WKLY – Chart #1 – Watchlist? This is doing a back test and the daily chart explains what I am watching for.
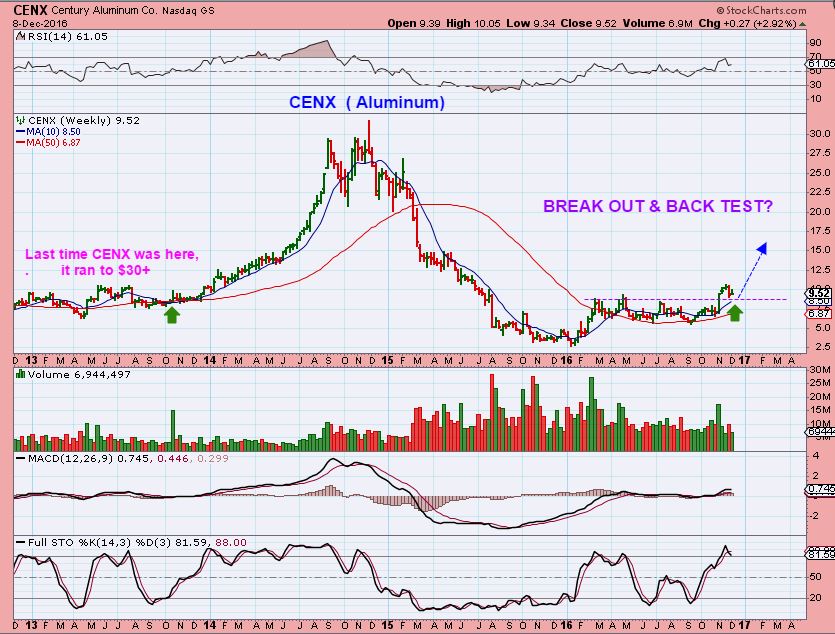
CENX DAILY CHART #2 – A pullback to the 50sma would be excellent and should finish that back test on the weekly chart. It actually may only drop to $9 and wait for the 50sma.
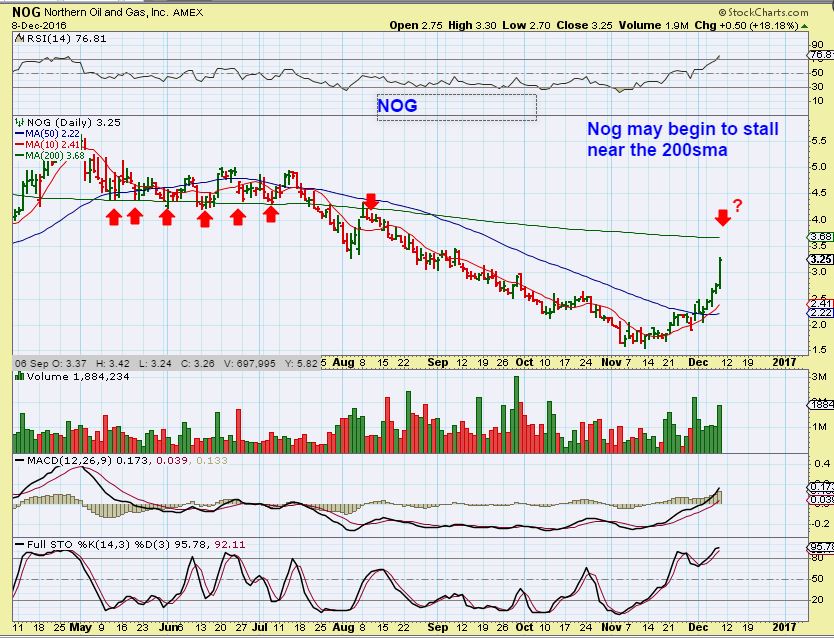
NOG – Did you take this NOG trade with me, s it back tested the 50sma?
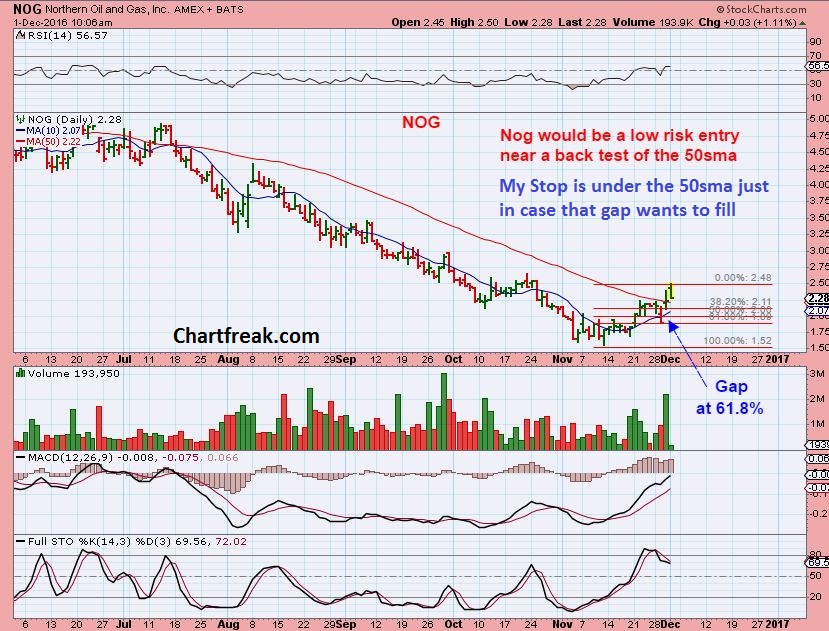
NOG – It’s having a nice run, up 50% from that 50sma. If you took that trade, you may want to watch the 200sma area for resistance ( Sell?).
$2.20 to $3.89 is an excellent trade = 75+%
SO those are some trade ideas for Friday or the near future. Enjoy your Friday and have a great weekend, thanks a lot for being a chartfreak!
.
~ALEX
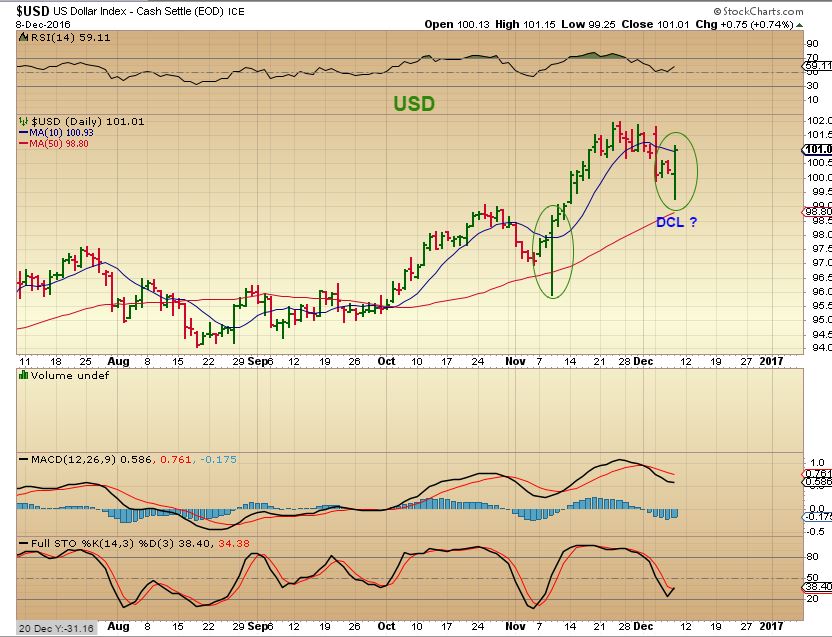
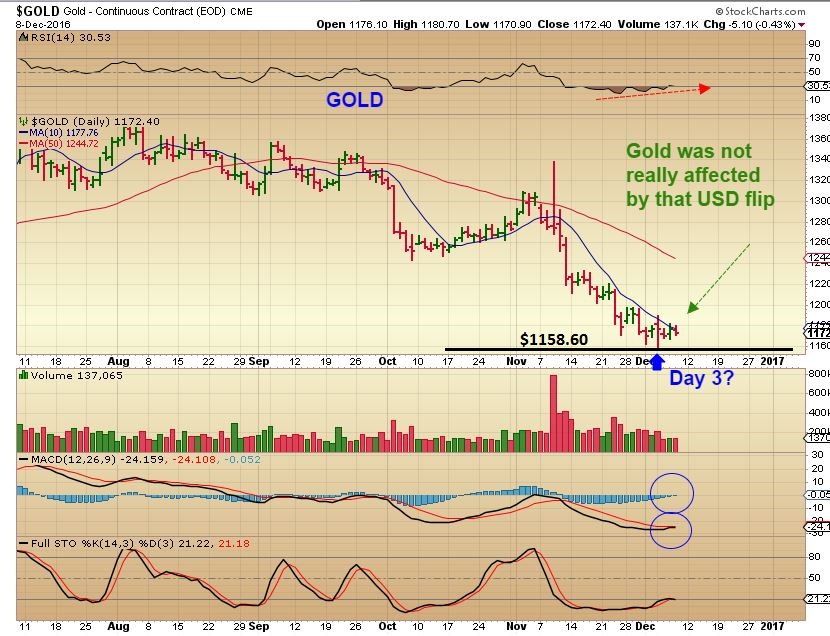
USD – This strong reversal looks bullish and could be the expected dcl. I think an interest rate hike next week could roll the dollar over with a final top. A reveral that strong should have caused Gold to reverse that much to the downside, correct?
GOLD – Gold was not harshly affected. It looks to be on day 3, and maybe Gold is bottoming as the Dollar is topping, both expecting a Fed rate Hike next week? I will discuss interest rates in the weekend report. I’m watching 1158.60.
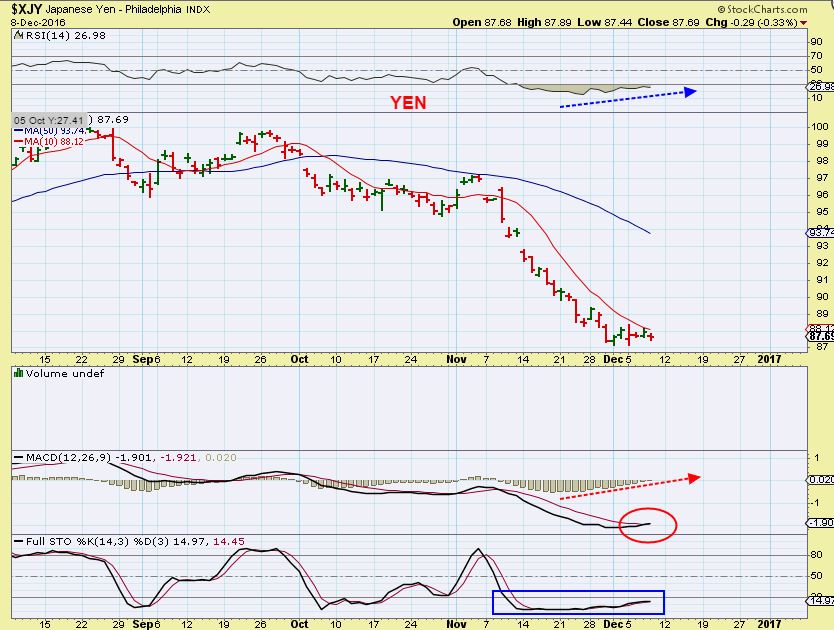
XJY – And the Yen hardly flinched at that USD reversal too.


SBGL – Buying Stillwater Mining for 2.2 Billion.
Investors do not like the deal, SGBL down $1.18 in pre-market to $7.18 ( Down 14%).
SWC up $3 pre-market ( +20%)
Well I own SWC so I know what I’m getting rid of this am:-) On another note…yen taking it on the chin this am…will GC stand up to the abuse? Stay tuned…
With gold and the yen dropping pretty hard this morning, any concerns with the above thesis?
Go to the chart of Gold and see where I listed the price to watch.
The lows of Gold are what to watch, if not broken, no worries..
The assault on the Yen is really trying to push gold to new lows. I am growing increasingly concerned that should gold have yet another reset to a new low (on what day 44 or something) the mining shares will have that final plunge scenario where they sync up with gold…..Almost feels like the last week’s relative strength in miners is a setup to reset sentiment/RSI, etc. False break down scenario…..So far gold holding strong.
I have thought the same thing, except for re0-setting sentiment.
I agree that it would actually be nice to have MIners and Gold in sync with their timing. If both just quickly dropped to nw lows, they would be VERY EARLY in their cycle timing for coming out of a low near the FOMC . IT would actually be the best thing for us, though it would cause a lot of concern as it broke down.
As for changing sentiment? Sentiment to miners is not bullish, most are short , hate miners, or afraid if they are holding.
I really don’t see many bulls out there that need their sentiment shaken.
yen coming into some heavy resistance here on the weekly. Used up a lot of energy so may be just a break but we’ll see. Getting white knuckles trying to hold on to my GC. 🙁
http://invst.ly/2wxlq
Just in time for FOMC
Another daily cycle down in gold before the ICL/YCL bounce?
The last one hasn’t officially ended. No confirmed swing low in Gold, so it would be day 40+or so if it broke lows now.
Alex when you sell partial, such as NAK, would you sell more or less than 1/2? Just wondering because my exits are always worse than my entries and would like to improve on that skill : )
Hi Ann,
Just to explain: This one is a little different for me, than when I sold VGZ and MUX near their tops. I wanted to gain maximum profit on those before the next possible consolidation of those gains, SO I just sold 1/2 or more and held on to the rest in case it kept going higher, and then I’s sell more all the way up.
NAK I just wanted to hold I still like this one long term for as long as it looked healthy. I didnt want to pay taxes on my gains in 2016, and so when I sell some here, it is because I wanted to lock in gains knowing that these extensions usually drop and start another base building effort ( Like NAK did in AUG , SEPT, OCT.
I will sell 1/4 on a gap open- I just want to grab some solid gains and will re-enter again when it drops to the $1.50 area
( IF it drops, but I am very certain that it will.)
great thanks : )
Thanks for the detailed answer. I took some profits today too, but kept more than half of my position. I may just put that into a core now because I like the company and its story. A lottery ticket.
TRX. Time to go
Time to go up or time to sell?
Ofcouse up 🙂
very good report Alex and thanks for the picks you always put in your report. That makes the difference between you and other writers.
Thanks Marinho
I am a stock trader at heart, and I love the low risk set ups for good quick scalps or holding for a week or two 🙂
Happy to share a few when I have time and the set ups look good.
😀
: )
From the report
NADL
PACD
I have NADL in one account already, was going to get it in another just a few minutes ago but it was up 16 cents and I thought, hm, let me see if it will pull back any….HA!
If you look at a chart with the 200sma, it tagged the 200sma ( broke above slightly) and sold off.
I think it will break out higher soon and run, but it sure is volatile today : )
EDIT: I jumped in right at the open, because I really liked that chart. It has already been a roller coaster .
Sure would be nice if GDX holds up and regains the 10day & 20day MA
Although it wouldn’t be unusual for miners to break trendline resistance to stop us nervous nellies out before moving up
https://uploads.disquscdn.com/images/6ddc3ef05f5dfbcae416ab3f0c7c52cafe72f14ccf3e98ab2578072ce2db558f.png
Nice chart. It is time to see those big volume bars in the up direction SOON. Please.
Nice Job Cal
Uraniums becoming stronger.
Now DNN, URG, joining in the runs
UEC may be next
Everything but the PMs? That must be tell of some kind. Or fake out?
Am I right in thinking that GDX:GLD ratio might have put in a swing high as it got rejected by the 50 SMA? It seems like we have been having a pretty regular 25-26 day cycle for the past few months…
I have liked GDX’s recent relative strength as gold was experiencing multiple new lows… The chart has me concerned that this might erode over the next 2 weeks…
Looks like we will have 1 more leg down.
NAK is pulling back. It would present nice entry point soon.
I had not looked since I sold a partial this morning….glad I did when I did. Happy I took a nudge from Alex. And thanks to Ann,[ or was it yo ?] saying a day ago that it looked “toppy” [I think]. It got me paying attention.
hi Nancy,
thanx for yesterday’s mentioning the US ticker – totally forgot about it
today following Canadian mines are doing great
they are green and I think they have nice charts – Alex ?
CNL
CGG
EXTREMELY light volume from what I am seeing.
I would say they are running out of buyers. Slight pull back in the future would be my guess
I have that in another account from YEARS ago and I rode it down when they had an internet attack. I still think it is a good company, but it will take a lot before I gain back my $. Also, since not on a main exchange the volume is low and that hampers it too.
definitely wasn’t me, I can’t nail a top if it saved my life! : ). Alex’s chart on NAK was very helpful though, now I see what he’s watching and “maybe” I can improve my exits
Actually, It helps that you asked what I was seeing too.
I take trades through out the week, so I don’t discuss them all when I go in and when I go out, but I could tell that many here had taken the NAK trade and wanted to know what might be a good area to lighten up, so it became part of conversation. Same with NOG, some mentioned they were riding it, so I pointed out the 200sma overhead.
Your question this morning was timely, probably came about when I said yesterday that I would have to sell some soon, like with MUX and VGZ when they were running). I had a sell order in for the gap open. It actually took a while to fill too, must have been a lot of trading in that area, I saw it rising to $2.05, but I didnt get that.
Suggestions on IPI exit? I’m down to half size after today, but maybe I should exit fully and wait for pullback since it’s been so parabolic but where would I re enter?
That is a really tough one based on that chart. Not a lot of resistance, but it is quite extended. Those can pull back to the 10sma, they can go sideways in a bull flag , not really dropping much, etc
so I would have done what you did….sell 1/2 and either let it ride with a comfortable stop or sell on the way up. Also could just ride it, but it may get whippy where it is that extended.
thanks
I too have trouble exiting [I chant “don’t fall in love”,… but it doesn’t work!]…but I combine it with trouble entering [I chant “don’t chase”,…but I sometimes just can’t resist.] Being here has helped.
pretty sure we all fight the battle betwn fear & greed… human nature repeats itself…..
#EW
I nailed my call to sell this morning then got busy at work and didn’t do it until it dropped a bit. D’oh!! Nothing worse than seeing it and not taking your own advice! :O
Yes. I posted my observation yesterday. It was straight line up. It was time to get out :). Also I remembered Alex mentioning about $2 target in one of the comments. These 2 things helped me to get out just in time.
Alex sure has a “crystal ball”. I remember he said that he was looking at $2 as potential target in short term.
Alex, what’s next? 🙂
Thanks Aniket – that was one of my measured targets. Actually $2.19 was too and I wish we got that : )
I did sell my portion at the gap open and got a $2.01 sell price .
Next is an eventual drop to the $1.50’s as far as I can see. It could just drop there or bounce around.
I’ll try to remember to post a chart of possibilities in the weekend report.
I am still holding Core.
Thanks Alex
Looking to maybe re-enter next week.
Not sure about next week. But my eyes are on1.47-1.50. Would be a good entry point. Alex is saying the same thing. I am interested in seeing weekend report. Alex said that he would point some possibilities in the report.
I hope that this usually trailing indicator has become a leading indicator. Based on my acct today so far, it is not leading.
https://uploads.disquscdn.com/images/379603a52d4dd739a5ac2304cfb71e726213092edb1ed447571d7f9cb834a18e.png
Yeah I charted that last night. Not sure how we got to 25% with GDX essentially not moving…but we did
Nevertheless, silver at @16.90 holding up fairly well.
Alex
would the CD be the currency to go into from USD at this point?
Energy and Uranium etc. are flying
What is CD? Are you meaning a C.D. since rates may be rising, or do you mean $CAD?
It’s a little early to know for sure, but $CAD : $USD is positively set up.
I would like to know if being in Canadian Dollars is better from here on than staying with USD.
hi Walter
recently I read an article about this
worldwide you have so many biased people to their own currency and own national stock market – the article conclusion is that a lot of people are not making money because of that
I’m from Belgium and besides those 20 stocks or so we have, more or less we have no other choice than to look elsewhere …. so have an account with US, CAN $ and Euro’s on it
$CAD:$USD is bullishly set up, but it is early at this point.
If the $USD tops, yes.
Crude Oil Count:
Hard stop below the blue wave 4…….. https://uploads.disquscdn.com/images/90d47974b4c1bfb5b3ffa507c29e9217065ffe8328cae37ac407eaf6eef856ee.png
SO I dont see GDX crashing down, if you look at it on a chart, but my thinking is this:
If I am holding Miners like AUMN, GPL, etc – I am still holding them.
GDX is on day 18. It COULD pop and run to highs on day 20+ and then dip, since GOLD could be on day 4.
HOWEVER, If Gold is not on day 4, if it is on day 44 and isgong to drop to a new low ( say day 47 FOMC) , it could be that GOLD is not finished finding the ICL. GDX could then drop to a day 22 new low too. Both would sync up and both would have their ICL at the FOMC.
That is just a total guess, but it is a plausible outlook, SO HAVING SAID THAT…
If I had taken a leveraged position looking for an upside pop? It is getting late. We could still get a strong Pop and GDX could run into the day 24 area or whatever, but I am removing the leverage that I took going into the weekend just in case. I am also taking a small loss on it.
As for GPL, AUMN, etc? They still look fine, above the OCT lows, I see no reason to sell everything, I’m not worrying, just being prudent and cutting leverage until I get a clearer idea of what we are seeing unfold. This is a lot like that DEC 2015 bottoming process that just bored everyone to death for a while ( THAT is also why I liked some of the energy trades today like AXAS, PACD, NADL, etc).
.
Yeah the up move is taking longer than expected. Have a stop at break even on my JNUG position I’ve had for two weeks or so. Holding all other miners.
Bing. Stop hit. Out of that at break even. Maybe the Fed meeting will be the catalyst.
I have been holding AEM since when it was above its 50wma several weeks ago. Should have sold – still learning. Today it just broke a daily triple bottom. Could be a p&f sell signal – not good. It is my only true breakdown today, but …
Alex,
any idea or target on gdx, gdxj nugt and jnug in mind by FOMC ?
No target upside. It’s just very unlikely. Let’s see what FOMC brings and then re-assess. Either bull is alive and Alex’still wave 3 forecast is in play or the bear re-started in July in which case we really need go find somewhere else to invest. Could b another month until we know. Any more time than that and I’ll move on for sure.
ORIG ….. Tis the Season. +16%
Ahh!! I had taken it off my list after it fell so badly in August (the exact day after I had bought a bunch…opened to a real surprise)….it was on my “dead to me” list…..just went to read about it…..sounds like they were trying to restructure some but there weren’t any details in the one little article I read just now…….I’ll have to dig a little deeper and investigate…would be great to get back in and get my money back…:) 🙂
Thanks Tammie……keep me/us abreast.
.. u said ….
ohh .. nevermind…;)
GDXJ looks to be accelerating to the downside here, interesting move
I think the accelerating has stopped. I actually found 2 green bars on its 30 min chart!!! My acct has actually reversed up, but still badly down 3.6% – some favs were down 6%. I am getting some (not all) hourly pre-buys which only means that my hourly buy indicator has turned up. Just looked and GDXJ has an hourly hammer forming. So, maybe the worst is over?
Two hours later: We have lost the hammer mentioned above. I guess we have a screwdriver now. Or maybe I need to drink a screwdriver. 🙂 I’m down 5% just between GDXJ and GDX holding on.
GM everyone! Wonder if “they” are taking gold down again in reactive behavior to
the increasing manipulation lawsuits against them? Also, “they” don’t want gold
to show end of year the best trade so knocking it down . . . last chance and new
administration next year won’t allow it.
We have reached “peak” everything (except the DOW) so gold should be $5,000 by now, jmo.
Have been in since 1998 so am modeling “patience” . . . . it pays off . . . .
It is wise to hold physical overseas, too.
This group is great – really logical and careful – sharing to help each other.
You are wonderful!
Hey Seer
Thanks for sharing your ideas. I hear a lot about “Them” lately. ”
I’m thinking that “THEY” may be taking Gold down to a Bottom at the FOMC meeting, and GDX might even SYNC UP with GOLD on this next low.
Either way, no leverage at this time is important i.m.o.
Maybe we double bottom in gold here, that would confuse most..
Thoughts on MTL Alex?
Huge run since August, I would expect it to consolidate for a while. It may seek out the 50sma , I’d just wait and see what it does in that area.
To see how “Consolidations” can play out after a huge run like that, check out FCX or CENX all this summer. Another type is MUX , VGZ, after their strong run up, or ‘X’ in May & August.
Or they can just keep going like CWEI Bouncing off of the 50sma.
As Jim Sinclair’s latest interview on USAWatchdog.com says, we are trading among the “black boxes”.
There is no market, no sense. The boxes will eventually want a rally so here we wait. Seems to do the opposite
of what a normal market would produce since August . . . . the global situation (India, Venezuela, Europe, Citibank going cashless, corporatocracy/central banks/technocracy) continues to deteriorate so maybe Andy Hoffman, Miles Franklin, will be right this time “hint hint” gold and silver will rally when the rates go up next week as they did last time (today’s article). . . . or will the black boxes manipulate the opposite . . . . All I can do is keep the faith in real money and the mining stock trend (up) . . . we will go up . . . . Thanks for your input when to go in and out of miners . . .
8% loss on jnug craaaaaaap!
guess i’ll take alex’s advice and trade something besides 3x.
giggle … yeah fred.. i have fought him for yrs now … kicking and screaming… buttttttttttttttt .. he is SOMETIMES right ;o)
https://uploads.disquscdn.com/images/aef52549812b1098d92c0e287f9a817f4fdeb0b7a79eda422d762fba01a5b77c.gif
yeah I am going to quit swinging for the fences.
I’d be happy to only have 8% loss!!
Just a stone’s throw away from sync between GDX and gold….even if gold doesn’t make a new low (which looks likely) – that seems like the best scenario for us all. Would likely lead to weeks of solid gains….All it takes is GDX below 20 or so – correct?
They could synch up with new lows next week on Wednesday/Thursday. Maybe miners put in an extra cycle? Like, would they both be on 1 and miners had 5 daily cycles? Or did they waste 1st daily cycle and hit 2nd as Gold hits it’s ICL? I don’t know, lots of options.
I’ve got to believe this fast run up in the $USD has got to be hurting businesses in a big way. There’s got to be some lobbying by someone, somewhere to some central banks (maybe?). On the other side this will probably help keep inflation in check in US and maybe make Yellen and gang a bit less hawkish. Having said all that…stops in and I ain’t moving them. Sometimes it’s better to take the pain rather than lose a limb. Bit sad, but there’s always another trade.
Gold seems to be taking too long to break to new lows, so reverse already!
not today; it’s dead
It won’t happen before the rate hike. No reason for irrational hope on mon/Tues. I think we just need to watch and then be ready to act when the pattern emerges.
SOOOO … .im still watching this pattern playing out – in case anyone is following along…. giggle .. but im posting this chart
https://www.tradingview.com/x/ZyqnmSRY/
and this song with it…………………
https://youtu.be/Hz64hWng2vM
Love the Kinks. Great song!
Maria- what’s the methodology behind this if u don’t mind sharing? Ty
to the Kinks? ;o) smirk
…………… ohhhhh no methodology –it’s merely an ‘observation’ on my part . I enjoy studying previous patterns& waves- tho this does technically ‘count’ the candles and follow along w/ cycles- if u will —I simply copy and paste the candlesticks from one time period & overlay them onto our current time period.
i save these charts and check back on them often to see how they are playing out/filling in. some play out candle by candle… it’s freaky… some fail miserably and bolt off in a different direction… yikes! and some i just adjust by a few candles and they are good to go….
— I just find the charts/patterns fascinating ….. obviously it’s no predictor of movement, simply a study of what was….
https://uploads.disquscdn.com/images/e7843b7216b8576f3a320bc3f10e3c0870ffc5ff7ddb28fb619ec9e7be723a30.gif
like for instance this “period of time” I am studying of late… just a pattern i found on the Gold chart that looked similar to where we ‘might’ be in a wave structure… I simply copied/pasted the bars/candles onto our current time period
pretty cool ….. again .. it’s NO predictor .. but kinda freaky similar 69 weeks of price action.. Low to Low.
https://www.tradingview.com/x/8nR661eA/
1965???.. 😉
Alex, please make this stop! JJ. well…voluntarily paired most of my holdings into the weekend. Small positions still held (all in the red). Figure by eod maybe people square up or when they come home from work they’ll realize the carnage and Monday becomes the flush day. As Jeff Saut famously says “rarely on a Friday…” (do stocks bottom). GL all. Another week…another set of bruises. 🙂 Canadian Crown Royal on counter looking mighty tasty about now!
Yes, I had to sell some today. I couldn’t go into the weekend as heavy as I was with Fed next week. And wanted cash ready to deploy as needed!
new low in gold… day 44?
Hi Dave- doing the weekend report, and yes that is likely.
We had a prior one at day 45, so it is possible, and the weekend report will explain how.
Alex, thanks for your call on PACD. Nicely done!
Oh good Pat, I hope you took it. 🙂
I bought 3 right at the open and it worked out nicely fro a trade ( NADL, AREX, PACD)
Sold my NOG , but may look to get in again if it dips a bit deeper.
Yes, bought and sold for a quick 7-8%. Pretty much offset my PM losses. Trying not to be greedy :). Still holding a few of the others. No more PMs until we get a swing. Thanks for keeping us in the game!
I love it – Nice trade!
Another ray of hope. Two hours after we got an hourly hammer on GDXJ, an hourly doji (but with a red body) has formed. Let’s hope that this doji holds.
Here is info on a doji: The Japanese say that whenever a Doji
appears, always take notice. A well-founded rule of Candlestick
followers is that when a Doji appears at the top of a trend, in an
overbought area, sell immediately. Conversely, a Doji seen at the bottom
of an extended downtrend requires buying signals the next day to
confirm the reversal. Otherwise, the weight of the market could take the
trend lower.
Well, the last bar on the hourly GDXJ was a green doji inside of the previous doji. I take that as a good sign to enjoy my weekend. Have a good weekend all.
Have you checked out the weekly, though? I’ll post GDXJ above. It’s a bear flag.
Bad day at black rock.
Ugly and dissapointing
Was researching what oil did last December when the rate was raised…don’t know whether it was related to rate rise or not but oil dropped some…then had a small pop up at end of December into first of January…then proceeded to fall…likely was just in range for falling into it’s ycl or something…but….just wondering if it will also fall if rates are raised next week..? Currently I only have any oil positions, have been out of gold for couple weeks…trying to figure out if should sell any oil…
Tammie have a look at USO. It’s on day 18 of a cycle that could run 30 to 50 days. That means it either topped 4 days ago or will do so soon, likely. No one can say for sure, but playing counter-trend in oil on top of playing counter trend in gold miners just seems like double trouble.
What do you mean by playing counter trend?
The market for gold miners is in a clear downtrend since July and we are investing as if it is going up.
No, not investing , trading & monitoring as it goes. As mentioned in my reports, we would enter near a low ( Did that) And monitor going forward, expecting an ICL.
That is a method of getting in near the lows at an ICL, especially if the Gold Bull Market is still in force. This would be a “Correction” in a bull. IF the bull has died, we move on, but a 50% or 61.8% “Correction in a Bull market” is normal.
And no one has to buy the low, as I have mentioned repeatedly. I have said, ” For those more conservative, wait for a confirmed Daily cycle low.
We have not had that . Stay on the sidelines until we break the downtrend and you’ll be fine, you’ll just miiss the first leg of profits. Stops should minimize losses.
Right, since it’s in a downtrend I’m not playing it at all, on either side, just staying out for the time being 🙂 🙂
Counter trend in Oil or Energy stocks?
You see energy stocks in a downtrend? XLE broke out to new highs for 2016, and many energy stocks did too.
REFRESH
.
Going long energy and looking at the XLE, I dont see that as a countertrend trade. The trend is up.
https://uploads.disquscdn.com/images/29bc44ca9f7d1317b025aa6c6f5715864a5cab6d8c929c9d900746ebe56ad65d.jpg
What got you out of gold two weeks ago? I want a clone of your crystal ball. 🙂
I sold all and took losses so it wouldn’t fall any more…..now I’ve been playing oil and actually making a tad….waiting for gold to finish whatever it’s going to do, keeping close eye on gold….waiting til after FOMC….
Thanks. Have a great weekend!!!
You too! Christmas party here at the house tonight so I’ve been going between watching the market, cleaning the floors, making goodies….:) 🙂
enjoy the party Tommy!
haha, love my nickname! Thanks! I’d say come on over if you were near North Alabama! 🙂 https://uploads.disquscdn.com/images/71677566c681364cf2ea80d79b22d35cabf3fe55bf606fc5a442bfd24c6a9cca.png
hang on.. i’ll just pump up the dinghy in the garage
I waited and waited and you never showed up! I had to eat your slice of cake… https://uploads.disquscdn.com/images/18201a1c3ceadec8bf27f6e7a9ed2eea6603013b97047ce1314d4fc705374200.png
i’ll be there in about 6months… Atlantic weather systems permitting
haha!
I kept holding a few years ago and it kept going down, didn’t want to do that again….I actually held longer than I should have this time too….hindsight is 20/20….I’m learning…..:) But if I was still in right now…..not sure I would sell because surely it must be close….
Every day for last 6 weeks I’ve told myself that…
Have a Good Weekend All …. Im off to make some xmas cookies w/ the kiddos ……….. 🙂
PEACE
M
I just checked my account. I’m off to have a stiff drink.
Dear all….
I just read some minutes ago:
“So technically gold printed yet a new low this past hour… yet, GDX still hasnt even broken the 3rd higher low at 20.27 Hopefully that is a good sign”.
Wow! Just looked at COT. Almost back to OI levels of feb 2016. IF this is a bull the next leg up could be another doozey. I’m mostly out for now but happy to wait for some real confirmation instead of this in and out stuff for small paper cuts…and some major abrasions :-).
Man, I was posting early morning on yesterday’s post – didn’t realize that this came out in the middle of the night. Anyway, here’s the weekly one GDXJ. sorry that I’m on mobile so I can’t mark it all up like usual. (Kids on my laptop playing video games).
What pattern do you see? That’s right. It’s called a Bear flag. (Just look at Nov/Dec) https://uploads.disquscdn.com/images/4475d76fa800d6c429db096329340b20457c77ca5c5adb1ec6a161f745d1cea0.png
So, for the last 7 or so trading days I have sounded like a broken record saying that “we are too late to rally” and today that was proven true. Gold needed to get higher before the rate hike but has failed. I firmly believe the immediate aftermath of the hike will lower, probably quickly. I am only talking minutes or hours here, at most, NOT long-term. Alex showed how last year the hike was eventually bullish and then in Jan/Feb we took off. I was hoping we could get 1 month ahead of that and rally in December. Now exactly 1 year later appears to be in play!
So, what am I going to do about it? I would recommend a hedge if heavily invested. Am I selling my core? No. But I sold my juniors that were still in the green today. I wanted to have flexibility for next week and not be locked in heavy. Starting to buy JDST, DUST. Could we take off and just rally? Sure. But if we slam I MUST have some protection, I can’t afford new lows. If we rally immediately from Wednesday and I lose a few hundred $$ on my hedge? Perfectly acceptable. We hit an ICL (for real, like it ACTUALLY happens) and I’ll make that back in under 1/2 day. Ok, there’s my plan, thoughts, and advice. All unsolicited and free!
Can’t beat that price! I have to agree I have been feeling a lower low in the offing, but how much lower and is the gold bear still ongoing? I was in miners all last fall and felt the pain of new lower lows, but when the bottom came it was a huge move. A lot I read here and elsewhere says last years low in gold was a major low so I’m still on the ride, hopefully not wrongly, but we’ll soon find out : )
Hi Ann, I am not bearish (yet). I hold hope eternal. But I want folks to be cautious early next week. Pretty much exactly what Alex said earlier. Might be OK to scale back and wait. I would strongly encourage a hedge, and refrain from an add yet, imo.
Cason- how are you seeing nat gas here? Seems the bearish engulfing failed to follow through?
It did fail, you’re right! It’s interesting, it was clear on UNG but NOT on $NATGAS continuous contract chart. The weekly looks SWEET! BUT spot gas is 20 cents outside weekly BB. That’s rare. To go all Ken on you, this is ii of 3. You can very clearly count the Primary wave 1 & 2 on the Natgas chart. Next up is wave iii of 3, Ken’s favorite!
So, we’re overbought and ready the start a pullback, I choose to hedge but not sell and not out right short. The weather forecasts got COLD QUICK! Once that moderates, we’ll pullback but launch again in January! Charts to follow later.
Thanks, I’ve had some luck on nat gas this year after many failed tries in previous years. But I did sell on the bearish engulfing, although my thoughts are that nat gas will be a huge winner this year. It’s a hard one to predict, but I’d hate to miss a parabolic move higher, but if there’s going to be one, this year would be it!
I thought gdx had an ABC from aug high to oct low. then an X from oct low to nov high.
next gdx had an A and I thought I could play the B wave. I didn’t make diddly. so the C wave could equal A. bad news for miners if this is right. I was looking for the worst case and I came up with this FWIW.