
FOMC – An Interest Rate Hike?
I’ve been wanting to answer a frequently asked question and that question is,
” What will happen when the Fed raises interest rates?” Let’s take a look at what has happened in the past, and then maybe we have some historical precedence to go by.
Interest Rate hikes
I have actually been repeatedly asked the question , “What will Gold do in a rising interest rate environment
The answer : Historically, Gold has been bullish under those conditions. I was trading back in 2004, and back then the FED would actually come out at 10:30 a.m. Eastern time while the markets were open and do a ‘surprise’ rate hike! Once the dust settled, it was bullish for Gold, Silver, and miners. The initial reaction was a bit jittery due to the surprise of the rate hike, but as you’ll see, interest rate hikes were bullish for the Precious Metals markets.
.
I want to first note 1 difference and 1 similarity between 2004 and now.
1. Gold was already in an uptrend after putting in the lows in 2001 (different than right now).
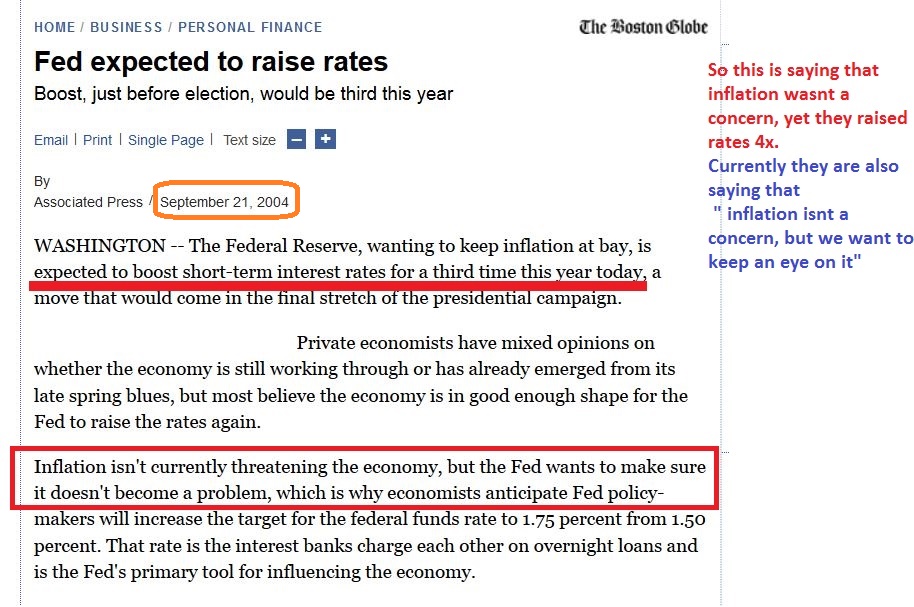
2. Interestingly – The FED said in 2004 that inflation was NOT a concern (But they raised rates 4x in 2004). The Fed has said that a few times recently too.
—–
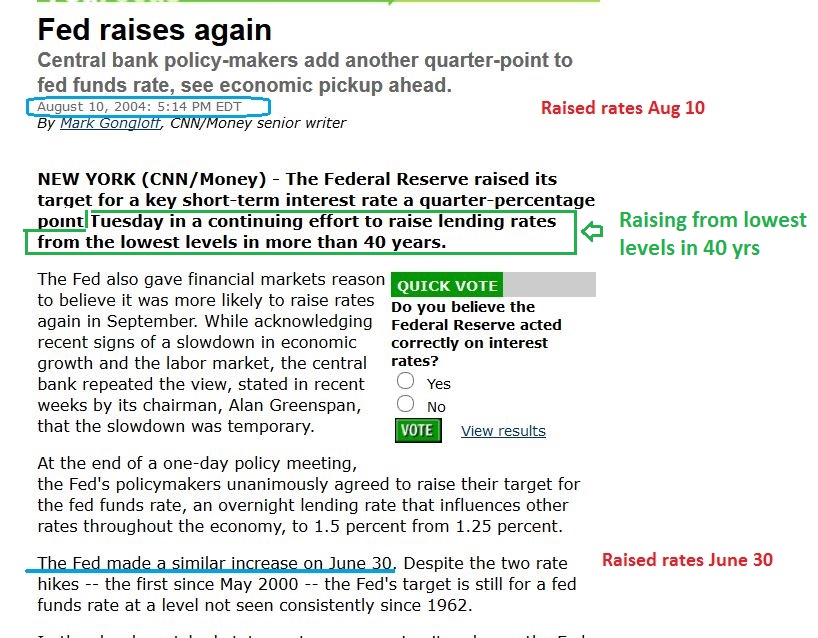
Please note the dates : This article discusses 2 rate hikes in 2004. June 30, 2004, and then AUG 10, 2004.
.
 .
.
Please note another rate hike SEPT 21 , 2004 & note the comment on inflation that I boxed in.
.
.
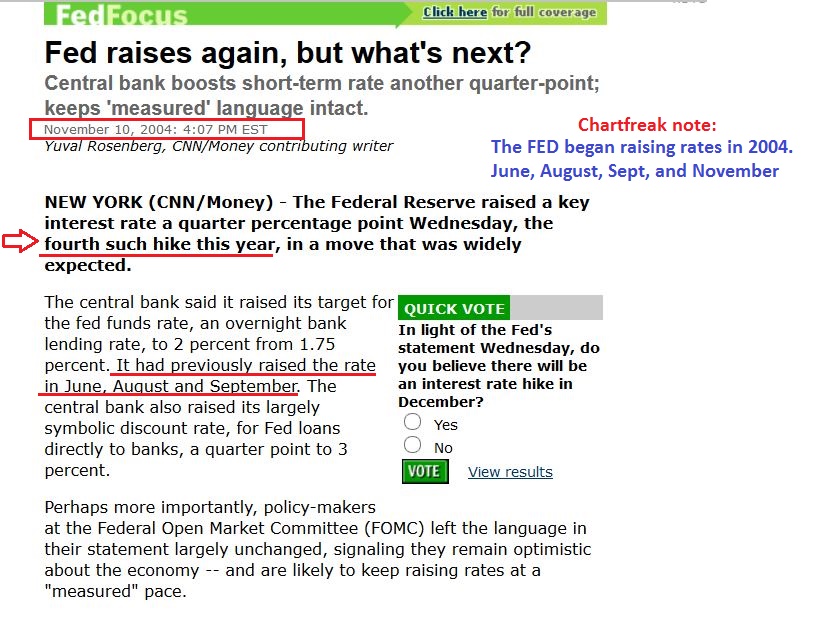
Please note November 10,2004 … a 4th rate hike in 2004. It mentions JUNE, AUGUST, SEPTEMBER and now NOVEMBER.
.
.
So now we know that the Fed raised rates in JUNE, AUG, SEPT, NOV 2004 – what did that do to the markets?
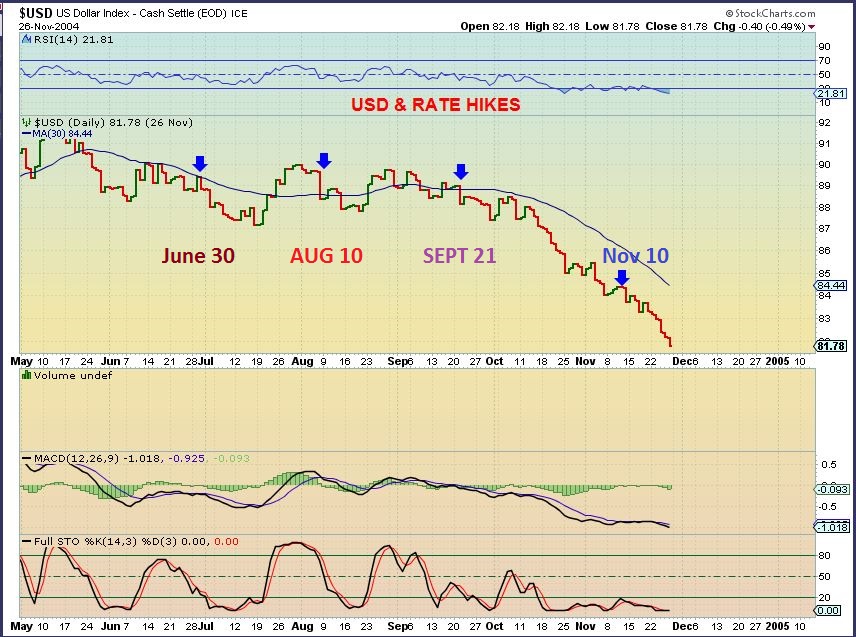
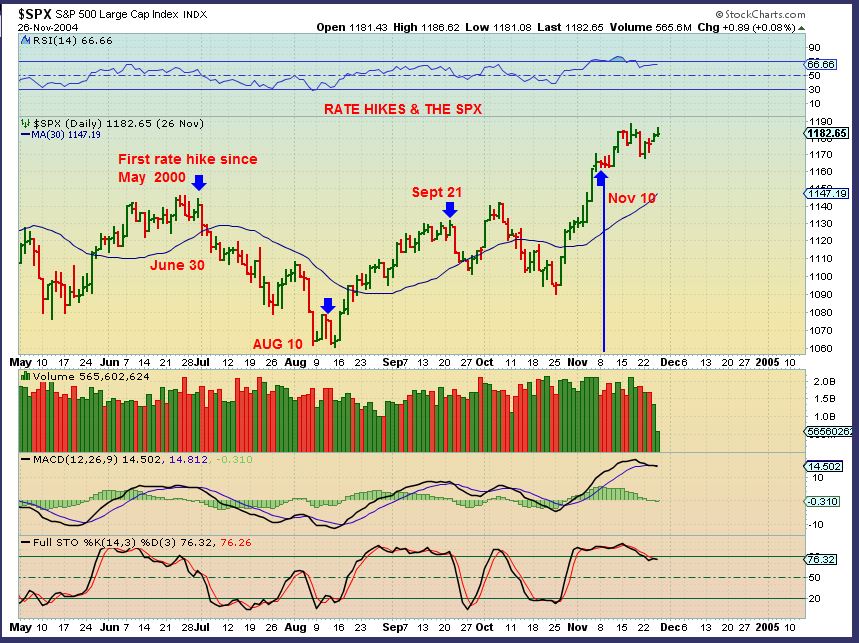
I have read some articles saying that rate hikes are USD Bullish. It wasn’t in 2004. The blue arrows are where those rate hikes took place. Right now, we have a very bullish USD and it is hurting Gold & the Yen. We’ll see what a rate hike does if we get one Wednesday.
.
SPX – The markets had a mixed reaction when the Fed raised rates. Markets dropped and got jumpy at first, but overall they were higher after the 4th rate hike.
-
June rate hike sold the markets off.
-
Aug sold off for 2 days and bottomed
-
The Sept hike sold the markets off too( For a week)
-
Novembers hike stalled a climb.
The one we’ve all been waiting for…
,
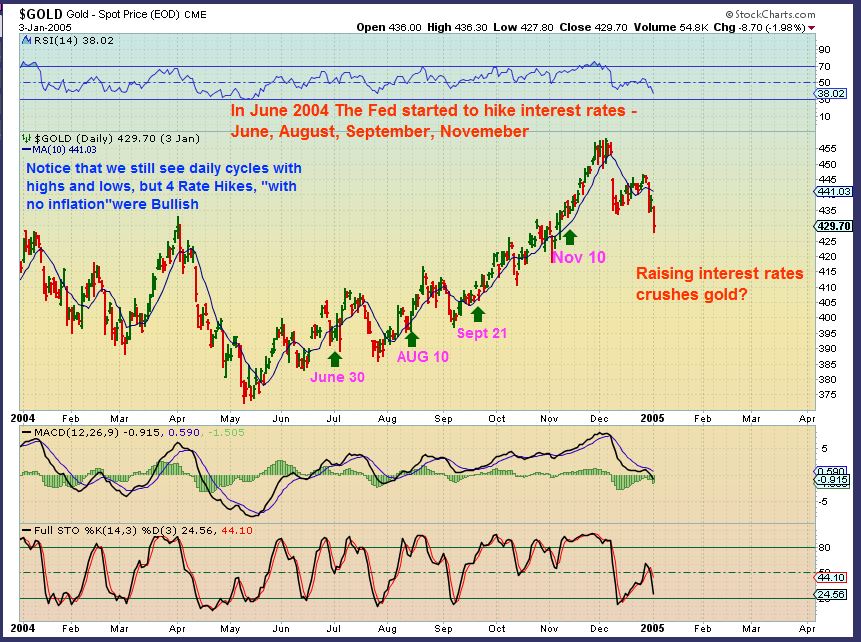
What happened to GOLD when interest rates were hiked after being held down for 4 years? Gold actually popped with each rate hike.
Big picture : Gold went higher from May to Dec, with normal pullbacks. Interest rate hikes did not kill Gold, even when the Fed said , “We are currently not concerned about inflation.” They say that today too.
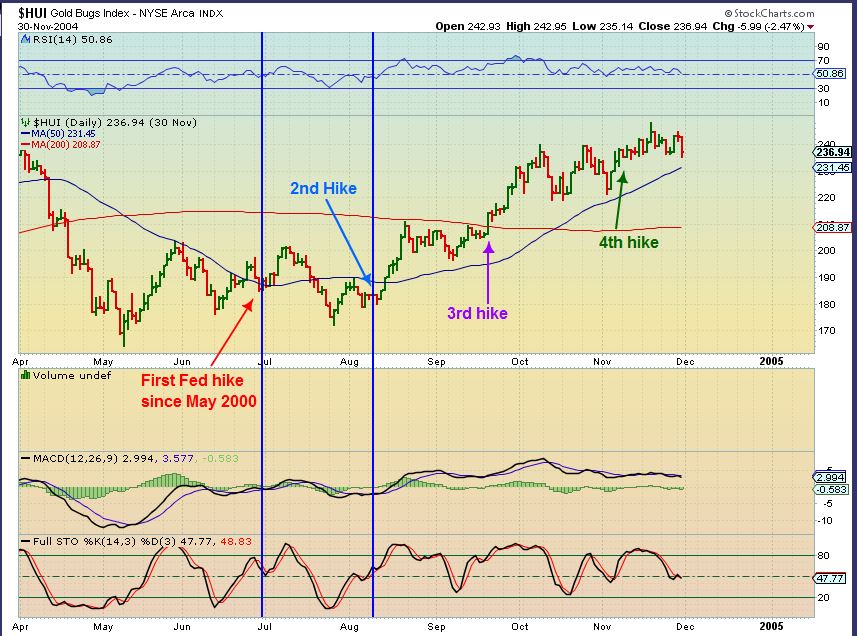
MINERS – GDX was not around back then, but we used the HUI & XAU to track Miners. I see normal cycles, maybe you’d see a 1-2-3-4-5 if this was a weekly chart, but any way you look at it, rate hikes did not hurt Miners. The HUI went from $170 to almost $250 from July to Nov 2004. That’s a rise of about 50% with 4 rate hikes in 1 year!
In conclusion: “What might Gold & Miners do with interest rate hikes?” Gold & miners went higher in the past. However, current conditions are bit different. Gold had already bottomed and been trending higher in 2004, so what WILL happen this time remains to be seen. In Dec 2015, Gold bottomed on Dec 3rd and then the Dec 14th hike Popped Gold. The next day Gold saw a fake slam down for one day, and then Gold went higher.
Big Picture: Another area to think about is in the Commodities sector. Last February we made a lot of great trades here in X, CLF, VALE, CLD, AKS, CENX, etc etc etc when commodities bottomed. That took place after the Dec rate hike too. The trades or investments that look to present themselves over the next few days, weeks, and months could be very profitable. The $USD may not like an interest rate hike, and that should push Commodities, Precious Metals, and OIL higher if the USD drops. The changes that are developing could become major turning points, so we’ll keep monitoring the big picture as well as the short term trades. Thanks for being here and welcome to another Fed Wednesday!
~ALEX
.
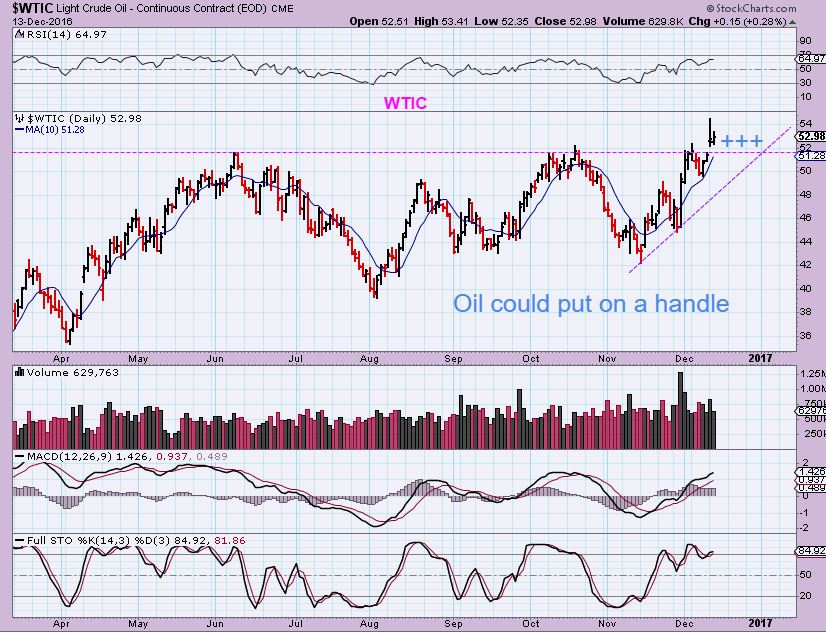
Energy update: From yesterday, I was picturing possibly a consolidation in Oil after breaking out.
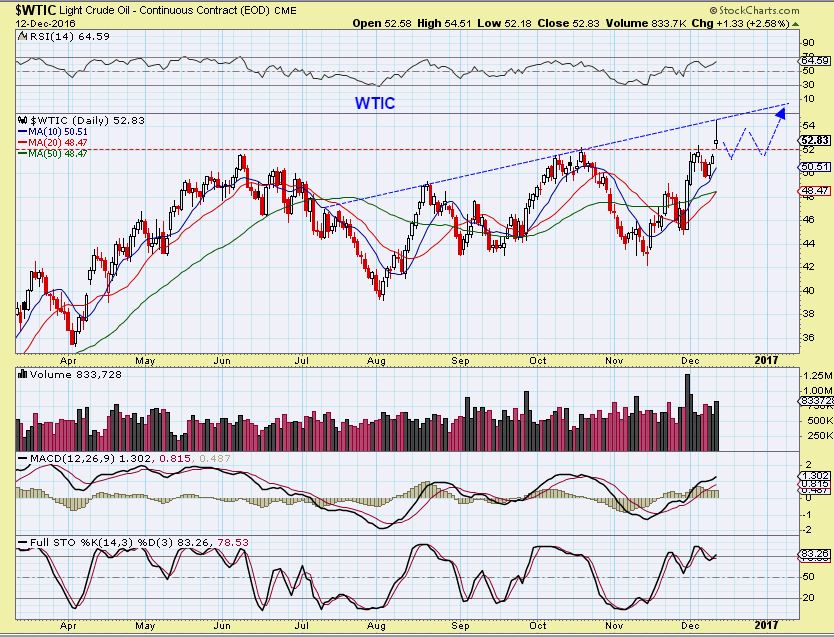
I mentioned that even though Oil may go sideways, some of the non – extended energy stocks could still move higher too.
AREX– This is still holding up above the 10sma
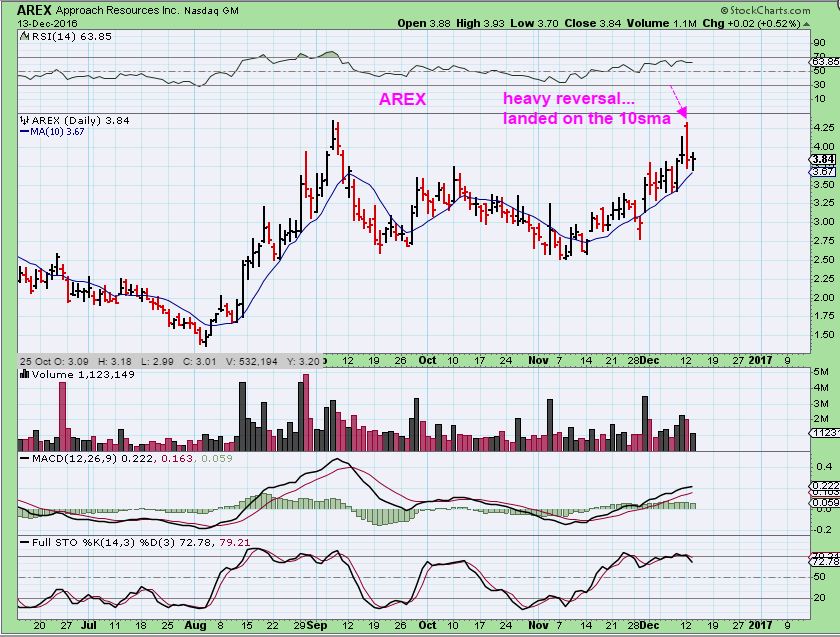
In Tuesdays report, I did mention that some may be extended and need a rest. We had a strong reversal on OAS, so I drew a possible path to look for.
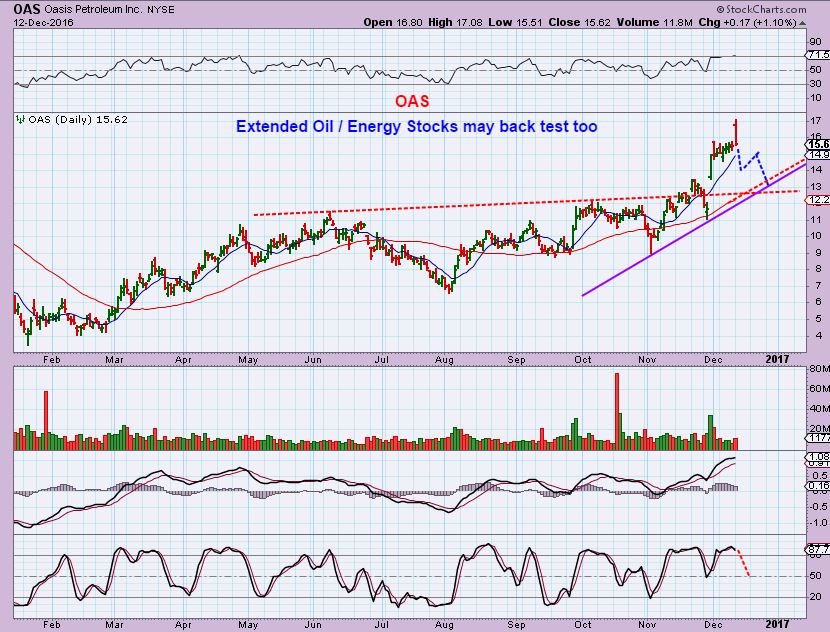
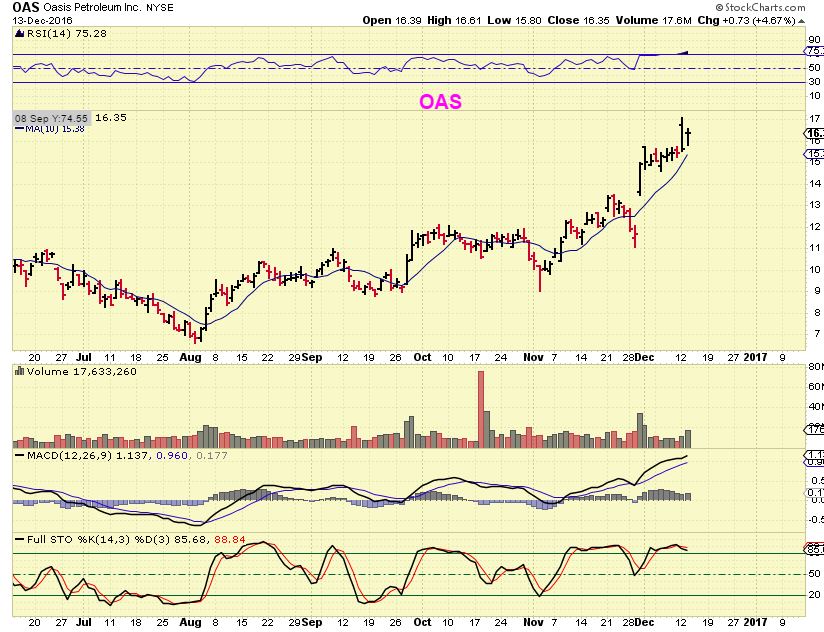
OAS – So far , this also held the 10sma and closed higher Tuesday. Maybe even some extended Energy stocks will just consolidate sideways?
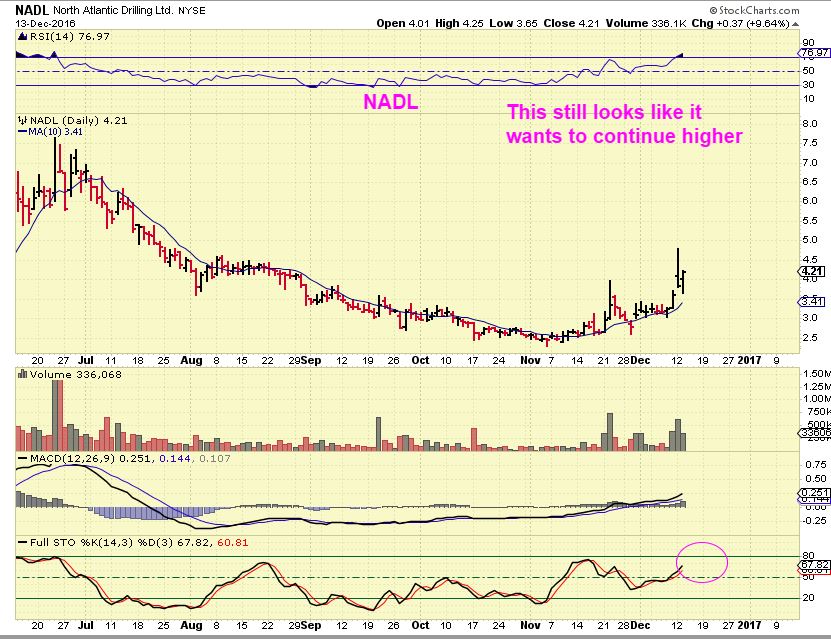
NADL – This was not extended on the stochastics, but it reversed strongly off the top on Monday. Tuesday it sold off further, but then it and PACD flipped higher and closed up. This is not extended, it is just moving out of a base at the lows, so it could continue to climb. I own it and I’m watching that 10sma for now. ( I sold my PACD, but it could move higher too).
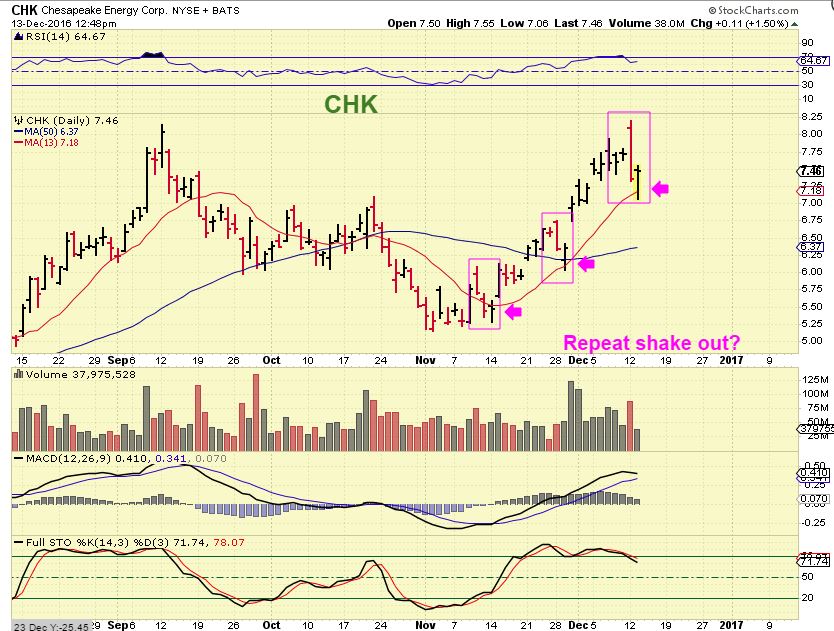
CHK – This dip kind of looks familiar.
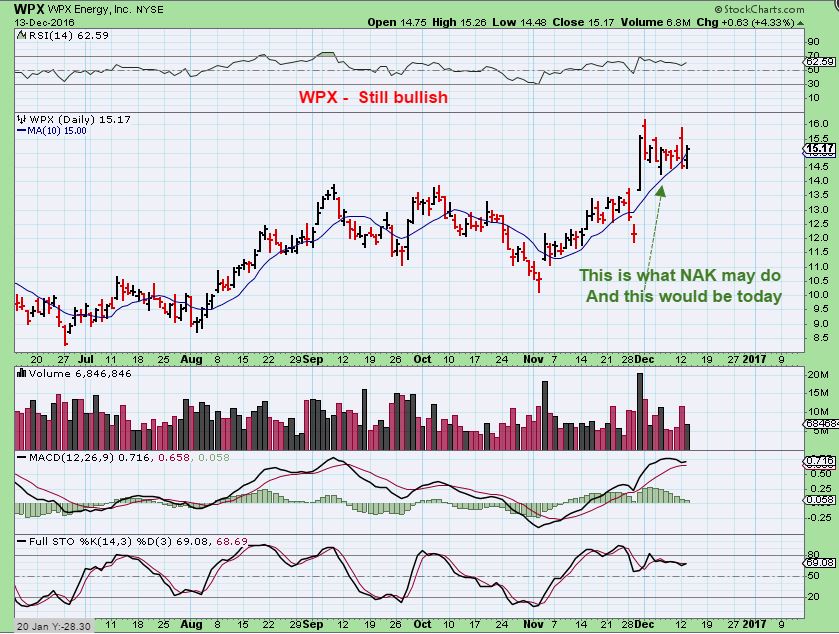
WPX – I have been pointing out this set up for days as bullish, and it remains bullish. Keep this sideways consolidation in mind as I review NAK.
NAK REVIEW – On Dec 12th when NAK ran higher, I said that I sold a partial around $2 ( I posted in the comments real time) and mentioned on thi chart that would buy again below $1.55.
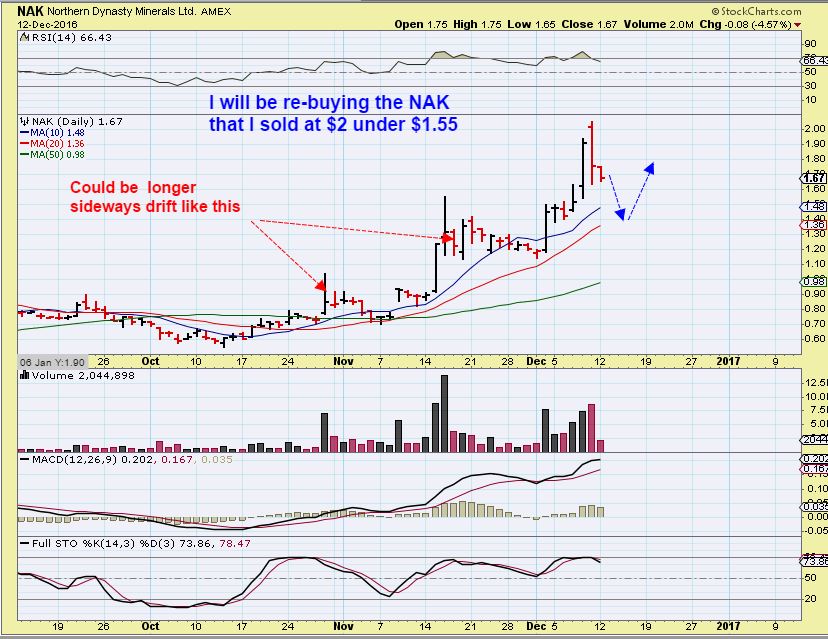
NAK this morning dropped further and I drew this and posted it in the comments before 11 a.m. eastern time. I bought NAK below $1.55 and a few others mentioned that they did too.
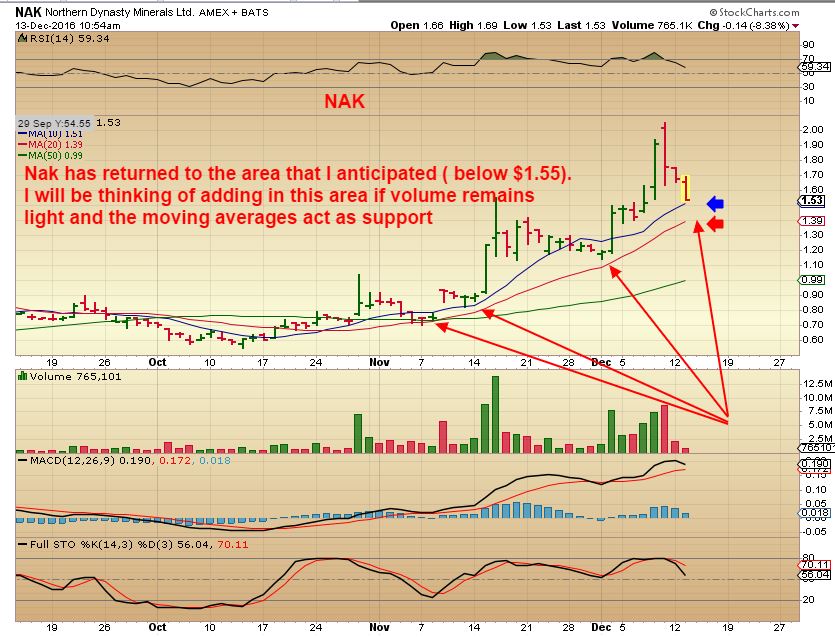
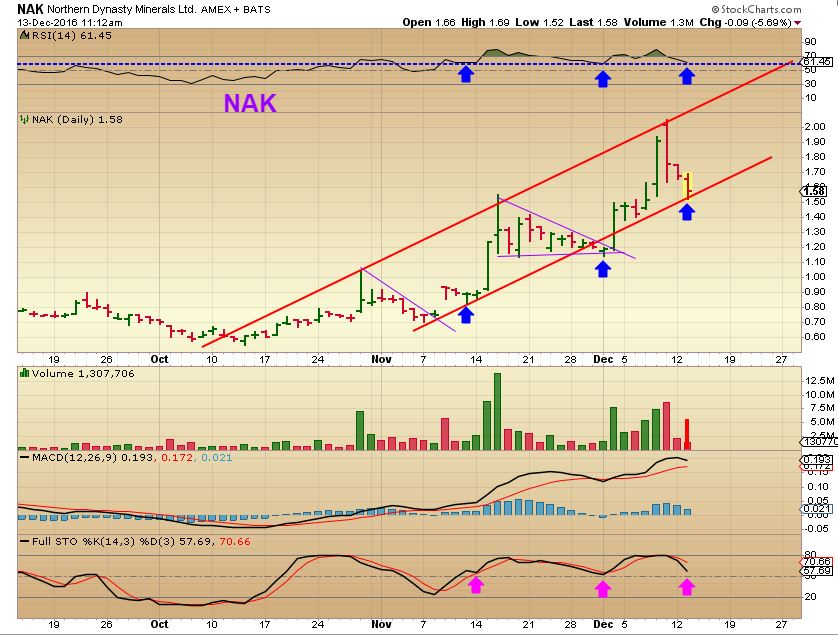
About 15 minutes later, I drew this idea for a friend that emailed me about NAK. I got him in at 70 cents in November and he sold when I did too. I was saying that this could be the next lows, along with the above chart hitting 10sma.
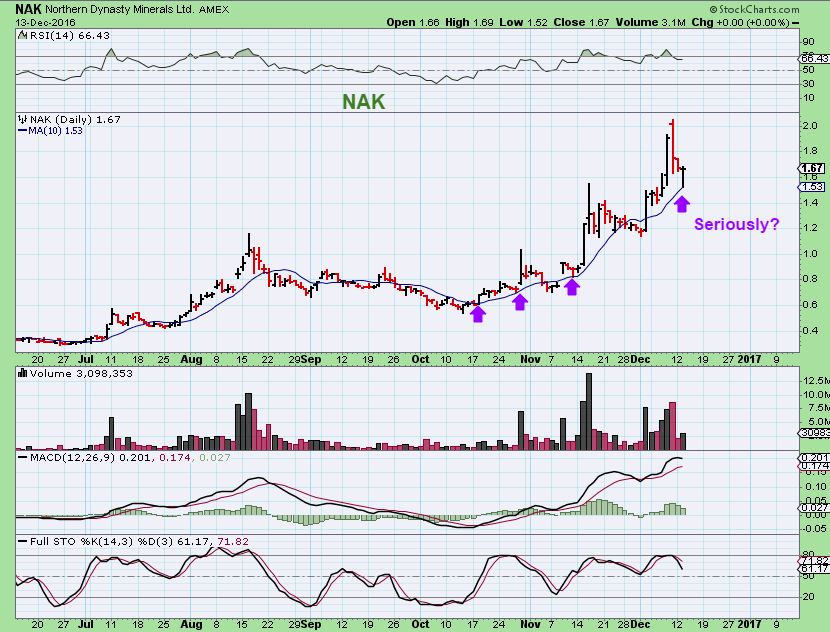
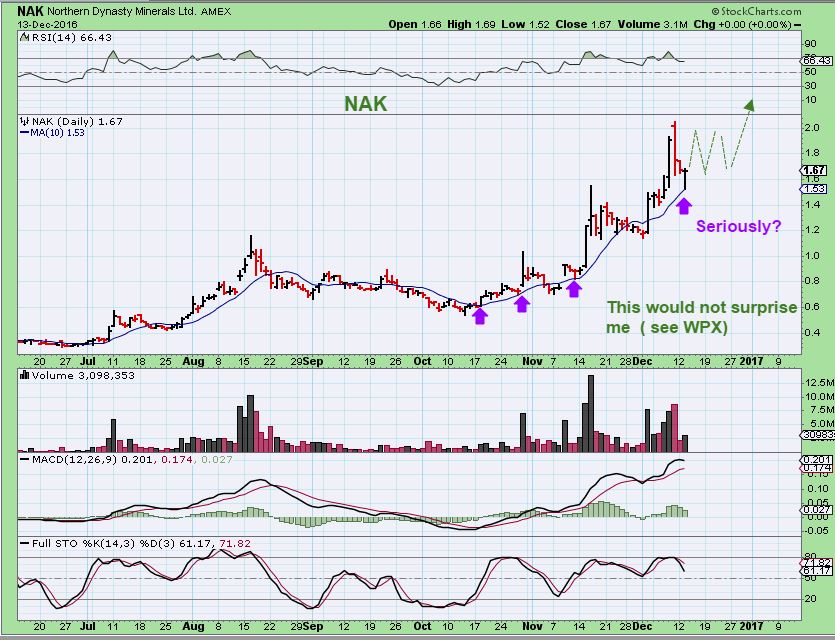
NAK – Seriously? It dropped right under $1.55 and recovered to GREEN at $1.67 by the close. If these lows hold going forward, that sell point and buy point was done with almost surgical precision 🙂 So is it off to the moon now? Maybe, but it also may just do this…
NAK: Going back to that WPX chart in this report, it may just consolidate a bit more. This allows anyone that didn’t have a buy order in under $1.55 to still hop on board. This would look much like WPX does now. It also look like NAK from Nov 16th to Dec 1st.
WPX with that sideways consolidation.
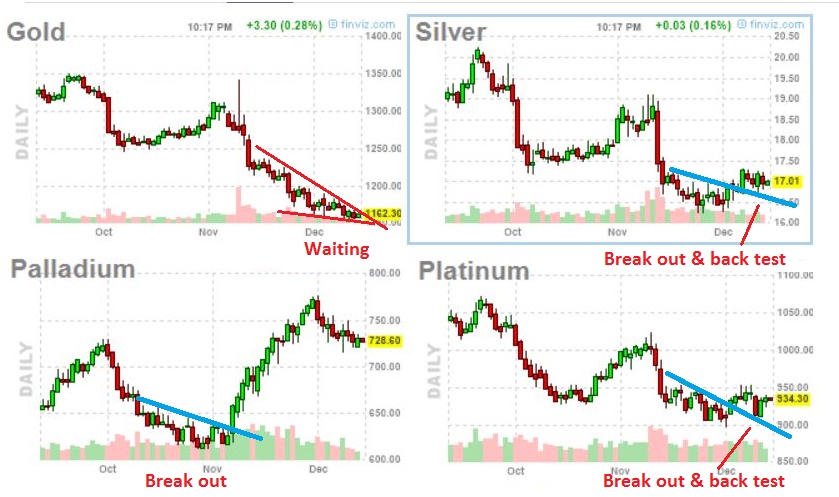
METALS CURRENTLY – Can we get a GOLD break out with a little help from the Fed please ? It certainly looks like we will.
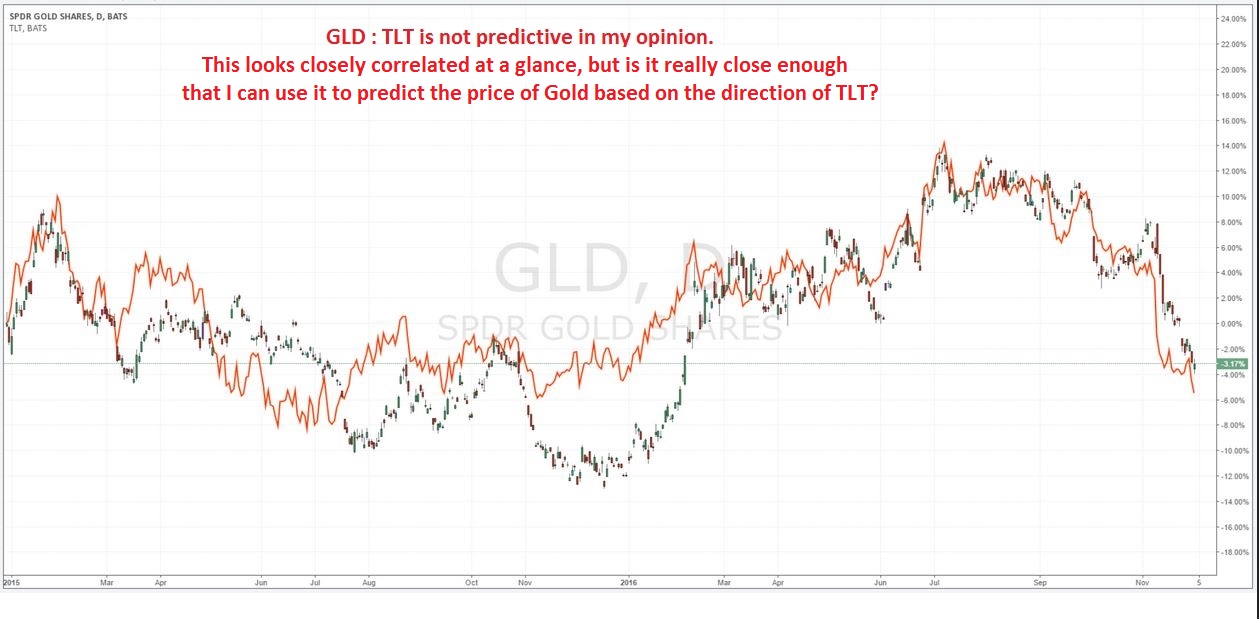
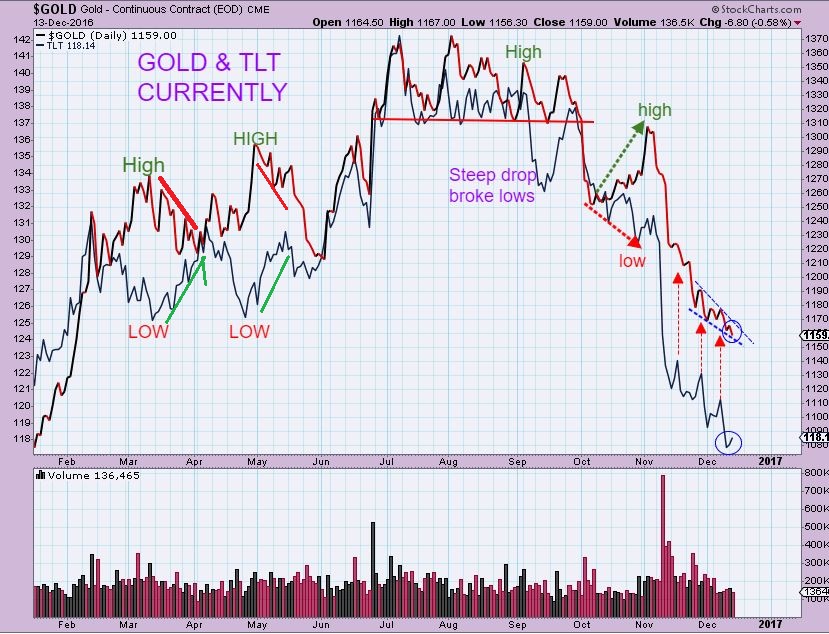
BY REQUEST: I was asked to follow the TLT when examining Gold. They seem to be moving identically. So I have to look at a chart like this and ask myself, “Is this helpful to me in predicting price movement in Gold? Are they so closely correlated that I can use TLT to say where Gold is going to go next, or can I use Gold movement to tell me where TLT will go to next? See the chart below. At a glance, one may think so.
 .
.
.
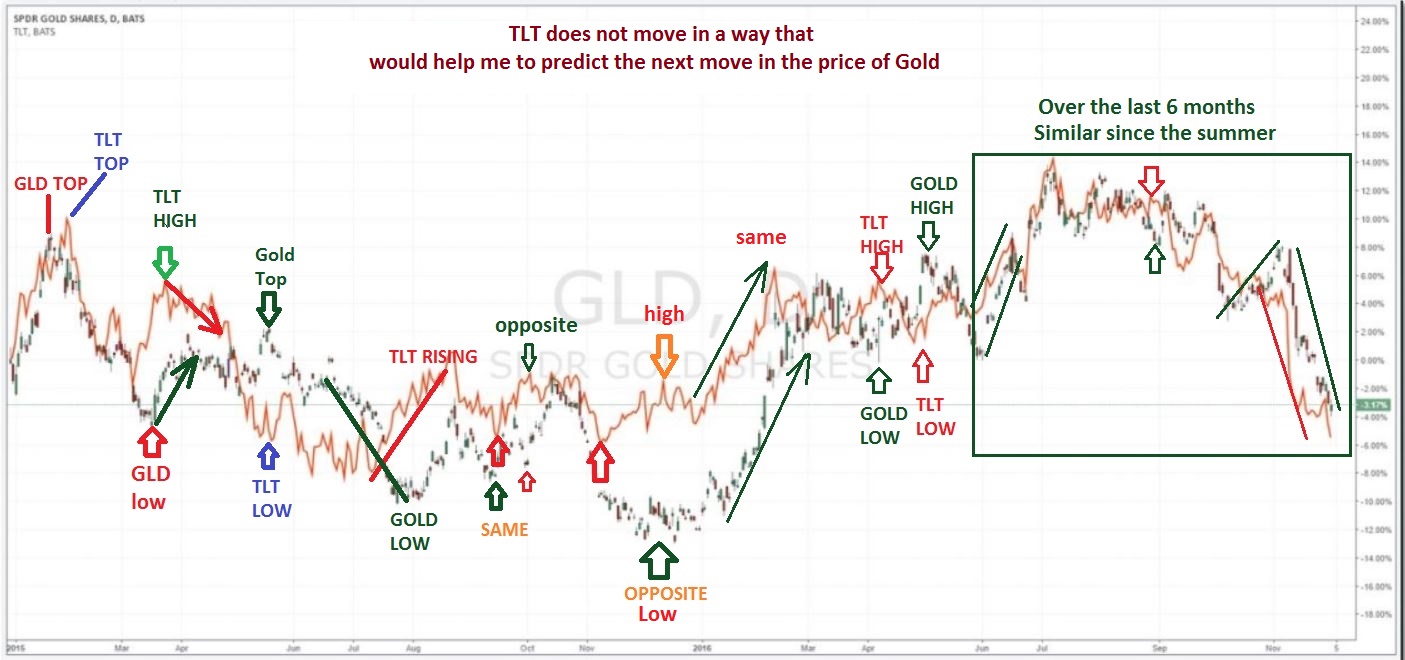
SO I broke the chart down, because “At a glance” they look in sync, but I do not find one to predict where the others price will go consistently. They move opposite at times, and similarly at other times. Sometimes they top together, other times they are exact opposite. Please follow this chart from left to right ( click to enlarge).
.
SO what about Looking at it in another chart? I do not see a consistently predictive way of using Gold and TLT. If you look at this chart, one could say that in the 2016 time period, they moved very closely, right? At a glance they look it. Do you see the wavy climb last spring (above April 2016) on this chart with both GOLD & TLT? It looks in sync at a glance, but it is actually the opposite. Lets zoom in.
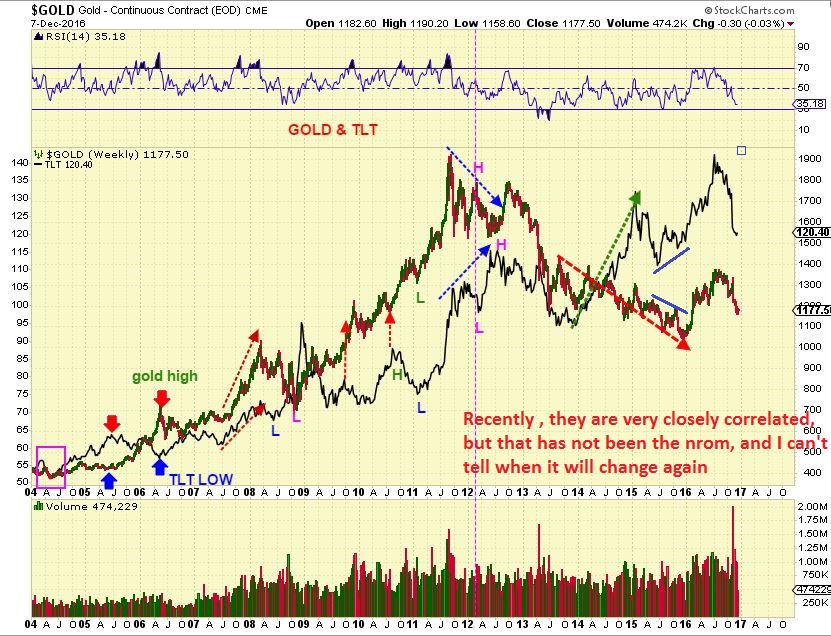
This is the wavy move from the spring of 2016. March highs in Gold are lows in TLT . April and May are the same. There were differences in September and October too. Using GOLD : TLT historically and even recently, I do not see a predictive value, other than they are both currently in a steep drop and may both reverse when The USD reverses.


Alex, thanks for the comprehensive report! Nothing to do now other than strap in and get ready for a crazy ride!
Great analysis, especially on the predictive ability of TLT on gold. No use in complicating analysis and it dosen’t provide an edge, keep it simple.
Hi Ralph,
I actually have never heard of FFMGF, but I do like the chart. Volume has died down quite a bot, but it was strong on the last run higher in April & July.
I’ll add to my list, thanks!
Anytime, love the site. FFMGF is the new venture project of Keith Neumeyer at First Majestic (AG). I’m not in love with any one miner, same with this one, just wanted to point it out since it seems to be the kind of stock you look at.
I have others that I do watch, but I do not mention here, because they have light volume. I find that light volume stocks can really drop on a bad day if many try to sell at once.
Examples that I never mention , but may be worth discussing in the future are
SGSVF – absolutely no volume at times
MXLGF – similar
DNGDF- similar
and there are others, but I am just waiting for them to get a little more volume/
Some also trade in Canada and they do have good volume on their trading on the Canadian exchange
Thanks for the thorough analysis. Still have quite a bit of trepidation. Will have to continue to watch very closely as we go forward. Most dangerous course of action would be similar to last year, imo. If we get a burst (miners) then deflate, hang on to lows and break the in January, no one could hang on. We’ve been at lows for 2 months, another month isn’t sustainable. Then when we do (eventually) rip higher will anyone be left for the ride at all? That would leave everyone behind just like last year. Would much rather see a move higher this week, then we just have to Guage if it is “real” and figure which wiggles to keep riding. GL all, see you after the bell.
I thought that we all might want to see how gold stocks are doing relative to TLT. Following is a weekly Renko going back a few years. It suggests that there is currently a high correlation between the two. Will it continue? Who knows? What was surprising in this chart were the positive divergences in the RSI and MACD. Happy days are here again? https://uploads.disquscdn.com/images/a67568670122de2d30e8e881d27d849e6b729332e28ebc88369c845f4570e7e3.png
Right, hard to tell if GLD/TLT is predictive. But it is clear that try have been Directly aligned since late summer. Question is does that pattern stay into 2017 or not? Could rate hike cause divergence?
I looked at GDX and TLT on Dec 9th too. I didn’t include it because why beat a dead horse— I do not find that you can use one to predict the move of the other.
If you think you can precit the next move of GDX by watching TLT, that’s fine. I’ve been asked to track them and use it for Gold & Miners. I can’t . I get no edge using it.
refresh
https://uploads.disquscdn.com/images/a8577c66c6b0c16b59625163448300702ecf2e96e998b81caed4ab4fe54aaac1.jpg
I agree. I was more interested in the divergences that showed up. I think that they should be inversely correlated, but charts don’t lie, at least the one I showed from Stockcharts. They are correlated sometimes and not other.
yeah, that is what I am finding. Sometimes they’ve been making Lows and highs together, other times exact opposite.
The inconsistency makes it tough to use it as a guide.
IAG up today with volume..any news? Quick look , couldn’t find anything particular.
I had some yesterday and got more via a buy stop. It simply looked good to me technically. Above is 50 wma and relatively stronger than GDX.
Thanks. I have this in 2 accounts…one holds things I have held for a LONG time…IAG in that account still has a ways to go to turn green…but it is getting closer!
Great. Mine just turned green this morning. I still have many reds needing to recover.
I think a month from now, we miner/holders will all be happy.
Banked profits in Randgold…not going to wait for fed to possibly take it away. Can always buy back. GL everyone.
OGC also been powering up over last several days on good volume. Glimmer or trap? Not sure…
I just checked the top 28 performing in my watchlist. All green, but nothing going wildly higher. Three are above 4%, the rest less. They could knock us down after Janet, but at least they will from a higher level if this keeps up. JNUG only up 3.3%. We want to see 10%, then a 20% day.
or a 30 😉
I’ve never seen a 30, but 20+ is sweet.
I just checked my top 28 golds, all green. Four are above 4%, but the 28th is barely green. All silvers on my list are green with FSM and TAHO above 4%. JNUG is +5.4, a good sign. We have ten minutes before the end of the first hour. And then there is Janet later.
My acct is pulling back a little, confirmed by my hourly indicators. 27 of 28 of my golds are still green, one flat. JNUG down to +4.5%.
25 of my top 28 in my watchlist are still green. Lode leads with +12.5 – wish I owned it. JNUG up only 3.5%. We await Janet.
Only 4 of my 28 are green. I don’t think we have settled down yet. My acct ‘rallied’ to down 1%, now down 2% like XAU.
Only 7 of 28 golds on my watchlist are green. LODE is still up 8.3. Should have sold everything is AM and bot LODE 🙂
VGZ (own) up 6%.
Would love to see all of the green miners have great follow through post-2pm. I hoping that this isn’t a “buy the rumor, sell the news” type setup…
They may whack us for several minutes, but better from a higher level. 🙂
Harvested the remaining profits on my USO Calls this morning….daily swing sell signal this morning.
great job kendawg
Thanks Maria….that was one nerve racking trade 🙂
Paid off though……
listening to some eagles this morn…
how apropo on a Fed day… ;o)
https://www.youtube.com/watch?v=Sx3kpa51EyY
Again Maria, Great song choice!
Thanks Alex for the GLD/TLT analysis.
Maybe a GLD/YEN analysis would be of some benefit? 🙂
Here is something close. Correlation looks strong, but for how long? https://uploads.disquscdn.com/images/d79f8d6c286cd868ef88444ca60f4cd5ff7d9c648472ad7164bff482f407dfc6.png
I’ve been using that for years. The Yen has been more consistent and has been helpful at major turns, but lately as we all know, Gold and the YEN are just riding the slide down 🙂
Alex, do you think maybe oil is just filling most of the gap that was there and will now push forward?
I do think that that is possible. UCO and USO have pretty light volume so far, so Oil could just be buying time ( Both of my charts in the report today – Mondays and Tuesdays were showing a sideways drift )
I think we are on day 21. Can Oil drop into a day 30 dcl? Yes. Can it go higher and extend giving us a 40- 50 day cycle, yes. Tht is why I hate cycles with Oil. I find them rather indecisive, but T/A shows nothing bearish in Oil at this point after that OPEC MTG surge a few weeks ago.
Nice scoop n score on NAK yesterday, Alex.
Thanks Ralph – You mean ‘so far’, right : ) NAK is up 8 cents now, but we’ll see if the FED can mess that trade upon me : )
While we twiddle our thumbs waiting on FOMC, I thought I’d survey how PM indexes are handling their 10day MA
At the moment, HUI, XAU, Silver, SIL, GDX & GDXJ are above (most just barely)
Gold came within a dollar this morning
now I think I’ll clean my sock drawer…
GREAT IDEA, CAL !! lol
practice up cFreak…. u’ll be playing for us when we all meetup for our annual festivities…..;)
JNUG cash secured puts for next Friday 12/23 are attractive.
JNUG currently at 6.88
You can get a $6 strike .25 bid, .40 ask; should be able to get paid .30 or 5%.
You are basically saying I’ll buy JNUG for $6 until 6/23 for 5% money right now.
If it does not go down to $6 you just keep the premium and will not be forced to buy it at $6.
In a similar manner the 6.5 put cash secured put would probably pay .50 or 7.5%
If you get put the stock you basically get the stock for the strike minus the premium you collect.
Thank you for the great reports with lots of charts. Everyone’s comments are helpful
and some make me chuckle! “MISH” just went short the dollar!
I’m trying to figure out why I sit around and wait on the FED…I mean….everyone knows they are most likely raising by .25…so shouldn’t that already be baked in to prices? But yet, we all know the market will react one way or another….it’s like we’re at the starting line and waiting for the gun to go off and we’ll either take off forward or backwards and we’re just waiting to see which it will be…:)
Brace for it! Here comes the beat down……..
CLF has a nice move today, chart looks good.
I agree-
CLF, VALE dropped and bounced off of the 20sma
AKS , ZEUS, X also have reversals.
I was waiting for TGB , CLF, VALE to see how they pull back ( So far so good), but I am waiting for the Fed reaction before I add anything more.
Me as well,
Yellen speaks at 2:30? I thought it was 2:00..?
2:30 Eastern…
Decision now….speaks after
Raised .25. Mine dropped, but almost back to even.
Drat. IAG dropped. Acct off 1%.
Drat, down 2% like XAU.
Wow! Spike down now we need to see if there is follow through…
More news – 38 electors are flipping on the 19th . . . . omg
Where did you see that?
Listened to live interview of Larry/Nichols. He has been correct all year. We will know by Jan. 6 or watch the news slant.
Where are you located?
undercut low on gold
Wow, look at USD/YEN reaction…up $1.13…now $1.16
Gold low so far: $1148.42
I got 1150 on TOS
I have $1148.50 on Trading view
We have to hold our vigil that gold has gone up historically after rate hikes. Sometimes it takes a day or so to rally.
its not behaving badly at all. We could have a “peasant” surprise before the close
Yellen starting to yap. We’ll see what that does. Lots of times the first move after a Fed announcement is a fake-out. We’ll see.
DOW is crashing!
Market Watch: Fed
sounds hawkish note, sees 3 more interest-rate hikes in 2017
Only shows -50 pts on my charts.
wow that was quick, Nice charts Alex, take a look at BAA its down around the Feb lows for a possible big double bottom
I’m short CHK though, terrible debt problems and I think it will drop down the way it did in September. I also recently shorted WING check out Tilsons presentation on it and look at his recent record 11 of 12 picks right with 43% average gain
The move down “MIGHT” be exahusted in preciosu metals. Several Miners never went red,
And Thank You Janet, for helping me to add to my NAK : )
Me too. Got more @$1.68
You did better than me today, I got $1.69.
I still think that it is possible that NAK just bull flags or goes sideways for a bit like WPX did in its chart, but I didnt quite buy all that I wanted yesterday on that dip.
would be nice to close green today on GDX
Refresh…
How about this , Dom. Would this be ok with a reversal today ? : )
.
https://uploads.disquscdn.com/images/4b8e6feb36e751522bb31495ee13409bd97578825aab01e436e7feae75630bac.jpg
that would be ideal
that looks familiar…..
hi Alex,
Did you went back in jnug nugt ?
No, It has only been 45 minutes since the Fed release. Short term charts are indecisive
NOG has held up well during this oil drop…green….compared to others I’m following that have dropped a good bit
ha! i was just lookn at nog…
Yeah, it’s one I want to get again…..at some point…..
And still it is going up….wonder what magic pill it has….
I owned NOG, was watching it with only a 13 sma. Check it out on a 3-6 month chart
.
Edit: I was also using a 20sma, but it clouds up the chart at this point
LODE, AUMN, VGZ , are still green and I am looking at VGZ as a possible buy if we get a reversal. It is still above the 10, 20, & 50sma (So Far).
I still think that it is best to see what happens into the close
VGZ (own) has gone red. Threatening recent lows. I was up nicely today. Drat.
Sadly, I just noticed that I have no daily greens in my acct.
Alex, I’m new here. What are your thoughts on LODE for a long term hold (several years)?
Hi TSF
Welcome to chartfreak
For a Long term outlook , it would be important to know the fundamentals ( Which I do not), but the chart itself looks to be bottoming and if the Gold bull is in tact, I would expect it to do well.
On a day like today, I saw it up 12% , so it does seem to be bottoming in this area.
Ok. Thanks.
I like it…. 🙂
Whatever Yellen has been saying in her press conference….market doesn’t like it….gold doesn’t like it….
Sadly, the dollar does.
The news of more rate hikes in 2017….good for dollar…
Did you see my chart of the USD and rate hikes in 2004.
in 2004, rate hikes had the USD selling off each time.
Why do you say it is good? Just curious.
Yes, that is true – I didn’t have time to read all through the report this morning 🙂 🙂 I do think the hawkish language of the FED this time….mentioning more hikes in 2017…people might take more seriously with the administration change/policy changes coming our way/people might be expecting inflation – so $ goes up based on expectation of future actions – not to say it won’t be short lived reaction because it might be just that before dollar falls into its low….:)
silver is remarkably still holding. I don’t look at it for “leadership” status but one would have thought that today was perfect for a good old fashioned whooping.
FCX is getting very interesting…….
Wave 1 of 3 complete…..currently working on wave 2 correction.
spot gold low now as $1144.10
Hard for me to tell on chart I am looking at, but I’ve thought for the past week that gold might get to 1125 where there seems to be support…if that breaks then 1110…I wish I had a more detailed type of chart to look at it with…
try PMBull.com
OK, where’s the rally. We only have 30 mins to go.
Unfort this stinks.. waiting to add a bit but we need the yen to stop getting stomped.
Ok, WTI and NOG, both of which I am watching….are green…NOG quite green….not sure what gives while other oils are falling….?
NOG fell sharply yesterday
Yeah, I was wondering if it is just a recovery bounce from yesterday….still, nice to see there are buyers out there even with oil down $2….maybe bodes well for when oil starts to rise…
I actually kind of wish that GDX would make a new low below 20.13, then Gold & GDX would have lows on the same day.
Most of my miners are not selling off in an ugly way ( GPL, AUMN, NAK, VGZ, etc) , but I am really glad that I took off leverage for now.
Leverage on a day like today makes the drop seem as though it will never stop ( though it does at times kind of seem like that already).
Wish granted
GDXJ too
No way! I looked away and it dropped that fast. Wow.
Now we really need that turn around.
GDXJ too.
So I just looked at the 3 or 5 minute chart. Looks like capitulation / exhaustion. We’ll see .
LEVERAGE would definitely been painful today
I agree wholeheartedly. Will be doing some buying before the close and tomorrow as I’ve largely been on the sidelines ahead of the Fed.
Good job on patience. I guess GDX just broke to new lows, so I would wait for a reversal close ( And of course, it is best to wait for a swing to be in place to be safe).
I’ve been sitting some in cash, waiting from what I sold last week. Glad my Spidey-sense tingles at the right time.
At least the S&P bounces every once in a while. Gold….stinks!
So bad day, Gold getting hammered and Tree House ran out of beer!
“Sad to report that all of the beer is accounted for in the current line. Thank you for your support and understanding – more tomorrow!”
And you stood out in the cold too.
Damm dude, guess it’s Milla’ Time
Poo. Of the 35 holdings in one acct..only my CLF is up today. Spot gold new low $1142.88 double poo.
35!!! Wow, I dont usually hold more than 5-8 (Maybe 10).
Bottom line: Do not sell low (red). Hold. It will go up again. The macro trend is up. Chin up. Patience.
Blow off move in the Yen/USD? Alex – can the new lows for GDX be intraday or does it need to close below? I agree, lets just get this pain over with. This is getting crazy stretched on all fronts.
It is a new low as of today, even it if did a reversal into the close.
What day are we on? This may be the best scenario to play out allowing for a more meaningful next cycle. In pain here, but looking at the bright side.
Jordan Roy-Byrne is adding to is JNUG position right now.
THANKS for letting us know The Seer.
Much appreciated!
Assuming you are serious, Jordan writes a gold newsletter, but very different from Alex. He is studious. He has been cautious in the downtrend, so him getting bullish may be a good sign. I get his weekly teaser, but not his newsletter.
no sorry.. i was teasing… I know who he is….. 😉
Yes, his position is sell/hedge coming bounce, new lows possible. But not until after at least some positive retrace. Seriously, we’re too oversold to waterfall from here. That would be ridic!
who is he? a member of chartfreak? ;o)
https://uploads.disquscdn.com/images/469a5912966dec234a68e7f339fa1e3e3d5da8e08e741f2eec5f997aeeb054aa.gif
Daily Gold
PQ also holding well…low volume…I don’t have, just watching..
GDX about to go under $20…
AUMN broke the 50 dma out
Yeah, that was the one holding up well for me.
boom boom boom…lets see what the money does on the break of consolidation to new lows
Don’t forget, we just had a full moon. Sadly though, either it means a bottom OR an acceleration.
refresh- Looks like a never ending falling wedge, but it should end with a good rally, like other steep sell offs
.
Patience will pay off, meanwhile some Miners are holding up. I’m not buying anything until I see solid evidence of a reversal, and that may not come until tomorrow if it comes soon/
https://uploads.disquscdn.com/images/4274fad4b0d0b058f1525947d6a03d50aa3bbf74e92b547f01558ab0d35abdde.jpg
We need to see if next rally is enough or if they just “broke” gold and rally is our exit. Won’t know that for some time yet.
GDX, GDXJ bearish engulfing today — slightly above average volume
Also GDX broke through 400sma – 1st time below since Feb. Needs to get above it
odd, I see many Juniors down 3-5% , some 6 or 7%
JNUG and NUGT down 17% NOT a fun day for those holding leverage .
unless of course ur in jdst/dust…. 😉
true true ( I am not)
yeah… me either… ha ha … but .. just sayn….
In both. But only as a hedge against my “core” positions. Defining core as a way to maximize losses over the largest possible swath of time.
My GORO down 8% and IAG, which I just doubled up on yesterday by being stopped in, down 9.6%, TRX down 8.3%. Those are leveraged prices on unleveraged stocks. Not a fun day holding those, but hopefully better days ahead.
This sector does have stocks that move as though leveraged, but JNUG was down 18%. Thankfully we didnt fool around with that.
DRYS new low today…..crazy last 2 months.
Whacked moves there. A lot of people got slaughtered jumping in those after they topped. DCIX at lows too.
One area Green today with markets selling off ( The safe play going forward?)
CLF, AKS, CLD, MTL, SHLO, STLD, etc etc
You called it earlier, but CLF was HOT of that 20-day. I saw that yesterday then re-tested this morning. That was the add.
The bottom line is that market moves happen on what people DO with their money and not what they SAY. Sentiment is excessively bearish in the metals front yet everywhere you read, traders/investors continue to hold their miners in the hope of that elusive rally. Those who refuse to sell and are leveraged, rest assured, the market will deal with you and when that cleansing takes place, then we will be able to move forward.
Another top contact says the 38 – 40 flipper electorals are democrats so false news.
When I held DUST before it just drove me nuts – too unpredictable up down down up. I can’t do it.
Did not lose but rather hold my miners. They will go up.
Did some buying before the close, still have a lot to put to work if we get more weakness near term. I would love a downdraft in the morning to buy into, then close positive tomorrow. Those type days are the best as indicators of a bottom.
close low on the day
follow through tomorrow morning is OK but it would need to reverse quickly by the afternoon in my opinion
New gold lows after close. Trying to come back now. Let’s see what we have in the morning!
So far overnight low is $1134.80 for gold. DXY/USD high is 102.62, which is it’s highest point in this entire move.
you may want to sleep in…no beuno.
This isn’t just bad this is catastrophic. Silver was in an absolute freefall overnight. :O
gdx will break 19 , but will be no surprise if we reach 16.50 !
looking like a rough open if things stay the way the are right now.