
The Fed Hike Plunge
Many sectors began to sell off with the interest rate hike Wednesday. Some were sectors we expected to sell off, others were expected to snap back. Will we get the snap back on Thursday and Friday? Let’s discuss what we should be looking for.
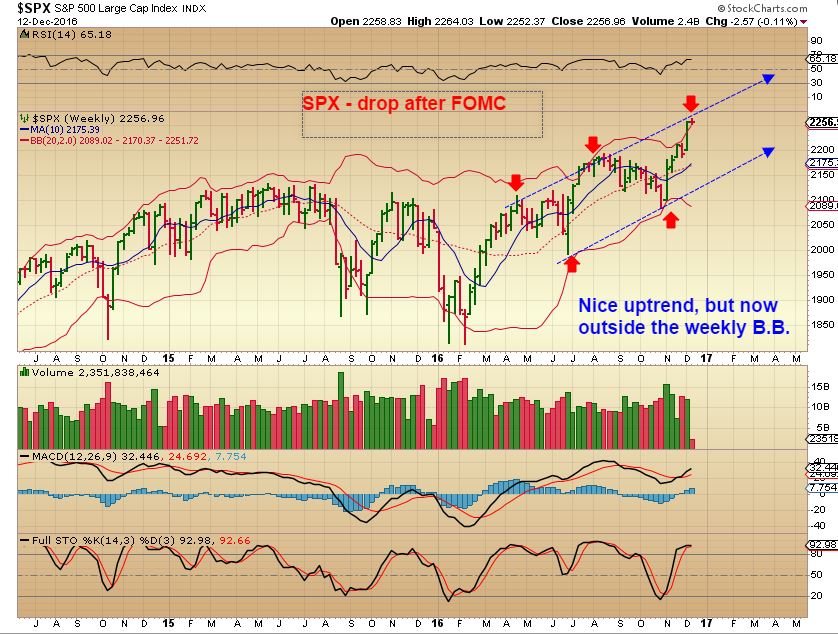
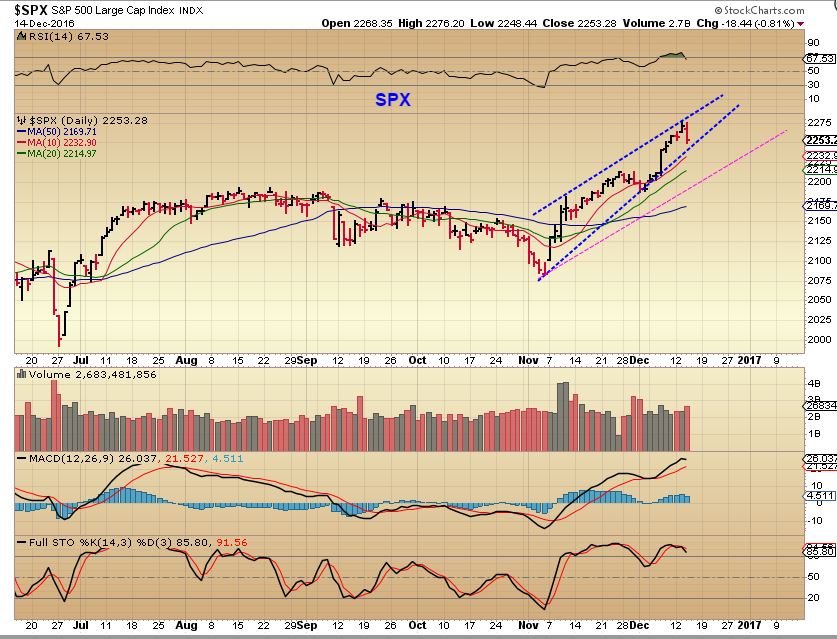
SPX – From Monday, the markets were outside the B.B. on a weekly basis, so I would have expected a dip by the end of the week.
USD popped to new highs on day 4 of a new daily cycle. Since the USD is only on day 4, it can run much higher, but it should be close to the timing that it would begin to look for an ICL. That would lead us to conclude that this could become L.T. We’ll have to wait and see on that one.
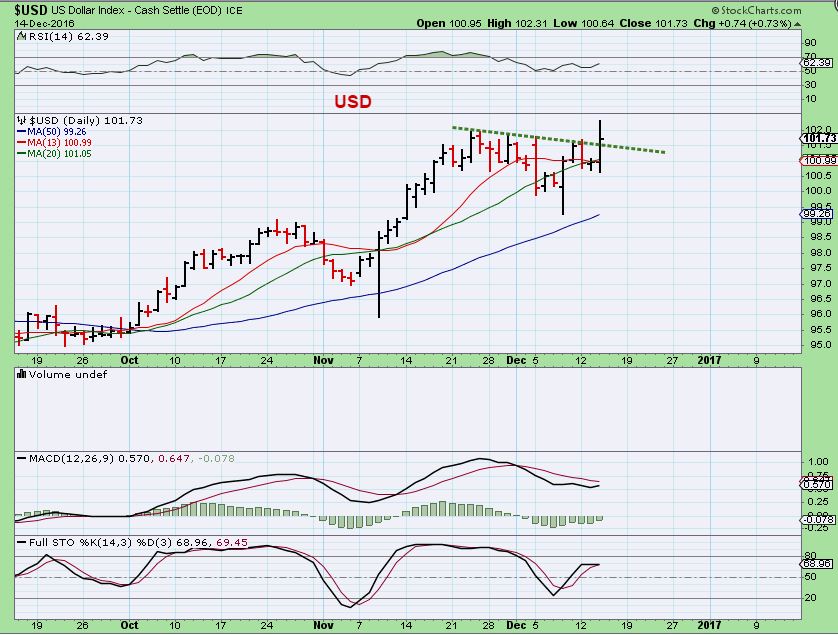
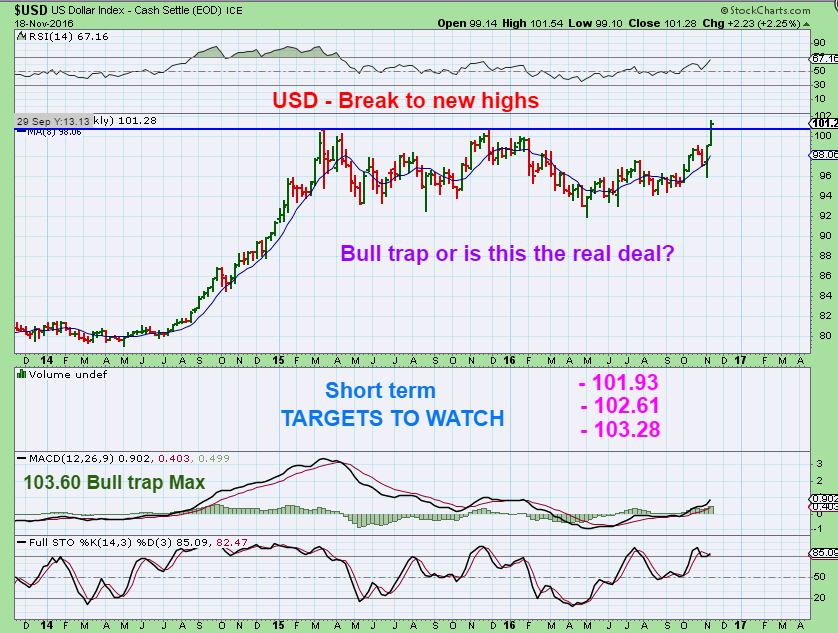
From November 19 – My 3 price targets. EDIT: The USD tagged $103.10 this a.m.
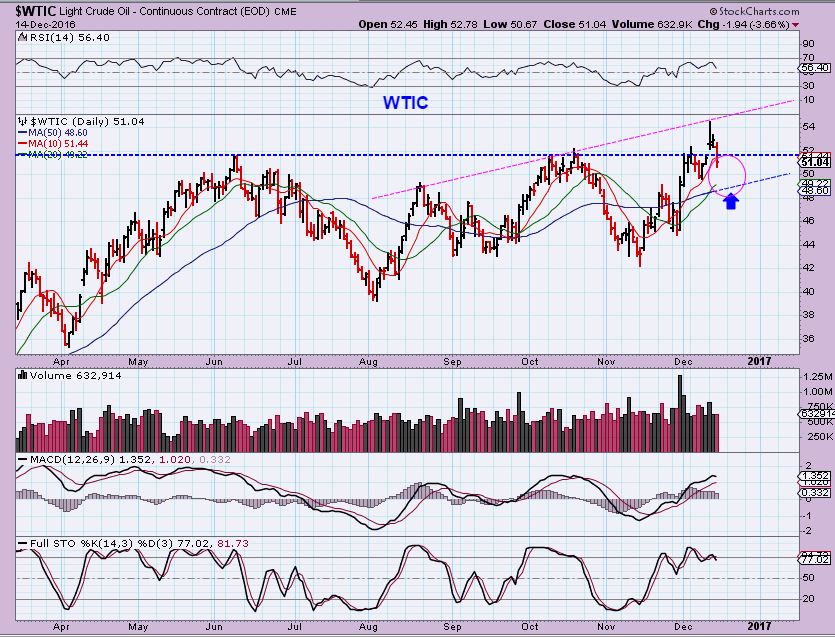
WTIC – Oil has done what technically is called a false break out, but that doesn’t mean that it is bearish.
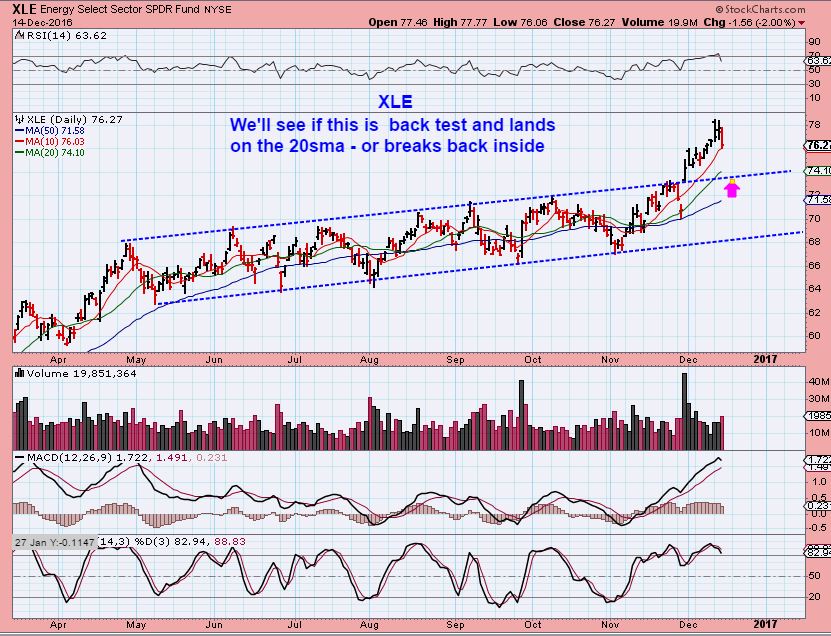
XLE – Energy got over charged, and is due for a pullback. Maybe a back test?
GOLD, SILVER, and MINERS
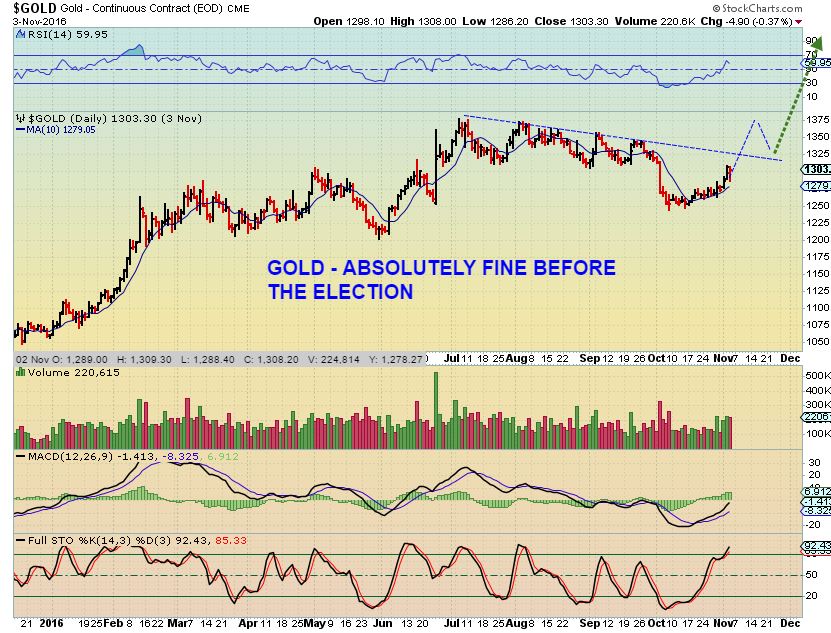
I don’t want to sugar coat it, Gold needs an upside reversal Thursday or Friday in my opinion. Gold looked great going into October and November, it was acting like a normal Bull Market, but ever since the election?
Something seems to have changed. I have been looking for a move above the 10sma to signal a daily cycle low, and Gold has been too weak to even bounce.
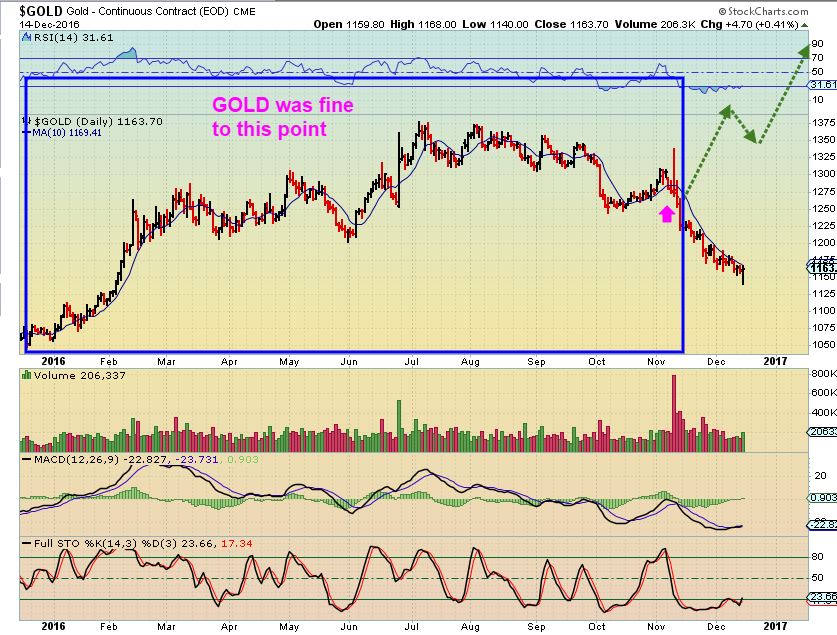
GOLD– Stockcharts drew their chart for Gold & Silver wrong on Wednesday. Ignore that daily candle. Gold never even closed above the 10sma, so it is believed that a dcl has not formed yet. I don’t know how many times I’ll have to say this, but Gold is way overdue for a swing low. Silver still held up well above the November lows so far.
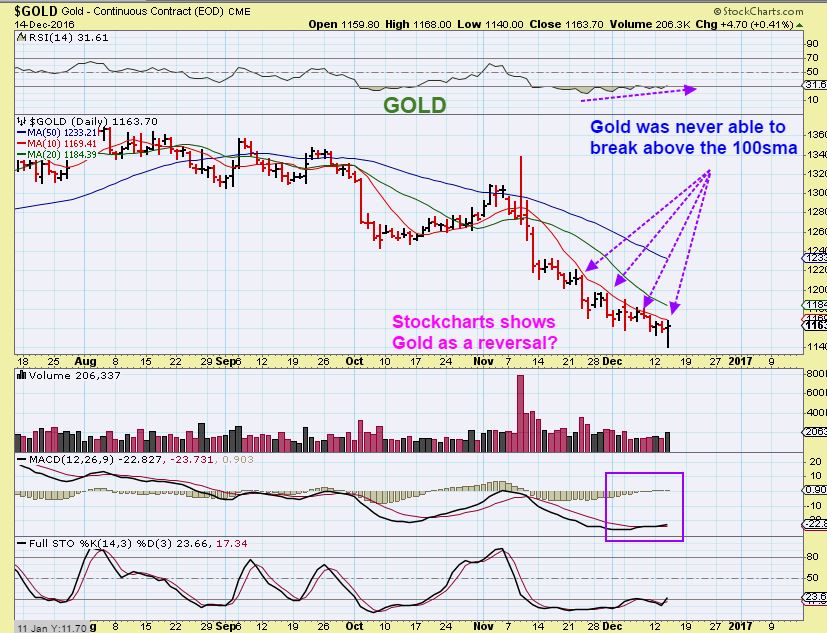
GOLD – There is a continuation pattern that causes a burst , and would lead right to the lows 🙁 I do not attempt to short what was considered a bull market, so I will just continue to look for a reversal on Thursday or Friday, but I will be ready to stop out of whatever positions break below my stops. I can always jump back in if a reversal comes on Friday.

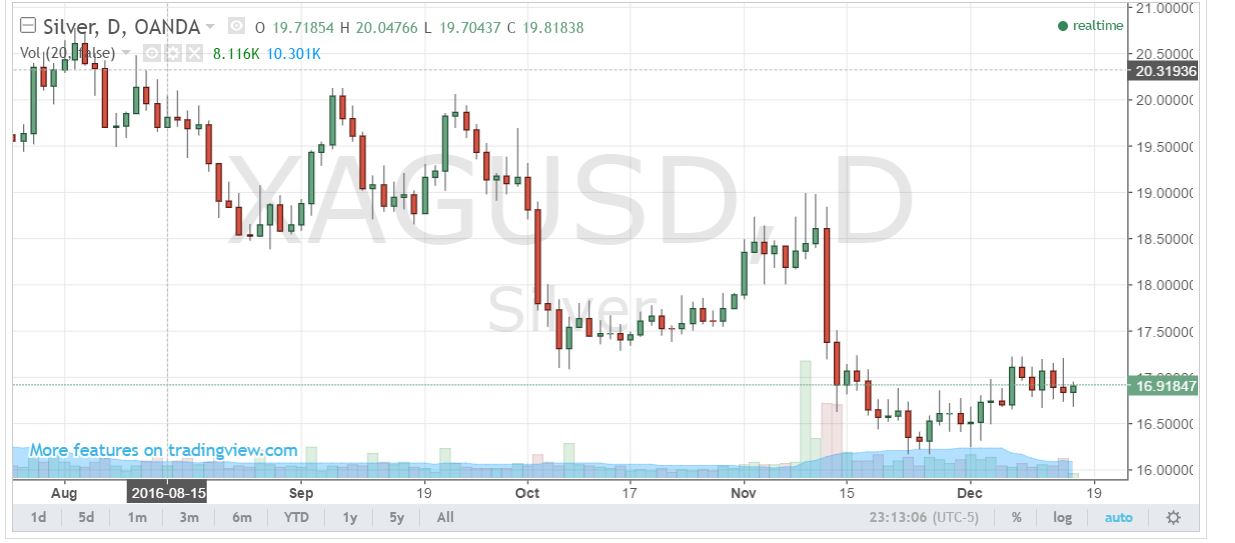
SILVER – Stockcharts Silver chart for Dec 14 was wrong, showing it up for the day, so I drew in the drop. EDIT: It broke the lows overnight with a 3%+ drop.
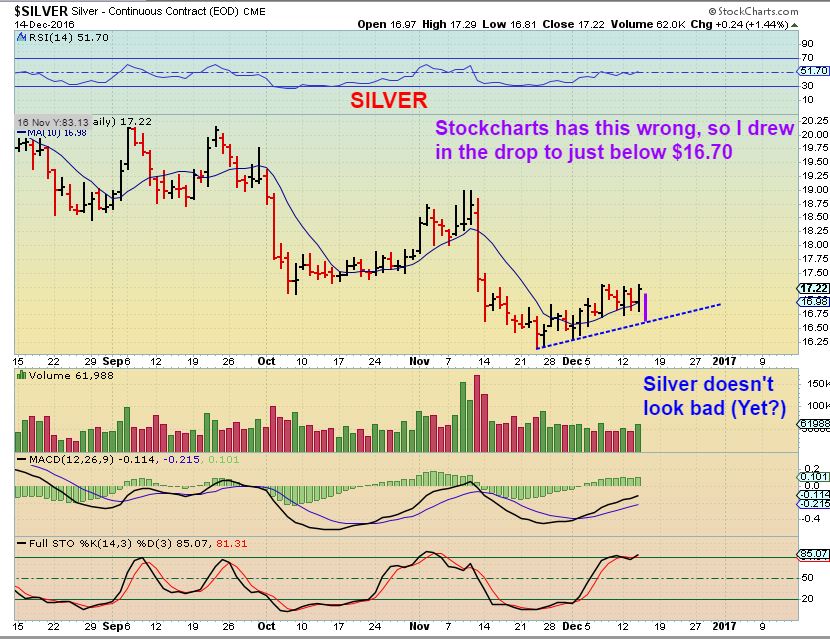
SILVER DAILY – Silver sold off too, but it didn’t break the lows. ( EDIT: Overnight the lows were taken out)
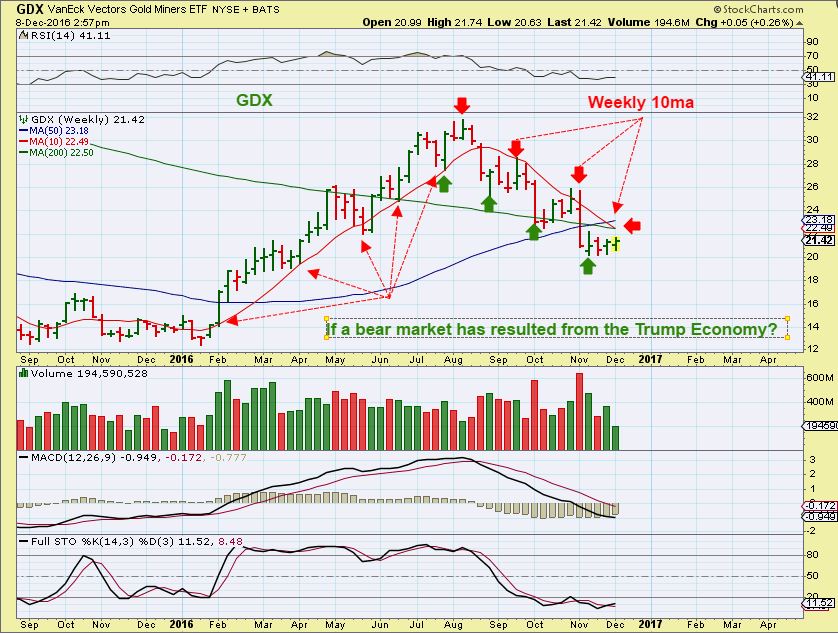
GDX – GDX broke to new lows. We need a reversal Thursday or Friday. The good thing would be that Miners and Gold are now in SYNC, and since Gold didn’t break above the 10sma, it would seem that GOLD is very overdue for a DCL. The bad news, this could be a trend change from Bull Market to Bear market.
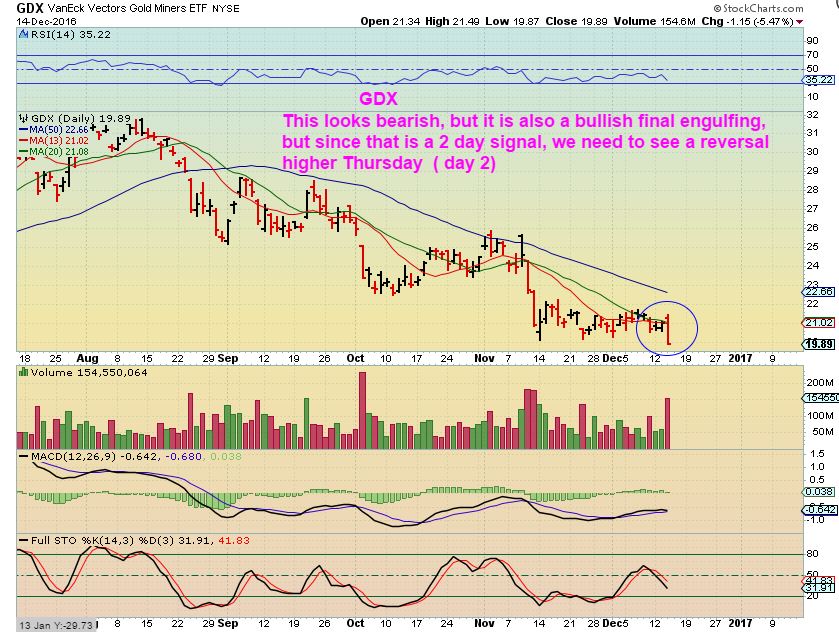
So we have to see what Thursday brings, but in my opinion, we are now at a very critical point in the possible recovery of this sell off. A normal correction can drop as deeply as we have seen here, but time-wise? A correction should not drag out over extended periods of time, and this does concern me. It can go from a normal correction to bear market sell off.
.
WHAT AM I LOOKING FOR THURSDAY & FRIDAY?
.
I had some charts that I had put together for last weekends report, but I didn’t have time to discuss them and still get that report out for Saturday, so I will share them here. I was trying to show that at this point, we need to stop trending lower and break out upside. This is what I was looking for going into this Fed week.
GDX WEELY From Dec 8th – In a bull market, price often rides up the 10 weekly moving average. In a correction it can break down, but you need it to recover soon. With each daily cycle low, we can go long and hope to break out back above the 10ma, if an ICL is in place. Rejection at that point is usually the daily cycle high. Another failure could indicate that we are now simply in a bear market sell off.
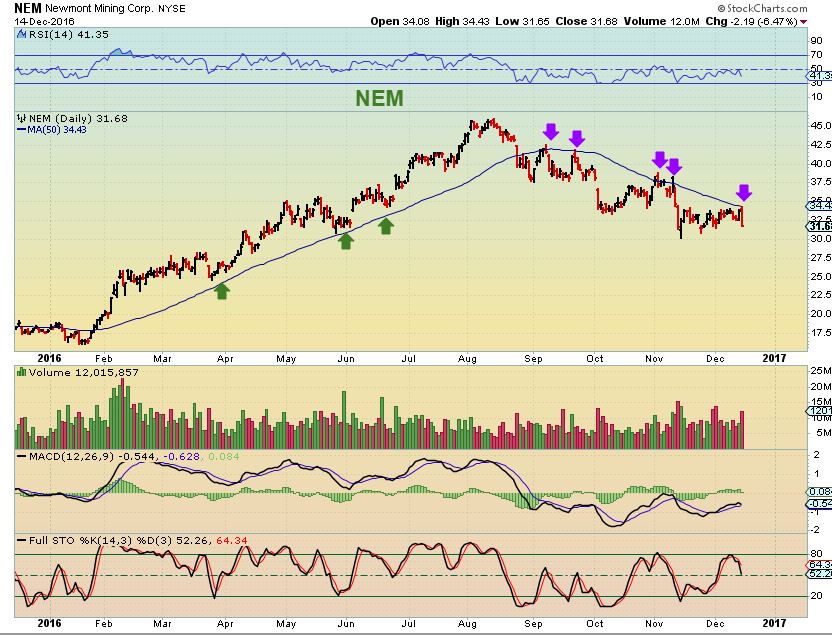
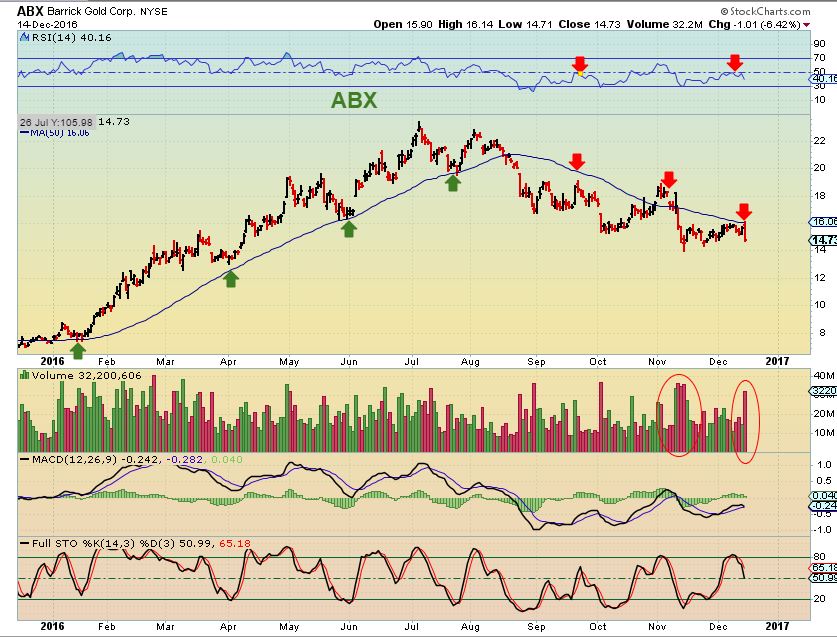
NEM, ABX, and GG are a large component of the GDX, so I have been watching those each day.
NEM – The 50sma on a daily is similar to the 10ma on a weekly. It acts as support for the Bull move and resistance on a sell off. Wednesday was kind of important to me. It is not too late to break above it this week, but Fed Wednesday did not provide a much needed boost.
ABX – Isn’t it amazing how these stocks work there way right to the 50sma on Fed Wednesday? ABX was also rejected.
WHY AM I STILL INVESTED?
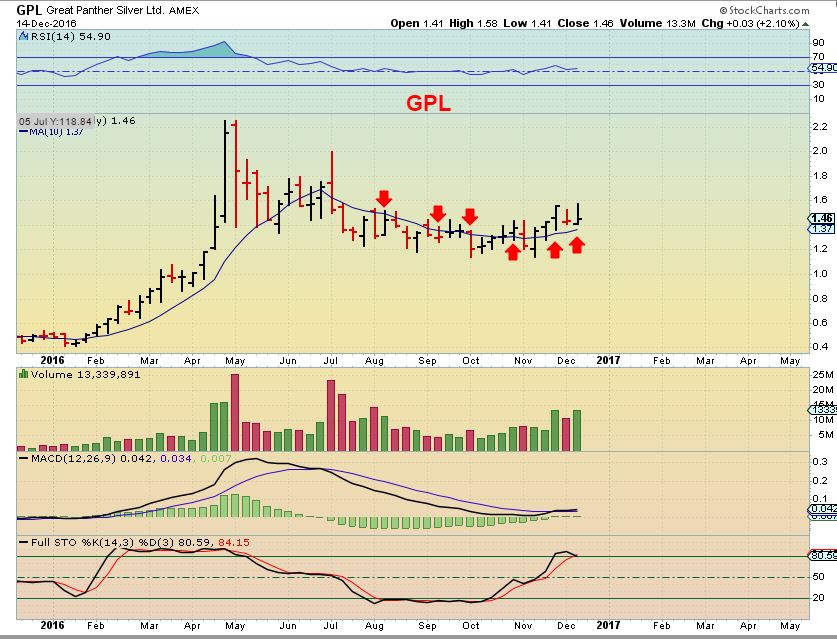
Some miners are acting better than others. Some juniors that I have pointed out in my reports, have been acting correctly. I Bought GPL at the OCT lows, and that is still “The low”, so I have been patiently waiting for a break out or a break down. Silver broke its lows this a.m., so I may end up taking profits today.
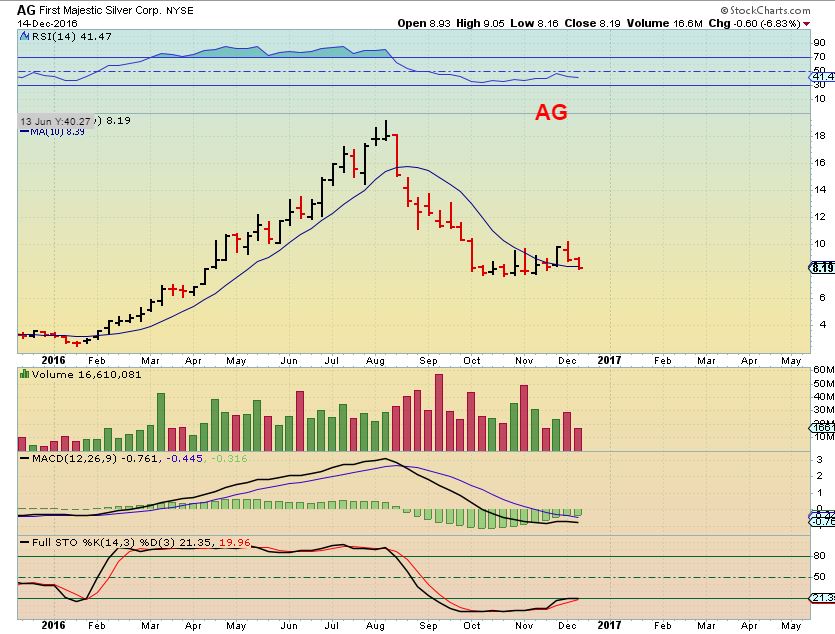
AG was holding up well too, but it needs to reverse direction soon to stay healthy. This is a weekly chart, so Thursday and Friday are important here.
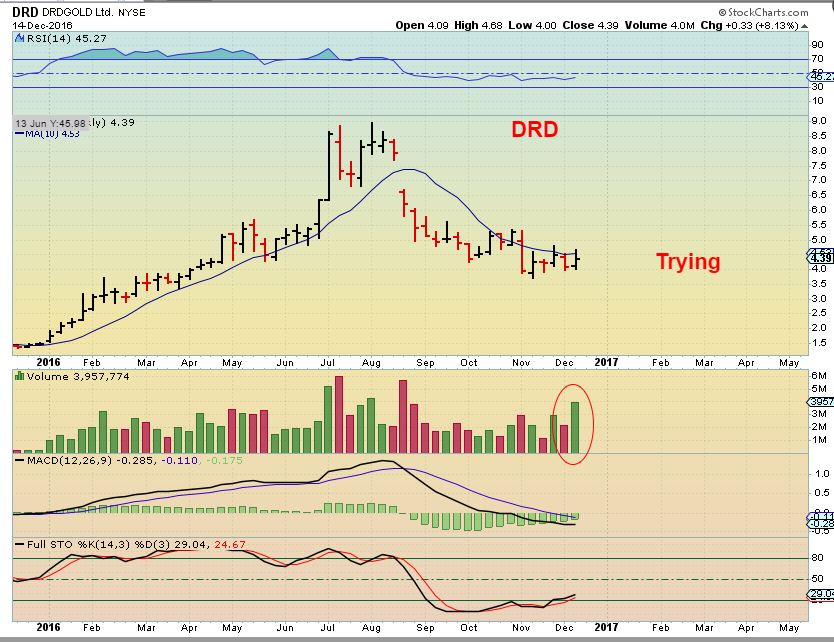
DRD – This was attempting a break out this week, and Monday and Tuesday were strong. Fed Wednesday caused a reaction back under the 10 weekly ma. The week is not over, so I am still watching for a possible reversal higher Thursday and Friday.
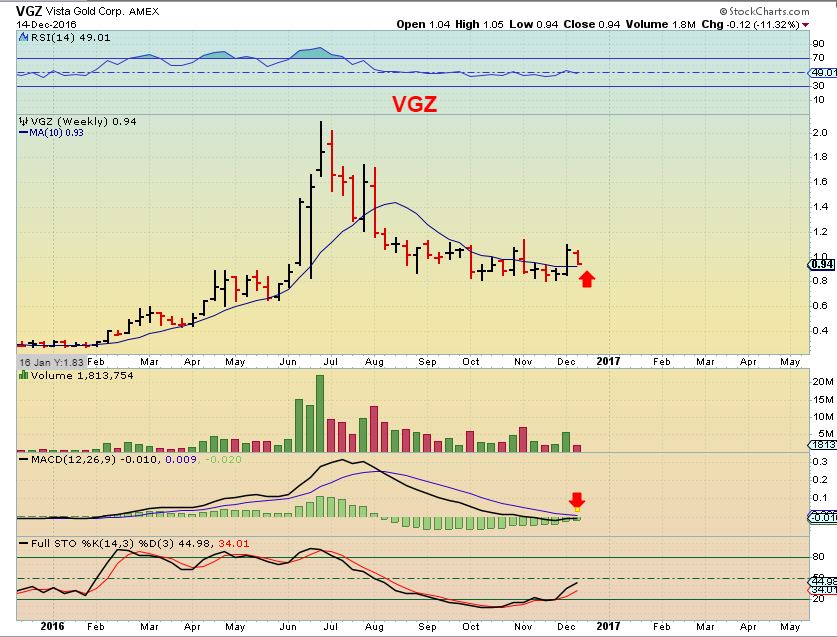
VGZ– So far, VGZ is still doing ok, but Thursday and friday tell the story on a weekly chart.
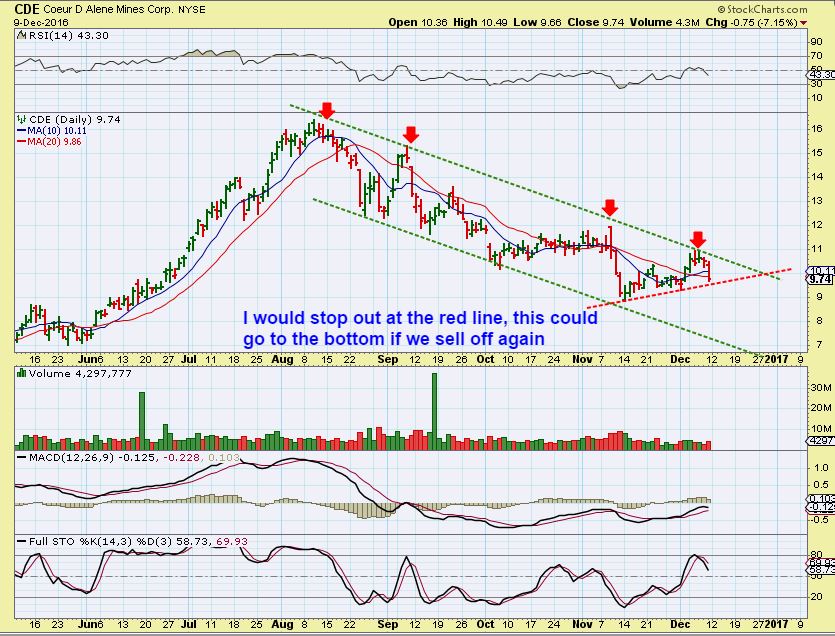
DEC 9th – CDE was nearing the top of the channel. Would the FED MTG push it to a break out or stall it? CDE is actually 10 cents higher than it was on Dec 9th, but the next 2 days are pretty important in my opinion. This could drop to the bottom of this channel if selling continues.
We need a reversal Thursday or Friday to give the weekly charts a bullish look. The first 2 Gold charts in this section telll the whole story so far.
Thankfully we were not holding leverage in that sell off for NUGT & JNUG. It exaggerates the move and the emotional toll. The above report pretty much lays out what I am looking for going forward. Without a reversal, it would appear that these down channels are now part of a trend change. The normal correction of 50% to 61.8% pull back has been broken. It doesn’t make sense to me, with Yellen talking about increased threats of inflation and Metals prices rising quickly, but so far Gold struggles to even bounce at this point. Yesterday the Markets were selling off, Oil sold off, and precious metals sold off, but CLF, AKS, CLD, MTL, SHLO, STLD, and a few others closed green. The next place to invest in may be in the pull backs of these companies, apparently ones that would benefit from an infrastructure rebuild. Time will tell.


This is really incredibly dissapointing. So much better stuff to trade than these metals that have never left me anything but dissapointed. Hopefully a few of my stops don’t get hit. Hope everyone hangs in ok in what looks like a bad day. I just don’t see a hope till yen reverses.
$$ highest since 2003, $/Euro almost to parity, can’t believe that gravity won’t grab that one, even if it’s just a quick touch. Clearly don’t need to remind you about the Yen chart.
Long DUST yesterday at 49.50…so far so good.
Wow, you pretty much caught the lows, pretty brave trade for a Fed Wednesday.
Nice job.
We thought the clear and convincing evidence was that the bull was back. Technical and fundamentals were very much on our side. Very unusual for an index to triple off the lows and not be in a bull. Sentiment is still astoundingly bullish. We may have to find ourselves in a reverse situation where now the clear and convincing evidence is that we are in a bear market and that the fundamentals also point to that before sentiment does a U turn and cools off considerably. Just like the polls which were dead wrong on Trump, I’m not so sure we can trust the so called official sentiment numbers. Rather I trust the gold web sites and the posts therein which are now only starting to question this bull. And some are buying DUST which may be a very good bet at this point. This decline is unfolding very quickly which has the feel of a termination move. I’ll note the DOW in 1932 lost almost 90% (like the PM market now) of its valve and then on a dime catapulted from that low only to move back down significantly threatening to double bottom. It didn’t but instead turned on a dime again and didn’t look back. I just wonder whether something similar is unfolding here.
That pretty much sums it up.
I hope lots of folks were listening when I talked about having a hedge into the Fed. This is a crazy move. Even in this new bear, we should get a bounce so I’m moving to a pretty tight trailing stop (3%) so any upside reversal takes that trade off. Best case we eventually climb past the 10 day so I can put that money to work in JNUG!
Fundamentally, even 3 rate hikes puts US at 1.25-1.5% on the overnight Fed Funds rate next year. Sure, that does scream the 10-year higher but TEN YEARS is a long time! I don’t hold stuff for more than a couple months. 😛 Anyway, if inflation runs 2%, on the overnight that’s a -.5% real return. That’s just math…
Maybe they’ll do it this time, but remember last year? The Fed said that they’d hike 4 times in 2016.
They hikes once. Thats just “seeing is believing” 🙂
the premarket is below my stops. I have one Canadian position and I can’t trade it in the pre-market. Any suggestions? should I just go to a market order stop?
Alex, where would you put a stop on NAK if this sell off continues?
NAK is a bull chart, I personally wouldn’t want to see it break the 20sma , but if you bought yesterday, your stop should be higher. It may be considered to have more reserves than just Gold & Silver, so it could continue to act bullishly like AKS, X, ETC.
That said, I find it very difficult to answer that when people ask, because they
should know where their It depends on where you got
in, and other factors.
If you bought at 30 cents or 80 cents, you can decide what you are willing to give up as it drops down toward your purchase price. So it is a tough question for me to just throw out a stop price, when I don’t really know all of the factors that I go by when I set my stop. I hope that helps, but it is a tough question.
Moral of the story for myself is that technicals need to supersede cycle analysis. The down trend on the daily chart has been alive and well since August and my policy is normally not to trade downtrends. Lesson learned…..again. Ugh..
Amen, I have learned that lesson in the past. I have seen cycles stretch tooo many times, and with Gold….seriously, we havent even seen a break above the 10sma on day 45?
I always do better when I use T/A , but cycles at normal times do help with timing a lot.
This is not a normal move.
does that have anything to do w/ the fact that this was a ‘historical’ election ….?
ITS PUTIN !!!! 😉
Simon, I’ve been thinking the same thing……lesson learned for me to….going to start paying more attention to technicals, larger chart patterns…..hindsight….. 🙂
In this 10-year weekly chart of gold futures, it appears that the middle blue trend line may be as important as the top one, from which gold was repelled this year
(if you’re curious, yes the upper green trend lines are parallel to the lower green trend lines – strange)
https://uploads.disquscdn.com/images/f460f7deccd70c89b0feaf387c2927b4349c707b8176ff81f3e8d97399e99eef.png
Excellent chart Cal……I could see that.
Nice analysis, lets see if it holds
Yes, I agree, but the hard part that I have found is where exactly to draw that middle line.
I have drawn several chart in past reports with similar wide shots ( I’ll attach a close up here from my Nov 11 report ) and that middle line can be drawn in ways that give the Gold price a plus or minus $50 swing.
The middle line cuts the wicks off of the tops and bottoms of those mid points. It’s a tough call.
.
https://uploads.disquscdn.com/images/636bcbdecaa11a01a2c78de108f000d673e5dc9571df3fa9ac84b2705f1cd5e5.jpg
Strange?!? GPL down by 2% at open with Silver down a whopping 6%??? I’m not betting on anything here and my stops are in but there’s definitely shenanigans at play. ;-)–maybe even manipulators! (whoever those are)
I think GPL is being supported by the owners. They just closed one of their two mines and the story is for much lower revenue this year. It just doesn’t make sense that the stock stayed this high with the volume. They have a big war chest so I think someone, somewhere is mopping up. The bad news was warned in the last 10Q and it came to fruition a week or two ago, so of all these risky plays this one is the worst.
From another site- people are now getting angry and down right nasty. Unfortunately, what we need to see. But, not here please.
Maybe a bottom? My acct is not as bad as it was after the first 5 minutes. I have only TRX in the green, not surprising. I am starting to get a few pre-buys (my hourly indicators are turning up, but no crossovers to buy). JNUG still -10%, a nasty number. Hanging in, hoping this is the final flush. The first hour is often the worst.
One of the things I love about Chart Freak….everyone here is not only respectful of each other but also quite encouraging…:)
Yes but depressed
Human nature is such that people will look for someone to lay blame on so it doesn’t surprise me. Alexs’ analysis has been thorough, concise, clear and most importantly, he has taken a stand (albeit hasn’t worked out well ) which is a lot more than I can say with other advisors.
still think the end of year, tax loss selling will kick in for metal stocks-people may have been waiting for bounce, now price action may force their hands in a race to beat the rush. need to see some divergences between stocks vs metal
You need to have losses for tax- loss selling like last year; miners are mostly positive for the year
I’m thinking more people with gains in non-metal stocks will sell and use losses in any metal stocks to offset those gains. only those that bot in jan/feb have gains at this point in time generally speaking(viewing indexes gdx etc) – and present company from this great site excluded of course …
Stopped out of my AG position from October.
What IF? What IF this is the start of an “Island Reversal” pattern in GDX! I could see it happening. Everyone is at wits end, ready to pack it in! Cycle exhausted! Even in BEAR markets there are advances. Of course if GDX continues lower, then that idea is out the window………
Bill, I just looked at a 60 min of GDX. If it can hold on for another couple of hours, you may have nailed it. I have never noticed something like this in real time. Of course, I would have to stay around to watch the opening tomorrow and make a bundle. 🙂
I still think this is a possibility . F5
https://uploads.disquscdn.com/images/693498aa57af4b067744c7e1610c23f051eec2c5aee26ef1b37b2838d0a3b312.jpg
My acct has been trapped negative in a nasty trading range. It has just left the higher amt and is heading down to the lower amt which I hope is not broken. In the spirit of Bill’s island reversal idea above, I went through all of the stocks labeled gold/silver on TC2000. Not surprisingly, I found 26 out of their 37 golds had hourly islands (ECO had closed its gap) and all 10 of the silvers are forming islands. (Note: NAK is not labeled as gold, but closed its gap today anyway.) If we are fortunate, maybe ours will last today only. See Stockchart graph below. https://uploads.disquscdn.com/images/4f62f18efd945d1e11275a9578a27b2645fe2b65d713ab2a857764ca72cde100.png
Its looking good post market as miners are up. WE may get the island reversal if it gaps up at the open. I am not sure what the % of success it on that. Maybe ALEX can chime in on that. Perfect scare tactic.
Terrible day. judging from my emotions the low is close. This feels worse than the bottom in 2015. Dollar tagging the 103 level again. Yen is relentless. Yet when I look at almost all charts they all scream to hang on as the extremes are so dramatic. Bonds up today so maybe that’s a good sign.
Gaps I’ve been staring at for weeks which have yet to be filled: HUI about 135 GDXJ around 28.
I am under water, but own SINO +18% – keeping my hopes up. Hoping for a DRYS to the upside, maybe 100%. 🙂
A ray of gold hope: Check out the 10 min charts of ABX, AEM, and NEM. I have no hourly buys, only these rays.
A couple more gold rays on 10 min charts: GDX, GDXJ, DRD (own), PAAS (own), VALE (!), MUX (own) is now green. However, no hourly buys anywhere.
My gold/silver rays above are pulling back as is my acct. Hope they are simply testing their lows. Breaking them would not be nice. OOPS, GDX just broke its low. Sad!!!!!
Updated chart from a few weeks ago… b/o in DUST daily indicator going back 18months.
needs a massive daly reversal to drop it back inside the downtrend.
otherwise it could be exit all positions for me.
ive already been stopped out of half my stuff
https://uploads.disquscdn.com/images/f15603c0ca50fb70d929d923711b966acd4c826cfeb647eda76e2a9c9f493f6b.jpg
Wouldnt you look at this and say that it would hot that upper trendline and top in maybe a day?
could do.. i like your optimism.
it would now be a countertrend miners rally i s’pose now, if the inverse bear is in an uptrend?
Yes, it would be sell the rally, unless it breaks the upper trend line…or just sell the rally and get back in after the upper trend line breaks and holds.
we should be watching the yen chart wrt metals stocks – yen carry trade has been carrying stocks higher -today, yen crashing but equities getting no traction – if yen reverses I think equities will break and gold stocks rally as the carry trade gets unwound – and it’s been winding up since June so a bit of unwinding to do once/if it starts
or like this maybe….. https://www.tradingview.com/x/E9XTKZKP/
that looks remarkably similar to my nightmare scenario Triple-Wigwam-Teepee™ chart i had back in October.
At first, they laughed… 🙂
https://uploads.disquscdn.com/images/a7364a3d44c745927bfe3d36f1b19560ae2720fe10d78522538d07cd68f0e510.jpg
Hey, you should post an updated one right under that one
looks like X dropped some distance from where i had it.. and the B of Y extended well beyond mid-November
btw … F5 !
ok.. here it is.
i kept the original TLs just to see where they ended up
https://uploads.disquscdn.com/images/5d59a59456145836c43b5d7d6a708a742931cf2f1ead66e9c28c6d138a7669e0.jpg
Some energy stocks do look rather interesting after the last couple of days pull backs
“Crude Oil has done a false BO, but that does not mean it is bearish”…….I agree Alex.
The Aug. low was the last ICL (wave 2) the next ICL is due around Feb. 2017 I strongly believe that ICL will NOT break the Aug. low…..Higher ICL Lows.
I just ran through some miners – Silver miners getting hit today with Silver breaking the lows
16.97 is the .764 fib retracement for gdx
open gap at 17.16 in that neighborhood
after that is .99 retrace allowed by ewave is 12.6
Thanks for the .764 fib # above.
And as for the drop to test lows, I have precedence for this too : (
Also this chart ( refresh) from the report is not just a made up guess, and could represent a .99 . It is an actual pattern that can play out. Really rots to think that this is how the new bull run last January into summer pullsback this way.
.
https://uploads.disquscdn.com/images/a9b6baf5fe41e3438a8df703b548a93ef2535e886ffe8d5aa43eea0042efc77c.jpg
and it would still be a bull mkt.
The election killed the BULL
*in ur humble opinion
meow
Mea Culpa! #HB
It , at the very least, shot one of its good legs out from under it
if it’s a bear .50 retrace on dust from 8/15 is a little over 1000
DUST chart looks to be breaking out.IMHO
looks like it’s at the top of the channel.
HL still looks good here; stop under 494
SHIPPERS
DCIX, NM, TOPS, SINO, SB, GLBS, DRYS, EGLE , etc all trading like 10X Etfs again
wow……
Some miners look to be setting up too.
LGCY : )
I sold LGCy in one acct…held in another….ALMOST sold in that account at the open this morning but decided to hang on….it’s still barely green in my acct but I’ll take it…:)
I hope so. My acct is relentlessly down. I don’t see any rays. You mention minors, but LGCY is an oil. Where are the miners that are setting up. I don’t see any.
No, I meant energy, sorry bout that… like NADL, LGCY, AREX, and a few that were pulling back look to be steadying off
Even my TNK is up, still red in my account but almost green.
Don’t know what it is about WTI….I wanted to get it the past few days but held off….now it’s up nicely today…
Form 4 filings of late show CEO tracy krohn bought a little over 2M shares in the last week or so
Ah, thanks for that information!
no problem, WTI is an offshore E&P player which are definitely out of favor due to oil price, there are some that present very good opportunities right now.
Silver hit a 16$ target that one of my guys had. Maybe that will stop the decline. Pretty ugly and quite surprising.
As long as it’s not following Golds lead.
That area is the May ICL area, and close to the 61.8% fib number….and gold took both out
I’m going to back away from this style of trading for a bit. Try and shake my head and get my feet back on the ground.
Bye all, happy trading
Good luck! I know how you feel :((
I will miss. Thanks for your great comments.
Good luck to you. I hate to see good posters go
I’ll miss your comments too.
RB Why ? Stay with us….paper trade maybe for a bit ?
What is the “style” thats not working?
I took it as he is looking for a trend, but we still have AKS, X, FCX, etc & Energy that could be trending, ‘buy the dips’ candidates going forward. Maybe just needs a mental break.
Alex – many of the biotech stocks look ready for a bounce.. perhaps a little coverage on these would help to ease the pain from the PM stocks? JUNO, HALO, LJPC, BMRN, CELG all look good here.. any chance you could cast your eyes over this sector for the next report? thanks!
They don’t look bad. XBI & IBB both under the 50sma, but if they move higher it could get interesting. Thx.
BAA at long term support https://uploads.disquscdn.com/images/a55a66dfcfe10fc76454382dd3b98028b4caa92f01f688a214d6d0de90bd6316.png
i doubt anyone but me is buying ;p
I may add to NAK….. 🙂
Ken, you warm my heart. If you have hope, that helps. NAK and TRX are both flat – two good rays of hope.
I actually have TRX that I jumped in to either yesterday or the day before…the only gold I have now – been holding it today to see what happens….
Well …. It is the Christmas Season…… 🙂
I am holding BAA from Aug last and every now and then I have a look at it on a 5 year chart just to admire the long base and get a bit of comfort from what might transpire!
I have BAA from July….And I also look at long term charts to keep a different perspective in the mix. I just go down the list and look at them all.
GDX Count:
Extended Cycle count with six DCL’s possible ? https://uploads.disquscdn.com/images/9fdb3fe00422ee4c9e4edc5f47ce8c105d2e8dc61813de34597299548c566557.png
nice work kenny
Thanks Maria….not sure if CF agrees though…..I will keep trying 🙂
Cycles are acting a little out of whack here. Hard to read using what we usually do for confirmation.
We never got a confirmed daily cycle with a trend line break on GDX ( we only had the close over the 10sma), so theoretically, this could be a continuation of that daily cycle, the same as Gold ( Which never even got above the 10sma).
As for the E.W. count – easier for me to see in hindsight.
You could say the same thing in reference to Cycle theory.
Much less often, usually extremely clear and predictable in a bull run, but this time, yes
Jury is still conviening on that one. 🙂
reviewing what I said, I just have to doubt that this is a continuation and not a 6th daily cycle. No overhead trend line break, but man…it looks pretty clear. 🙂
That is the rub isn’t it. 😉
In a bear market, the final daily cycles cannot bounce as well as the first 2. The first 2 are very trad-eable and you even make good gains if you sell on time.
This Nov one hardly bounced enough at all to get over the 10sma.
Why not then trade ONLY the First and Second DCL’s (Wave1 and Wave 3 EW) out of an ICL in Either a bull or bear underlining ?
In a bull, you buy the 3rd & monitor it going forward, because it can be an ICL or a good trade.
It’s like E.W. I hear people entering for a 5th wave, when it could just be a truncated push, but that is trading my friend.
Yes agree I am definitely more cautious with wave 5’s.
Right – like not going in heavy and no leverage. That is how I’d play a 3rd daily cycle
( Well, maybe : ) …that JNUG is tempting if cycles are acting correctly. Not so enticing in sideways moves).
Gotcha….
So are you then saying Gold DCL’s now has morphed into a 40-50+ day cycle ?
Seems like these cycles continue to change and extend again and again….. ?
Nope, not saying that.
Where would you place the DCL’s in the above GDX chart then?
I understand that you prefer Gold as the underlying chart of choice but…..
The comment saying ” Reviewing what I said…” was actually saying that I agree with that count.
It’s just that the selling was so intense for Gold, that I dont think GDX got the bounce that it needed to do an overhead break . So at the end of that comment, I was saying that it does look clear as written.
When I said I doubt it is a continuation…I meant that I was doubting my own first thought/ reply that it was a continuation into day 45+ like Gold.
Understand, no worries.
My ask remains though…… 😉
hi Alex,
for your info
in case there’s a big difference in a gold or silver future after 2 pm NY time, they take the quote of 1.30 pm NY time
so that’s why these qoutes are not always right
Hope that makes sense what I’m writing here
If you are talking about the stockcharts charts, that is not what the problem was.
They showed silver up yesterday the 14th and gold as a reversal off of the lows that it did print post fed..
That didnt happen at any time during yesterdays trading, I believe it was a misprint.
On other days, it has been correct in the past as the 4 p.m. close.
GLL is an ETF that is 2x the inverse of the daily performance of gold. May be it helps to finde a bottom in gold. Sometimes I use
it as a hedge. But not this time, I am in cash and have no positions yet. MT and LT I am bullish on gold. But I am patient and will not buy in a falling knive.
And what exactly is your point?
You can see the gold chart inverse. It may help to get a better or other view what happens. The question: Do you believe this chart can go more upside?
It is only midday, but I do like the reversal candle on GLD, and GLL at the top.
If they could hold here or improve, the selling could be exhausted. Too early to call at this point.
short term traders take their profits, but for a hope to the upside we need a 2dc above 1180 imo
Yes, for short term traders, they will often take a trade if (after a bit of a drop) a candle reverses to the upside – taking back more than 1/2 of that reversal candles day back. The stop goes under the low of that day. Profits can be taken 1 or 2 days later.
A move like you said would likely be the start of a good relief rally.
Hi all, soooo bad it must be the bottom . . . . I have to hold and wait until miners
go back up. Ce la vie.
It may amount to nothing, but I am seeing some rays of light on golds. I have lots of hourly pre-buys and an hourly buy on NAK. CLF and VALE are green. Also, DUST and JDST just gave their first 10 min. sell of the day. My acct is off its lows. This may be a failed short term rally, but it is the best I can do.
I am seeing many flat bases on my 10 min charts. I don’t have a clue if they will go up or go down. NAK is in an uptrend. Is NAK a leading indicator? My acct is not improving.
I am getting lots of hourly pre-buys. That means they are heading up to cross over my zero line. My acct is improving too. Once, again, this may be short lived, but the best I can do. Just got an hourly buy on DRD.
I was just watching that reversal in DRD too.
My DRD, NAK, and AEM have nice 30 min charts. MUX may have survived a doji test on its 30 min chart.
My pre-buys are weakening a bit. I hope that is not all we get. Going to eat lunch.
Thanks for the uplifting comment!
I’m not sure what NAK has underground, but I sure hope they don’t find gold or silver and tank this stock : )
What a pessimist. 🙂
Check out this pattern ( refresh)
.
They just keep buying each sell off back
https://uploads.disquscdn.com/images/446ccfbc4cc0e0e1792053721923c3b126d5a2a4dd420a060a0ffe30d84a978d.jpg
It hasn’t traded like the miners for weeks. I should just be adding to this instead hanging on to my flailing miners.
I added. 🙂
Strong Miner….Very nice chart, gotta hand this one to you Alex !
My stink bid hit early in morning tradin’. Back in
As soon as they find it’s gold they go bankrupt. Maybe they can just find trash so it actually has some value!
SGY defying bankruptcy news
this pre-pak bankruptcy was planned, currently existing equity to get 4% of the new company plus warrants for up to 10% of the PP equity…there is strong speculation that this will be improved as the BK process unfolds due to the rebound in oil/gas prices
http://ir.stoneenergy.com/phoenix.zhtml?c=95471&p=irol-newsArticle&ID=2229885
Gold starting to get a bid.
Refresh and repeat after me, ” KEEP GOING INTO THE CLOSE PLEASE”
.
https://uploads.disquscdn.com/images/b2bcd47ab159019f0bbced653468a1c35086582f4e3324e19a38527a64b87bc9.jpg
Manufacturing inventory report is up. We should start getting more inflation news.
So hard to sit through these lows this especially when we all know it’s manipulation.
The bright side is weak hands get shaken off the bull so the market is stronger . . . .
Thanks Carinetscouts for the good news. It has to turn up eventually!
Foreign countries will export well with lower currency but can’t pay their debt
in higher USdollars. This will bring the global depression must faster the longer the
US dollar is up. Some YEN US$ charts would be good. Good to straddle
yourself in holdings overseas so not just subject to US$ valuations. Thanks everyone!
I dont want to give any kind of false hope of a possible reversal into the close, but this is the 30 minute chart of Gold as of 2:30 P.M. Eastern time. It does look rather promising on several time frames.
The bigger drop is yesterday – todays drop gave us divergence at the lows on the macd
.
https://uploads.disquscdn.com/images/4a1f02f76e5c39304c567d4f5bca83fbd31c435f9d81681f47d5303947d41c7b.jpg
I’ll take the hope and raise you….I do like the TLT bid today. (I know, I know. No correlation. Lately there has been for sure.) Yen popped and pulled back. Maybe, just maybe – exhaustion is setting in. I also just looked at a 3 year chart of the USDJPY daily. Draw a line off multiple peaks from mid 2015. We are at that line today. Resistance? Major league overbought here. any thoughts are appreciated.
Yes, lately there has been – Yen needs some buying
Great! When I start feeling rattled = bottomed! Great chart and Markm thanks re the JPY daily info!
CF, I see an inverse head & shoulder forming on the 5 min JNUG chart. How’s that for a ray of hope?
I’ll take ANYTHING right now, but thats a good one! Thanks, I’ll go take a look.
WHEN DID JNUG GET TO $4.60!!! WOW. ( I do see one too, and the MACD is rising steadily.. It is better to see it on GDXJ or GDX though. I went to check it out & it is there too .
Stop the presses! I’ve finally morphed into a pseudo CF lol! Tell me what you think after you take a look:)
I know….I have told myself if it ever got to $4 something I would jump in…but…..I…haven’t…..yet…..
I jumped in at the close. Oh my!!!
I started to!!! I was so close….ready to hit the send button on the buy….then it turned 3:00 on me while I hesitated….so I said well, ok, guess not today…..thought about buying in after hours but had to leave the computer a bit so didn’t get to….
We’ll just see where we are tomorrow AM then you can decide!
Yeah…I sure would like to ride JNUG from $4 something up to $20! Ha! As if I could
hold it that long….! I have decided to never be an old turkey holder again. Ever. Well, maybe.
Take the money and run…..go on, take the money and run…..my theme song now etched into my head….:)
Jordan RB’s buys in JNUG yesterday might not seem too hot to him right now
If he got stopped out , it definitely won’t.
lol… i always thought of him, like many of the ‘newsletter’ writers, as an accumulator… buying shares around the lows and holding thru any further slides.
Very few of those around. It used to be like that but today everyone seeks instant gratification
Correct.
I tried this “core” thing myself. Ask me how it’s working?
If he bought it for a day-trade then yes, but if his intent was/is something else then it is too early to judge
yup.. thats why i was saying ‘right now’..
if he does hold.. then he’ll be happy enough on reversal
uh oh
I didn’t buy
hey.. are you Jordan?
No just read his stuff
A lot of the smaller miners very hurt
No recommendation here, because these can change fast, but oddly enough, TRX looks like it wants to bottom here on a 3 month daily chart.
.
I went to put the ticker TRX in, and accidentally put TR.
What a nice 1 year chart Tootsie roll ( TR) has with a cup and handle / break out / back test completed.
Tootsie rolls are worth more than Miners, now thats bad.
My Favorite candy pleasure !!!
hahaha! I’ve held onto my TRX today…the only miner I have….waiting to see what happens…it’s in the red but figured, why not hold and see if things bottom here?
Nice reversal on WLL & OAS around the 20sma. A few others too.
I I was thinking TR was symbol for ‘Trumped”
Now drys is up almost 50%. DCIX – 80% GNK took off too. And many more.
These shippers are whacked!!
Agree…..Honestly what drives these shippers?
at 1st glance most are very small market caps, much easier to manipulate. most are HQd overseas too. plus they had cooled since their post trump run, daytraders rotating their areas of concentration? pure speculation there
Thanks little
gulp….
I devised a way to play these crazies. I happen to have a few SINO. I currently am following it with a 50 hma. If it goes crazy, I will put stops in whenever it goes up a multiple of my current price of $4. Namely, if it passes $8 tomorrow, I will stop it somewhere under 8 for a double. If it goes to $12, I stop it under 12, etc. If I get a ten bagger, I will stop it under $40, maybe $39. I can dream can’t I. 🙂 Sadly, even a ten bagger will not cover my gold losses.
Unless we can get a 10-bagger on JNUG. That would make it up!
I have found that during a BULL market, whenever the XAU Index closes below its 50 day MA by more than 10% simultaneously with a close below its 200 day MA by > 10%, a “low” of significance is close at hand (I know, I know, you’ve heard this tune before!). During the last secular advance from 2000-2008, the following dates were recorded where such a phenomenon materialized:
7/26/2002, this was also the LOW week and the low was recorded on a Thursday.
10/10/2002, also LOW week and low on Thursday.
3/11/2003, also LOW week, low on Tuesday
4/28/2004, 2 more down weeks approx. with a 6% draw
4/27/2005, 2 more lower weeks with a 6.5% draw
9/14/2006, 3 more lower weeks with a 6.25% draw
8/16/2007, also LOW week, and low on Thursday
In all of the above cases, once the weekly had established a swing low, that low was never again violated until the previous highs had been exceeded.
During the 2008-2011 run, that condition appeared only once in late SEP 2011, and did produce a minor rally but failed and that was a good omen of things to come.
The current situation, with today’s close on the XAU at approx. 73.70, we satisfy the conditions as noted earlier.
Very cool Pankef.
Could you chart that by chance ?
i posted the dates because I am not “good” with linking the chart here. All you’d have to do is look at the above dates on the XAU on a daily basis and you can immediately see what i am talking about. I believe Alex had noted earlier that once the lows on this decline are set, it would be a bad idea to take them out and that is exactly what the above notes. But, instead of worrying about what “may” happen in the future, this analysis is actually quite bullish for the foreseeable future and SUPER BULLISH if you are in the camp that believes the JAN 2016 lows started a major advance.
Where is Maria when you need her….sigh. 😉
Thanks Pankef.
… 😉 gosh i spoiled u …. https://uploads.disquscdn.com/images/71efe31a49ce6a15767b6a06e9083129e43403213b2cb28938cc744cc3339dba.png
i’ll pretend to be Maria..
chart here.. indicator shows +10 & -10% on the 50sma (red) and 200sma (gold).
can see the dips below and above the % lines.. admittedly not easy on the cramped-up 14yr chart.
https://uploads.disquscdn.com/images/46fc5e9740e90853c74841a48cd7b688ceb4d4aff5786f205048824c960848ab.jpg
u better go buy some thigh Highs,stilettos, &leather&lace… snicker;)
have you got a gif for that?
😉 i refuse to answer on the grounds that i may incriminate myself
#TheFifth
fair enough.
what is this.. #TheFifth?
The Fifth Amendment to the Constitution …..
k thx.. i had to double-take that at first.. i thought you’d written #TheFilfth
Pankef.. i posted a visualization for Ken below.
i presume what i have shown is what you were on about?
Yes, that is it. Thank you SonOfGud
Ken is Very Visual !!! 😉
Thanks SOG
*giggle
Actually just realized.. its ‘mea culpa’ here..
i think the PPO indicator on the Stockchartsdotcom is ema only.. not sma… so there will be a difference.
Can get sma on TC2000, but it only goes back a few years on the daily
my analysis is done with sma so your chart is correct. Sorry, i thought you said you had created the chart with SMA
the smas are showing on the price chart… but on the indicator below, its using ema info only , if i remember correctly
It doesn’t really matter, this type of analysis doesn’t have to be an “exact day” type of thing but rather enable the player to position oneself
pankef…what do u mean u arent good? do u need help posting?
i meant dealing with posting charts. SonOfGud solved that issue. Thank you for the offer to help.
i should have noted that the date posted is the “first” date where the observation is made. Subsequent readings are omitted until a rally has taken hold
Love great research. Am I correct in assuming that, if we are in the 2008 water fall, that we should definitely stop out if we go 6.5% further down?
Yes, but that waterfall decline had been preceded by a significant advance both in time and price. The current move higher is basically still a “baby” in terms of time. I am no fan of hard percentage stops (the market doesnt care what I can or cannot afford) so I prefer the swing confirmation as my stop.
I am not talking hard stops. Since your worst draw was 6.25%, why not have a mental stop of 6.5%?
Glmus, that really becomes a personal thing. I believe in managing position size so to avoid having to deal with dollar stops.
Thanks for this. Appreciate the time that you needed to get it together.
Good note, thanks for sharing.
Thank you Pankef. Its so cool when people help each other!
Gold double bottom breakdown per P&F today. P&F doesn’t predict well anyway.
Had a really tight stop on JDST, DUST in case we got a reversal. Which we didn’t do, but was stopped anyway (oops?). I got HL and AG right at the lows previously, which is kinda nuts b/c as SOG can tell you, buying the tops is kinda my style. So, that leaves me with a couple wins, a couple losses, and cash to deploy on next trade. The miners I still hold I am hopelessly buried in; the rest I’ve sold for profit before Fed or recently stopped at pretty minimal loss.
The crazy thing is GDXJ fell so damn fast that a “hedge” in JDST was my 4th best trade of the year. Maybe if I’d gone just a bit heavier. Anyway, made enough to buy a full position on a GPL or NAK or AUMN if, if,if we ever get a bounce. Which doesn’t seem likely. Hell, I watched the initial April 2013 waterfall tick by tick and even that bounced (with an inside candle on the monthly, but at least a damn bounce).
I am writing a Friday report. Got started at 4 a.m., not quite finished yet!!
Hoping for release by 8 a.m.
A new report was released 10 minutes ago
Just saw the alert pop in.