
Dec 17 Weekend Report – Precedence
We have seen some unusually deep selling in the precious metals sector, so I do want to discuss whether or not there is any past ‘precedence’ in this area later in the report. First let’s discuss what has happened in just the past week. To the charts…
.
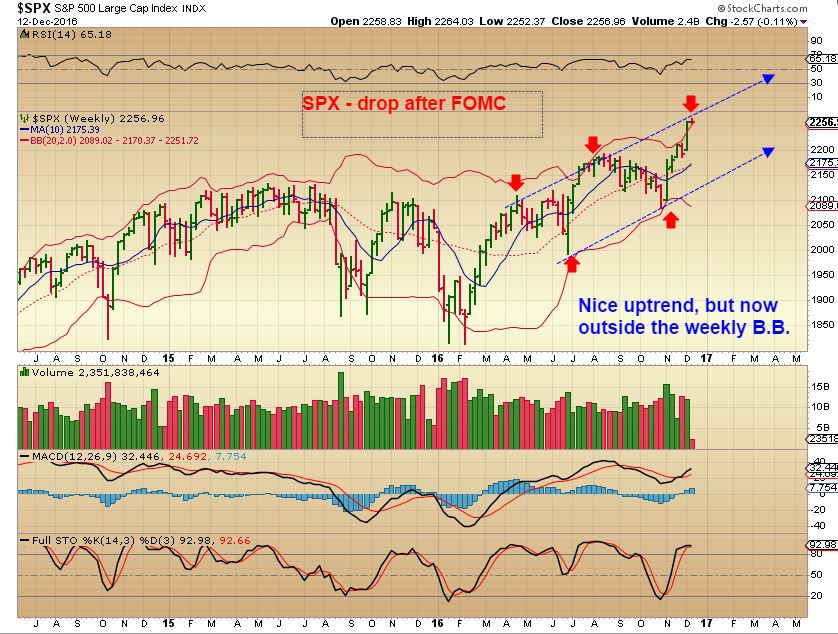
SPX – Dec 12th, I was looking for the run to stall, and we should see a pullback.
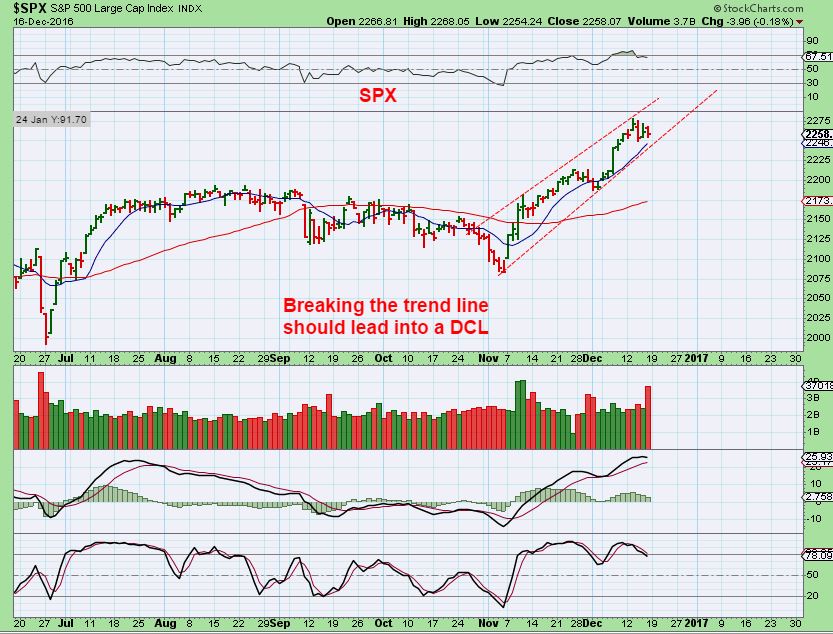
SPX – We have stalled and pulled back a little. A break of this trend line could bring a little more selling, but this will likely be a right translated daily cycle and we can expect higher highs on the next one too. The red line is the 50sma.
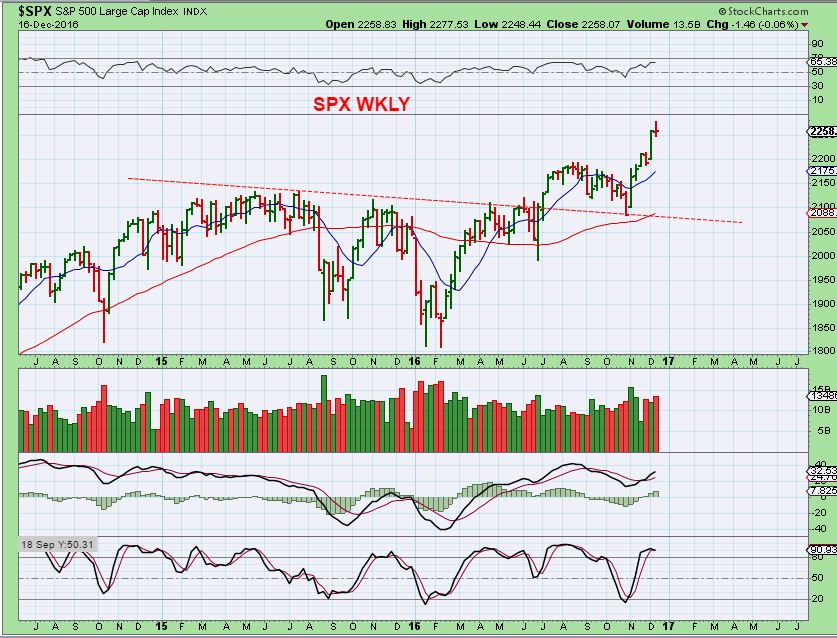
SPX WKLY – And we do see a form of topping candle on the weekly. Falling to the blue line at 2200 would also back test the break out.
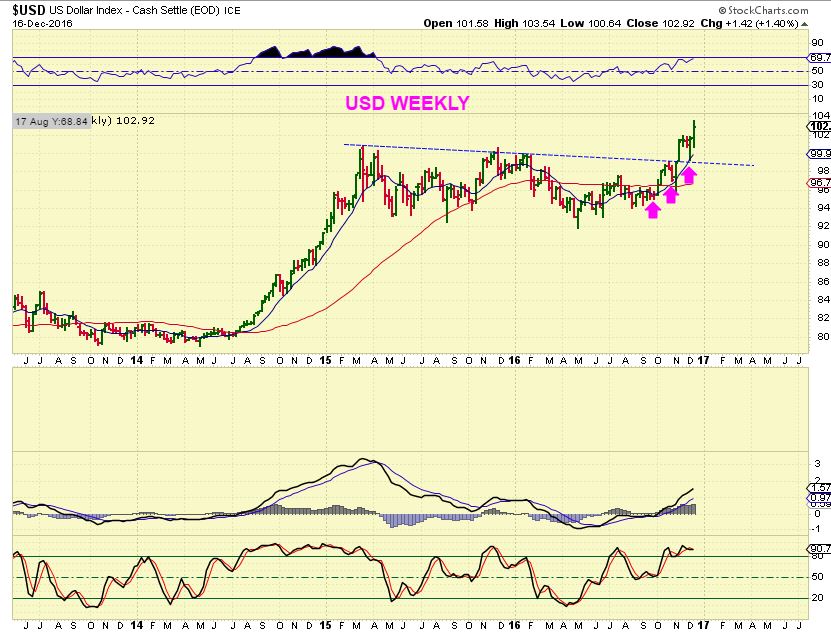
USD WKLY – This has remained bullish and continues to look like it wants higher price.
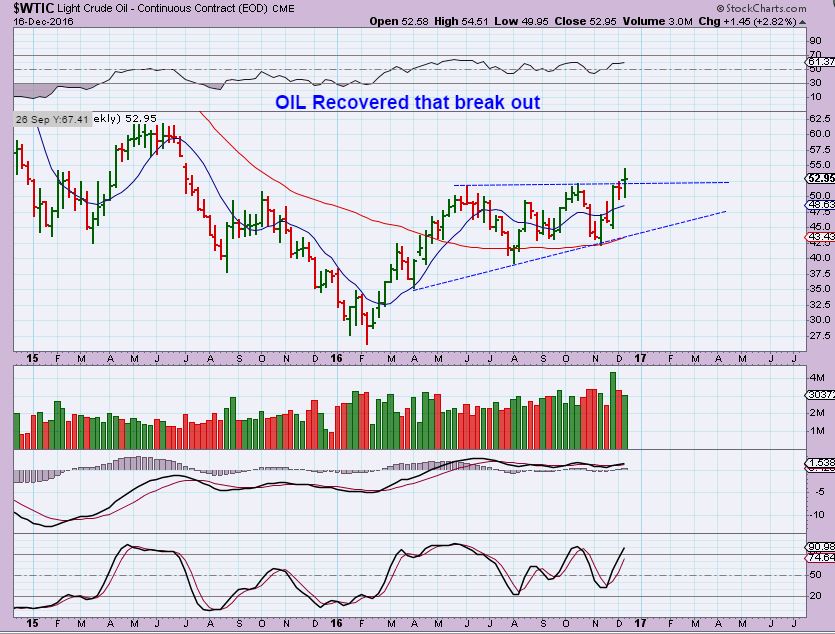
WTIC – Oil broke out earlier this week, dipped back below the break out area, and recovered. So Oil has broken out on our weekly chart.
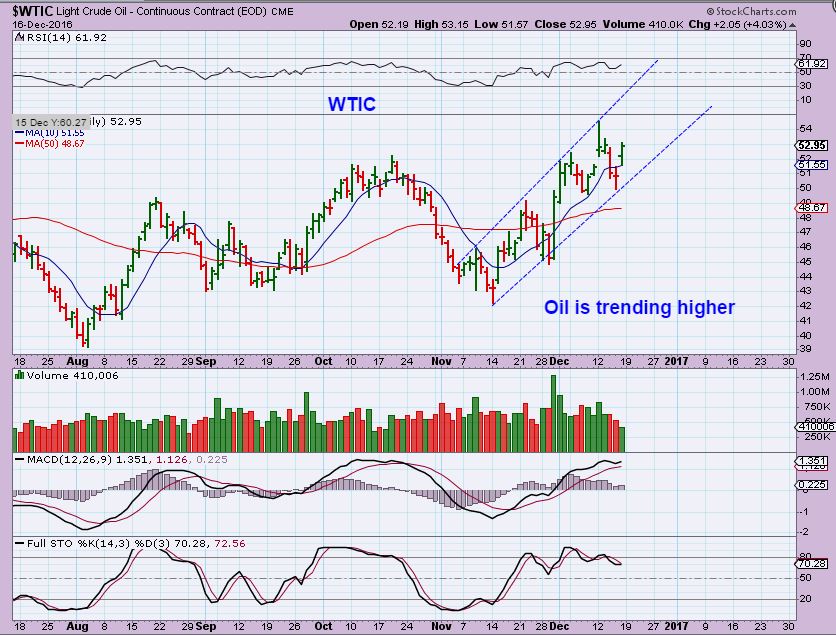
WTIC DAILY – After gapping higher and breaking out, Oil filled the gap and then some, but recovered Friday. We are starting to see a channel or uptrend form. Several Energy stocks pulled back as expected, and now look set up to run higher too.
NATGAS – This could drop a bit more after a solid run higher.

GOLD, SILVER, & MINERS
.
There are a few small hint of good news, one simply being that GOLD, SILVER, and MINERS are all at their recent lows together. This means that they are now in Sync when an ICL develops. They should all be on or around Day 1 together when we move higher. Let’s examine a multitude of bullish and bearish characteristics in this sector and try to figure out where we are, or what we can expect from here.
.
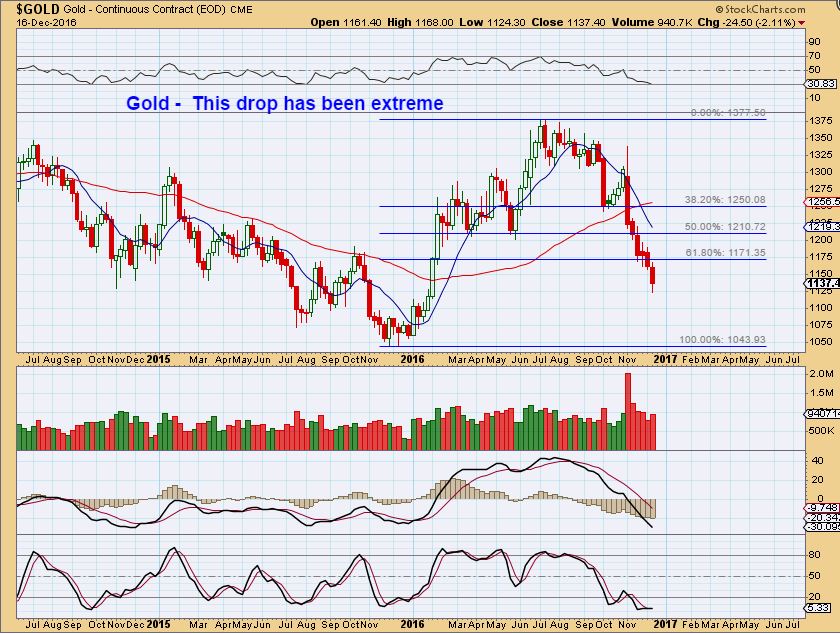
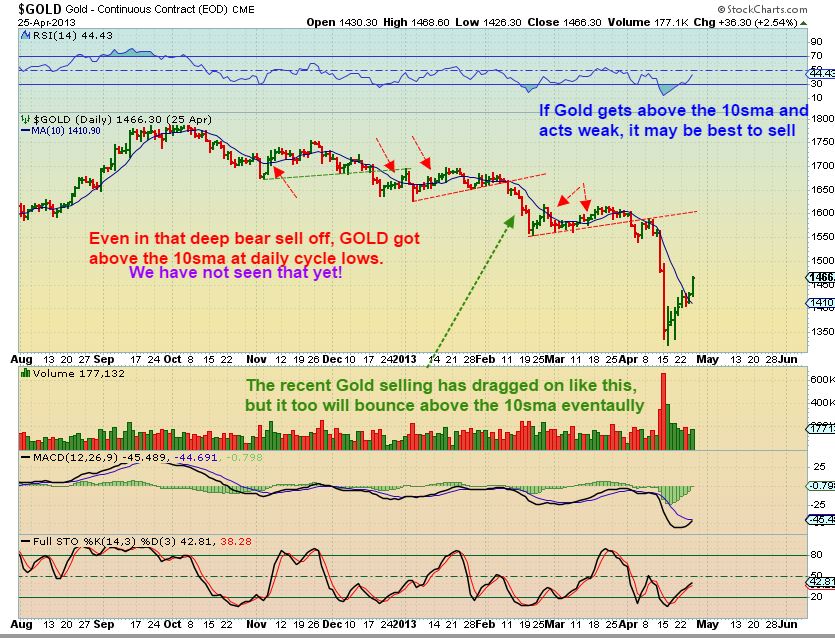
GOLD – We have seen such a steep exaggerated drop since the Election results, that Gold did not close above the 10sma yet. A close above the 10sma would indicate the formation of a daily cycle low. I looked back at ‘Bear market’ drops in Gold, and Gold ( even in a bear) did break above the 10sma at dcls. With that I conclude that this is one over stretched daily cycle, overdue for a low. When it finally reverses above that 10sma, it could be like a sling shot out of the lows. Short covering and buying could push it higher quickly, similar to the move out of the May ICL.
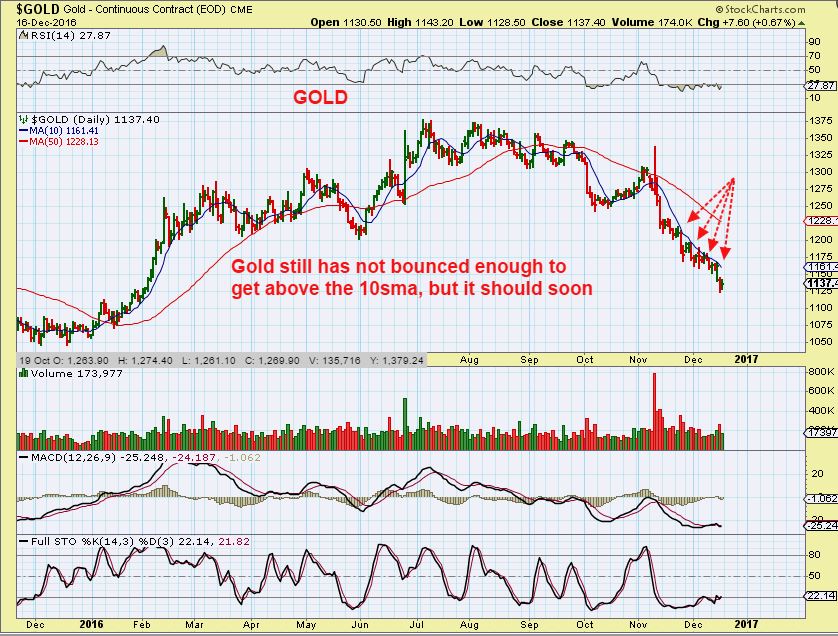
SO I will re-post this chart. We could see a V-Bottom sling shot out of the lows if we get a reversal here. This is also that line in the sand back test that I was watching. Gold closed at $1137.40 this Friday.
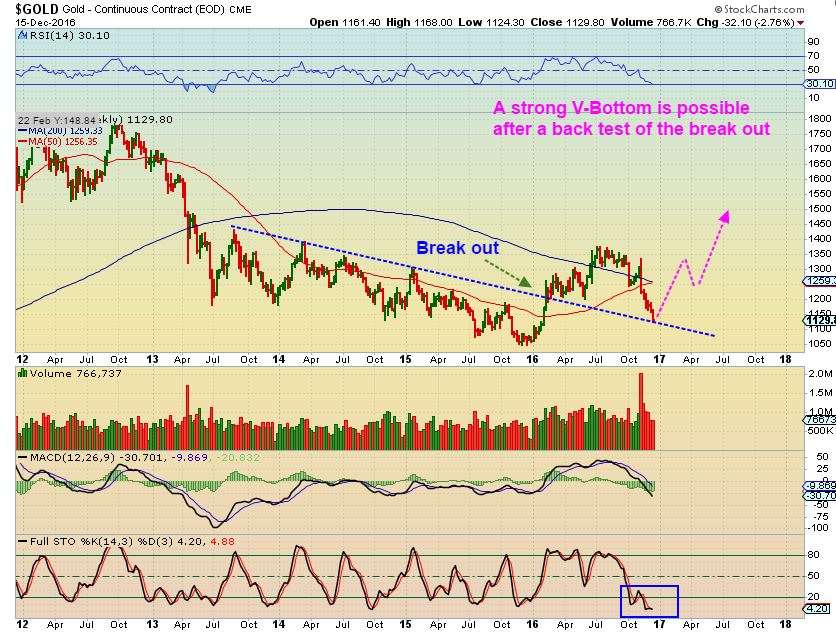
GOLD WKLY – The pull back is now deeper than 61.8%. It is not common early on in a bull, but there precedence for a Bull market to pull back that deep and remain bullish. I will discuss that later in the report.
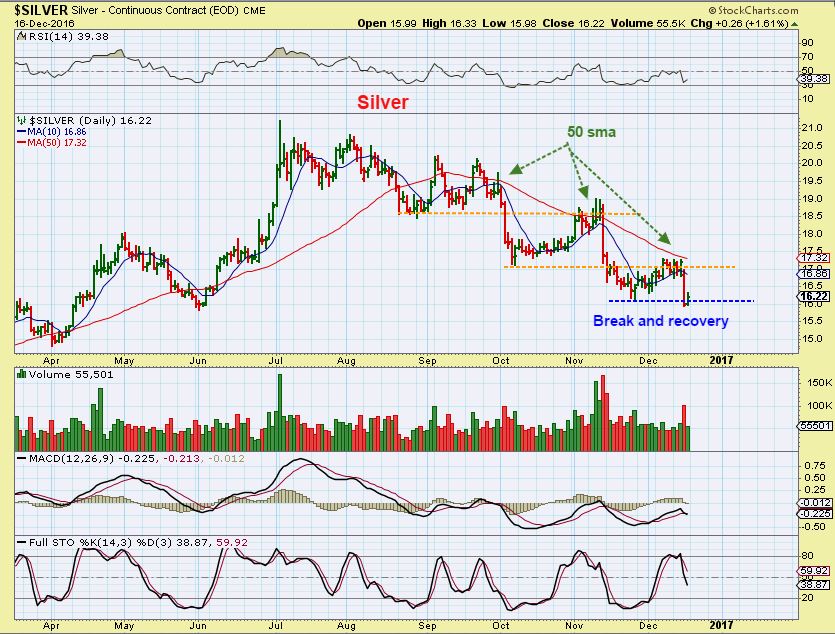
SILVER – Silver broke down Thursday and actually recovered Friday. Follow though higher next week would be bullish.
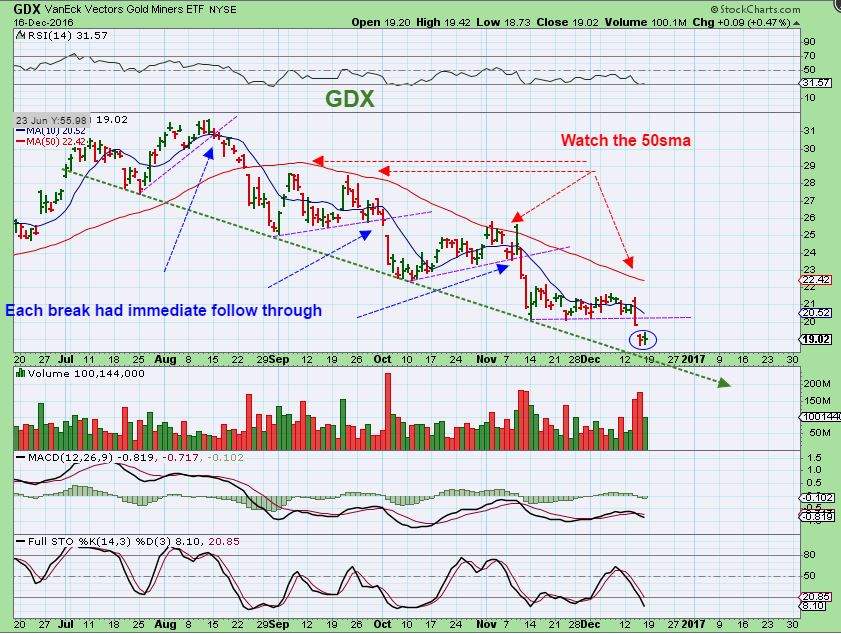
GDX – GDX is failing at the 50sma with each Daily cycle high. It didn’t even get to the 50sma in the last daily cycle. Miners broke down Thursday, and then it stalled Friday. It did not have immediate follow through like they did in prior breaks of the Purple lower trend lines. Friday miners went green, and a gap open Monday would be a Bullish reversal. A drop lower would likely tag the lower trend line.
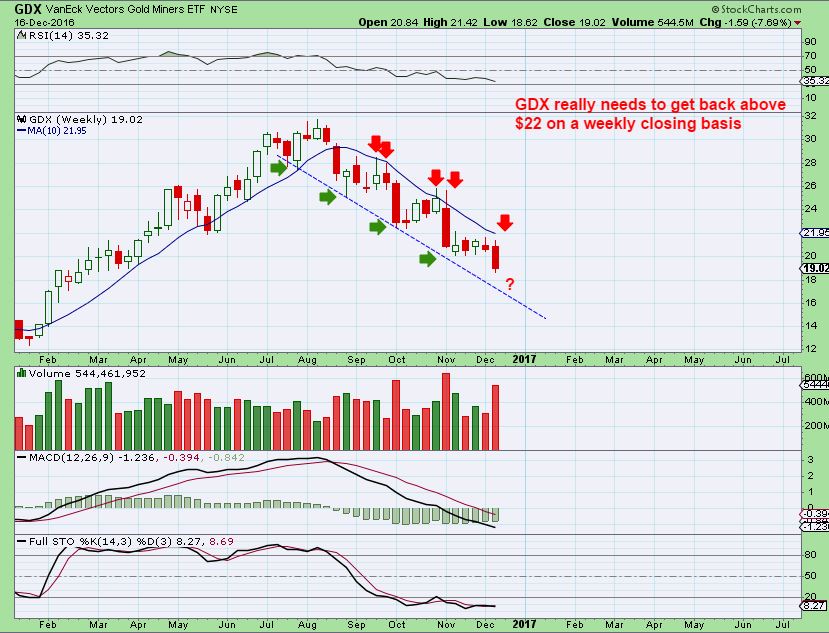
GDX WKLY – This lower trend line shows that GDX could drop further if it remains bearish. We need to see GDX break & close above $22 for a more bullish set up to form on a weekly chart.
Conclusion: Friday was semi promising, but the weekly charts of some Miners went from good to bad. Gold is very very late to put in a swing low. It has not been able to move above the 10sma, so it has not put in a dcl yet. Friday we saw Silvers break down get reversed, and the Miners closed higher possibly setting up a reversal that recovers the lows next week. IF THAT HAPPENS, we then have to watch how this sector moves out of the lows. V-Bottom? Weakness continues? IF the weakness continues, we need to look for other bullish trade set ups until this sector begins to act correctly again. I have actually been taking a few trades that I have been showing in the reports recently , and it has been paying off. NOG, NADLE, PACD, etc have made decent %-Gains and off set Miners that broke down.
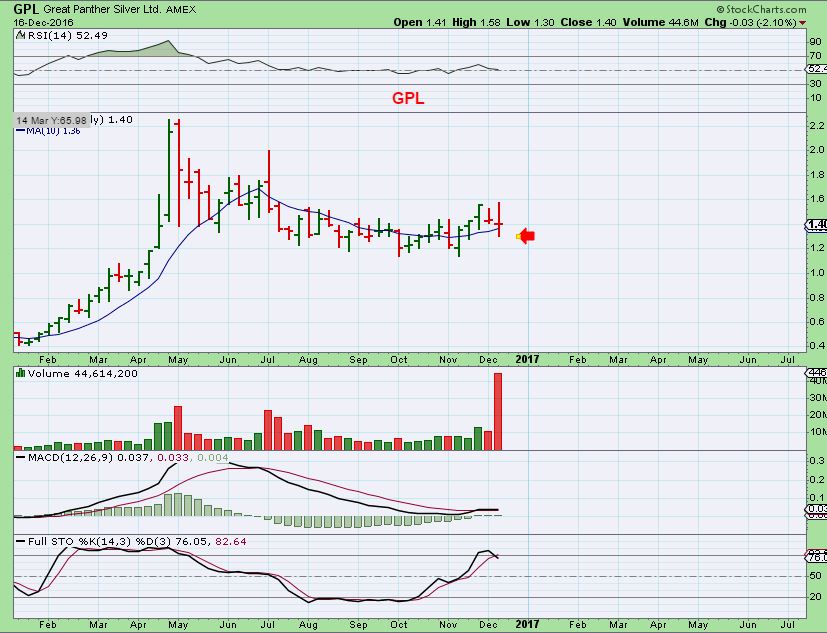
GPL broke down and recovered this week, so the weekly chart remained bullish, however…
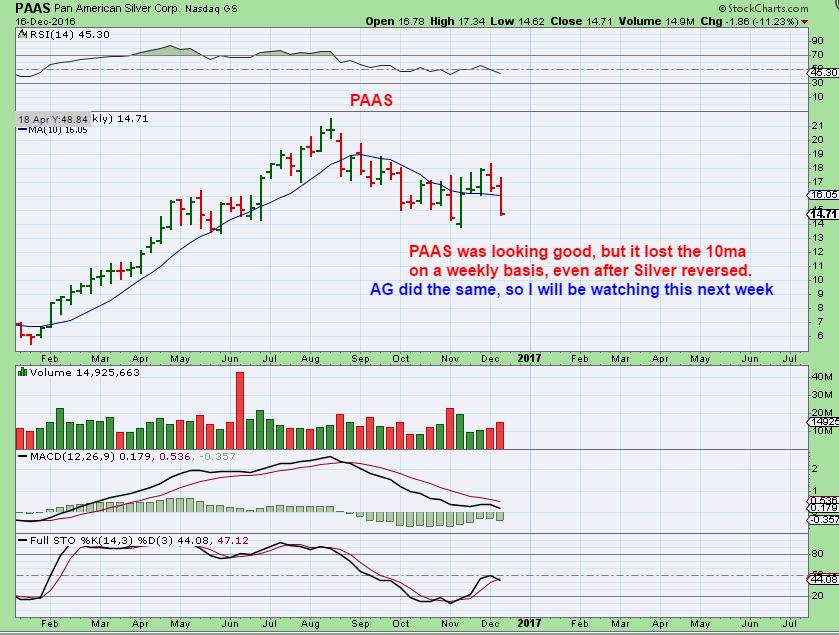
Others did not recover, so I am watching this area next week. I would have sold PAAS if I owned it, but a recovery next week could also make an inverse H&S out of this too.
.
Now I want to discuss everything else, both bullish and bearish.
.
There is nothing that says that this Sector has absolutely changed from a Bull market in precious metals to a bear market. I will show you that now, but obviously we have been trending lower and the following charts will give precedence to this type of movement within the framework of a bull market. I will also show bear market characteristics that are present now too. This is NOT to confuse anyone, it is to show that what we are seeing is directly between Bull market and Bear market parameters to me. Here we go, Bull and Bear characteristics and precedence.
.
When the Precious metals markets of 2008-2012 turned bearish, it started in a similar way that we see this sector now.
GOLD Struggled along under the 50sma daily cycle after daily cycle. We do see that now, but that also happens in Bull markets, you just want to see it correct itself sooner than later, and it is getting very late.
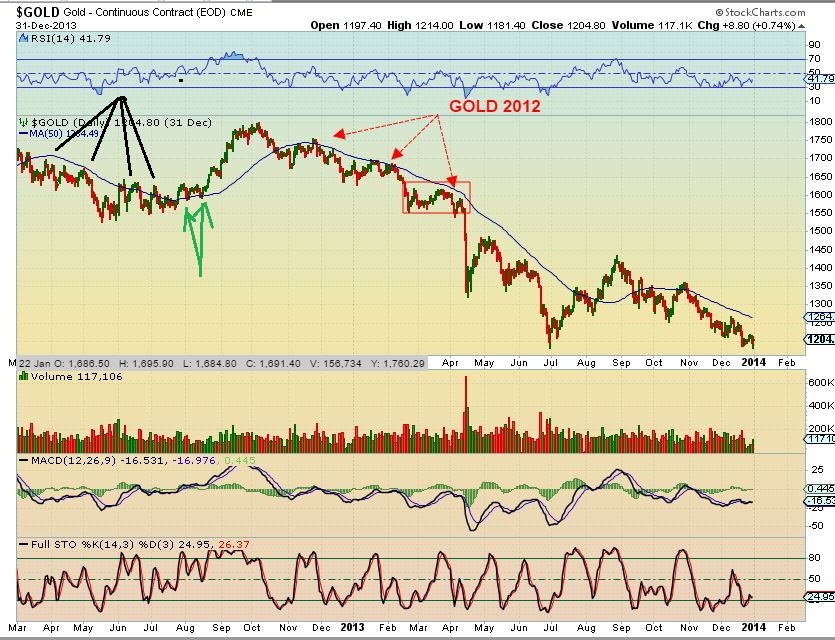
GOLD 2012 – Please notice that on the daily chart, Gold still popped above the 10sma on Daily cycle lows. Again, we have not seen this, so we have not seen the daily cycle low. We are VERY overdue, and I will watch how things unfold once we get one in place.
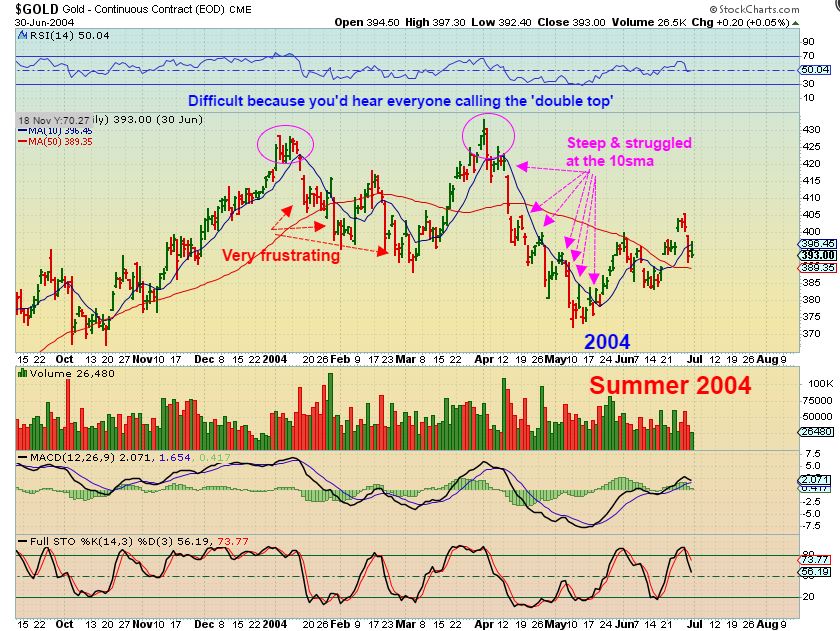
I want to show you something. When people look back at a bull run like Gold was in below, they always seem to think that it was just all Fun and ‘Gains’. Easy to just buy & ride to the top. The reality is that they are BULL markets , bucking and jumping up & down at times too. Take a look at this beautiful bull run in Gold. Easy rider, right?
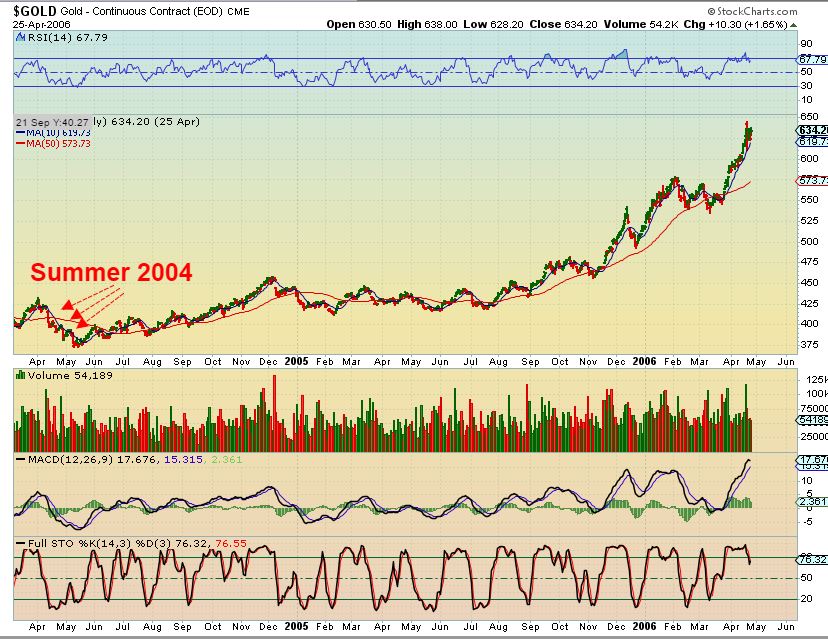
GOLD Summer of 2004 – Well this is the summer of 2004 shown in the above chart. I was trading Gold and Miners during this entire run. This was ‘dreadful’ ‘Scary’ ‘bearish’ ‘horrific’, etc in public blogs, and there were all kinds of reasons why the bull from 2001 to 2004 was now double top dying and a bear market was sure to return. Now look at the ABOVE chart again. It happens.
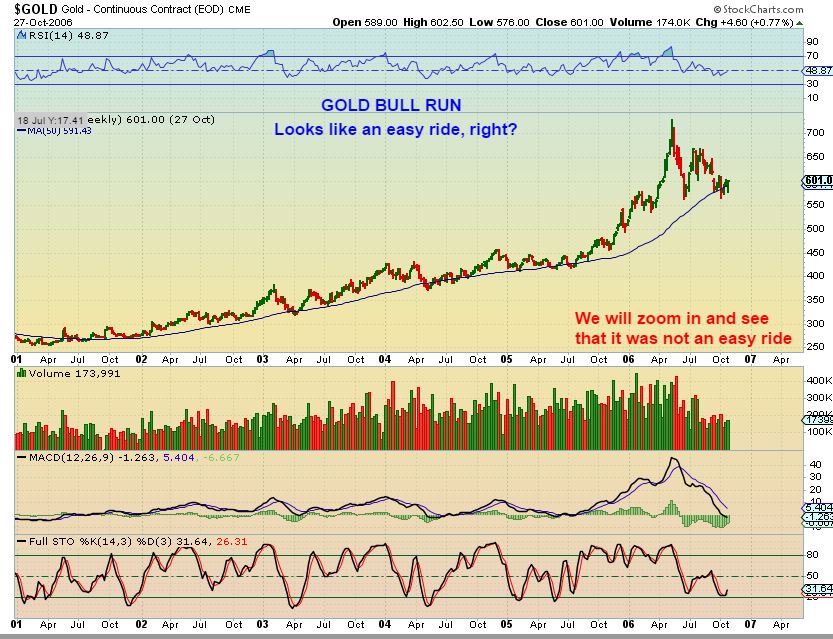
Here is the GOLD BULL WEEKLY from 2001 –
1. You hardly see that 2004 blip in the big picture bull, right? Well above we just said that it was brutal and horrific.
2. 2006 looks worse and it was still a bull.
3. What about that little blip of a pull back in 2003? Both dipped below the 50 weekly MA for a bit.
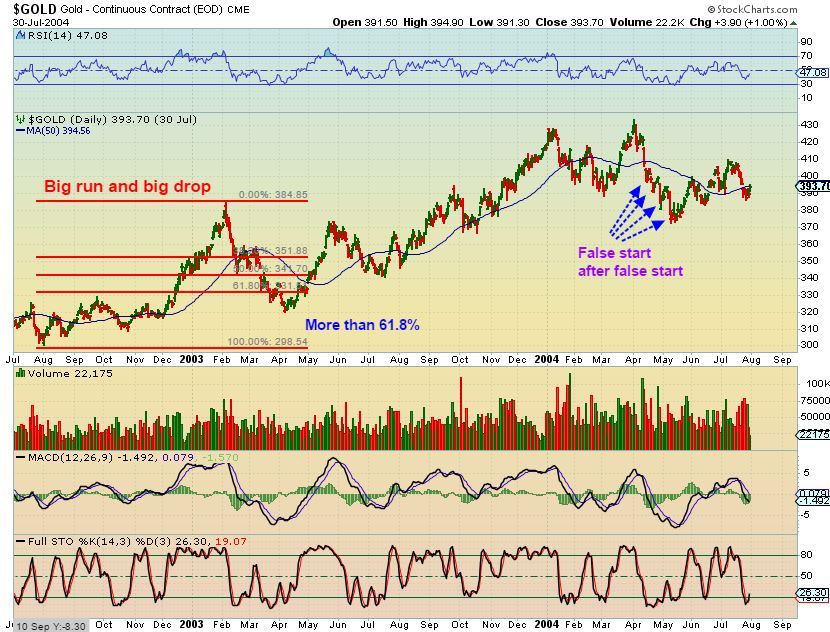
GOLD pull back 2003 – It dropped over 61.8% from the August ICL (lows). That is similar to what we are seeing now. Gold had a pullback deeper than 61.8%, closer to 73%. Gold has done that now in 2016 too. The big difference is that this was from 1 ICL to the next. Currently, we are doing this from THE LOWS a year ago. We broke below and stayed below the MAY ICL, so this is concerning. It is more of a break down now, but at least we see a DEEP 70+% correction in 2003 that happened in a very quick period of time. That must have been scary and seemingly relentless too.
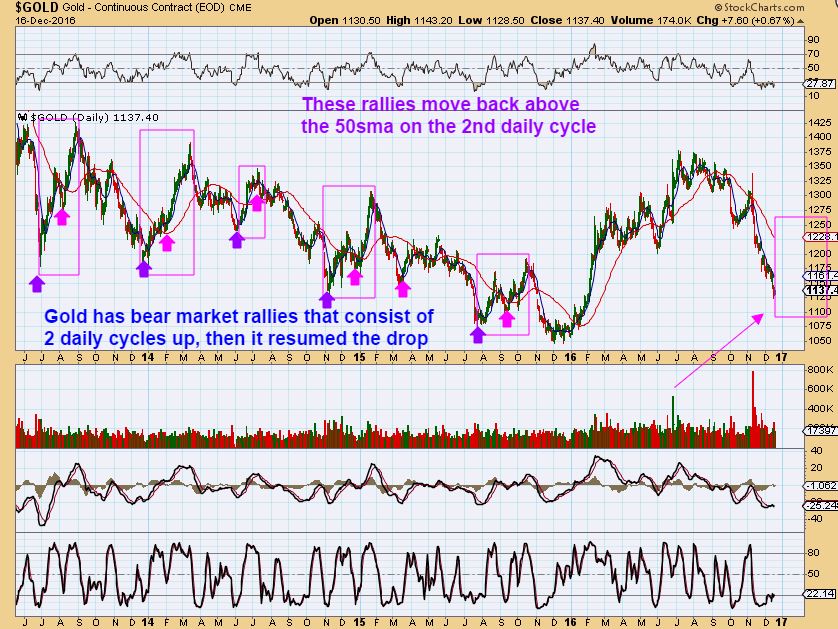
I’m going to call this GOOD NEWS. We are waiting for an ICL, and even in Bear markets, Rallied out of the ICL usually have 2 pretty strong daily cycles, and then they roll over to lower lows. So we are waiting for that ICL, and we should get 2 pretty strong rallies before rolling over even if this was a change to a bear market. Please see the chart below, this was in a bear market.
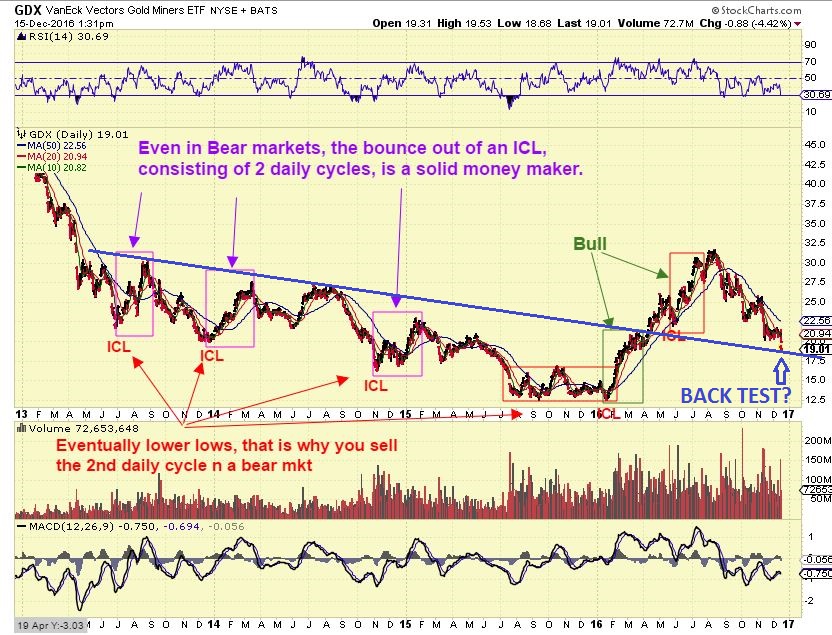
GDX too – Notice that GDX rallied nicely in the first 2 daily cycles out of an ICL. Also notice that this is that line in the sand for Miners now too. A perfect back test, or is it breaking down? We shall soon find out.
I’m going to leave GOLD & GDX on that positive note. We may be seeing a big picture correction that is back testing the break out from the down trend. The general markets look as though they want to dip a bit further. Oil has dipped down and then turned upward, back above that break out area, and I am again seeing nice set ups in many energy stock. I have been taking these trades to offset any selling in Miners that I may be holding. Gold & GDX have dropped a lot deeper than expected, but in the past, we have seen large corrections too. GOLD has NOT moved above the 10sma yet, and it will move above the 10sma even in Bear market rallies to signal a new daily cycle. At this point you should not own Leverage or be heavily invested. I own a few miners, and still have not been stopped out of GPL, NAK, etc. When we finally get a confirmed swing low in Gold, it should also be an ICL and I would expect 2 daily cycles to push Gold higher again. Then we can analyze what we are seeing at that time. Hopefully a V-Bottom will make it clear quickly.
The Christmas holiday for the stock market to be closed is on Monday the 26th. While we do have a full trading week, it may be rather light pre-holiday trading and easy to move around. Enjoy the rest of your weekend. I will try to post a short pre-market report Monday with just a few trade ideas for those looking to trade the Energy or Industrial Metals sector. Thanks for being here at Chartfreak!
.
~ALEX
.
Please ignore any possible typos. I am trying to release this on Saturday night, so I will be releasing this without a solid proof read. 🙂


Great. Thanks!! That GDX chart is really something! Everything will work out just fine!
Thank you for the detailed report. One note – the oil COT looks terrible. Quite bearish to me. I know you can’t “time” the COT data – but commercials massively short here. On the other hand, they are massively long 10 year treasuries, looking good on gold as compared to other ICL’s, and buying Yen again at a higher level than last Decembers bottom in gold…Generlly good signs- but cautionary note on oil. Thanks again.
Did you take a look at the gold COT? I also posted on Friday’s letter. Looks to be already turning up but that was pre-Fed. Hmmm…
Thanks for the detailed report. I like the hopeful chart you ended with. I tend to be a “glass half full” gal. [But i will be ready to sail out if need be].
I agree with Nancy! …….and at least we have a “glass”! 🙂 Thank you for your hard work and research. It is so to cool find some quiet time over coffee and read your reports. Its even better to come home from work and read all of the great info in the comments section. Your sub’s have to be some of the brightest people watching charts. I am amazed at the amount of quality analysis every day. And the humor sure helps the soul too! Thank you Alex! Thank you Chartfreaks!
Your such a kind soul johnnyAppleseed 🙂
Thanks Johnny! Let’s just cheerlead this gold UP! I actually believe the metals are manipulated and we won’t go up till the BIGS have their positions…or have squirmed them around to cover themselves…till they can’t hold it down anymore. I rather like the slingshot idea.
FSM is one of the stocks I want to get once I see things going in the right direction…it is up over 7% in after market Friday….we’ll see what it does in the morning…big sell off Friday at the close but buyers must have stepped in after the close….
The BOJ will be announcing it’s interest rate/policy decision tomorrow night – I’m assuming if they don’t raise rates (which I believe is what is expected of them…) – that the yen will have continued weakness….not sure what, if any, affect that will have on markets, etc. but it seems something to keep an eye on….
If the BOJ stands pat, that may be the Buy the Rumor/Sell the Fact event- i.e. bottom in Yen futes (top in USD/JPY) which may finally give us a tradable low in gold -watching 1122.00-1117.00 area
PMI comes out this morning
slow day.. go nak 😉
man .. i kept staring at today’s ‘theme’ pic and i SWEAR ….. I saw a chart Freak….
https://uploads.disquscdn.com/images/5816c142fdeab6597674e751b3da646c273902f69fa30a881e1943105201166e.jpg
HA!!!
Ok, I need another miner rally before we chisel him in there! :O
i chuckled…. 🙂