
Where Are We Now?
So far things are playing out in ways that we anticipated. This should make the trades easier to enter. Lets review the Monday action in the markets.
.
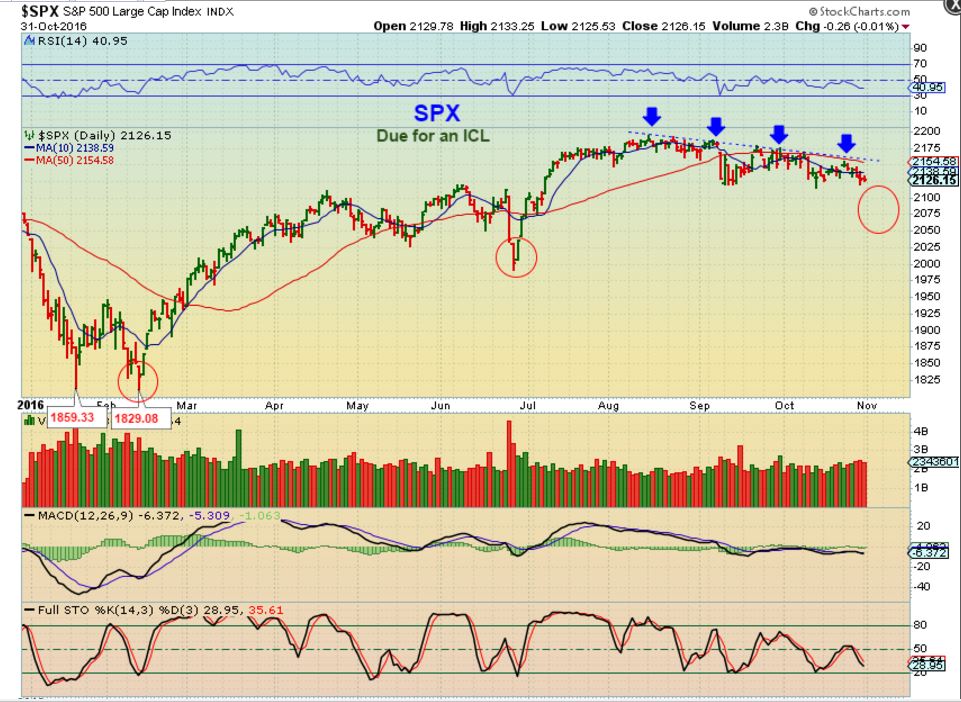
SPX OCT 31 – Using cycle analyses, I have been expecting the SPX to drop into a trade-able low. The circled area was the expected target, a higher low and not an outright crash.
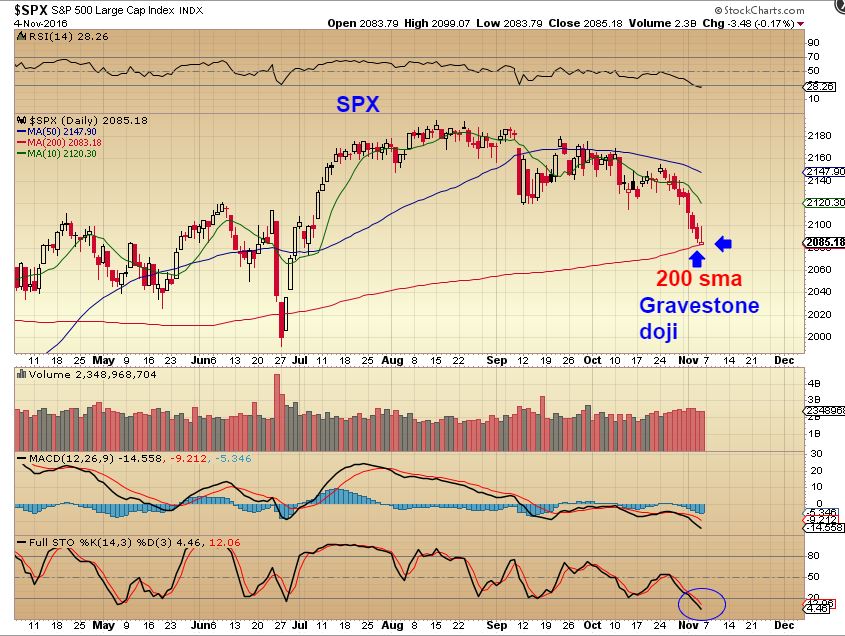
SPX – Nov 4th, This is a gravestone doji and quite often acts as a reversal candle after a sell off. Timing was correct and we were within that circled area. We would look for a reversal.
SPX Nov 7th – Monday definitely saw a strong move out of the lows by all indexes. The SPX broke above the 10sma and in the past, day 1 was not the end of it. I expect follow through and then a possible back test of the 10sma. We saw this in Februarys ICL and Junes ICL.

Look at the last 2 ICLs. Price took off for 3 days and then dropped back onto the 10sma and the 50sma. I am focusing my purchases on Miners, but if you are looking to go long the general markets ( UPRO or another vehicle) You probably could enter a long position anywhere here in my opinion with a stop below Friday, but waiting for that pullback may offer a lower entry than you could get today. The pullback could happen after the election results.
.
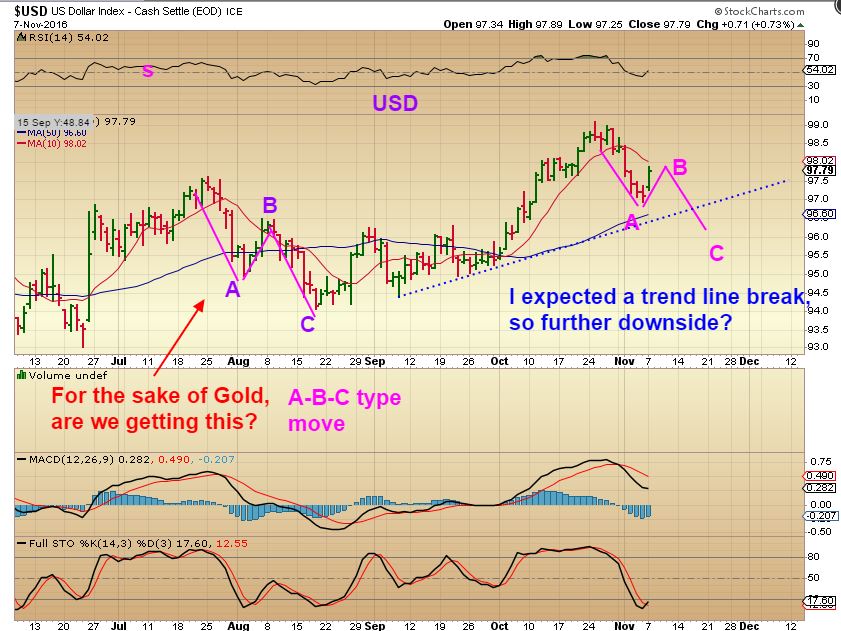
USD – Did the USD put in a dcl, or is this a bounce? Time will tell, but we have seen the USD bounce and curl back down quite a few times. The timing is VERY LATE for a dcl, but we didnt get a trend line break as expected. We’ll have to watch it going forward.
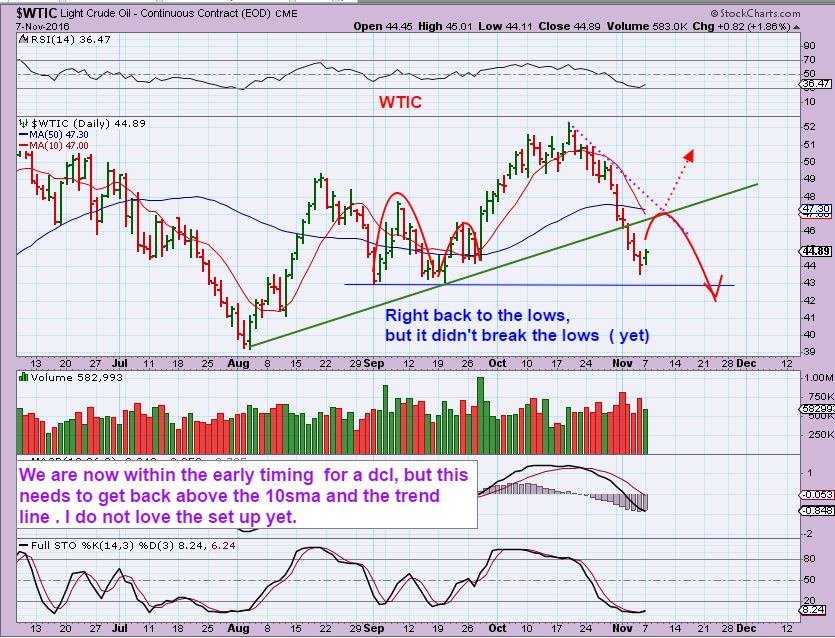
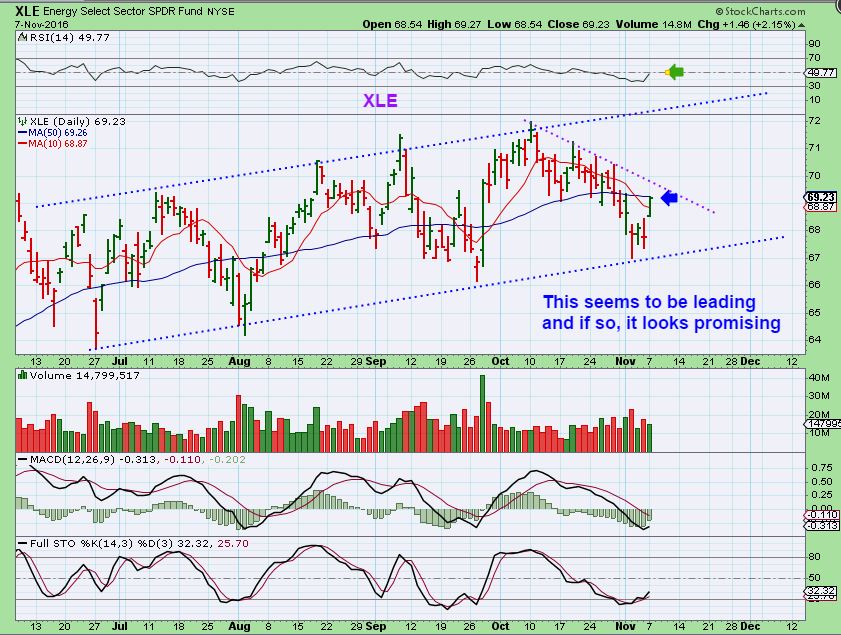
WTIC – We are in the early timing for a dcl, but Oils cycles can stretch onward. Be cautious, but the XLE does look pretty good. I expect a bounce, so short term trades may be favorable, but a swing low alone is not confirmation of a dcl. Further confirmation is needed since a swing can just be a bounce ( and WED inventory report will probably reveal the future path). I drew a possible bullish or bearish path.
XLE – The bullish part is that the XLE bottomed 3 days ago and Oil was still dropping. Miners often lead Gold and Energy stocks often lead Oil. This could indicate a trade able bottom is unfolding, but I am focused personally on Miners. The bang for the Buck is usually huge there.
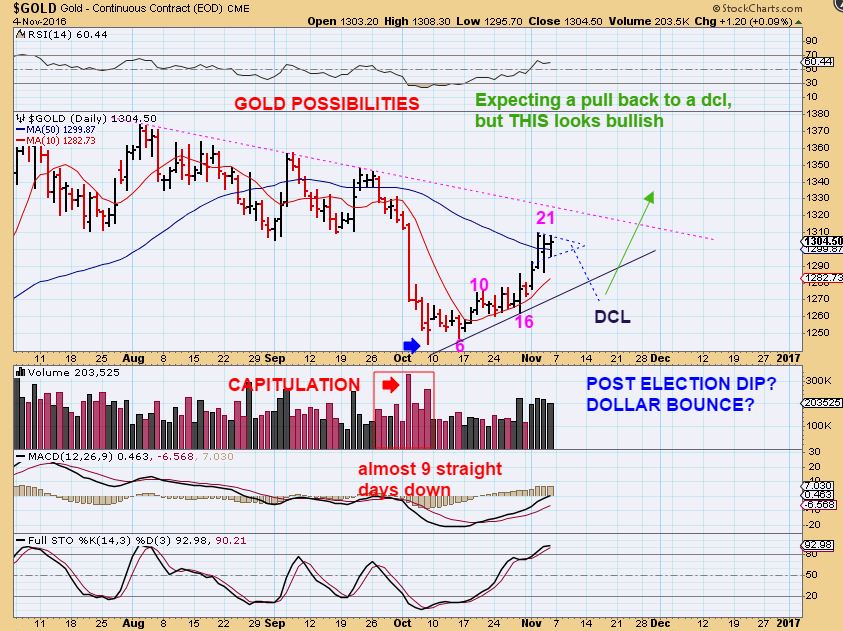
GOLD – Gold dropped over $25 on Monday and lost the 10sma, but I see bullish implications in the Miners already. I WANT TO SEE LOWER GOLD PRICES. We are in the timing range for a DCL at any day, but we are supposed to see a trend line break. Looking back, I didn’t really see one in either ICL in 2016 for months though. With that in mind, I’m looking for a swing on a price reversal and a move above the 10sma to indicate that Gold may be ready to move higher. The story gets better…
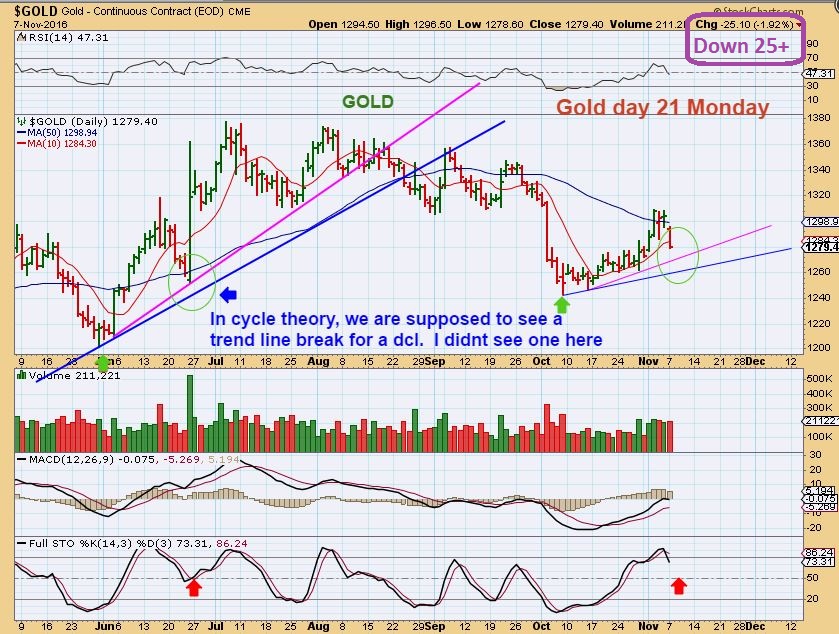
GOLD – This chart from the weekend report could be playing out here. Not a post election dip, but a pre-election dip. Gold is due for a dcl at anytime, but it can drag on a bit.
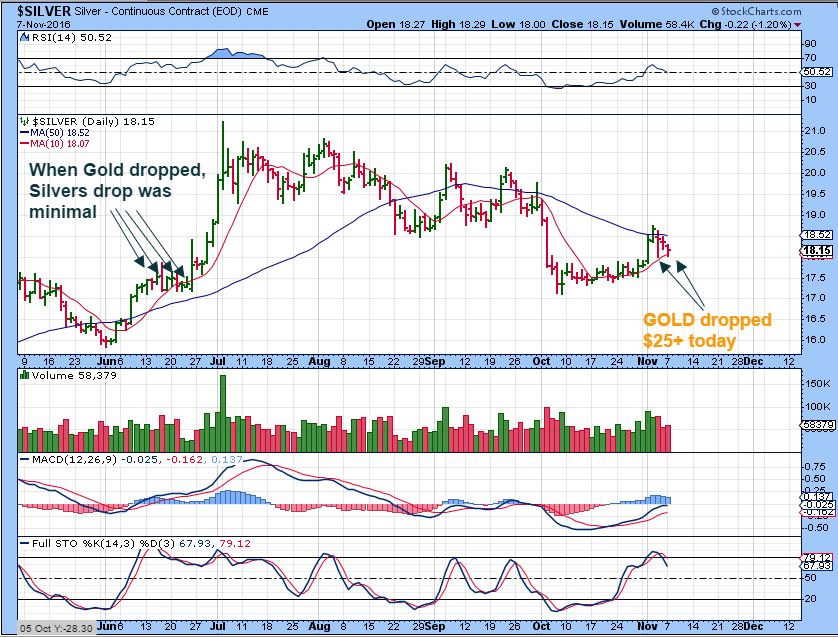
SILVER – Gold dropped and closed near the lows below the 10sma, Silver dropped to the 10sma and bounced with a bit of a recovery. When Gold dropped in May, GOLD dropped in a steep manner too, notice that Silver did not. It may not here either.
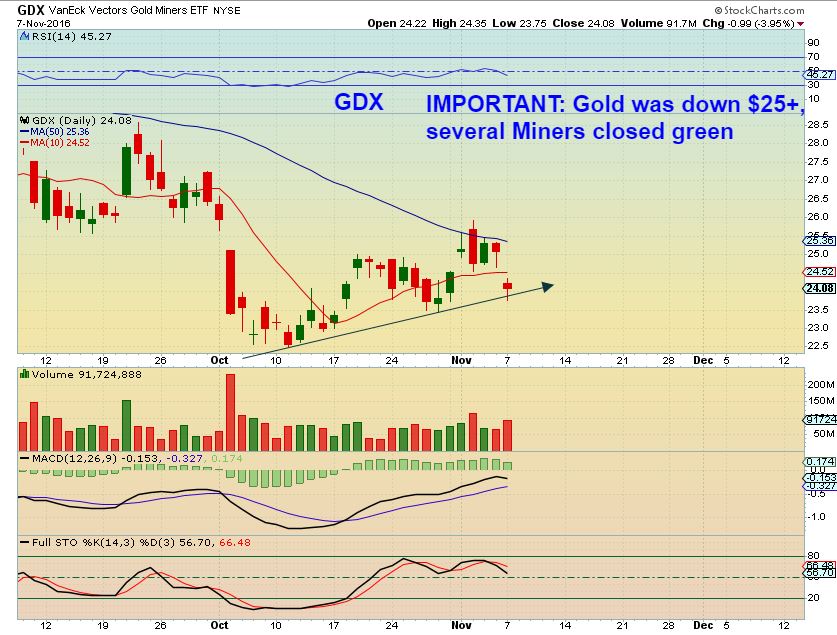
GDX – GDX crashed down hard. It was down about 6% at one point, but it also reversed upward and closed down only about 4%. That still doesn’t sound very bullish, but several Miners actually recovered to green WITH GOLD DOWN $25! WHEN DOES THAT HAPPEN? Let’s take a closer look at just a couple of examples…
.
CLUES, SIGNS, HINTS
.
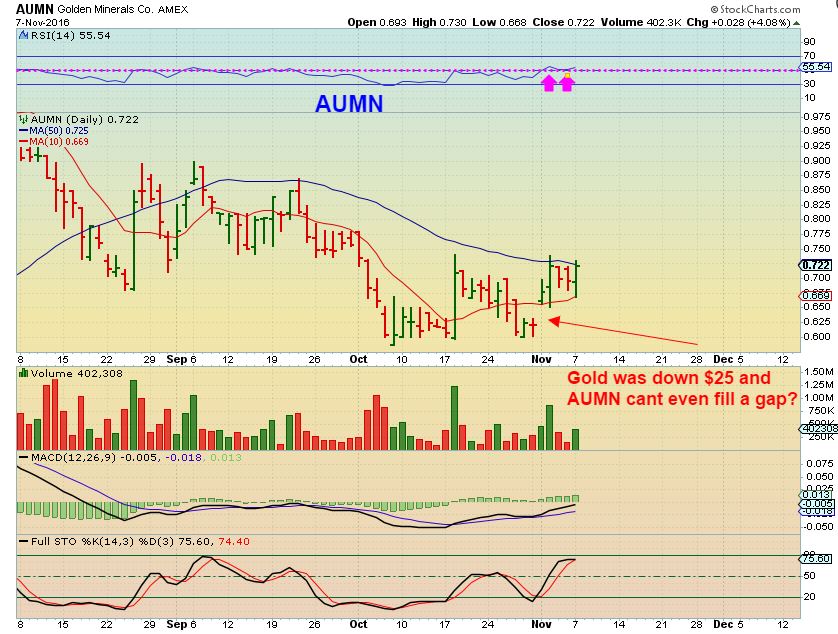
AUMN – Gold was down how much Monday? And AUMN didn’t crash? No, it dropped to the 10sma and reversed, closing up over 4%. AUMN released earnings last week.
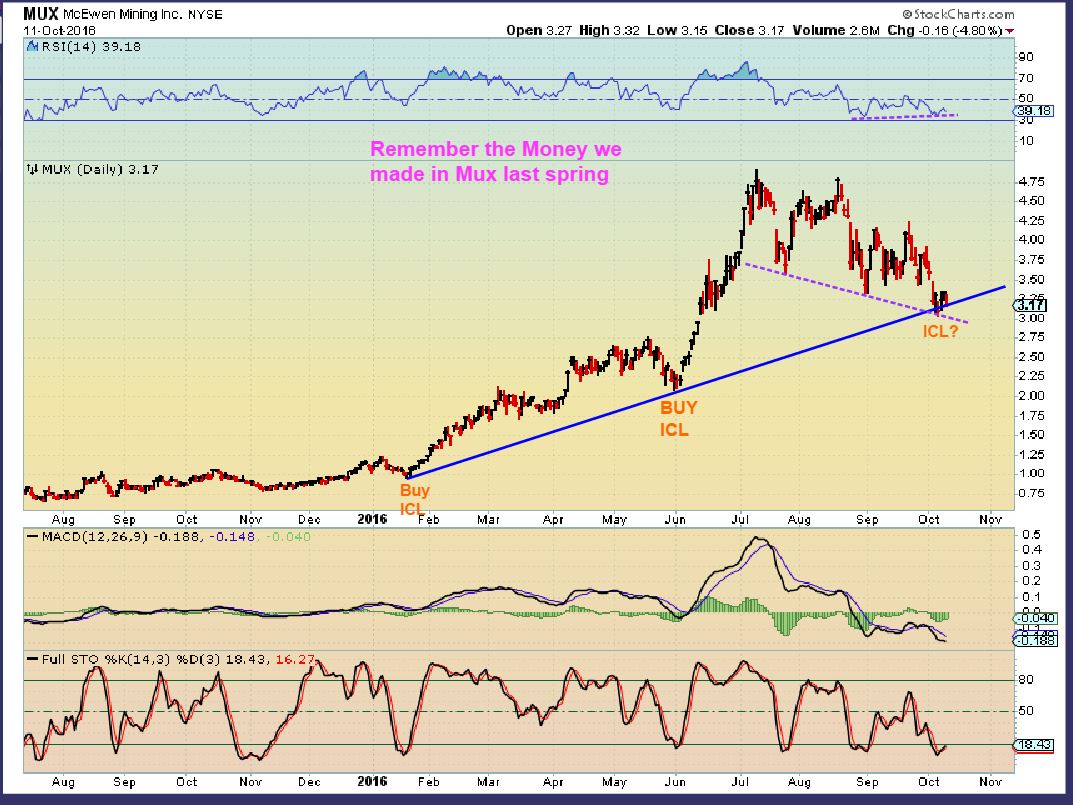
This was MUX on OCT 11th as a Buy, when it looked like the ICL could be in place.
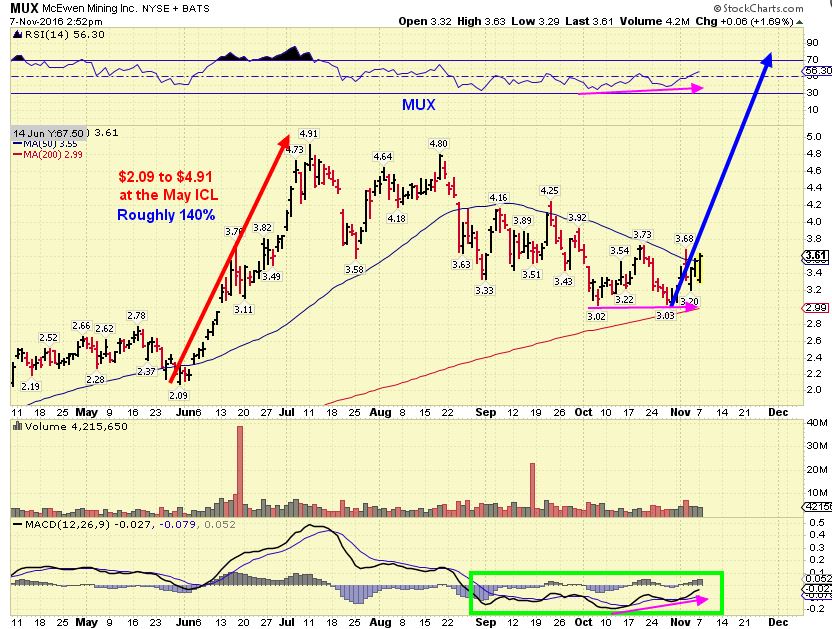
MUX – Mux sold off over 20 cents in the morning, but it moved to green while Gold was still down $25 too.
VGZ OCT 18th – I pointed out these lows and mentioned how this could easily move 100%+. It showed strength and divergence, but could it hold up with Gold smacked down?
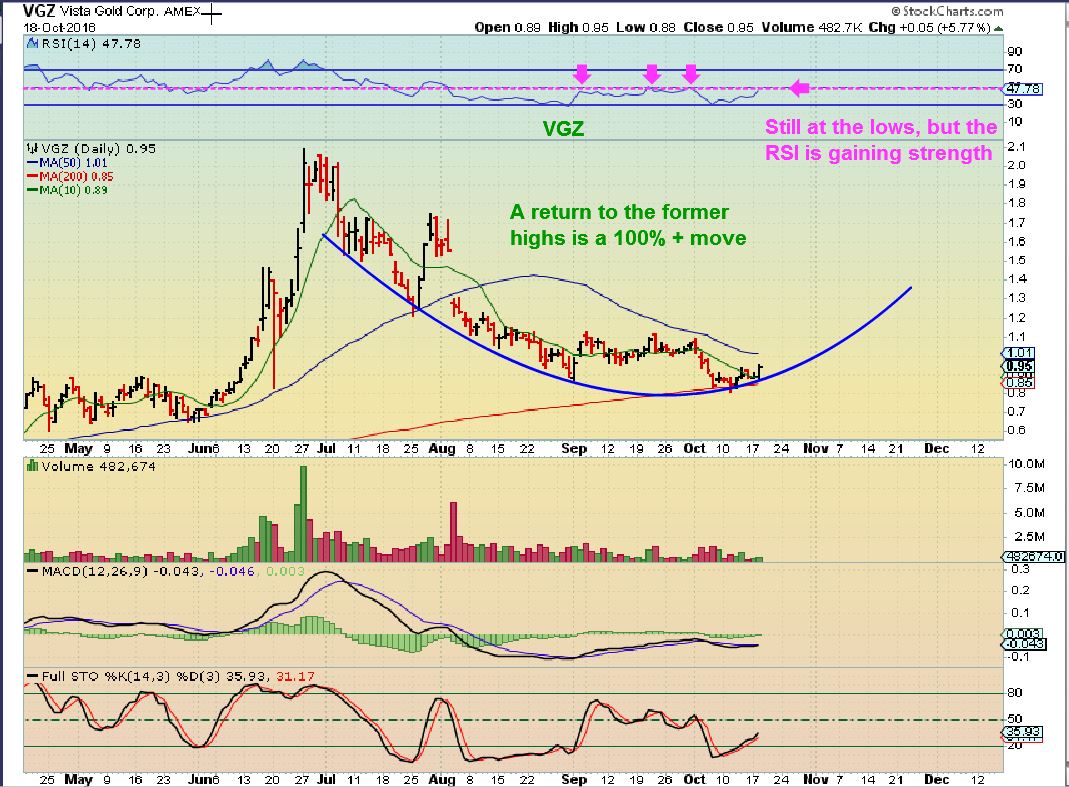
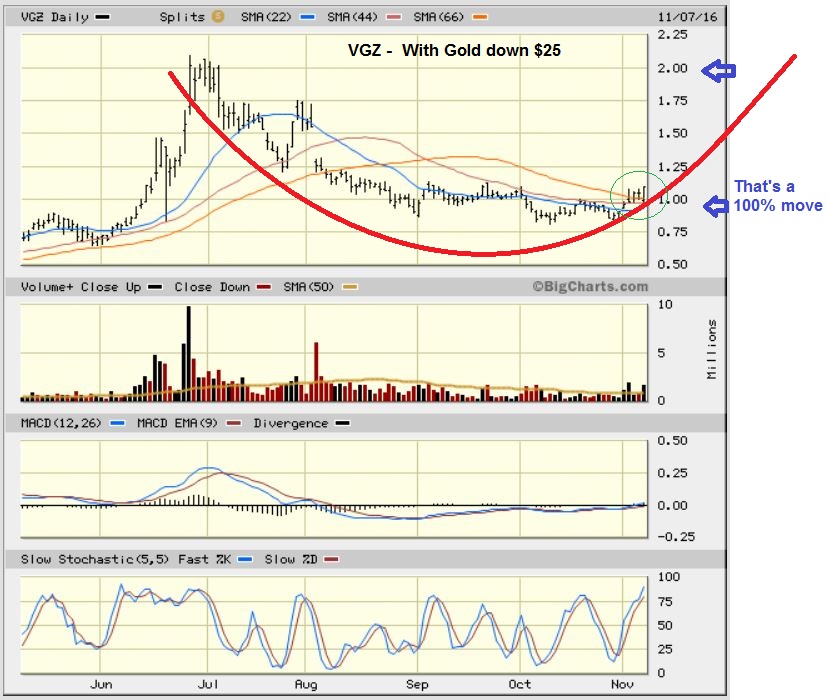
VGZ Monday – VGZ closed up at a price that was near highs for the last 3 or 4 months ( With GOLD DOWN $25). Again, a move to former highs is still about 100% gains.
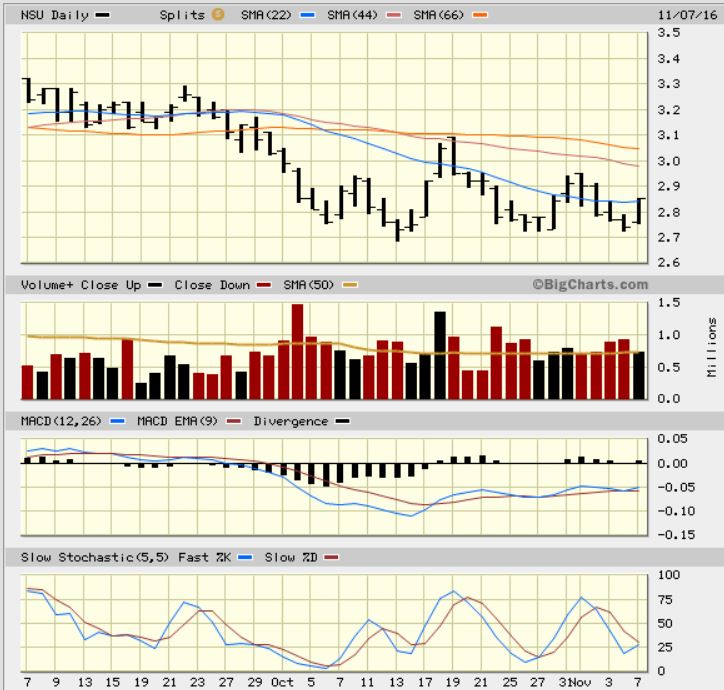
NSU – NSU didnt even sell off Monday, it just went higher with good volume. Yes, while Gold was down $25.
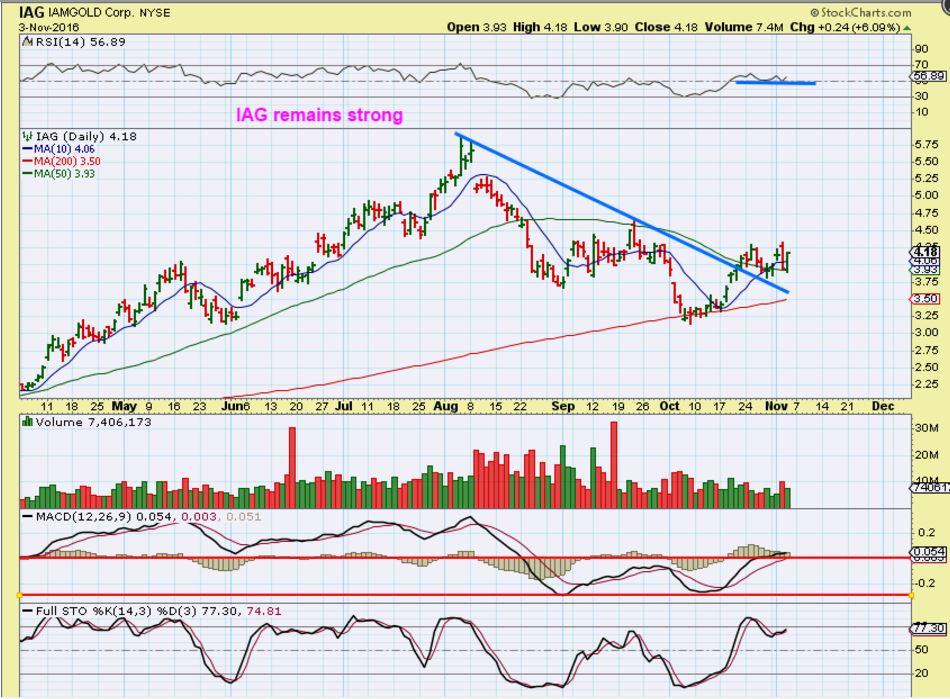
IAG was a buy here near $3 and has been pointed many times along with HL, And a few other stronger Miners. HL closed higher again on Monday too.
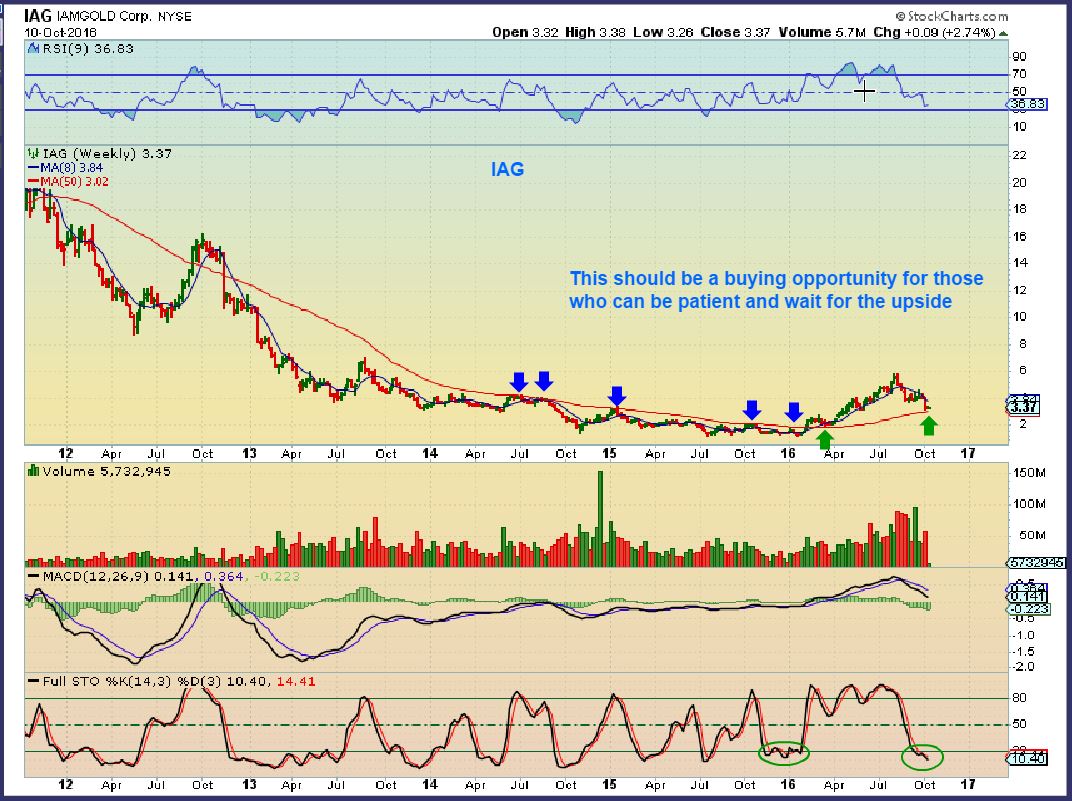
IAG Last week – IAG had broken out and back tested that break out ( Bullish). They released earnings Monday and it looked good in after hours as it shot higher ( With Gold still down $25).
.
Conclusion: Do you see a theme here?
Miners used to get absolutely CRUSHED with Gold down $6-$10, Monday we saw many resisting and even moving higher as Gold got taken down pretty quickly. Miners are releasing their earnings with improved conditions and future outlook remains positive, I assume these are being accumulated. I still read of fear and negativity. Are you accumulating Miners on the dip? Why not re-read the weekend report if you need more confidence. When we have a swing low in place in Gold, I will be pointing out buy set ups in Miners, because that will be a low risk entry. Doesn’t it seems that by that time, many Miners will be higher priced than today though? If what we saw on Monday continues, they will be. When you see Miners do what has been pointed out in this report, you can ignore the fear and buy the dips. The safest way to do this is to Keep a stop in place, hold a small basket of Miners in case 1 has a bad day, and start with smaller positions, adding on the dips.
IF you were with me in early October when I said that I felt the ICL was in place and showed so many of these chart set ups ( IAG, HL, NEM, VGZ, MUX, AG, GPL, etc), you may have started that small basket of positions. Those stocks lows have not been taken out on this dip, in some cases they’re not even close to the lows. That means that you should still be positioned, and THIS is the ‘add to your positions on a dip’ type of pullback. After the election results and possibly a strong form of volatility, I’ll be able to point out various trade set up further. That volatility MIGHT be to the upside though, because no one believes that that is possible. I added to my current positions of GPL, AUMN, VGZ , and MUX yesterday after they began to act correctly.
.
~ALEX
P.S. Remember the bullish set up on Copper That I pointed out last week?
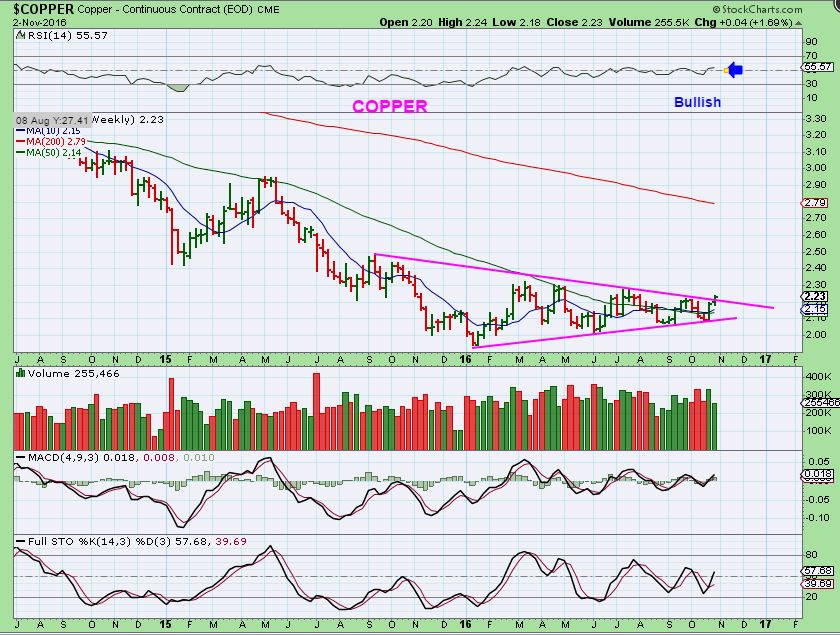
What a strong move higher. I am thinking that GOLD will look like this when it finishes it’s drop too.
As a visual : Do you think this would have been easy to buy in Mid October after that big 1 day drop? It dropped slowly for another week, and then took off upside. That may be similar to what you are seeing with the sell off in Gold now. Gold may do the same after the election week follies are behind us. As stated before, I believe Golds ICL is in place.


Thanks, Alex – Fabulous report!
Great job of covering the hints as well as the big picture that we need to watch
It still gives me “Confidence” from the weekend report that we can use the Oct. lows as a Line in the Sand
(hmmm, I’m mixing Alexandrian metaphors)
IAG up 9+%. Nice call Alex.
That was one report I was wading through and it looked good to me…but I realized how little I know to make that judgement! LOL…but I like when the price goes up!
I spend zero time reading about earnings. Earnings ARE important, but they should be (but may not be) reflected in price. The charts should tell all in theory. Alex can read the charts. Do you use a charting program? If not, that would help a lot.
Thanks for your answer. I do have availability of charts with my brokerage account. I followed Alex for about 4 years when he commented on other sites and he is the only subscription I have ever taken…I have had very good success with him…but have made some errors too. Sometimes I want to not just trade in/out, but keep some stocks longer term and have learned the hard way that I need to know some data about the fundamentals too [bankruptcy]. Just am trying to get what others look at on a quick review of a report.
We all make errors, that’s part of this game. I use the TC2000 charting program. It may help you if you have the time to use it. If you are working full time, you still could use it if you have some free time. A very similar free program is freestockcharts.com . Play around with that when you have time.
lucky you to find a service like CF and stick to it without distraction.
long term ? I wouldn’t pick miners. I would look for something people need good times and bad. so for example people have kids and kids eat cereal. look at general mills GIS pretty good up trend since forever and it pays a dividend. maybe a 20% trailing stop just in case.
Thanks Fred. I have some basic stocks. My Mom was a believer in pipelines. But, I am heavily into miners and I like the mining game itself so am looking for how to pick out what is important in their reports. There are some I will just trade in/out…but others are stronger , or have mines about to come online, or are buyout targets…so I want to know more to get myself set up with which I will dump for a profit and which I might want to keep some in a core…like a lotto ticket.
Help please. I have been reading earnings reports and am overwhelmed. Do any of you have suggestions as to what are the most important things to look at in deciding the strength of a company and its value? Mining has so many aspects…more than just production and debt load…. like resources and which category they are in. Hedging. What mines are coming online and what is being hampered by permitting. Drill results. If you want a quick look….what do you look at and how do you know if it is a good report or not? Thanks.
Hi Nancy
A lot of the information you need is available at http://www.morningstar.com/stocks/xnys/mux/quote.html. I look at Price to Book which should be at least in line with or better than Industry Average as well as Nett margin%. You can see Assets and Liabilities, Shareholder equity and Cash Flow etc from a quick glance. Next stop is Google ‘MUX Earnings’ (or go straight to Nasdaq.com Earnings Calendar) and you get the last EPS Vs Market expectations as well as the next expected reporting date. And then take CF recommendation as his chart reading has a much better hit rate than the Wall St recommendations on Morning Star.
Great ideas thanks. I have several sites I check for earnings but will look at Morningstar also.
SGY
REN too. I picked it off in the pre-market at 22.29 on news of a shelf offering.
Hey R.B.
You always have some good commentary about reading the earnings reports. Anything specific that you focus on with Miners .
It’s tough because if they have debt or low cash flow, they may do a secondary out of no where, but Nancy was asking below about reports and what others look for.
I basically just look for improvement ( increase production or earnings) when coming out of a bear market, I like to see good cash on hand and low or no debt. It’s odd though in this sector, sometimes the biggest %-Gainers are explorers ( Making no money, but finding property with reserves, etc.).
Thanks for the input Alex.
I use Marketsmith – there is a ton of data available right on their chart once you learn how to read it.
But for a down and dirty I like to go right to the 10Q (most recent Quarterly Financial Statement) for true GAAP numbers. Don’t get messed up in their presentations or the MD&A (managements discussion) because they are allowed to stretch the truth.
It only takes me a few minutes to find out what I need but it would take a long time to explain it here.
But here is one nugget of where I start and might help Nancy a bit.
I look first of all at the Balance Sheet to find out if they have money to pay their bills. If they don’t then it means the market is going to take a dim view of them, and it also means they will be looking to do a financing soon, or maybe they are on their way to bankruptcy.
So go to the Balance Sheet and look at up the Current Assets and then at the Current Liabilities.
Do they have more money owing immediately than they have cash to pay?
You can get a Current Ratio by Dividing Current Assets by Current Liabilities and it should be above 1. But upwards of 2 is better. In other words if they have $100 in money owing to others right now, then a healthy company should have $150 to $200 in the bank to pay the bills.
Then look at the Long Term debt – are they drowning in it?
Then look at Retained Earnings/Deficit. Are they carrying a huge loss from years of being a pathetic business?
There is a ton more to look at with earnings etc, but when we are playing these penny stocks a lot of the fundamentals are not known to the public, so if you can read a chart like Alex, he can tell you a lot about a company that is not disclosed.
This was a great reply. I admit the GAAP/ nonGAAP numbers are over my head! They usually show the current Q contrasted with the prior year same Q…is that a good look , or not really? How about guidance?
Is it usually a bad sign if the lower it?
non- GAAP just means they are allowed to describe their businesses in ways that are in addition to the “official” accounting language used in the SEC documents. It gives management a way to show investors in more descriptive terms what is going on. There is nothing standard in them so they can be a bit distracting. That along with the fact that some managers are a bit less than honest at times.
WHAAAAAAAAAAAAAAAAT!! Less than honest in their reporting?? never may that be – lol.
You see them reporting great things and then the insider selling increases : )
Exactly !!! 🙂
oh yea. TGD used a number in their 10Q last week that was far from honest and the result was that they reported a significant earnings increase, when the truth was not so. Will they get taken to task for it? I don’t know, but it happens all the time. Does the market care? Who knows but TGD is trading flat while others are running.
In this case I hope the market does not care as I hold quite a little pile of that!
LOL and another good hint to check insider buying/selling sometimes.
Great explanation. Thanks
Just as a sidenote: Many of these Miners under $1 are not technically “Penny Stocks”.
They can be listed stocks on the AMEX or NYSE under $1 and they have to report the financials.
A “Penny Stock” like OTC stocks do not have to report honest financials to the SEC, and can hide their operations. so I just want readers to know that when we are discussing Miners under $1 – they can be listed and do have to report financials.
See 2 attached charts
.
https://uploads.disquscdn.com/images/c025155ee281269bd87aaaa420706da448d7ed6cb0d01f7d782c89e2aaa6f66e.jpg https://uploads.disquscdn.com/images/b7a0fe7ed991394de5c03f46790e8f0725bef826585ddf144e49b7bc430f84f2.jpg
I did not know that …thanks
We talked about that one last week if I remember correctly……
Silver just took off , but some silver Miners seem to be lagging the action a bit.
MUX trying to break above 50. I just added on pullback.
Yes, I added on the pull back yesterday. I think that it’ll be able to get above that 50sma soon.
The set up looks good.
MGNA…….have we forgotten this one? Starter position filled.
Net Margins are terrible though fyi…….
If you really mean MGNA, I’ve forgotten all about it.
If you mean MNGA., oh yes, I remember that : )
Lets hope you typed it in correctly when you bought it – lol
Magne Gas Corp. is what I have been watching ….. that was in a Report a week or so ago correct ?
Oh I see lol……..sorry bad symbol…..you were all over it !!
Thats because I looked it up as you spelled it and thought, ” I would never buy this thinly traded jumping bean ” – LOL
Sorry lol…… 🙂
AG is popping up.
Very nice earning reports from IAG and HL today. Imagine when good really takes off.
I am on a theme today…I thought those reports looked good too…what made you think so?
The stocks both reacted very well.
HBM is still going. Can’t get a pullback. 🙁
I am getting many metal buy alerts and JNUG is up 7+%. Nice.
I think You jinxed it? I see it up only 2%.
CUM.TO has shot up 14.89% higher than yesterday, on heavy volume. I, unfortunately don’t have any. 🙁
Very nice Rob.
I think this all bodes well for FCX and TGD too . ( And HBM as we’ve already seen)
That has to be one of Maria’s favorite tickers!
lol.. HE brought it to my attention….
So far looks like GDX just did an overhead gap fill ( Shows up easily on a 5 minute chart)
Must have been some sort of pro-Trump rumor that was quickly debunked.
alex- any thoughts on agi? went from a leader to a serious lagger? ty
It looks good on a long & short term chart.
Especially the long term where it went roughly from $2 to $10, back to $7. The year to dat chart is great.
On a daily 6 month it is consolidating, and the macd is climbing each time it tags the $7 area, so I think it is fine and just waiting for gold instead of leading the way higher this time.
VRX getting hit again…….
Check it out on a 1 yr chart. Broke below the base on large volume ( Could be capitulation or they’re just throwing it away for good.
I heard a few days ago that they were considering selling one of their main drugs to raise cash so?….that stock was at 269 in 2015 unreal. My question is how much “value” do any of their drugs still have?
RM- same thing with RIC? ty
Bought that dip again below $8 on AG …..fingers crossed!
I added on the MUX dip
EGI just rocketed up:)
FSM seemed to have a really good report yesterday – production up, revenues up, costs down…hoping it will take off after this kind of up and down election see saw….
TRQ does NOT care that Gold got hit. Thats a nbice looking break from a base
EGI is popping,
IAG & HL as mentioned by others.
And has anyone looked at that chart of NRP since June? New YTD highs
Interesting enough there is a relation between TRQ and EGI. It seems Sandstorm Gold, Rio Tinto and Turquoise Hill are major shareholders of Entrée, holding approximately 15%, 11% and 9% of issued and outstanding shares, respectively.
we got our DCL in Gold. (shaking the last gold peeps).
right on Alex’s target too. Brilliant.
LeChiffre, you are looking at what chart? Thanks:)
Look up on the report above his GOLD chart. he’s looking for a DCL.
JNUG is trading at a discount compared to 3xGDXJ – and JDST is at a premium
Looks like folks are expecting, or at least preparing for, a drop
The last 1/2 hour of trading should be interesting
Well, Just to clarify for the conservative ones.
Gold made a
lower low today and we do want to see that. Next we would want to see
gold move higher tomorrow or later in the week to put a swing low in
place. Then it is confirmed when it moves higher.
So even though
we have our Lower gold price for a new low on day 22 ( And Miners are
making it look like they do not want to sell off much more. They seem
to be under accumulation), Gold COULD drop tomorrow and Thursday and
Friday and still be normal. That would only be day 25.
So it looks good in many ways , and the slightly lower low today helps, we do not have an actual dcl ( Daily cycles low) confirmed yet. A lower low could still be ahead.
Thank for that – appreciate it!
When we do, I gonna ADD!
Alex, what do you think of charts of EXK and AXU? I have losses in those right now so was thinking I’d add to average down……would you think this is a good point to do so or maybe wait and see if they drop a little more? I know that’s probably somewhat subjective..but…wanted to get your thoughts 🙂 🙂
If you already have a position in them, I’d personally wait and see what happens Post election. If Gold & SIlver decide to drop into a DCL for the rest of the week, they could go to the bottom of the recent consolidations
I’m in EXK and I love the chart. Maybe early to add but hang in there, Tammie. We’re going places shortly!
Thanks! I sure hope so! I have so many that I bought at the wrong time (actually had most of them at a GOOD time,then sold, got back in…..shouldn’t have sold to begin with….)…so this time I’m holding on…..the majority of my holdings right now are red….and I can’t help but think if I’d just not sold and bought back I’d be in such better shape…..I’ll get it right one day! https://uploads.disquscdn.com/images/7bd3fff54dbf19073cc6361d0ba5864acffe2e22ec176ea2b518b2ab3a8e901c.png
I’m gone for the day, have a great one!
Tomorrow could get “interesting”
No Bill or Maria today.
have fun! god help us
here’s some ‘magic dust’ :o)
https://uploads.disquscdn.com/images/18a04115490ac9f6407dd1b44627ea65186b762317db41dd1394230d8375599b.gif
love it. Thank you Maria. Much appreciated.
😀 my pleasure Frenchie ….;)
…may all of our investments far exceed our expectations…
That certainly hasn’t happened yet. 🙁
Well, this is the best part of my day so far…
Thanks, Alex
im here in spirit 😉
just holding my swings… HBM = well exceeding my exceptions…. go figure.
*giggle
First tranche added
https://uploads.disquscdn.com/images/c3495c718a2bd83cfe187cf7afc0c54ecdce33546e58e88dd5c427cfe2ab358d.png
Where are you charting this? I have nat gas at 2.61, same 200 day though. Would like to catch move higher but have trouble finding where I can chart real time on this. thanks!
your chart intrigued me. Are you sure your 200MA is correct. My 200MA is at $2.448 https://uploads.disquscdn.com/images/55dc6ee7925d65466c9cbabb113445c194bfb45abb908a3ee1d50b5e0c9b612a.png
that’s where his chart shows nat gas is (2.447) but I have Dec contract at 2.61 close today
I use NatGasUsd which is NatGas spot.
What the hell happened to gas today? Seriously?! Wow!
Man, this first daily cycle sure SUCKED! I am sure the 2nd will be better. Let’s go!
Are you guys watching this?? What the heck?!!! Thin trading, hope we get this all sorted out by morning. This is absolutely nuts!!
Yes, I just took a break from what I was doing to check gold price….last time I looked it was down $1.40….now up $38…!! So I jumped up to go see what’s up…..DOW futures down 500 points….
https://uploads.disquscdn.com/images/2b7a62e4b52c37d0b06886691e68ef15d905094d88026cc0e1bf1e94041401b6.png
https://uploads.disquscdn.com/images/a8364e4668fecd0a187d9b303a1bbe2f8c30573d588fae814c563f5ac4c3f589.png
DOW futures down 750 now….!!!!!
So maybe that marijuana stock I bought yesterday might not have been such a great idea….! 🙂 If it goes down with the market…unless all the marijuana legislation gets passed in those states that were voting on it….I’ll have to go see where that stands…
If only you could smoke the stock right now. Then everything might make sense!
lol
CNBC Headline- FLA approves medical marijuana! You have a chance!
https://uploads.disquscdn.com/images/e8d15d75e35cd0e7f83472f18d780334d4dd78f0df2110829ecd2d775f6bde84.png
Gold is fun but my ACTUAL retirement is tied up in real US equities. Thank goodness for the long term approach (this will all fade soon enough)
Always glad to have abother night Ranger on the CF Board since BH quits at 3 PM everyday.
https://uploads.disquscdn.com/images/54118fc9c21e3f43f21b63f56a2b43cff9e72b58663b54cb4caaadab88395ca6.png
I love this exchange between CF night owls! Funny cartoons.
Thanks Trump!
I just ignored all the noise before the election. Alex’s outlook is good, I think gold would have jumped no matter who won the election.
Seriously, I wanted to sell (not core, trades only) and go short today (only a hedge not a big short), but Alex made sense. There is a reason that dude is writing the reports and not me!!!!!
wtf? I guess this is what they call volatility!! this is like brevet but only the american version! The only way it could have been better is if MUX reported on Nov 9th with blow out earnings! oh well…
Gold futures just broke +$50 .. trying to remember what the jump was for Brexit ..,,
looks like gold went from 1260 to 1370 right away after Brexit vote…then after that it gravitated up to 1383 or so…..yep, I should have gotten JNUG today!!!
Have to say this is the first election where I have watched the electoral college votes and the gold futures price at the same time…
Surreal.
8% per CNBC, have current article linked under gold futures. See ya’ll in the AM. New post out.