
Leaving Bias At The Door
Whenever we are examining the markets, we really need to try to leave any ‘Bias’ that we may have aside to see things clearly. That doesn’t mean you have to just accept how things look at a glance, however. Dig in, do research, and find the underlying factors that are there. I have done very well investing in a way that is contrary to what others are seeing and posting, so while being objective and leaving bias at the door, let me show you some of the things that I am looking at this weekend.
.
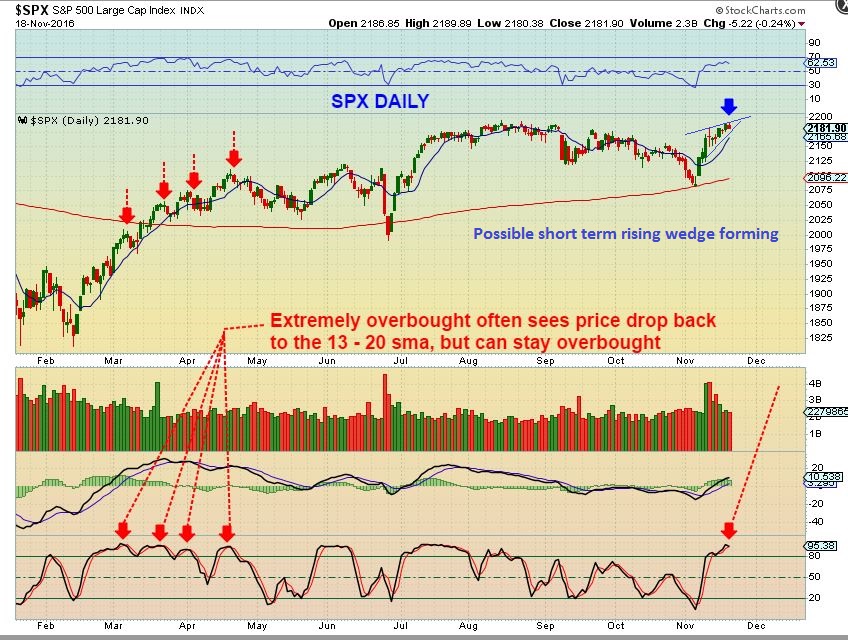
SPX – The SPX is attempting to make a break out to new highs, as the DJIA has. We do see a rising wedge forming, and this usually ends with a pullback. Notice the red arrows and the stochastics on this chart. We should pull back soon.
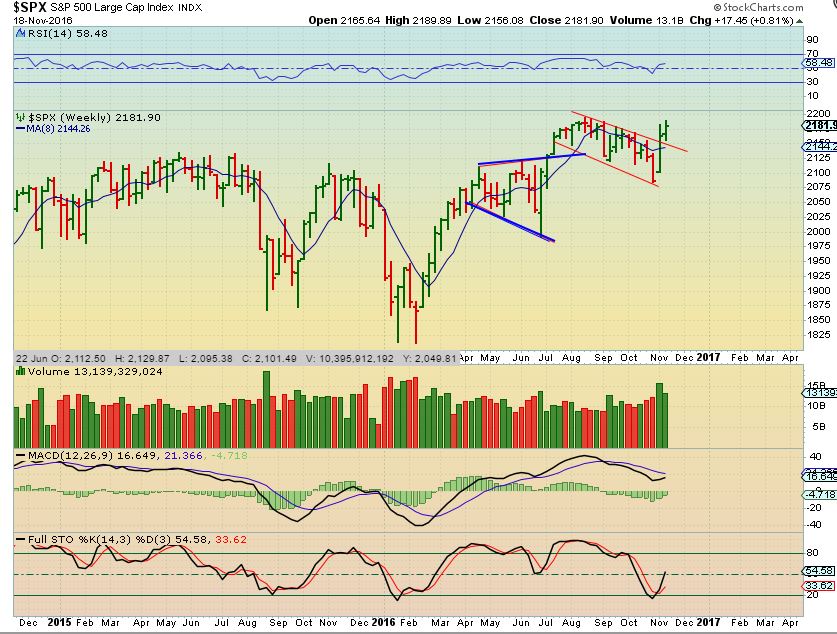
SPX WKLY – A bullish burst from the lows, with great volume as expected. This was a move from an ICL.
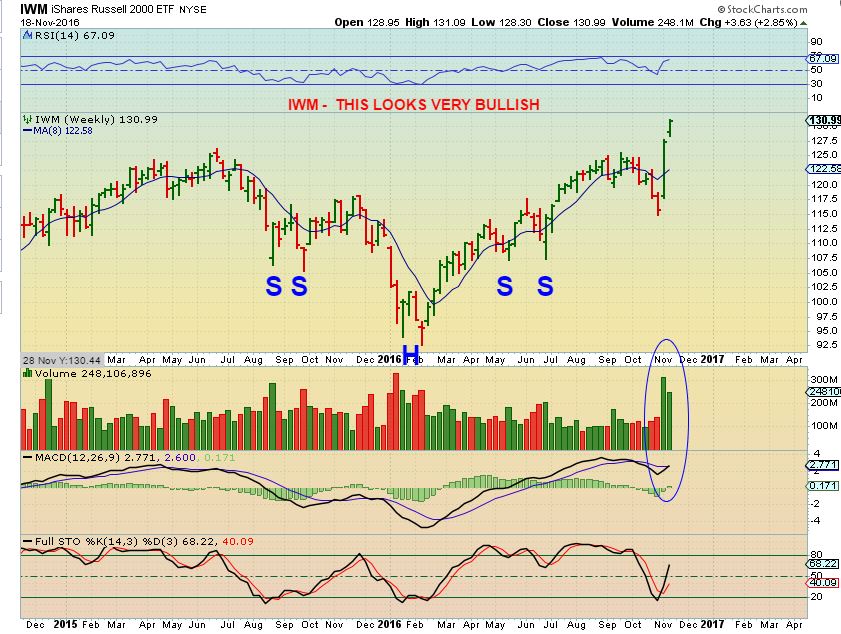
IWM – New highs here too. So far a very good trade out of the ICL.
SPX – I once did a small study on the length of Bull markets. We commonly saw 7 year runs and then a topping process. Even a break to new highs as a Bull Trap. I don’t want to hold a “This must be a Bull Market, it broke to new highs, clear skies ahead!” Bias. I want to be track it as it progresses. This Bull was 7 yrs old, it did have a nice correction into early 2016, but was that enough? Notice this…
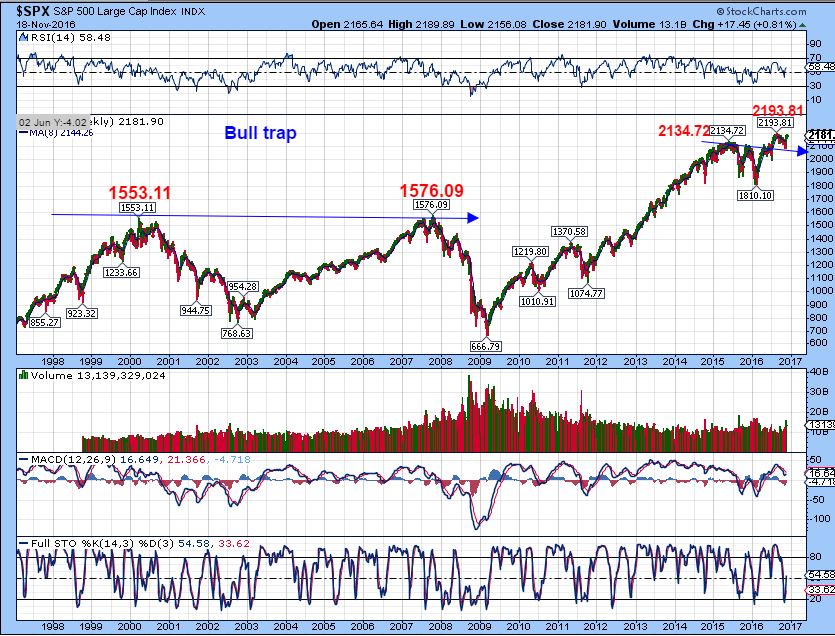
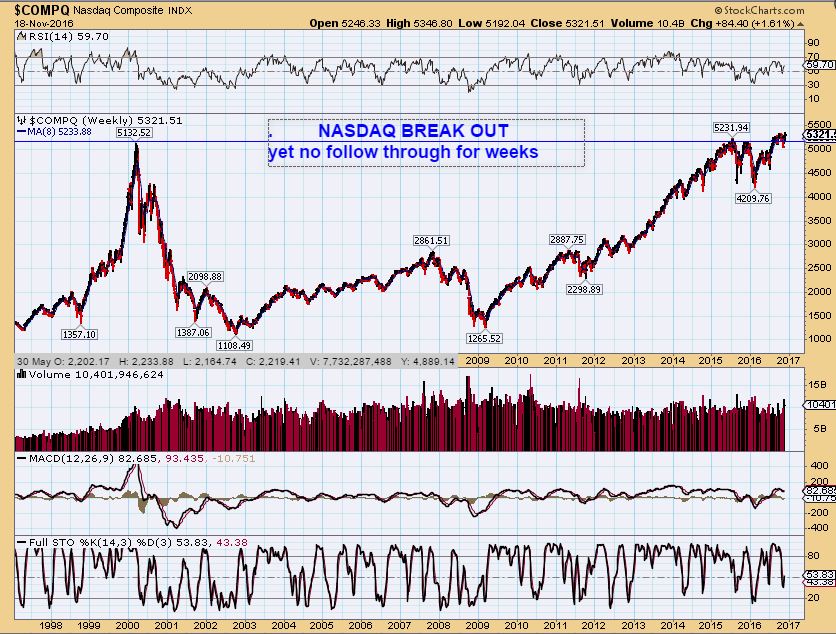
Ever since the NASDAQ broke to new all time highs ‘Clear skies” this past summer , it has stalled and made no further progress. I heard many in the twitter crowd screaming that this will go absolutely parabolic immediately with no overhead resistance. They will Blame it on someone if it doesn’t (Trump?), but maybe the indecision of the markets is what held it back. Maybe the markets will just keep exploding higher. BULL TRAPS do have criteria, I am watching this going forward, so far it has been a good trade out of the ICL.
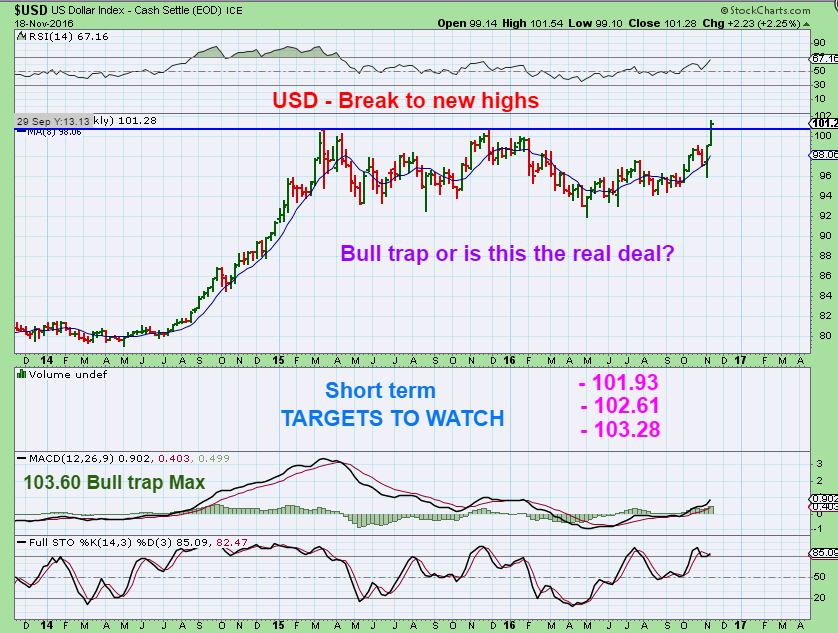
USD – Yes, This USD has been very bullish lately. Could this be a bull trap or the real deal?
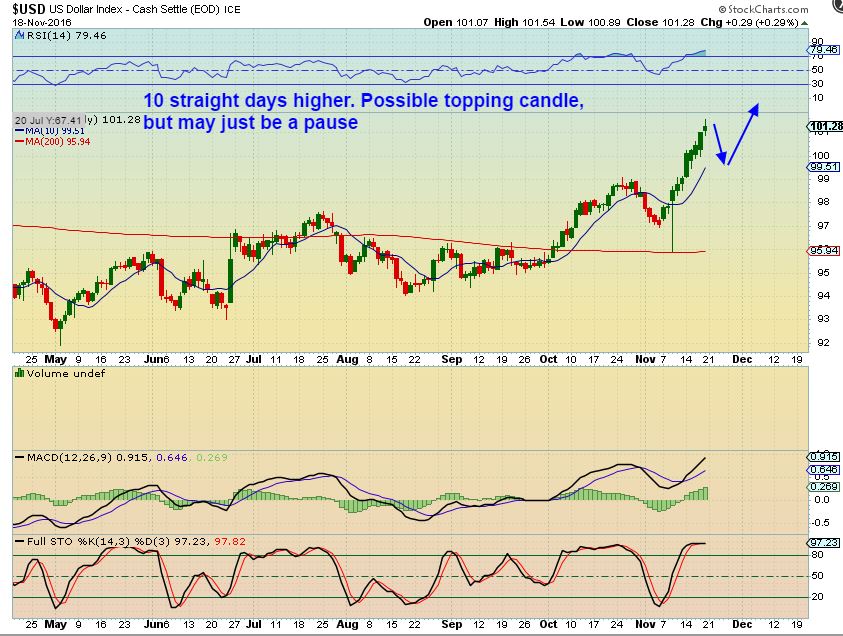
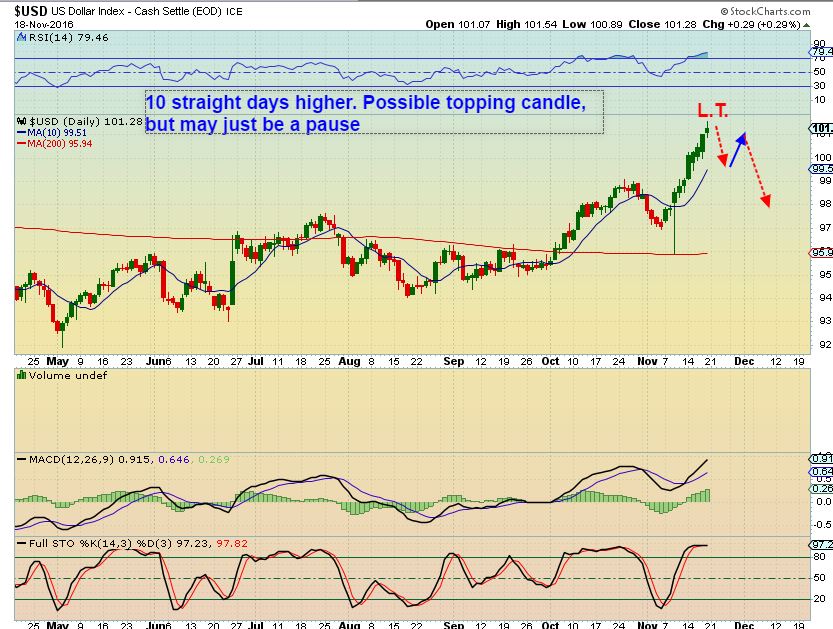
USD – 10 straight days higher, I would expect a pullback sooner than later. MAYBE THEN Gold can do some flying? The question is, will it dip down and then continue higher as shown?
Or will it tire and begin to give up the gains, as shown in this one?
I need to address a bullish looking USD Chart and the implications ( or at least the possibility ) with Gold. I will do that again in the Gold section.
.
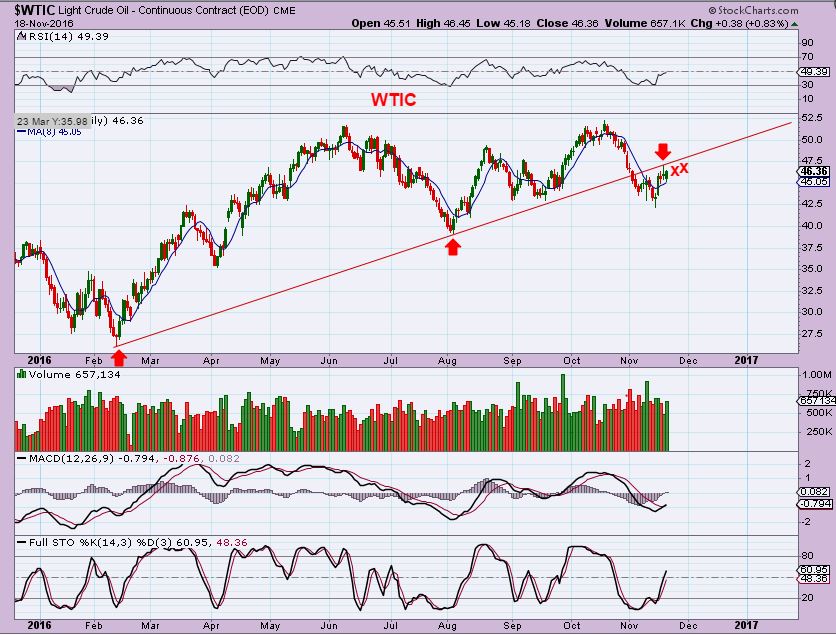
WTIC – Oil is early in it’s new daily cycle. It can continue to climb, but it is also coming due for an ICL in the future and the way that it broke down in Oct/Nov indicates that there is time for a failed daily cycle here. To me, that means that it will eventually roll over Left Translated and break down further. Why will oil break down? OPEC? Supply Glut? I don’t know, but it is set up in a way that I do not expect it to rally to new highs on this run.
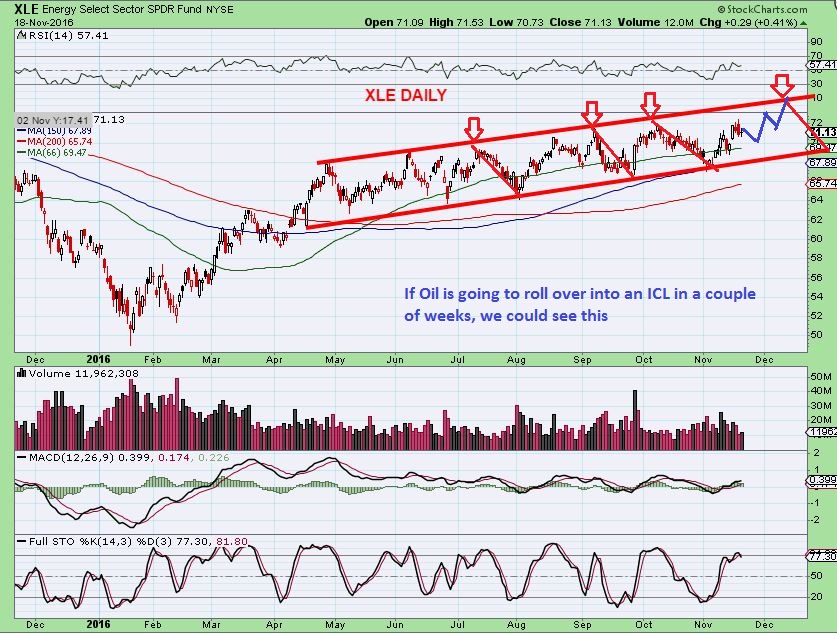
I admit that many individual Energy stocks have ignored Oils recent October slam and sideways drift. The XLE is in an uptrend. If Oil continues higher and then rolls over, this could easily happen. The red dips are common.
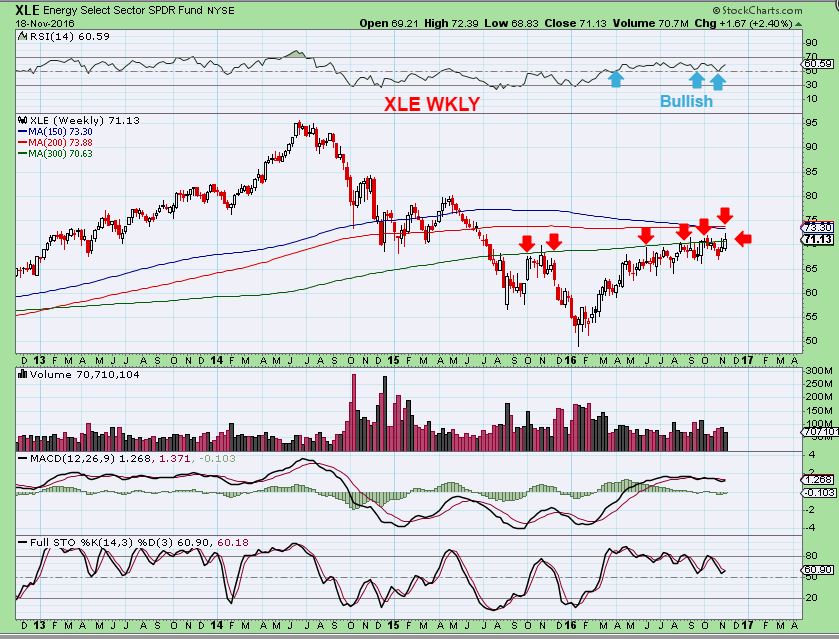
XLE WKLY – If you do not have a Bullish Energy Bias, you may also see it this way. If Oil drops to an ICL, XLE can pull back 38.2% or 50%. XLE has a lot of resistance overhead, but once Oil drops into an ICL and the XLE pulls back, it can get a fresh running start to break out upside.I’m not investing in Energy currently.
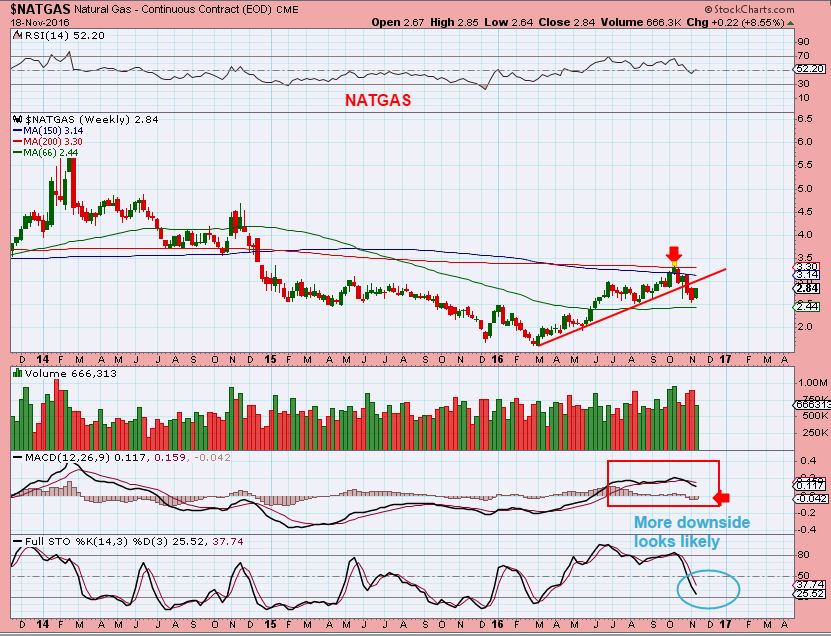
NATGAS – NATGAS had a big pop on Friday, day 7 of a new daily cycle. It has overhead resistance, but may be able to get through it.
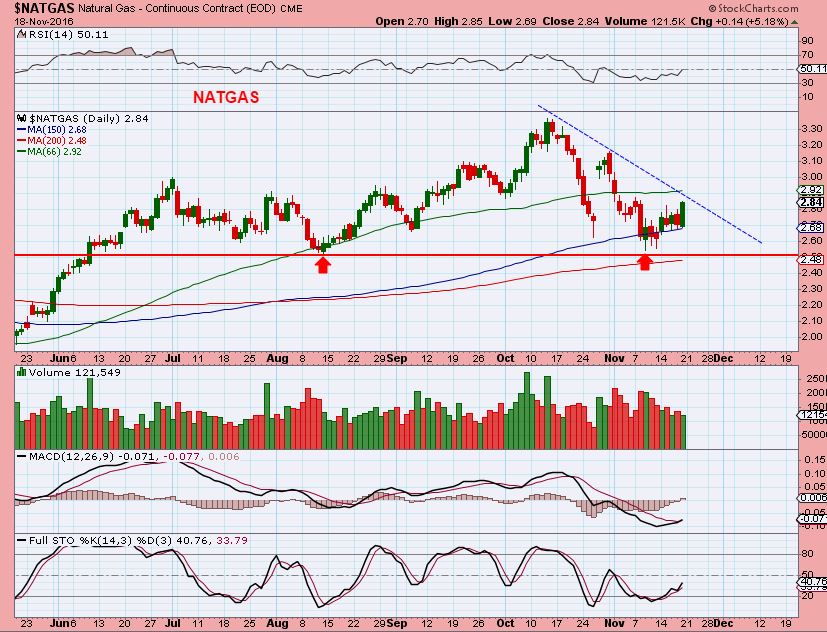
NATGAS WKLY – The bigger picture shows us that NATGAS also broke down from the uptrend and may struggle here too. I see further downside as the likely scenario after this daily cycle peaks.
 .
.
GOLD & MINERS
.
An unbiased opening for this section would go something like this, and it would be an honest one. My personal analyses pointed to Oct lows as being a place that an ICL would form, and those lows should have held. The steep selling after the election broke the lows ( a little bit), but I’m not saying that Oct was an ICL, and it failed early. That would be way too soon for an ICL to fail in my opinion. Instead, it would seem that the intermediate cycle ‘extended’ in its selling, and we should get the ICL anytime now. We need to watch how the future move higher unfolds for any further unbiased analyses. I spent this weekend looking at prior drops in the bull run out of the 2000 lows and 2008 lows. I see differences in all 3, but most noteworthy was the deeper drop with this extended dip, compared to a long sideways consolidation in 2001- 2004. I still think that Oct should have been the normal ICL, but now we have this steeper drop to contend with. We now see a large H&S formation , and that is all I am hearing about. Other news letters have advised removing positions, even going short for a blood bath phase. I am getting emails about those writers, because some of my readers subscribe to several reports.
This unbiased review will ignore everything Bullish or Bearish ‘looking’, and will close by humbly showing a few things that maybe others are overlooking. Let’s just examine some facts found in the charts …
.
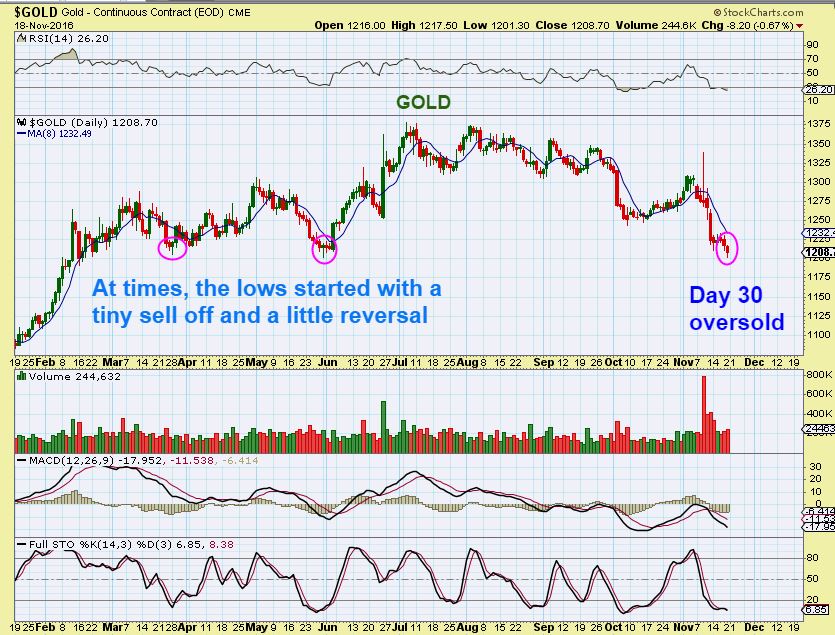
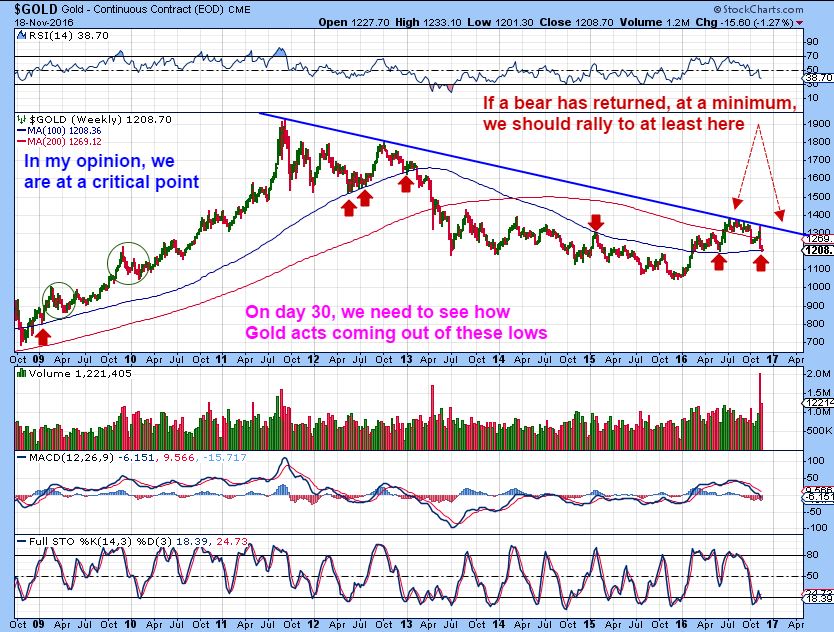
GOLD – I am expecting a DCL ( ICL ) at any day now. Friday was day 30, later on in the cycle timing, and we saw a small reversal candle. Those can act as reversals leaving behind a low. That cycle count is an unbiased fact, but is in itself bullish.
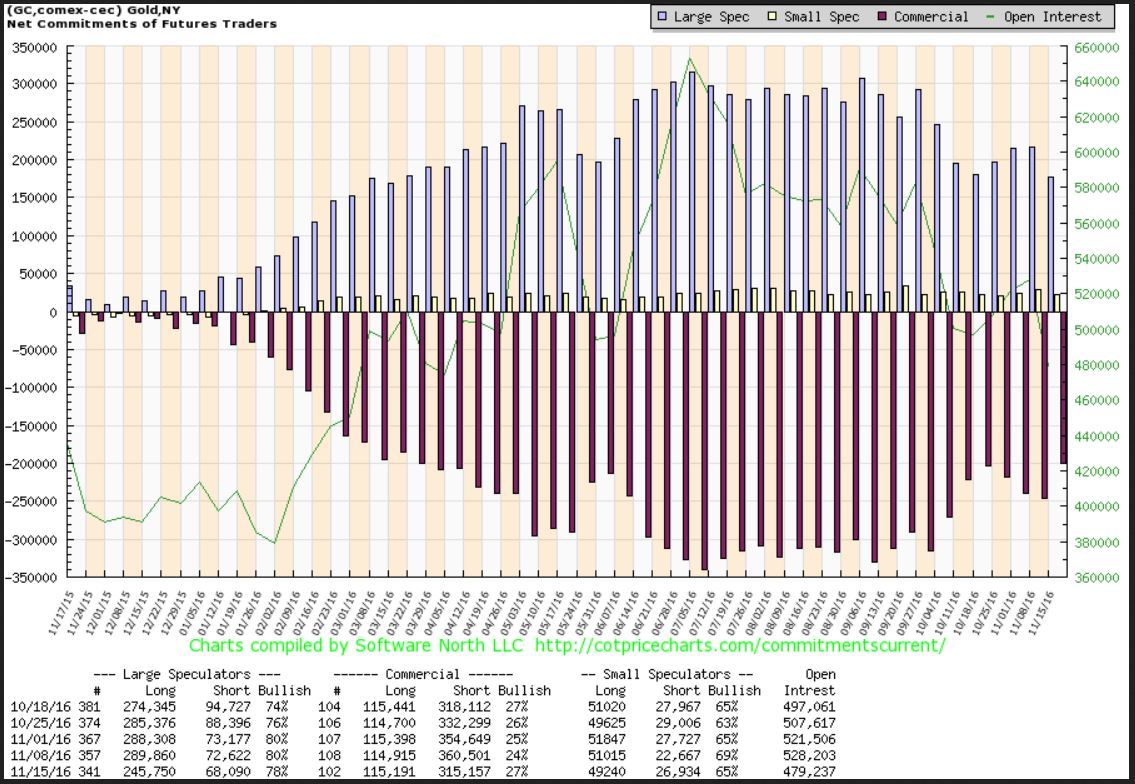
C.O.T. – The reading is better than our ICL in May.
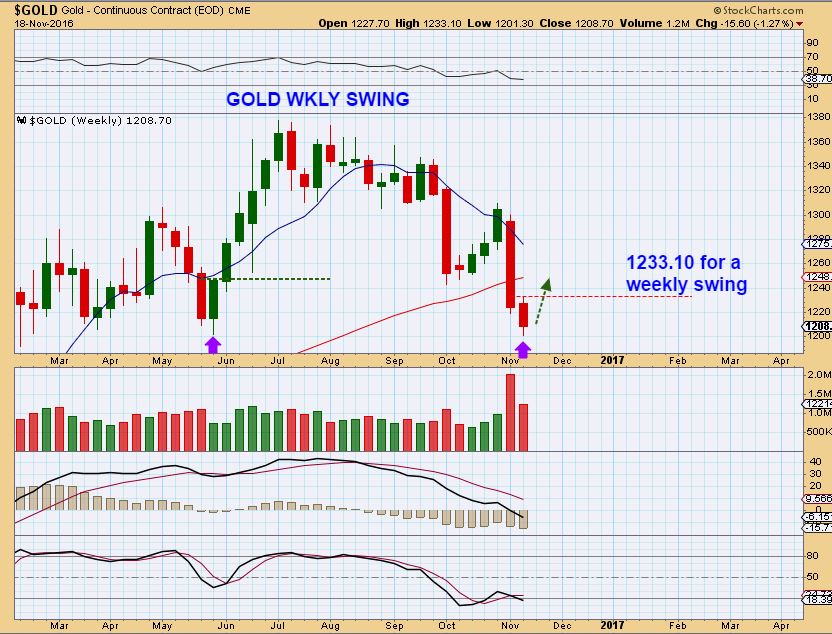
GOLD WKLY – A rise above 1233.10 would also give us a weekly swing low
GOLD – Gold hit major resistance. We should get a rally back to that area soon (Even a bear market rally should get us there). A break out would be extremely bullish in my opinion. Please read the chart. In 2012, it s-l-o-w-l-y rolled over with each new daily cycle into a bear market after breaking the 100sma. We are at the 100sma, I am watching that area, and we are due for an ICL. That is how I unemotionally view this.
I am constantly asked, in fact, this is probably THE MOST ASKED QUESTION, “Can you discuss the Bullish USD and GOLD?” I want to admit, when I look back at that relationship, A bullish USD is way more often than not, Bearish for Gold. So how do I answer that without Bias? I need to look for cases where a Bullish USD didn’t affect Gold that much. Has it happened? At the very least, you then have historical precedence that Gold CAN / COULD / MAYBE go higher with the USD rising too. That said…
.
I will explain these 2 charts again and add a couple more. Here we see that while the USD is at DEC 2015 Highs again, GOLD is NOT at the DEC 2015 Lows. So the strong dollar hasn’t equaled a beaten down Gold.
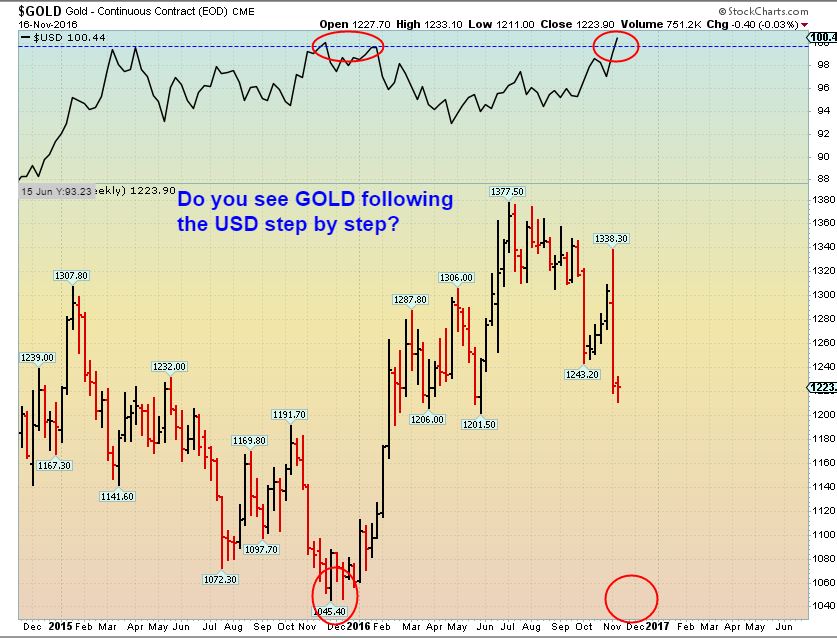
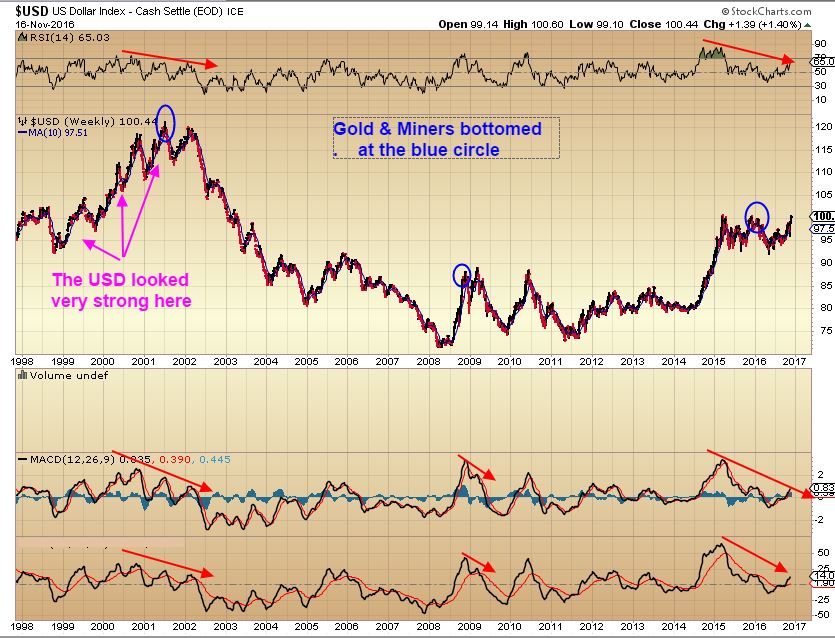
The USD peaked in the past with triple tops. I point out where GOLD bottomed Before the final USD Peak. This chart shows divergence at those tops for the USD too, then and now.
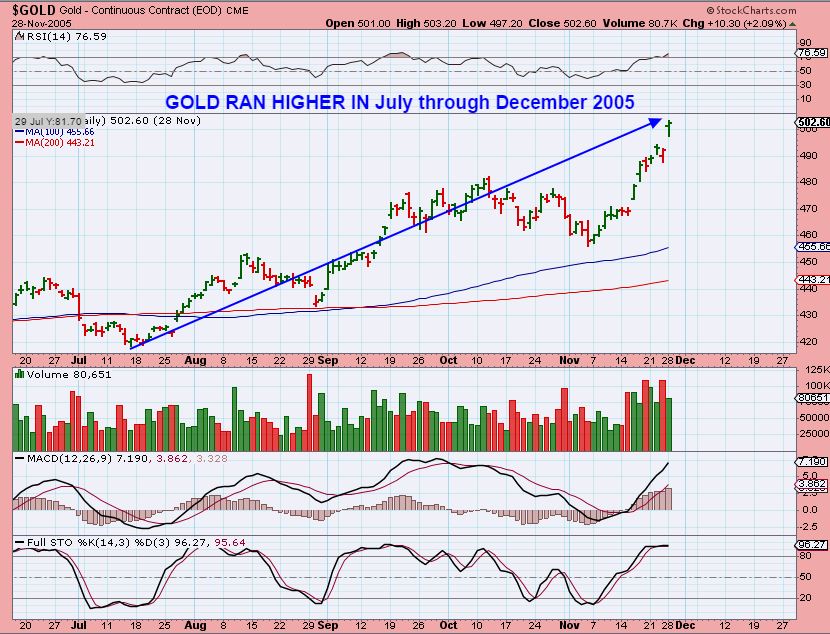
USD – Keep it simple. Look at the chart & then repeat the following sentence 3 times – The USD ran higher in September 2005 ( see chart), then went sideways in October (see chart) , then ran higher again in Nov (see chart).
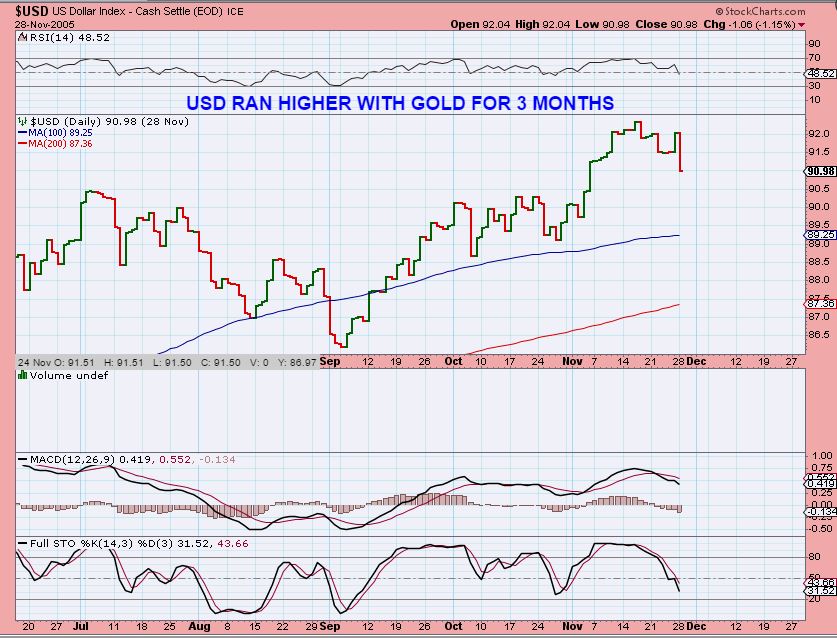
GOLD – Gold ran higher in September 2005, then went sideways, then ran higher in November 2005. So it can and has happened several times in the past. If the USD runs a bit higher next week, Gold can still bottom now.
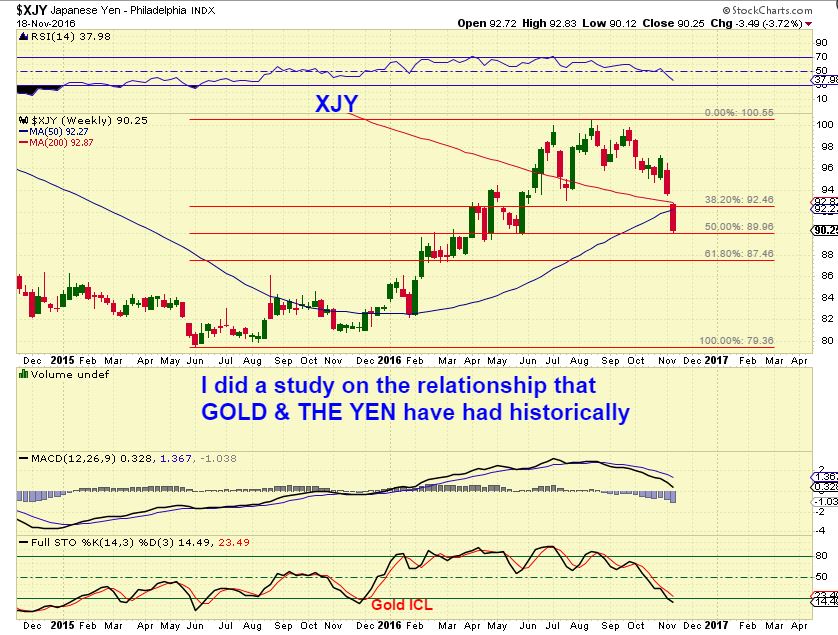
XJY UNBIASED THOUGHT – Landing on the 50% retrace is fine. Breaking those moving averages is a bit concerning and a tad bearish, because this could be how a down trends start. Gold & the Yen have historically been closely linked, so we’ll watch the next move higher in Gold and the Yen. This is noteworthy and concerning at this point, we need to see what happens next.
 .
.
MINERS
.
GDX Chart from Friday report – I was pointing out that the May ICL, GDX did not break to a new low, while GLD did.
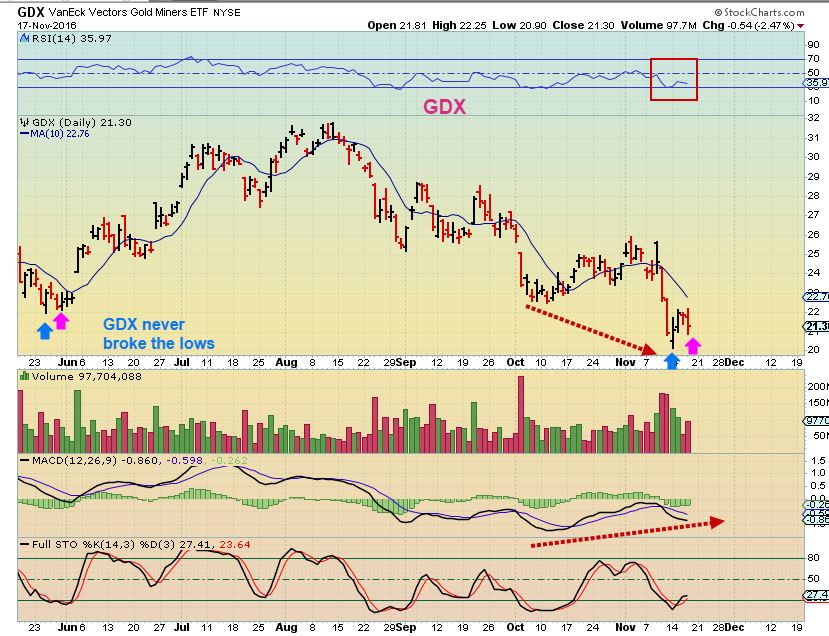
GDX FRIDAY – GDX still held the lows, though Gold sold off further. Read the chart. If we get a bounce to the 50sma or red downtrend line and GDX cannot break out higher, I will be very cautious. One might just lighten up there if things look weak.
This is an Inverted Bullish Hammer. It is often seen at reversals. It is not always ‘strongly reliable’ in just any sell off, but at Day 30 for Gold, I would expect it to be reliable if I saw one on a weekly chart.
I’d expect a reversal next week if I saw this.
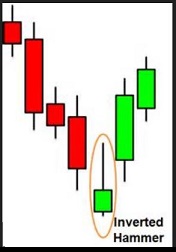
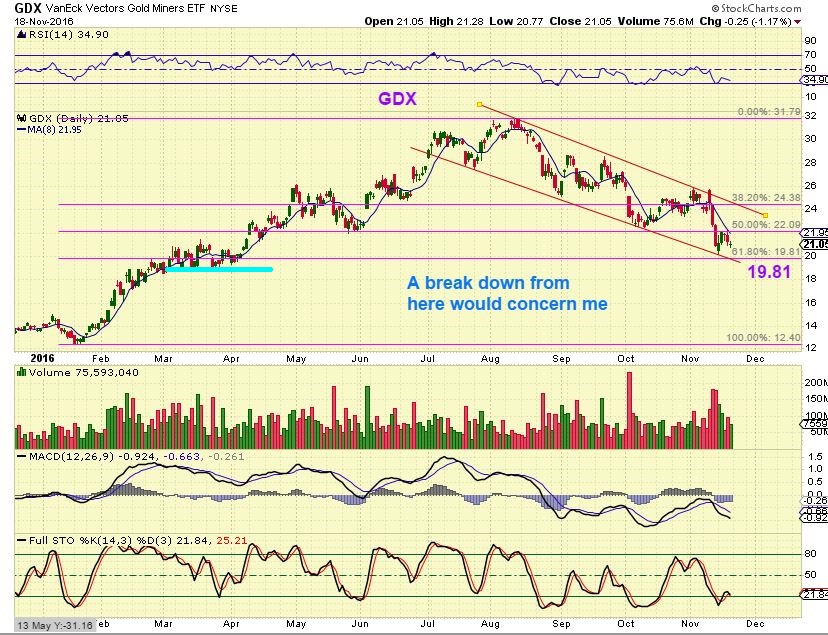
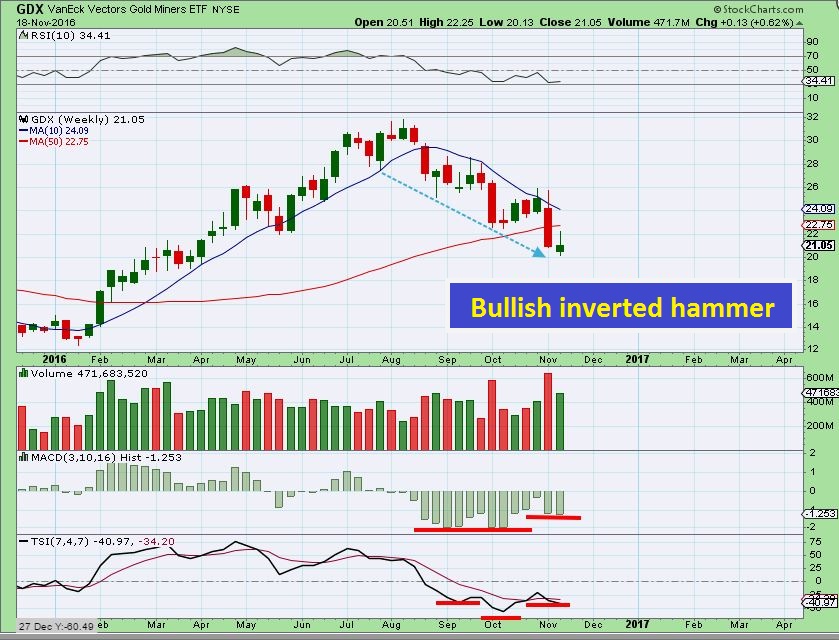
GDX WKLY – I see a Bullish inverted hammer, that is a fact. Next week should close above these lows.
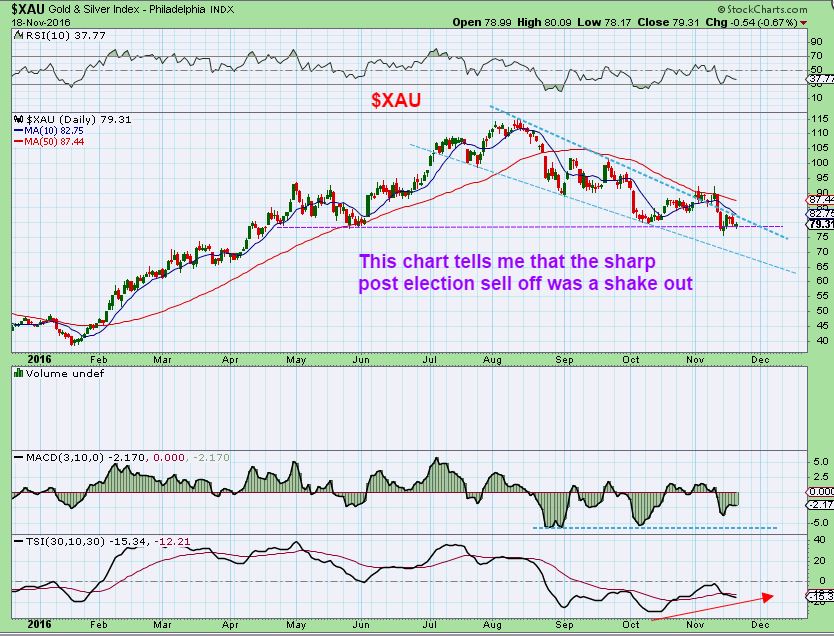
XAU – If you bought the OCT lows thinking it could be an ICL, The XAU is still at the OCT lows, with a slight shake out of both the OCT and May lows. The lower 2 boxes of this chart indicates that the 2nd drop was a false drop, no follow through, a scare tactic. We’ll see, time will tell. The XAU should be able to CLOSE above it’s 50sma on the next run, so I will be watching this for an early clue.
Back to basics, back to ‘Bias’. Am I being Biased? Can I visually see anything Bullish within this sell off?
1. Cycle timing is bullish, we are running out of time for the downside
2. Bullish sentiment, everyone is afraid to death right now
3. I see an inverted Hammer on the weekly GDX chart and
4…
.
I have mentioned a good number of Miners are NOT breaking down and getting trashed in this recent selling off. Isn’t that bullish? Has that changed? Not at this point.
.
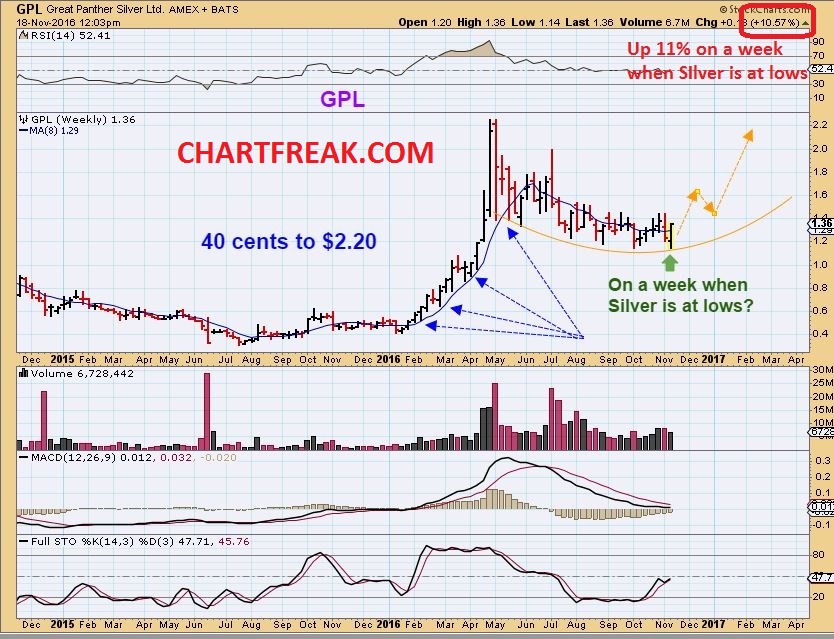
GPL – Silver is at its lows, GPL was up 10.57% this week. Could that be Bullish or am I just biased?
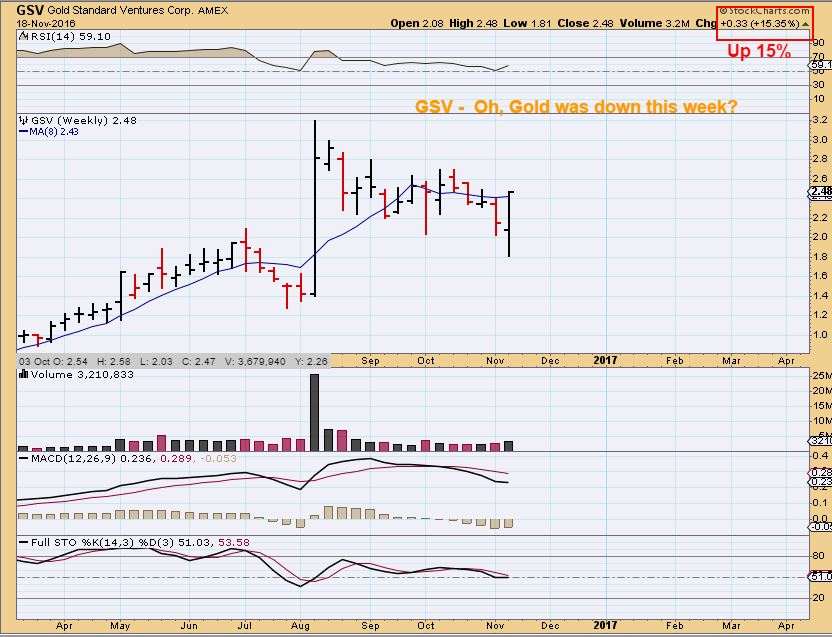
GSV – Gold sold off right into Friday, GSV reversed and shot up Tues, Wed, Thurs, and Friday up 15% for the week that Gold is threatening to dive off a cliff?? Could that be considered Bullish, or am I just biased?
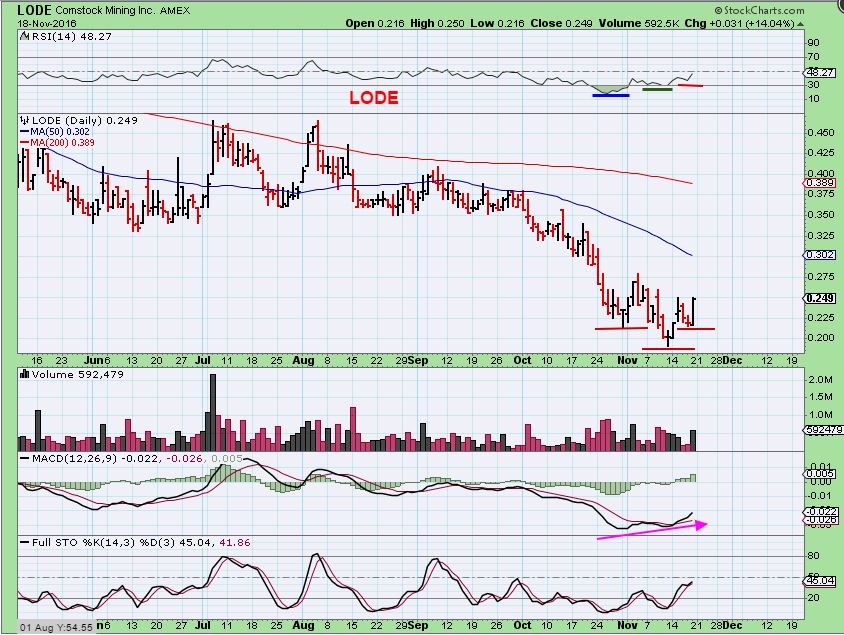
LODE DAILY– This Miner sold off from August to November without mercy. Now that Gold is threatening to break the May lows and dive into the abyss, Lode decides to do this? This daily chart shows sudden strength. Did you know that Lode closed up 22% for the week? While everyone is ready to just throw in the towel and short this market. Was that possibly Bullish or am I just being biased?
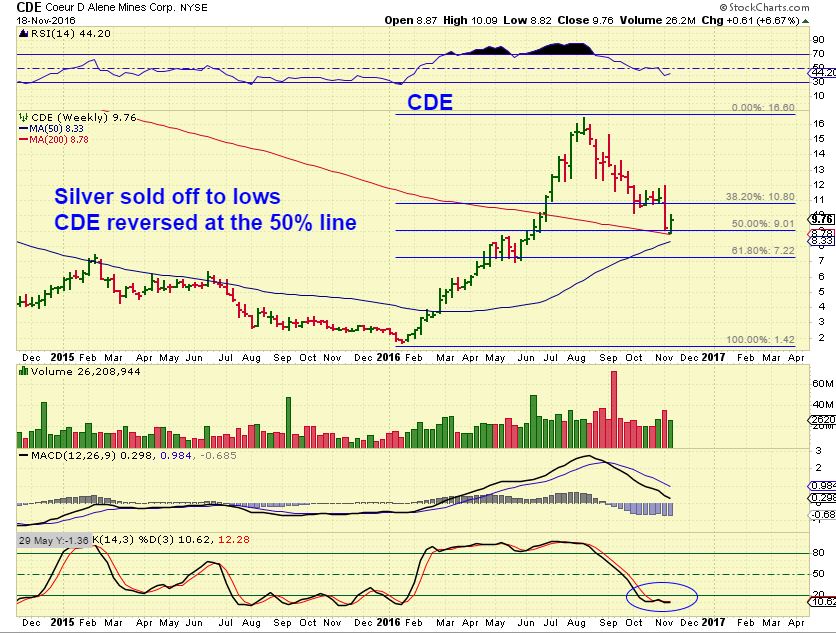
CDE – Silver was at the lows Friday, and silver looks downright ugly. People are going short and loading up on DUST, while CDE reversed at key levels?
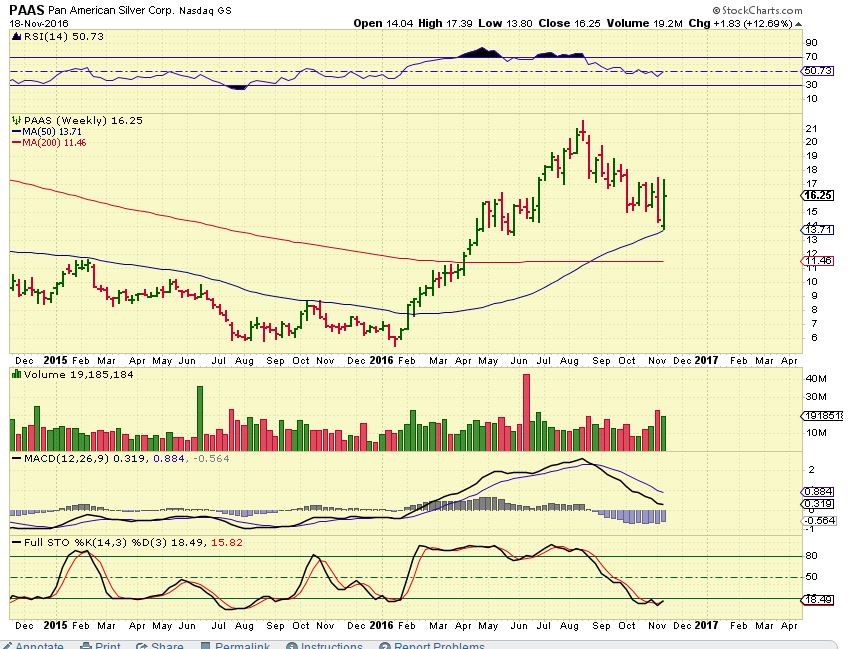
PAAS – Again, Silver was getting crushed and PAAS did what? It is about to ‘negate’ a H&S pattern. Is that a Sign of things to come for GDX & GDXJ ? PAAS was up 12+% for the week, reversing off of the 50 week ma. It remains oversold, so plenty of upside is possible. Is this possibly bullish, or am I just biased?
I have, in past reports over the last 2 few weeks, been pointing out other Miners that are not acting bearishly too. HL, IAG, RGLD, PAAS, etc – Signs of life in the midst of a sell off in precious metals. We all know that Miners get absolutely trashed in a real sell off. We are due for an ICL right now. I rarely see daily cycles pass day 33.
.
This is an unbiased report designed to show what I see, since many seem to have already read a lot of Fear and Loathing for this sector. It is an ugly set up with the Head & Shoulders patterns out there, but they can be negated in time. I see nice signs of life in the last several charts of Miners , when Miners should be getting absolutely crushed. Silver is horrible looking already, but GPL, PAAS, CDE, etc were up nicely for the week. Strong reversal candles are in place on those companies. My final thought is that if you are afraid and unable to sleep at night, you need to fix that, catching the lows is not as important as sleep and health. Do not be so heavily invested that small drops are unbearable. Sitting on the sidelines to see how it plays out is not harmful. In the future, one does NOT need to be ‘long’ or ‘short’, there is neutral. I am happy and comfortable at lows, and I obviously am expecting a rally soon. If Something seriously fails, I will figure it out and make gains in another way, but I’m seeing signs of life in Miners and other things that help me to stay calm. X, AKS, AA, CLF, FCX, other Metals are acting bullishly, they could be bought on the pullback if I need a back up plan. I’m thinking now that if as many people are short as claim to be, we may punch right through the 50sma on the GDX sooner than expected with a strong short covering rally. What if we do get a weak, ill looking move higher in the Miners? We will analyze further and take it from there.
.
I hope this report has at least helped some here that are now becoming extremely bearish, to see things with a little bit more of an unbiased view. Timing wise, we are due for a bounce, and that should help too. I always here people look back at charts and say, ” I am easily going to buy the next low and make a killing!” I say it every time, it is NEVER as easy as it looks in hindsight. Lows can be a bit bumpy, and when you are invested, a drop of 2% in Miners can make some fear the worst. This report was designed to just lay out the facts, hopefully in an unbiased manner, to show both sides of the coin. I am still bullish and still invested as of the close Friday. If Gold opens Sunday night and sells off, we’ll see if the Miners continue to hold above their lows. Gold may even sell off to break he May lows, run stops, and reverse Monday. If so, that is bullish. If we rally from here, even better. Enjoy the rest of your weekend and as always, thanks for being here at Chartfreak!
.


hi Alex
a great report again as usual
Gold was down on the week however GDX was actually up for the week last week – not much but it was up
while they scared out people in gold, ” the smart money” were maybe buying gold stocks ?????
Still reading the old reports from January before I was around. It’s like a novel, and you guys were hilarious, nervous, confident, anxious all at the same time.
Here’s an interesting nugget from January 16 (just before the face ripping rally of all times)
“I mentioned the other day that I thought one of the most bullish looking charts was DUST breaking out, but with Gold looking so bullish, I couldn’t take the trade.”
…..and doesn’t Dust look a little bullish now??
*giggle… it’s been a fun ride…
… nothin like a good driving home the facts report to build great confidence… Shazamm ….
RockOnCF 🙂 https://uploads.disquscdn.com/images/46ce01f94f6d99275fe03334cb5a96a4f4271be6cbc46a94816855f73699f6dd.png
You look like Paige Spiranac there Maria………
yeah i wish…………..
isnt someone supposed to shout.. ‘in the hoooooole!!!!!!!’ ?
s’ok,,, i just did
Is this real. Gold up12 %. Has to be a bad print. Haha. Would be awesome though if real
http://elite.finviz.com/fut_chart.ashx?t=GC&cot=088691&p=d1&rev=636152752748179004
Gold $1217.50 now with low at 1201.30 at Finviz
I did some work on the Pot stocks and the Canadian ones that are higher priced with real cash flows are the ones it makes more sense to trade imo and they didnt sell off after the election. I’m still eyeing Uranium stocks as well. URRE may be primed as Alex mentioned and URA still hasnt moved much…
Pots stocks are down. In case some missed it, Friday news:
http://www.forbes.com/sites/debraborchardt/2016/11/18/jeff-sessions-as-attorney-general-makes-marijuana-industry-very-nervous/#275a48505048
Still hanging in with you…..another thought…. that comes from my cynical side….
On the night of the election when gold shot up after hours, was it making a sign that only the few who were watching noticed?
It feels so manipulated to have dropped back down so much … can’t help but think that it was deliberately dropped so smart money could load up.
I know that some traders can spot dark pools buying. Is there any way to trace the volume in these stocks to see if there were large blocks bought at key support levels?
I know that there is a lot of worry among fed economist that despite whatever one thinks Trumps plans — demographics doesnt suppport the kind of growth he wants to create (too many baby boomers and too few skilled younger workers — going back to a fed report that came out a few weeks ago that I shared) https://www.federalreserve.gov/econresdata/feds/2016/files/2016080pap.pdf
The one question I had on the dollar- at what point do we know we’re wrong and it’s not a false breakout – answered! Very complete, thanks.
I thought nat Gas might be good for a spin here, but the weekly chart didn’t make that sound like a good idea, eh? Any chance that Oct/early Nov swoon was an ICL drop?
It might be possible for that to be an ICL – I had so many things to look at this weekend, I haven’t done the count on it
All good, def understand and didn’t expect more. I had a bit rosier take for gas. But been so into metals haven’t taken the trade.
Just in case someone is with me:
Moving my Stop Up to protect profits on USO Calls. (OIL)
Alex, this paragraph confuses me? Early in its cycle yet due for a ICL? Roll over and break down further, I do expect it to rally to new highs?
Sorry Alex, maybe its me, it is Monday!
WTIC – Oil is early in it’s new daily cycle. It can continue to climb, but it is also coming due for an ICL in the future and the way that it broke down in Oct/Nov indicates that there is time for a failed daily cycle here. To me, that means that it will eventually roll over Left Translated and break down further. Why will oil break down? OPEC? Supply Glut? I don’t know, but it is set up in a way that I do not expect it to rally to new highs on this run.
I have Oil currently in the third DC in this ICL from August with the next ICL due early 2017 ?
Left translated……hence my defensive stop to protect profits.
I’m guessing he’s saying Oil is early in a 3rd or 4th DC and will roll over soon (expected LT) to a ICL which will then generate a higher high?
Yes….I believe that is correct.
If I might chime in too, I think he is also saying oil will likely not make it up to it’s last high in this cycle.
Yes….I believe that is correct also although I hope he is wrong. 🙂
My EW count: Wave 3 of 3 just starting. The Aug. ICL was bottom of wave 2……This does NOT jive with Alex’s cycle count !
What would be your target for wave 3? 🙂
I hesitate using targets Tammie, I prefer to use Sentiment and TA to tell me a top is imminent…..or bottom.
Just say “Da-Moon”
Wave 3’s love to go to da moon
LOL…..I would be happy just double topping. 🙂
It would probably feel like the moon at that time though….. 🙂
I originally had that too, but the sudden weakness altered a few things.
That is what I am thinking
Yes, That’s it.
Right now we are Early in the DAILY cycle, expecting an ICL in the not too distant future keep my expectations for a new high very low, Among other reasons.
Alex,
How rare is it to have 6 DCL’s in an ICL in Metals ?
Has there ever been 7 ?
Extremely rare, if ever. I dont recall it
Interesting……
I avoid the first hour in metals, but I do watch it. I don’t detect any enthusiasm in this group today, yet JNUG is up about 10% (which I like), my account is up over 2.5%, XAU up 3.3%, and I am getting a lot of metal stocks showing me daily buys. Should I be excited?
Alex, what is your latest take on gold shares?
Yeah, glad that we were up but unimpressed overall.
USD Wave 3 of 3 Top in place last Friday…..Wave 4 correction now starting ?
Alt. count Wave 5 of 3 Top in place last Friday ?
Either way a Correction is imminent imo…….
Ken, you have a chart you want to share?
BAS +25%
ORIG +17%
Thin trading though…..
TPLM.. has hit as high as +25% today .. vol 3.3million
they are in chapter 11
thx Ron.
is that always a kiss of death?
I don’t think so, not sure how common shareholders fare though. There was a short interest of 3.2 days – so not huge, but maybe some of this was short covering? just guessing
Alex,
All my/our thanks for all your thinking- especially at $1250.
Wondering if you might go back further on $usd:pog to ’99.
Also, what’s your latest in the Uranium sector? (in your spare time of course). 🙂
Lastly your Lode observation is significant, as they’ve cleaned their share structure and consolidated their leases imbedded in a rare silver and gold resource, with first stope in place. No debt. Praying for no print.
best regards.
Bob has Lode cleaned up their share structure and balance sheet since the Sept 30 quarter?
good question I was going to look into it but I got busy
I have ended up long with Lode since .40. Annoying as others moved north…
I like the resource and operation infrastructure etc.. A lot.. Did a bunch of work on it quite awhile ago. I believe grades and scale get better going south to be proven with more core.
Meanwhile they strenuously cleaned up share structure, normalizing the lot, trading out royalties as well as a few leases. All good and Hopefully now in block control.
Plus they chose the hi road with all neighbors. Permit expansion will be as simple as this recent industrial rezone, with all the co-ops they’ve strenuously developed.
I didn’t realize they still had quite that much debt still on their books, but the surface land sales will make a big dent.
Amex listing has Not helped, in this company’s case, as price has drawn way down conveniently against their working capital ($o.4 mil)
Show me a producer with this much in place for $46 mil.
Yet I always fear dilution in this game. Maybe a fair time to reverse split? 🙂
I am scrolling through charts and I actually really like the Energy stocks that I’m looking at. They look to be acting correctly.
Always loved AREX, WPX, REI, CWEI ( UGH!)
But looking at some coming off of the lows
WG – 6 month chart double bottom, nice
NOG- Deep at the lows, broke 2016 lows in that sell off, doesn’t look bad on a 3 month chart
NADL – another big sell off $8 to $2 since the summer
and a bunch more. They do look pretty good after a good pull back.
I agree, but feel like we kinda missed this one, certainly on the less risky names. If the DCL could roll over any time then it’s already too late to go after energy here.
Unimpressed overall with action, shouldn’t complain since we were up but low volume, not particularly decisive. We need a powerful impulse move up, will help bears be convinced to cover as well. So far today, all we did was give bears a better short entry. Now that we’re on about Day 30, hopefully we don’t have time to piss around at the lows for long!
Still trying to figure out in my mind how hitting the ICL now will work with the Fed raising rates at the 13-14 Dec meeting. Maybe, we put in the 1st daily cycle now and the Rate Decision drops us to the next DCL. Head sharply lower for a few days just to cleanse the air before ripping higher for a 2nd D.C.? I don’t know, but I’ve certainly heard stranger.
I agree Cason. I tend to obsess on the rate decision. I do remember some data that illustrates after a rate hike that $GOLD recovers well (sometimes). Also….Cason have you paid
any attention to Lgcy lately? Someone pointed out that they recently had improved a bit. Do you have any thoughts on their current chart? Thanks!
GOLD may have the best fundamentals of any miner almost back down to the Feb lows
Alex, Thank you for looking at the prior drops in the bull run out of the 2000 & 2008 lows. Also… I share Casons concerns about the Rate Decision (see below). Personally, I tend to worry too much.
ASM has bought deal offering….down .35 pre market…..just FYI….I don’t have this one