
Oct 16th Weekend Report
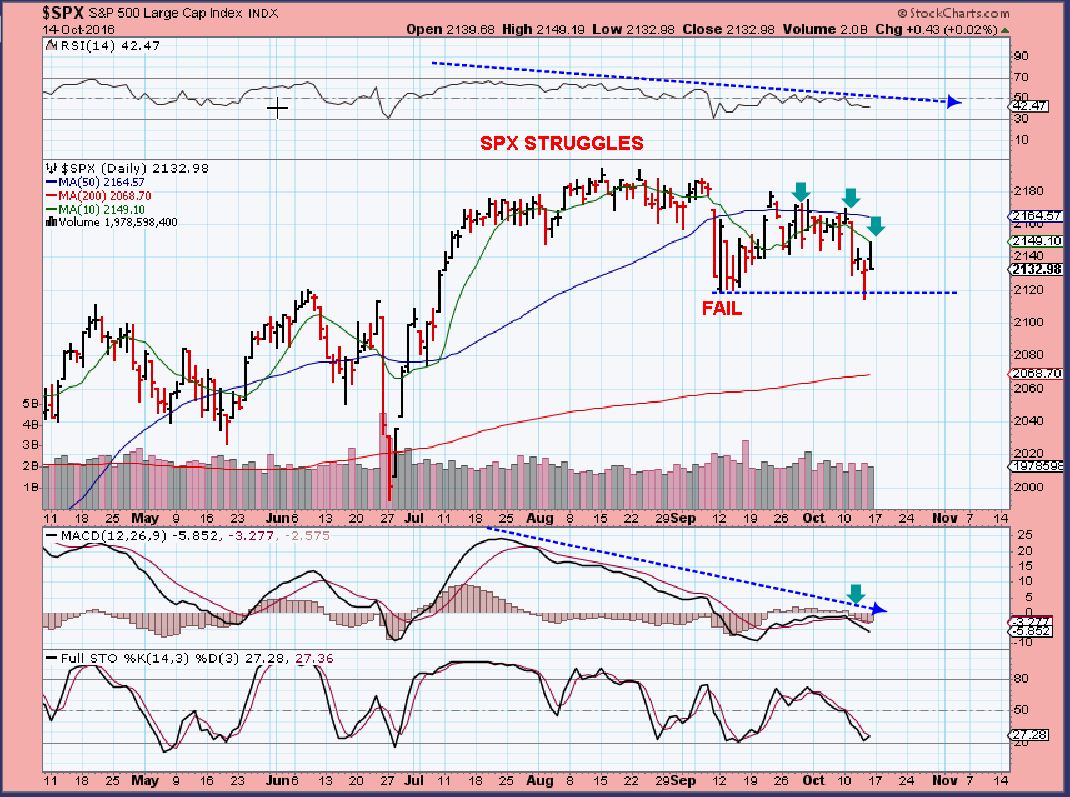
SPX -I believe that the general markets are going to roll over soon.
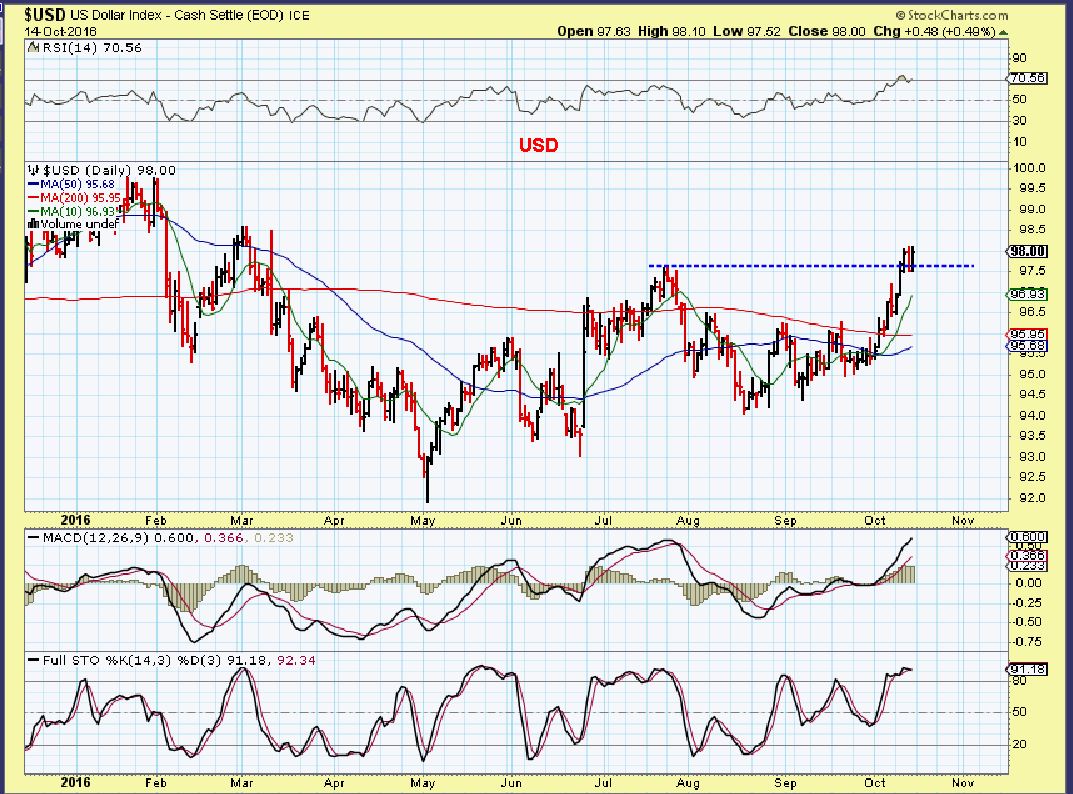
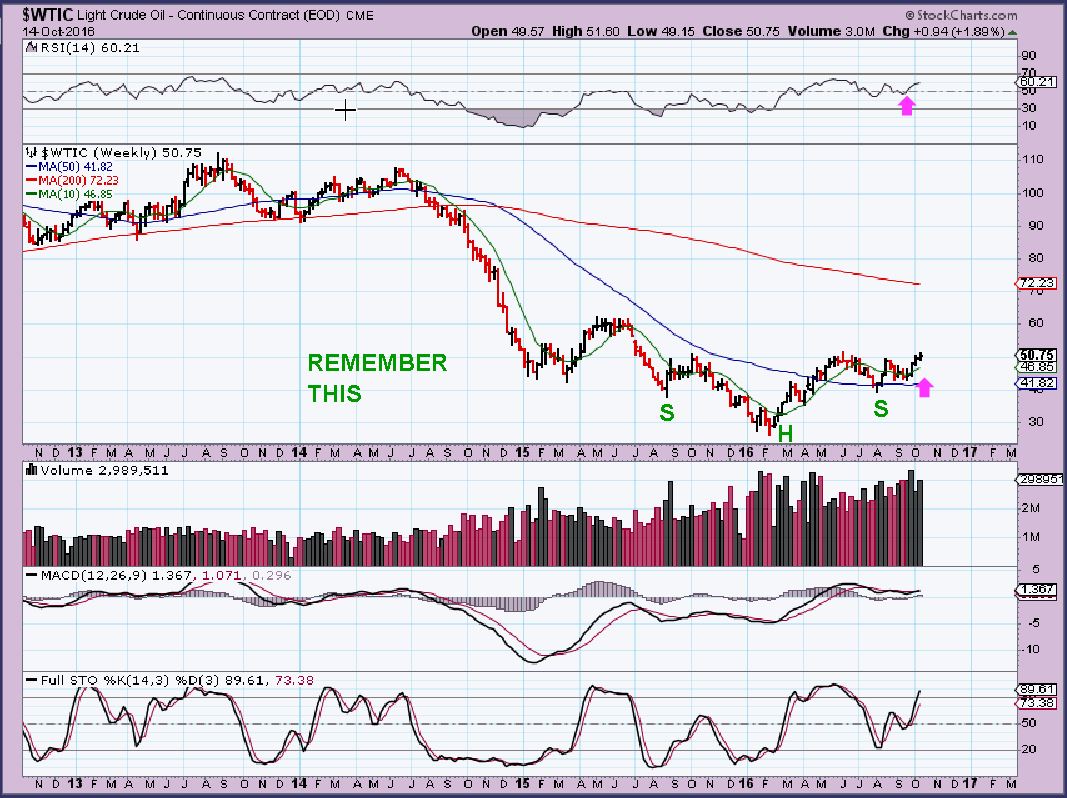
USD – The USD is due for a drop into a dcl, but the more that it stretches higher, the more bullish it starts to look in the bigger picture. This daily chart is overbought and this could be a false break out and drop below the break out line, but…
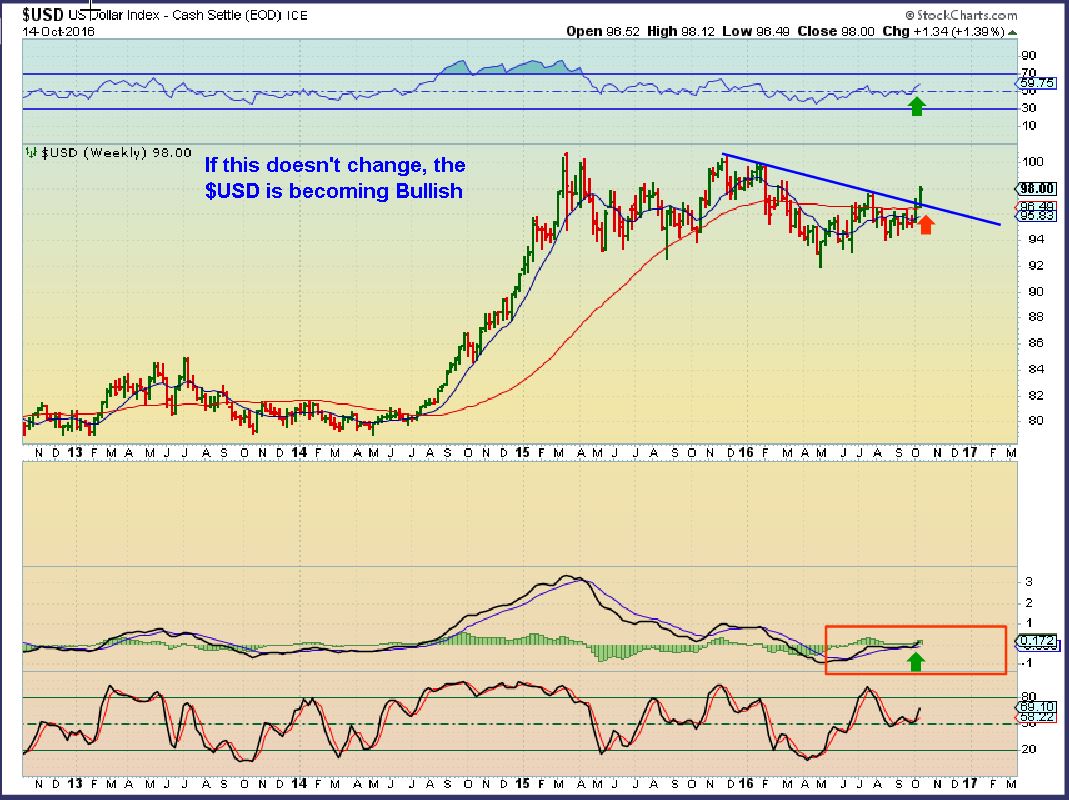
USD WEEKLY – This is a break out from a downtrend and the MACD is stacking up bullishly. If we get a drop into a daily cycle low now, I look at this and think, “Will that simply be a back test of this break outon this weekly chart?” I will be watching the dollar going forward. It is still Lower highs and lower lows, but if that changes ( break to higher highs ) it needs monitoring and need to see if that affects other areas of the markets.
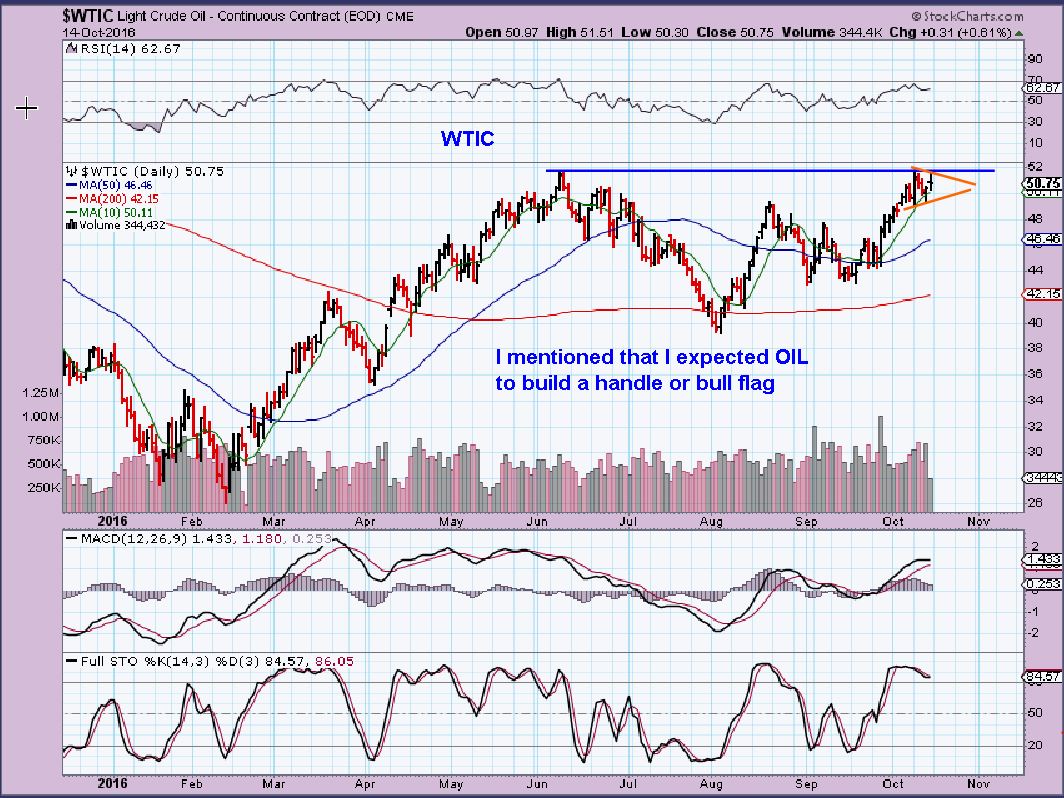
WTIC – I expected Oil to move sideways and form a handle. This may be a bull flag.
WTIC – This looks Bullish on the weekly chart, week 10 is higher than week 2. The MACD is bullishly aligned.
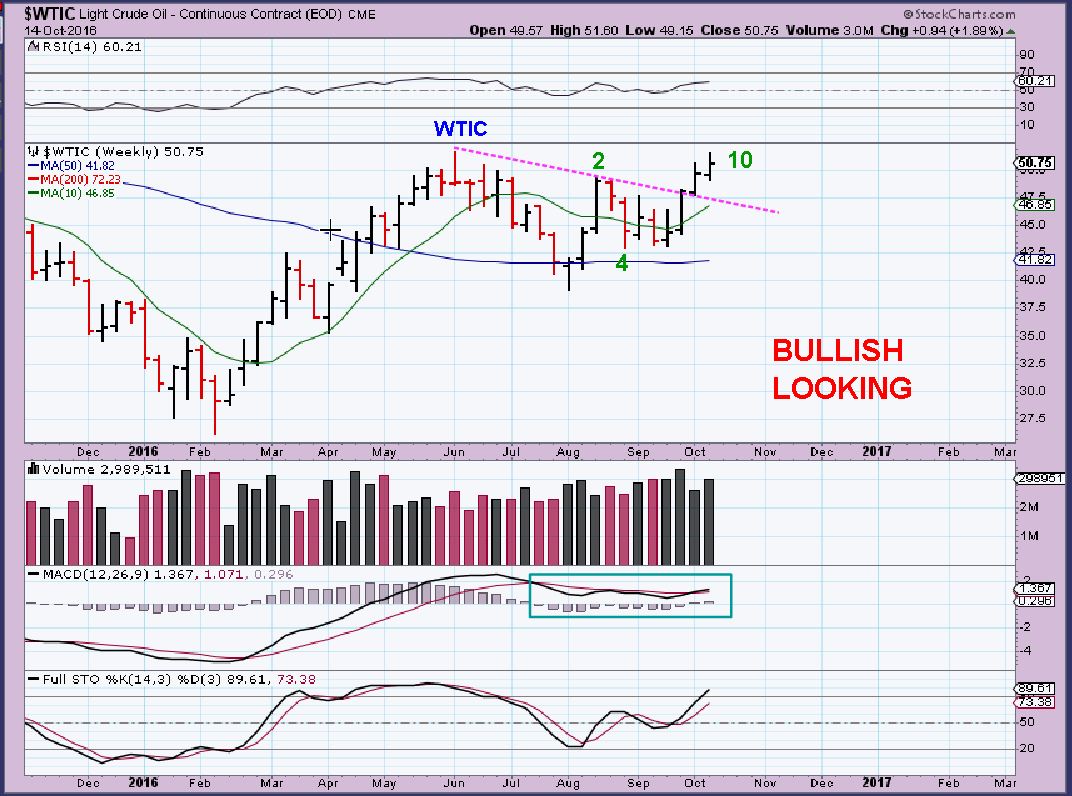
WTIC WEEKLY -This inverse H&S IS continuing playing out.
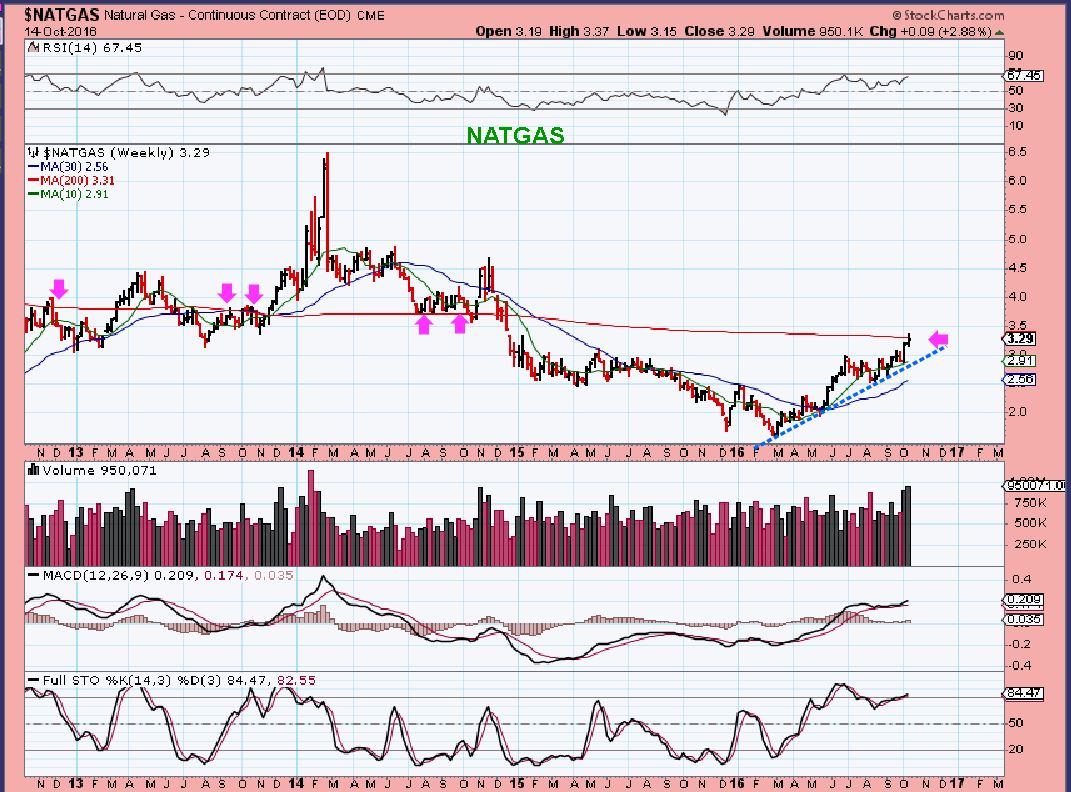
NATGAS – The WKLY chart is pushing against resistance, but this is bullishly climbing higher. Recent volume at resistance is encouraging and necessary.
.
GOLD, SILVER, & MINERS
.
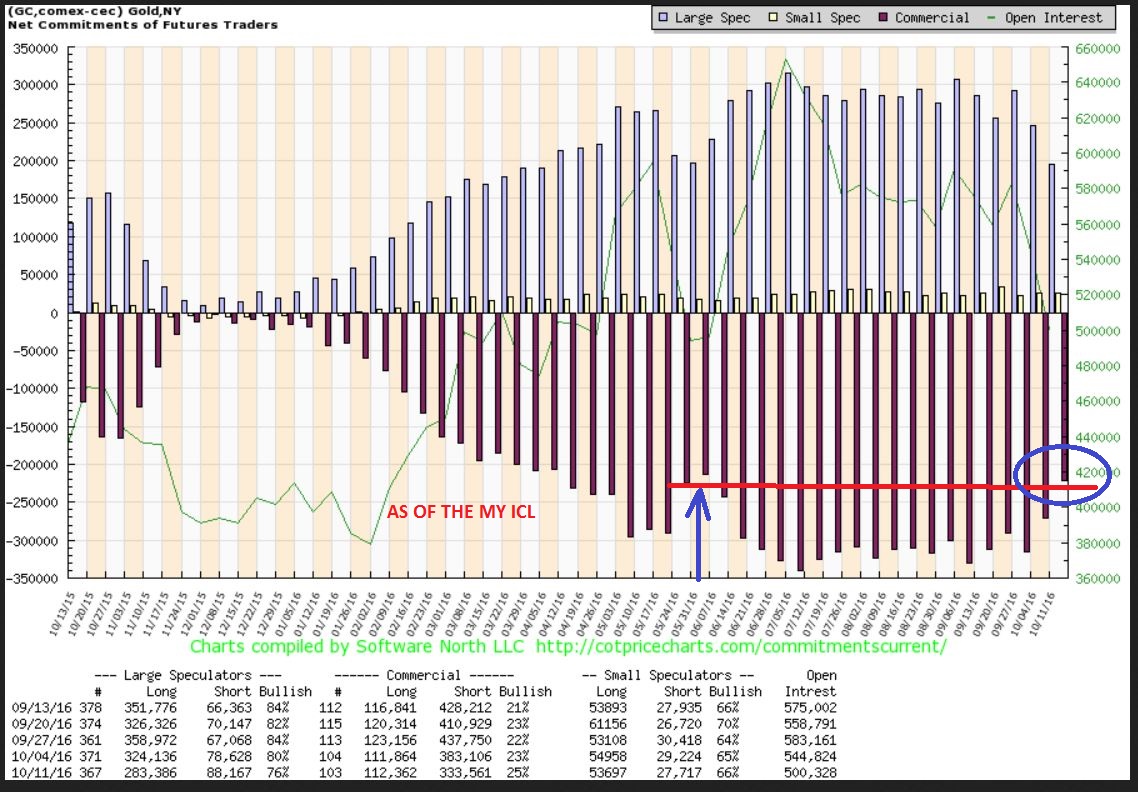
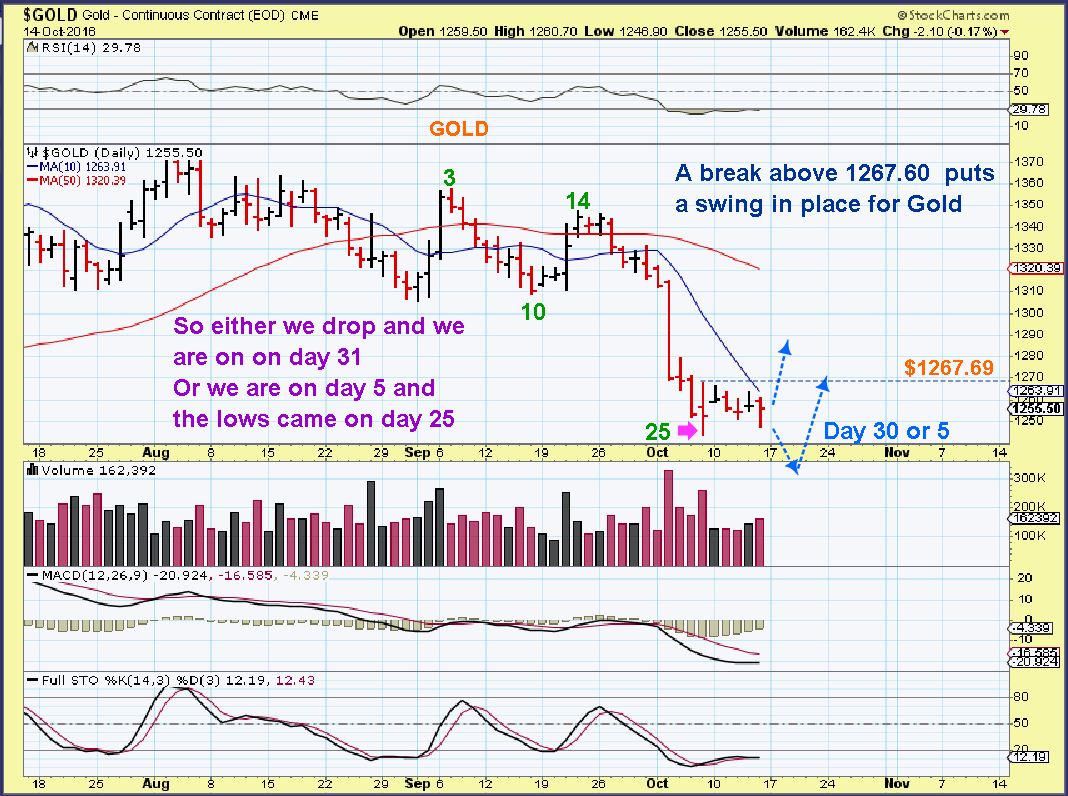
The COT levels are back where they were in May at that ICL, and GOLD is late in the daily timing for a low, so this looks good.
GOLD – Day 30 or day 5? Follow through higher above 1267.60 places a swing low in place. A flash sell off and then reversal is great too. We are in the timing for a low. See the chart.
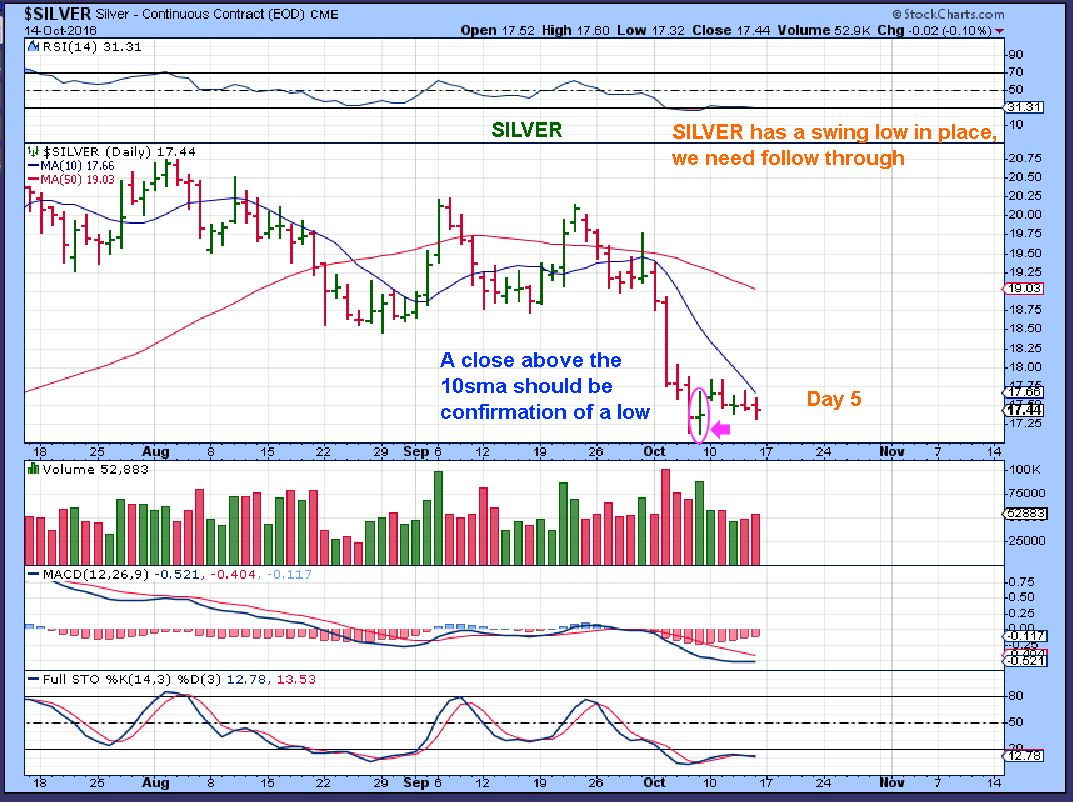
SILVER – Silver placed swing low, but it is not confirmed yet. I want to see a break above the 10sma as follow through.
GDX – On Oct 6th, I started to tell everyone that GDX bottoms in a way that looks easy to buy, but it is NOT. I said that we could see the same type of bottom form around the 200sma, that we saw at the 50sma. It scares away buyers looking for support in that area…
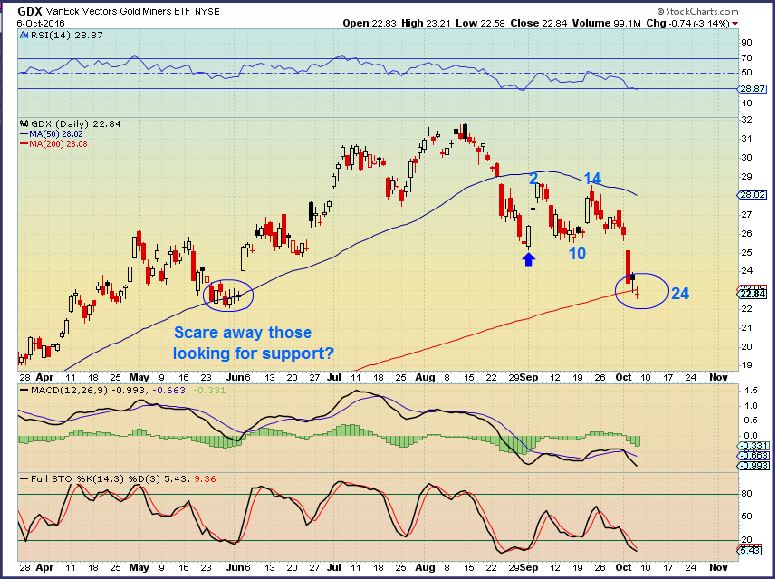
And there you go, twins. Easy to buy, right? And the ‘buy’ triggered on this chart as shown on the next chart.
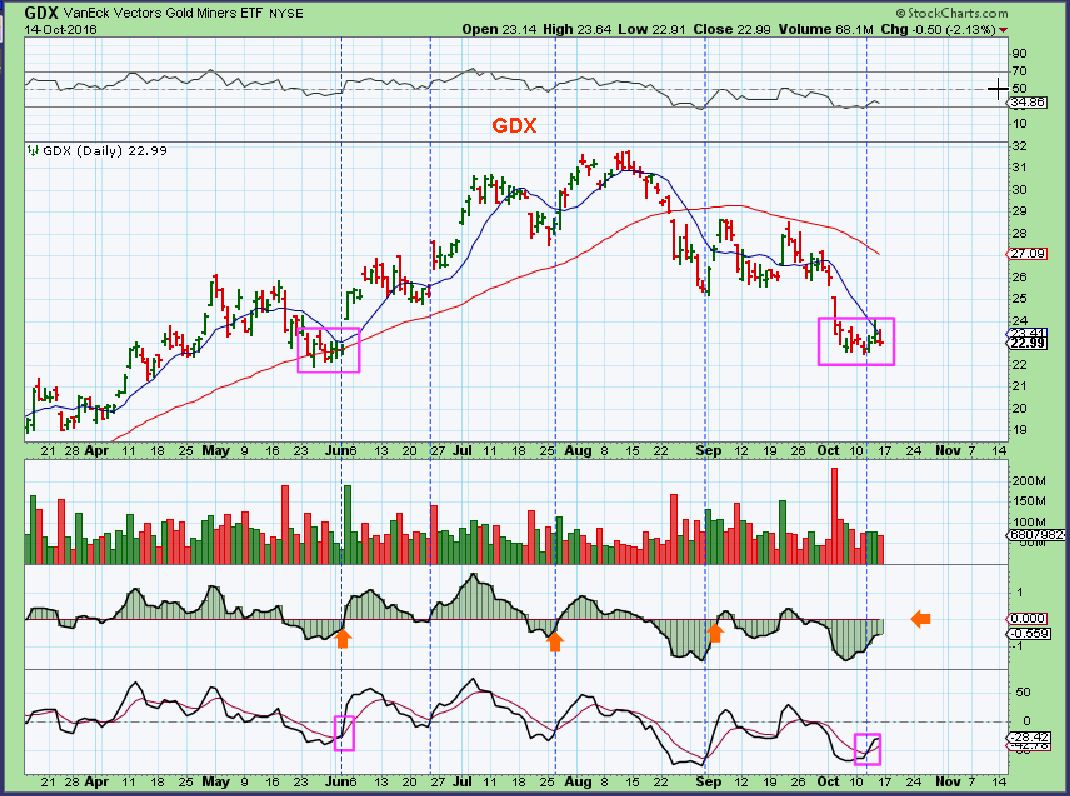
GDX OCT 12th – This system triggered a ‘buy’ on Oct 12th ( lower section). It is scary because it often triggers before a strong move higher. In the past it has been very accurate. The progress since this cross is seen on the above chart in the lower section.
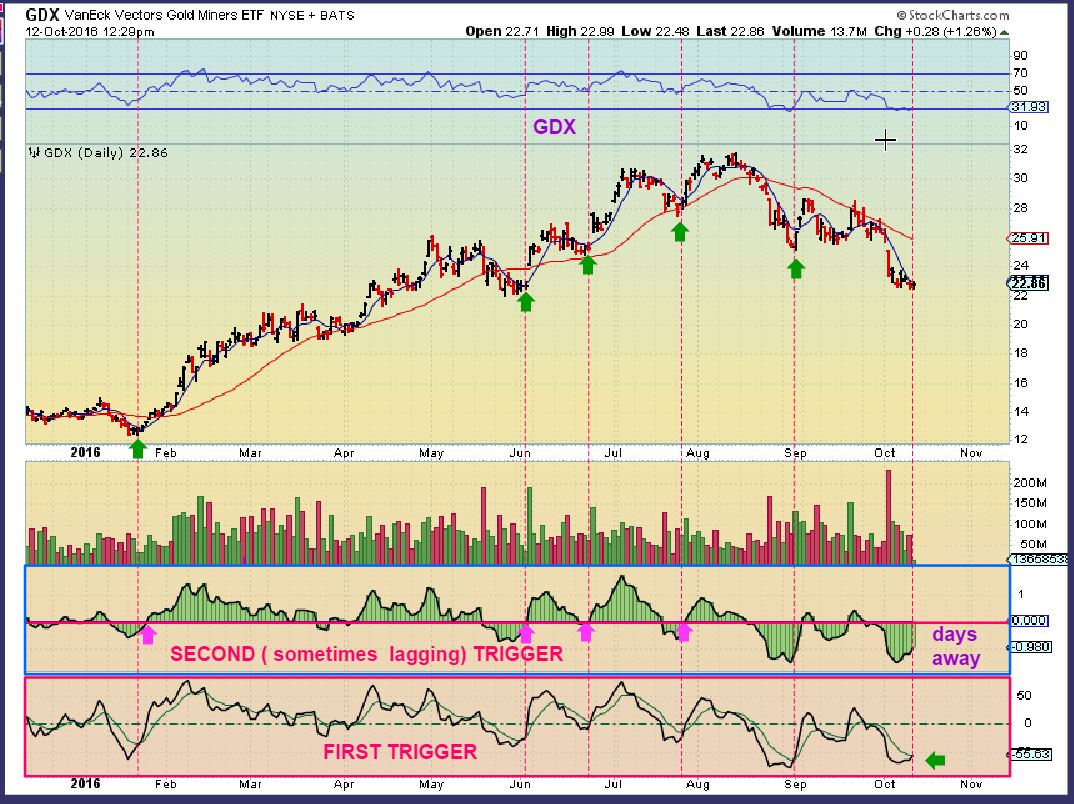
GDX – Day 27 either was the low and this was Day 3 on Friday, or if we drop and extend this daily cycle to the limits. I believe that any drop will be quick and then rebound.
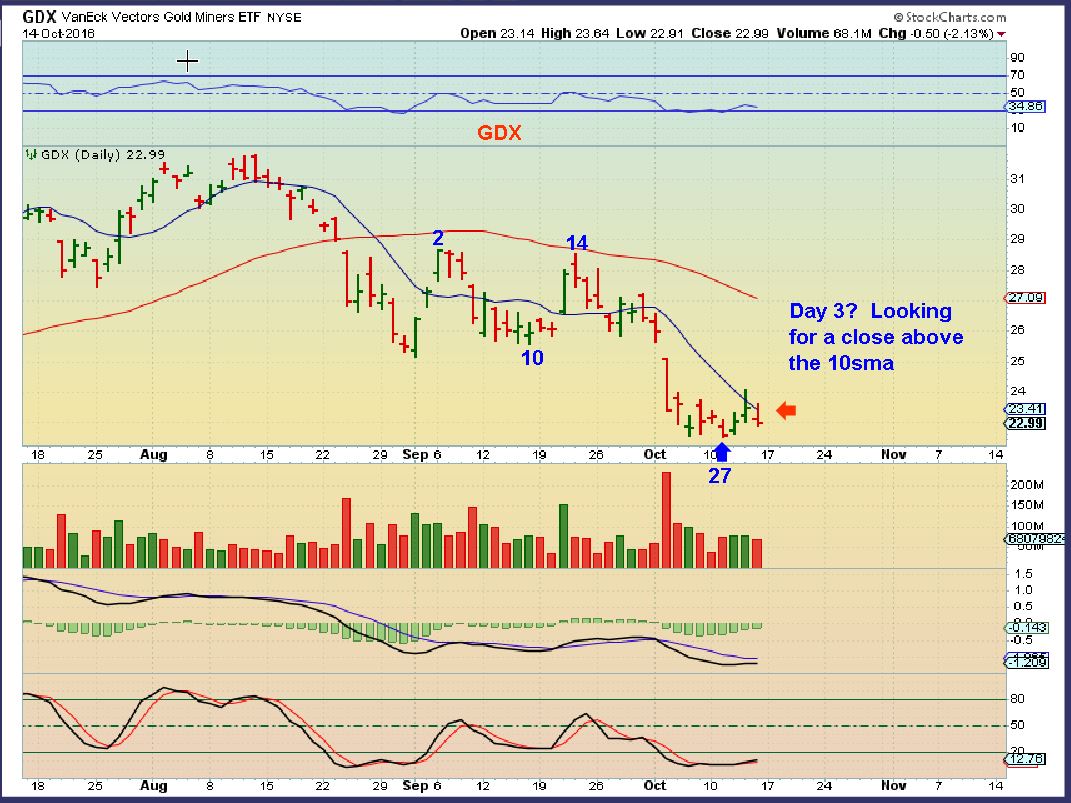
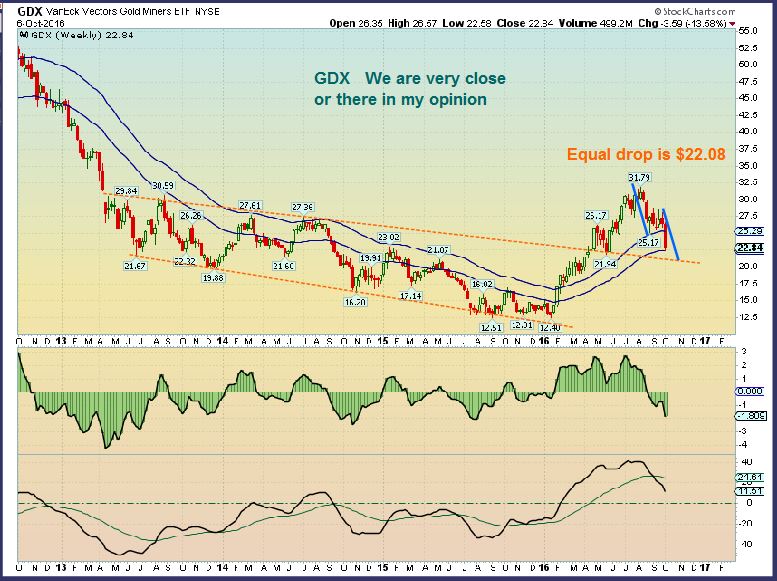
Please recall that I said that $22.08 was a measured move that is possible too. It also leads to a back test. SO a quick slam down and recovery is still possible, but that tag of the channel is enough.
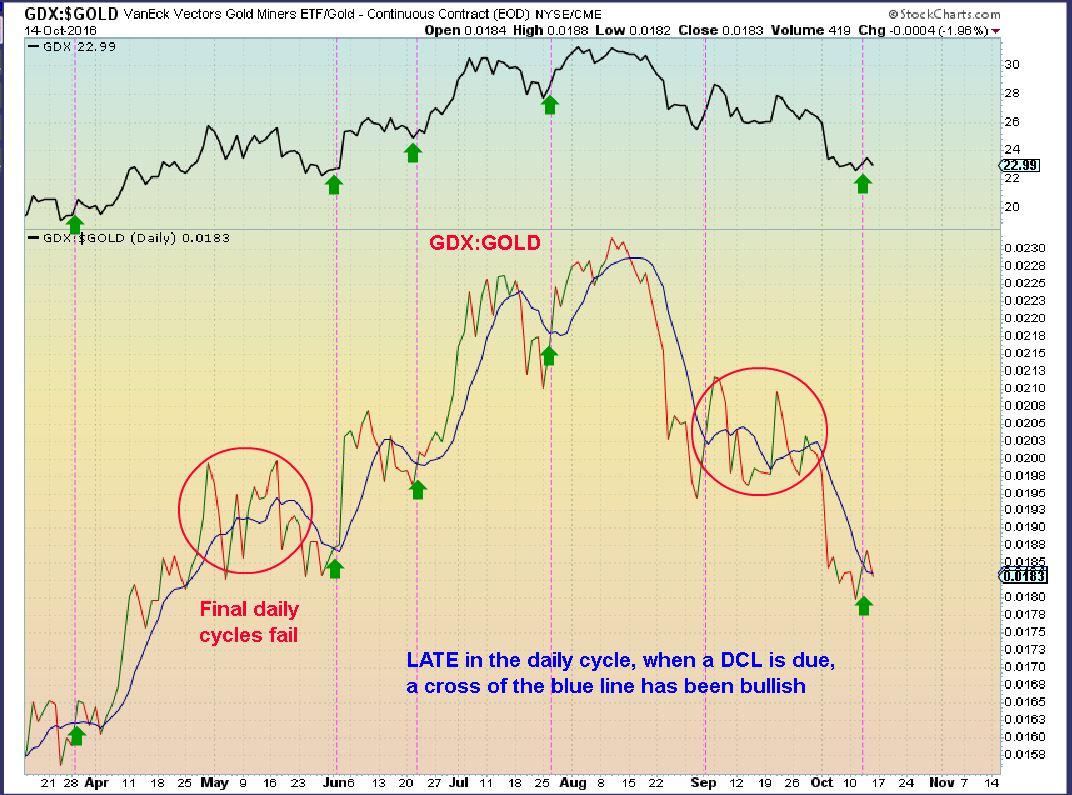
I used this chart in a report last week to show that the GDX:GOLD ratio was turning up. I wrote in the middle of this chart that a cross of the 8sma is a buy for some technical traders. We did not have a cross over yet at that point.
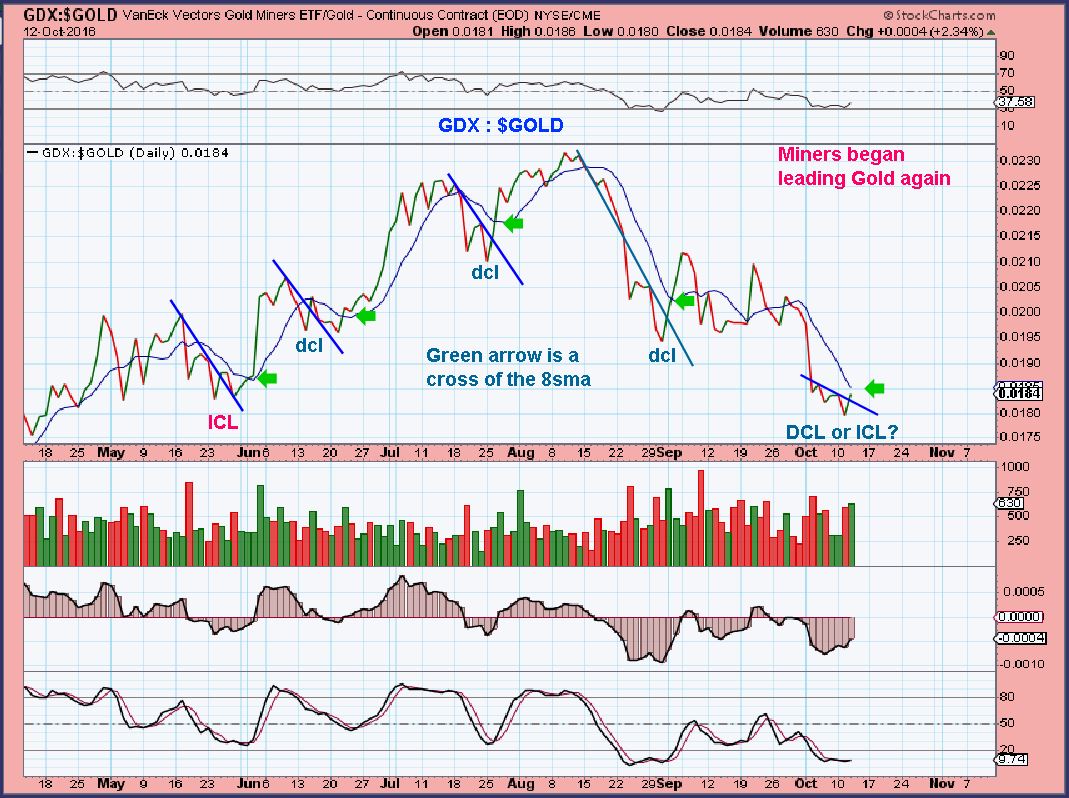
If Gold drops or Miners rise faster than Gold, we’d get the cross over. We have one but it is dropping to back test. Monday will see if this holds or gives way.
So honestly, not much has changed since the reports through out last week. We are waiting for the same thing in the precious metals, a confirmed low and a push higher. Oil and NATGAS remain bullish, but The USD is looking a tad more bullish and the SPX looks like it wants to drop. I am focused on the Precious metals for the immediate future, because we are deeper into the timing for a low in Gold, Silver, and Miners, and I think that this is where some nice gains will be made next. I expect a run higher very soon, even this week. Yes, I’m tired of waiting too 🙂
.
~ALEX
.
SIDENOTE:
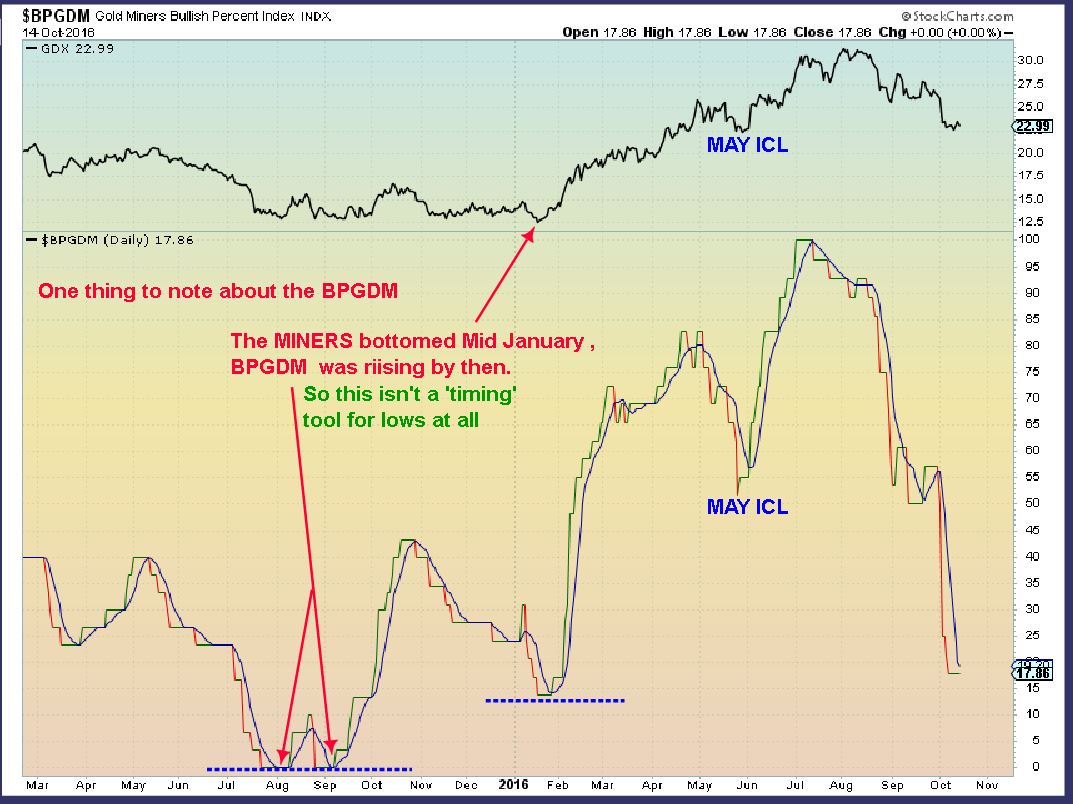
I have seen some look at the BPGDM and try to use it for timing Miners lows or to say that it needs to reach a certain level of bearishness before lows can be in place. This does not act as a timing tool, and I will point out just 3 instances here that show that.
-
In the summer 2015, Miners were TRASHED and the BPGDM was about as low as it gets, then some Miners started to recover before the GDX lows were really in place. SO while we were looking for the LOWS in GDX ( they came in mid January 2016) BPGDM was rising, not falling. Some Miners were already being accumulated BEFORE THE ICL.
-
Look at the MAY 2016 ICL. If someone says that the BPGDM has to drop lower before an ICL can be in place, then why did it hold up so well at the May ICL? We are already lower than the May ICL, isnt that enough? We are almost at the January 2015 ICL level (but we do not have to go there).
-
Not shown, but after the 2008 lows, the BPGDM did NOT drop back to where it was in the 2008 ICL. Not even close. Currently, the BPGDM has dropped as much as it needs to to remove bullish sentiment.


Great report Alex! I haven’t really invested in the PM sector for years now up until last week (in GDX now) and I was thinking if the main indexes are about to toll over is GDX going to be able to resist that and not get pulled down? What do you think based on your experience? Thanks!
Hi Zoli,
Boy do I wish you invested in Miners this spring, you’d have a lot of cushion for your current entry. I do believe that the next move out of an ICL will be rewarding, and I’m hoping that this is an ICL forming and not just 1 more final DCL. It looks like an ICL.
To answer your question, Yes, Miners have run higher in the past. Even when the General markets were selling off for years.
See the attached chart
.
https://uploads.disquscdn.com/images/75da3f1daa7be2e4dbfe3eb6c983d28578fa2654f10ae4d1dae7c482dd7dd199.jpg
Thanks for the chart Alex, I was busy making money in Oil and TQQQ this spring 🙂 [thanks to your reports BTW!] I’ve been nervous about investing in miners however a 30% retracement after a great run up just looked too good to miss…
Oh Great, glad you got some gains from Oil and TQQQ , there were some good trades there : )
Thank you for the great report Alex! Do you know why the price of $Gold has those nasty price fluctuations that occur around the time the markets open? Have a great day!
It trades in foreign markets overnight. I think that it could be any number of things and conspiracy theories abound I’m sure : )
I just view it as market movement in pre-market and after hrs trading .
I looked at the GDX:GOLD and your buy signal came back! Looks like it zigged down and recrossed it back up. (That is if I am doing this right).
Your report came out and there it is. GDX:GOLD. Thank you Alex. I am a night owl too, can you tell? 🙂
awesome report. Muchas gracias
Alex, good morning, understand your take on markets and crude. Any specific thoughts on energy stocks? I’m still in a number of our recent trades- WPX, OAS, ERF for example. Also expected consolidation or light pullbacks on crude. Energy selling down a little bit it’s just a few % and still above 10 SMA (daily) for many and certainly 50-day. Better to take any gains now while I have it on case markets erode or still safe above supporting MAS? I’m waffling on this one! 😛 Thanks.
Lately Oil & the markets have been pretty correlated, but those things can change if Commodities run higher and Markets drop. I sold my gains in Oil as I was waiting for & raising cash for Miners. I guess I’d just play the trade out as you were going to from the start of your trading plan. Honor stops, keep an eye on Oil, etc. XLE doesn’t look bad, just normal movement at this point.
Thanks, Alex, this helps. Been tough b/c the charts aren’t broke at all, but of course we all want to sell at the top, right? Some of the strong ones I might hold a bit longer and look to sell on a pop. The 1st wave was pretty awesome, but they didn’t perform all that well on oil’s last rebound (2nd daily cycle or wave 3) compared to what crude did. And as you have stated it looks like miners might have better current upside than some of the energy that has been running awhile.
The original plan was to hold for oil’s run and now at resistance probably good to look for an exit (in which case last week would have been better). For the weaker ones probably just sell and then a trailing stop for the rest at this point (had already moved up to break even).
Looking at CLF, X, AKS, TCK, etc – these commodities have strong divergence on the 3 month daily when you look at the MACD.
They do seem to be trapped under a downsloping 50sma, but worth watching
We may be ready for a commodity run soon.
LTEA – really interesting double bottom on that 6 month chart
Good ideas re CLF, etc. However, do you really mean Long Island Tea? Vol is nil.
Well, I was saying tht it is a really interesting double bottom to me. It used to have absolutely no volume at all last yr. Since April, volume has been building, and this summer the average volume has been increasing.
It has been having increasing volume pops on the surges higher, then lighter volume down.
I dont buy it yet, but I have seen companies do this at lows, and then when they start trending, they have higher and higher volume until their average volume is 300,000 to 1 million. The growing interest is usually increased business deals, or profitability, etc.
So it is an interesting double bottom to me. As it rises, I’m going to see if it starts trending with volume. It my be the sign of a small company succeeding.
Thanks.
Just can’t get a good strong move above the 10sma in GDX or GDXJ – STILL WAITING
Some Silver miners look stronger, HL, Taho, EXK, NEM
HL looks to be the best of the good lot.
I’m banking on TAHO ; )
HL, EXK, TAHO do look pretty good here
Several miners are starting to break above the 10sma
Can someone remind AG to play?
When the strong move does come, it could be a doozy and leave many people behind. If it’s hard to buy now, imagine if gold jumps $20 in an instant.
I’m hearing that there is an inflation report released tomorrow in Europe,
Maybe that could be a catalyst.
Seems like something has to trigger it, the timing is definitely right.
Yeah, agree. We had alright gains considering spot moved, what, about $4 all day?
Alex you know I’m a “trend follower” and the signals I follow on my charts are bullish today for GDX and GDXJ (SLW & SILJ too). The 9 day EMA is above the 10 day SMA and my TSI and RSI signals are bullish. You were correct to call this as a “sideways” bottom rather than a “V” bottom. So I’m holding firm in GDX, GDXJ, SLW and SILJ. Good trading to all!
Yes, I have buy signals from last week, but not the confirmed ICL / DCL type for those looking for a bit more confirmation.
If we close above the 10sma, that is probably going to be enough for Miners to call a low.
got closes above the 10sma on all my miners except AUMN & TRX which seem to have a life of their own.
HUI/XAU/GDX all closed above…. so lets git movin!
Interesting. I use a 5DEMA and 9DEMA. Your ‘stocks’ closed above the 5, but are below the 9. I did check and you are correct re the 10SMA. My stocks were up for the day, but not wildly. However, there are some that were great today: HL, EXK, CLF, NSU, TAHO, BVN, GORO. Hopefully there will many more up like these tomorrow, especially mine. 🙂
no not yours!.. its mine that need to be up 🙂
We all need a break, this has been one of ‘THOSE’ lows again.
Working on a report now, a bit of a Short report tonight, I’m tired of ground hog day : )
Was today exciting? No. Was that crazy bullish price action? No. Did I end the day higher? Yes… 🙂 🙂
AXU, AUMN, TGD….I’m waiting waiting…..holding…holding…
Yeah my “micro miners” are really lagging but I got a schwing! and a 10SMA close on a few I checked- EXK, MUX, SAND (immediate swing last week, crosses 10 SMA today).
AMRS- Possible Consolidation, maybe a Bull flag and run higher.
AUY volume (buys coming in?…)
I had MNGA, BLDP, PLUG, AMRS, etc etc in my clean energy list & now MNGA has a very similar set up to what AMRS had when it was basing and Popping along.
Very tempting
That COT chart and BPGDM look really familiar…
I hope that I explained the BPGDM correctly when I posted a few weeks ago that it appeared to show that we were indeed dropping into an ICL and that it wasn’t a great timing or entry tool but helped to provide more evidence to what we saw in tech analysis and cycle analysis. If that’s not what anyone got from it please go back up and read what Alex said instead! 😛
$$ moving down, silver moving up AH.
woohoo! 🙂
Still hanging on to a significant amount of AMRS …. that was a quick reversal!