
Gathering The Goods
Another week of choppy trading, but there is a lot to talk about this weekend. It may be time to start gathering the goods, so lets get right to the charts.
.
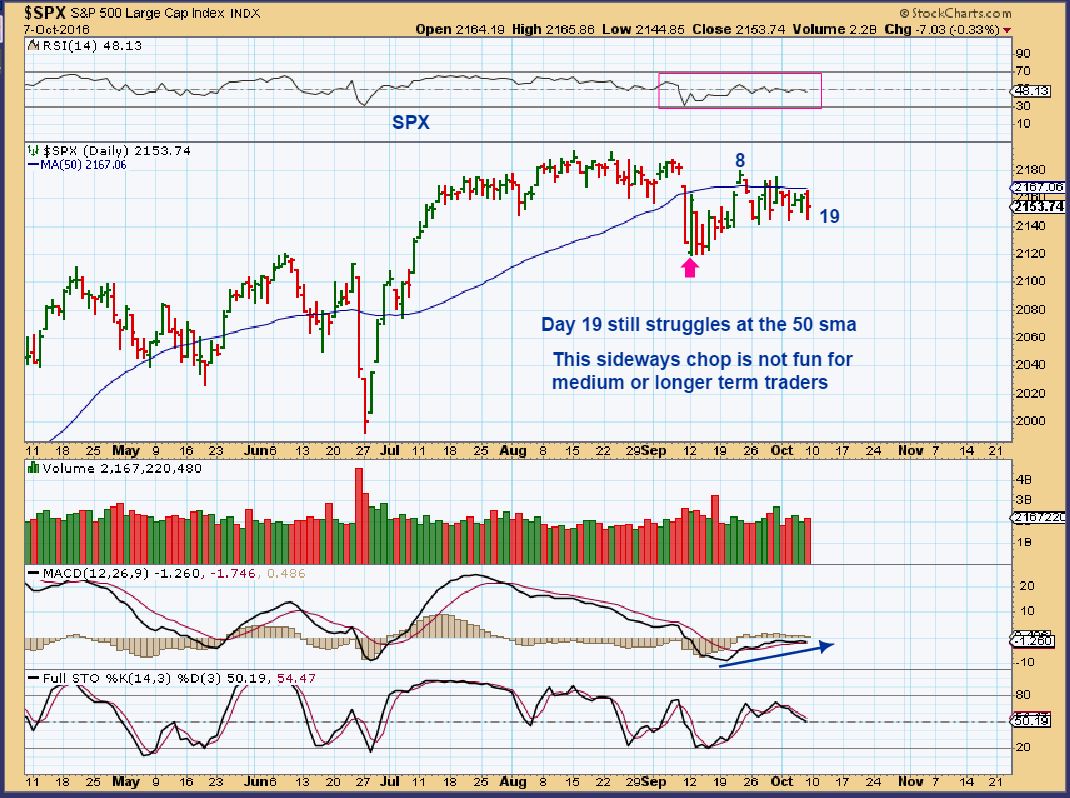
SPX – More of the same, Capped at the 50sma and L.T. ( left Translated) so far, it still needs to break one way or the other. Markets do not like indecision, and maybe this is what we get until after the elections. Please read the chart.
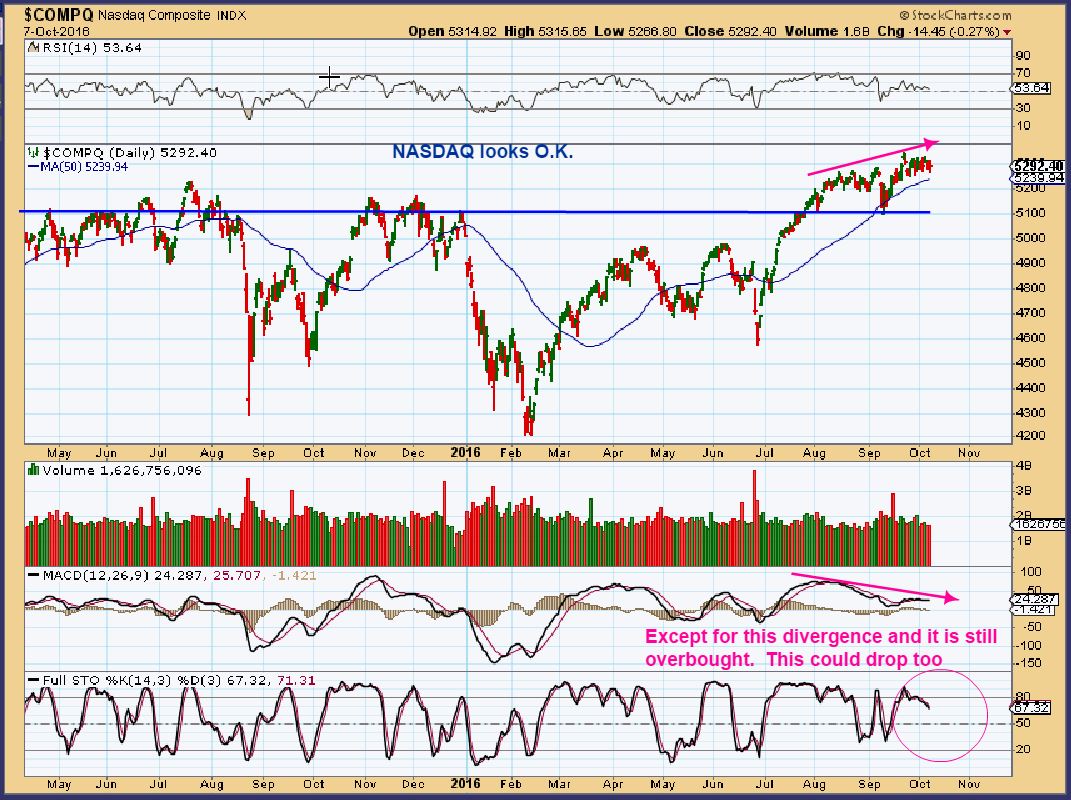
NASDAQ – The NASDAQ broke out and was holding up pretty good, but the MACD divergence is showing a lack of strength and it is overbought a bit. This actually looks more like it wants to drop.
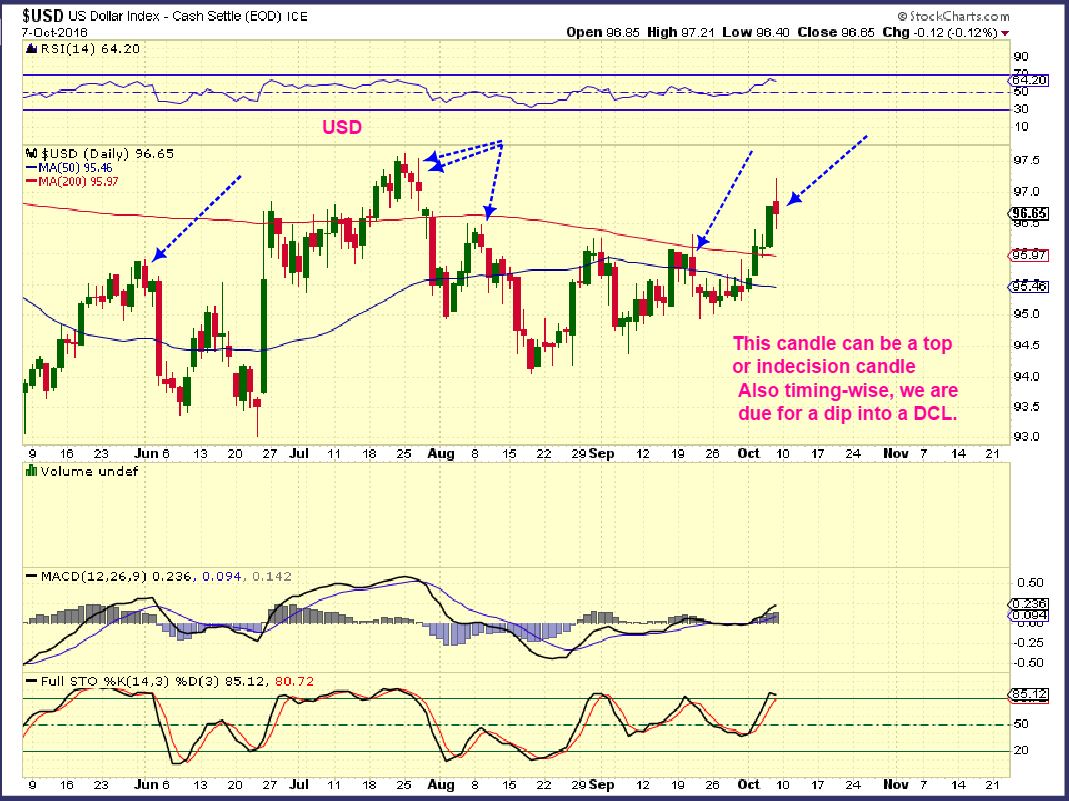
USD – The USD broke out and reversed lower Friday, so it could be a false break out to draw in long positions. It is actually due to drop into a dcl ( Daily Cycle Low), and a drop by the dollar would help Gold.
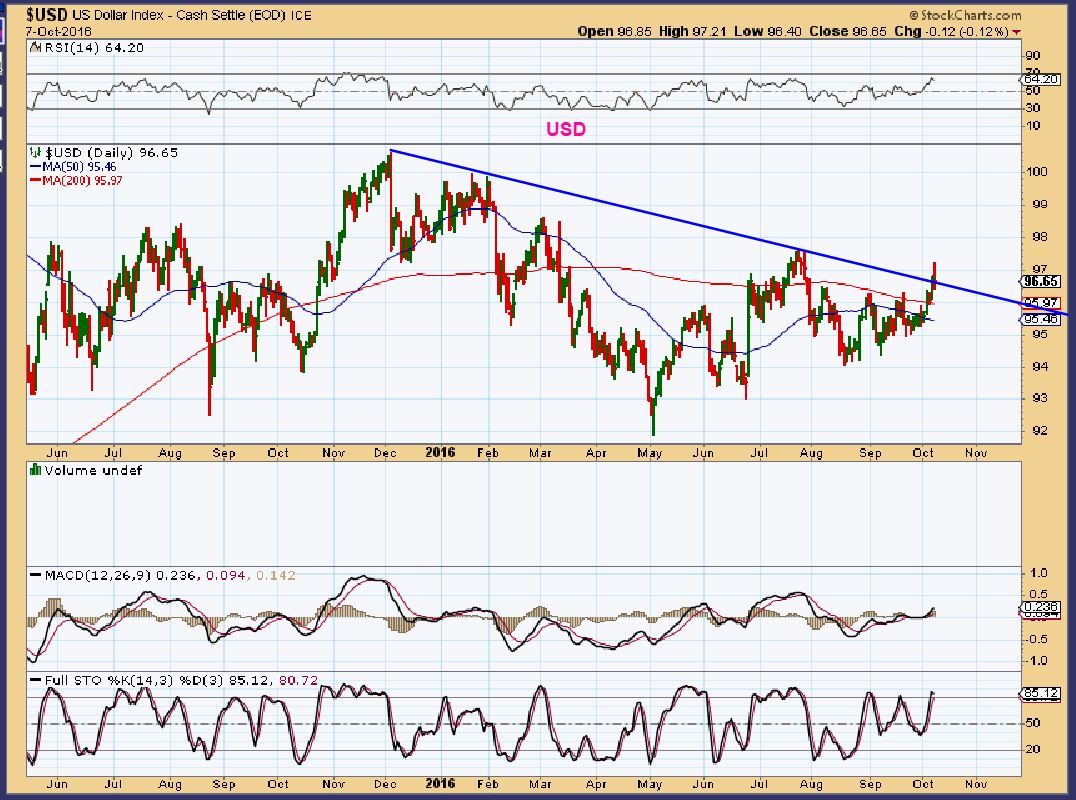
USD WKLY – Read the chart please.
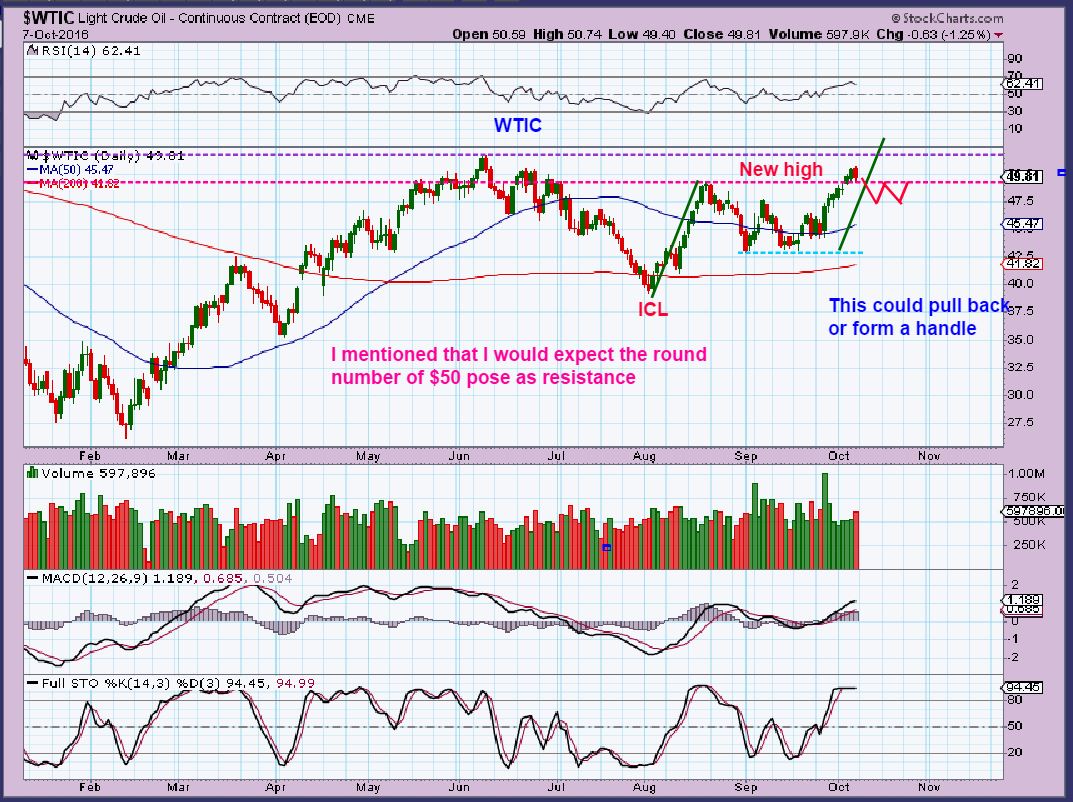
WTIC – Oil has been doing very well since we started buying those lows. In a report last week I mentioned that Oil could find a struggle at the $50 area , and here we saw a break and Friday had a possible reversal candle. It could pull back for a bit or build a handle. I still expect higher prices over time.
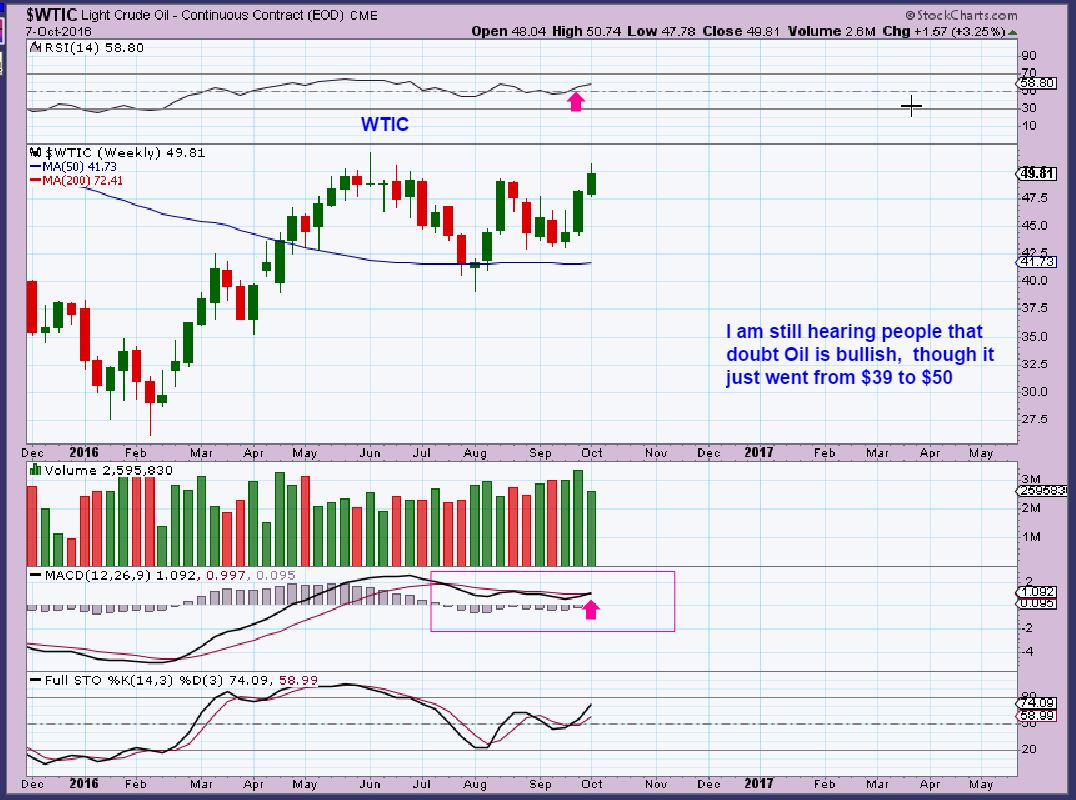
WTIC WKLY– This is a bullish looking chart, yet I still hear quite a bot of bearish talk.
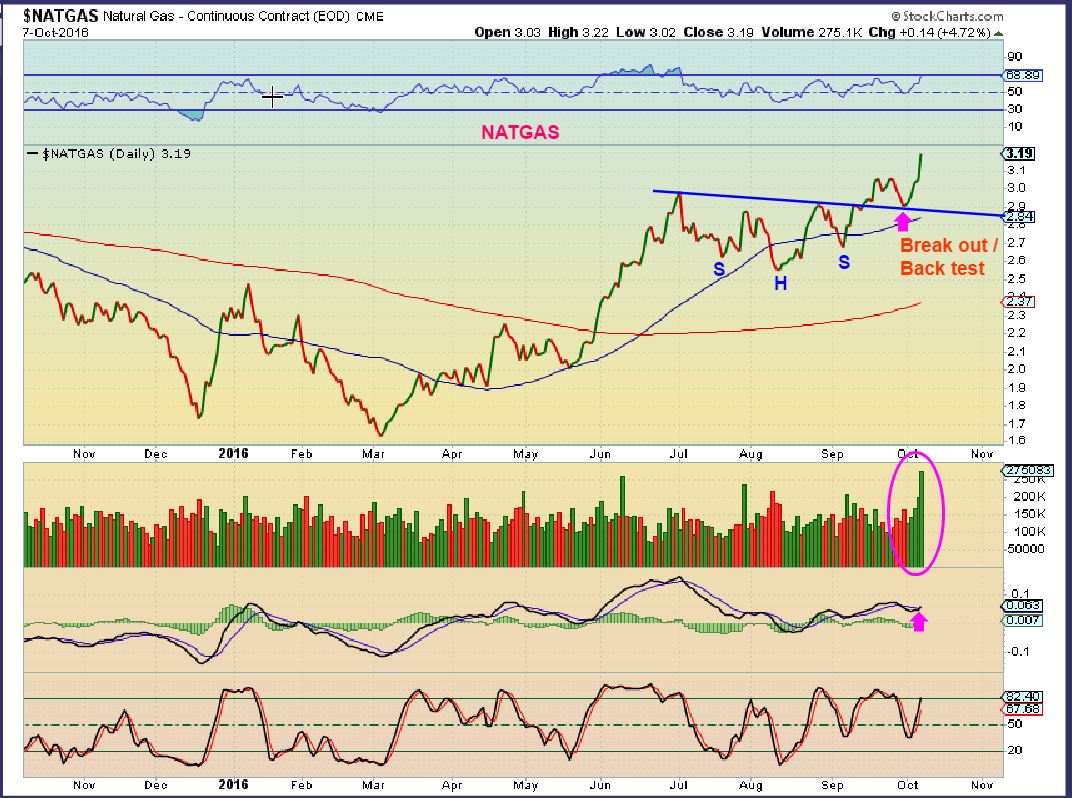
NATGAS – This bullishness continues as NATGAS has acted correctly all along. It has been a buy the dips candidate.
PRECIOUS METALS
.
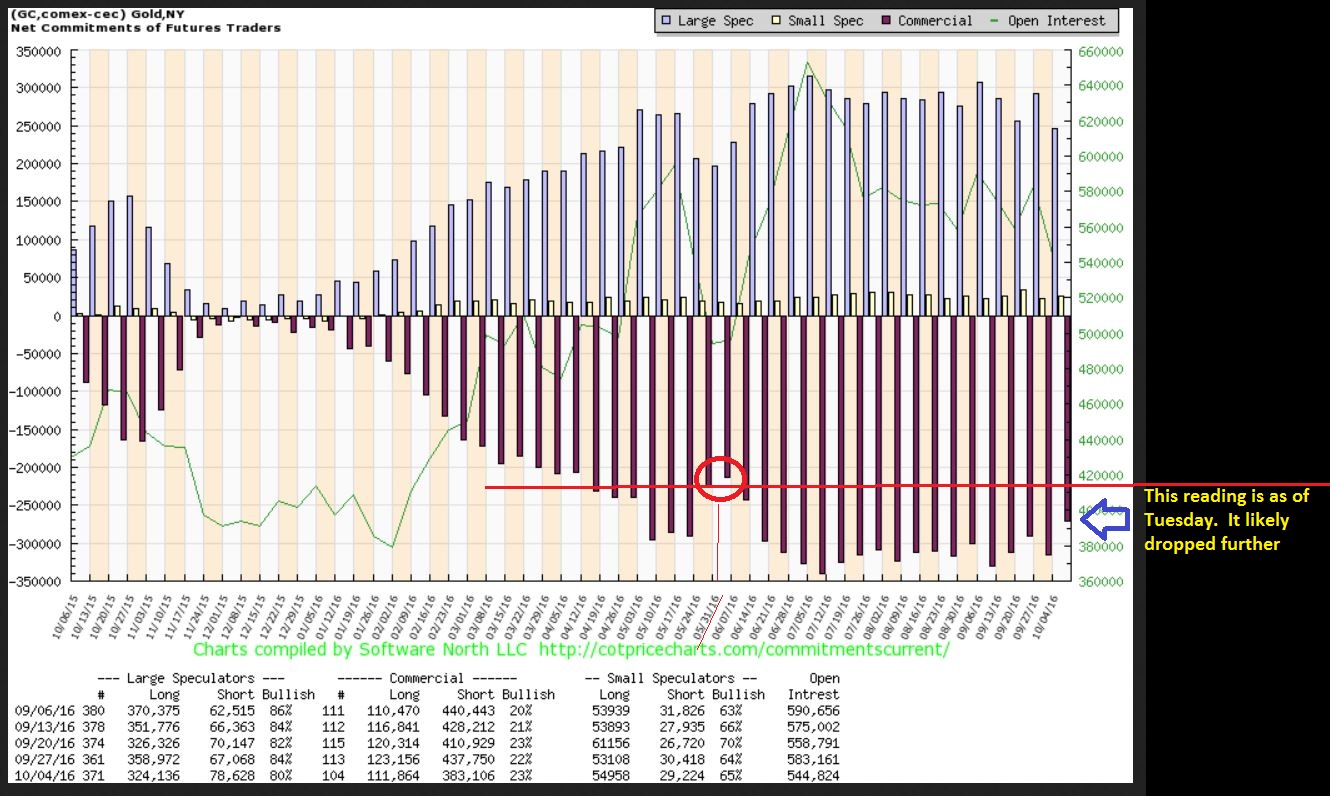
THE COT is dropping much closer to Mays ICL levels 🙂
.
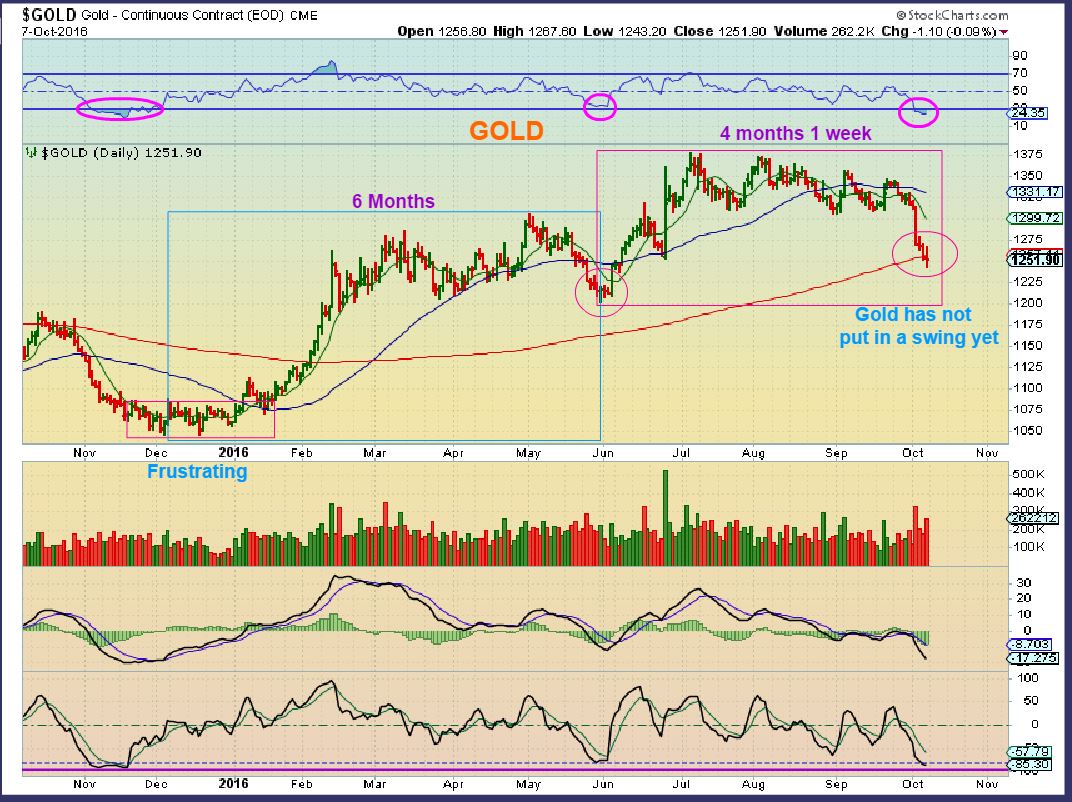
GOLD – Gold did not put in a swing on Friday. It shot higher with the jobs report and sold off as the day went on. It is oversold, and in the cycle timing for a Low. It can occur now or in the next few days, we will look for a swing to develop & confirm.
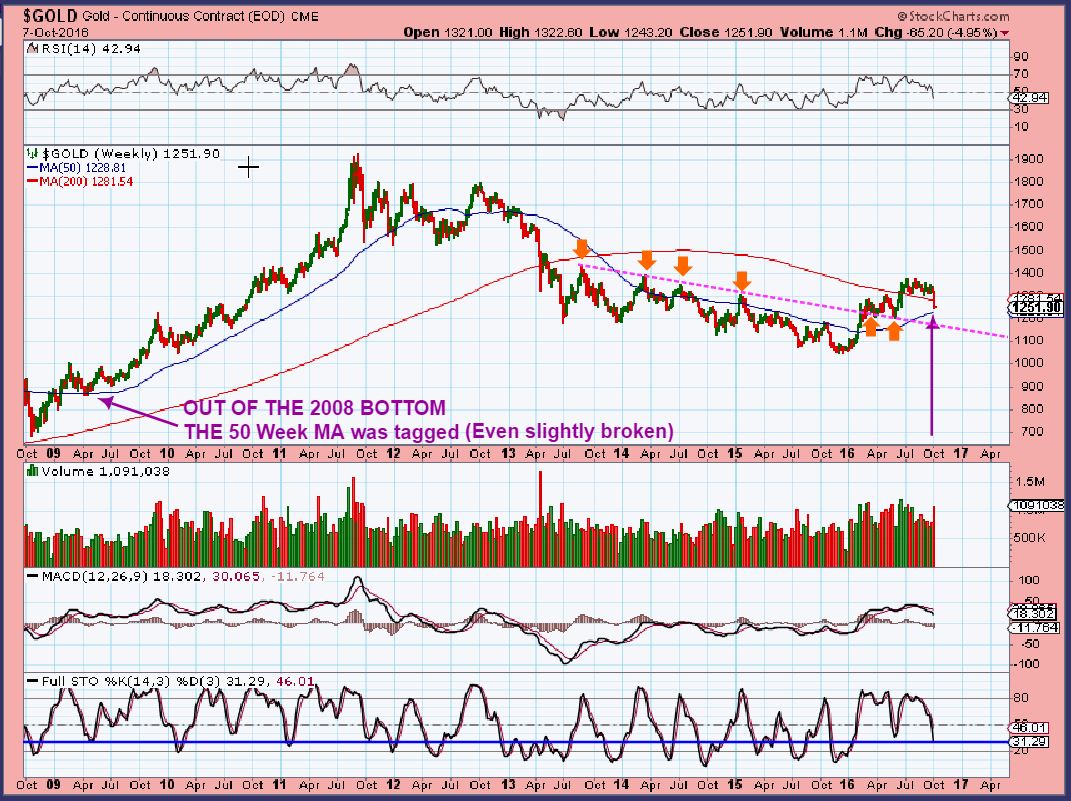
GOLD WKLY – Gold dropped to $1243 this week, but a tag of the 50 week MA is possible and a drop & reversal would actually be great. It would lower the parameters of a weekly swing.
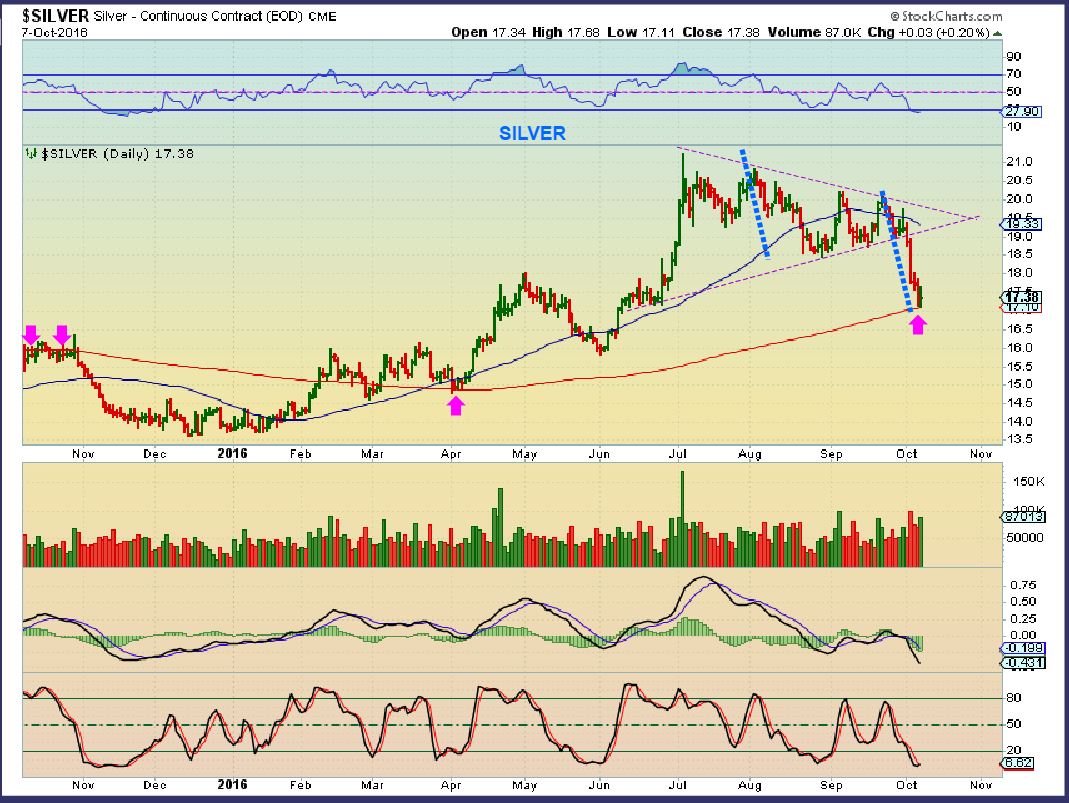
SILVER – Oversold and in a support area and a measure move on the sell off.
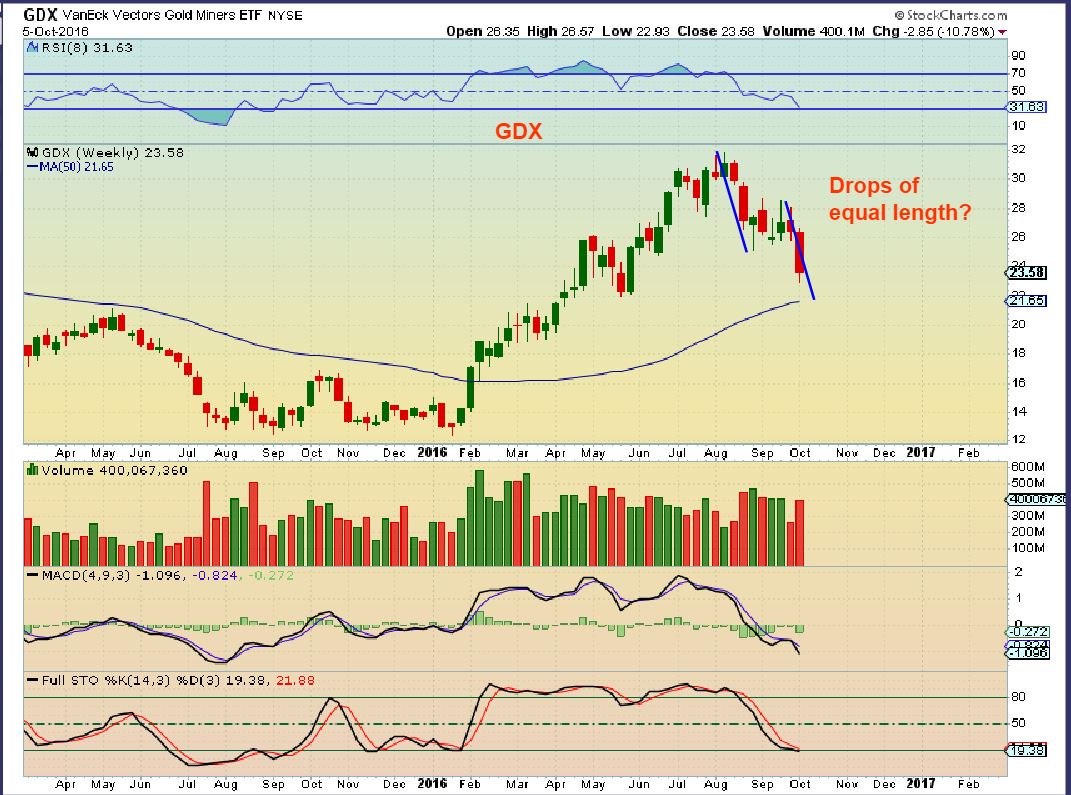
GDX – 2 charts from last weeks reports, and then a few new ones.
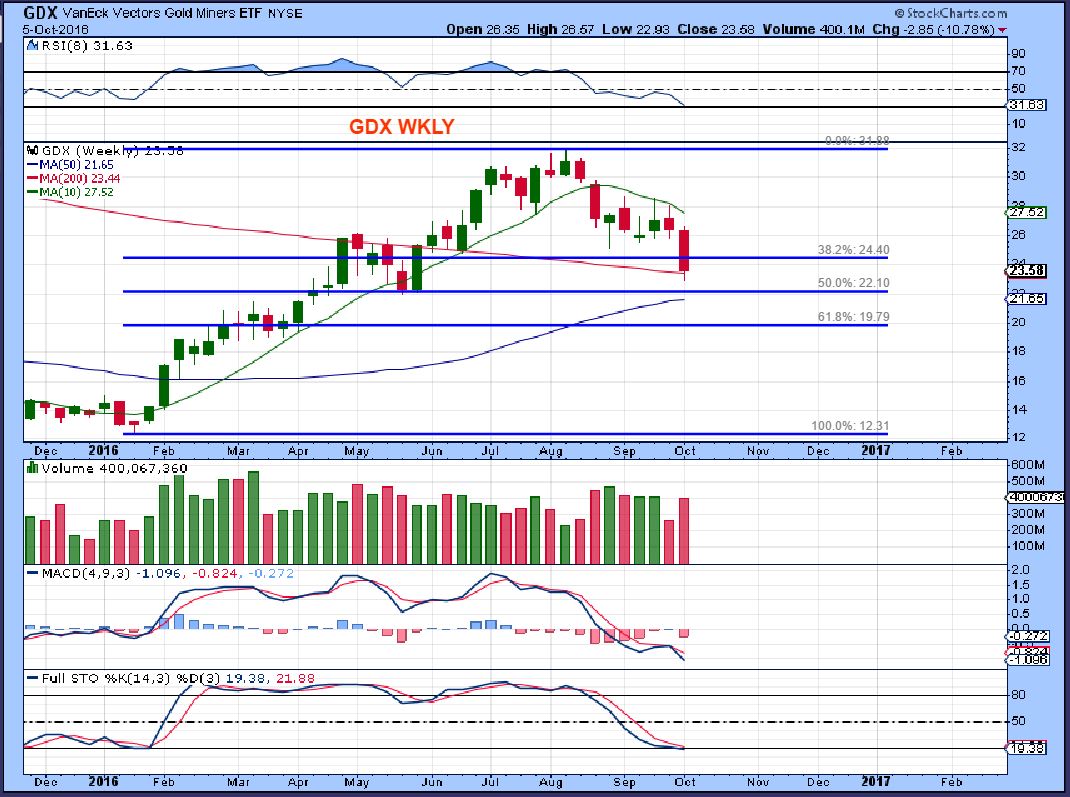
GDX – This was a reminder that GDX could drop to around $21.55 and be fine.
NEW CHARTS
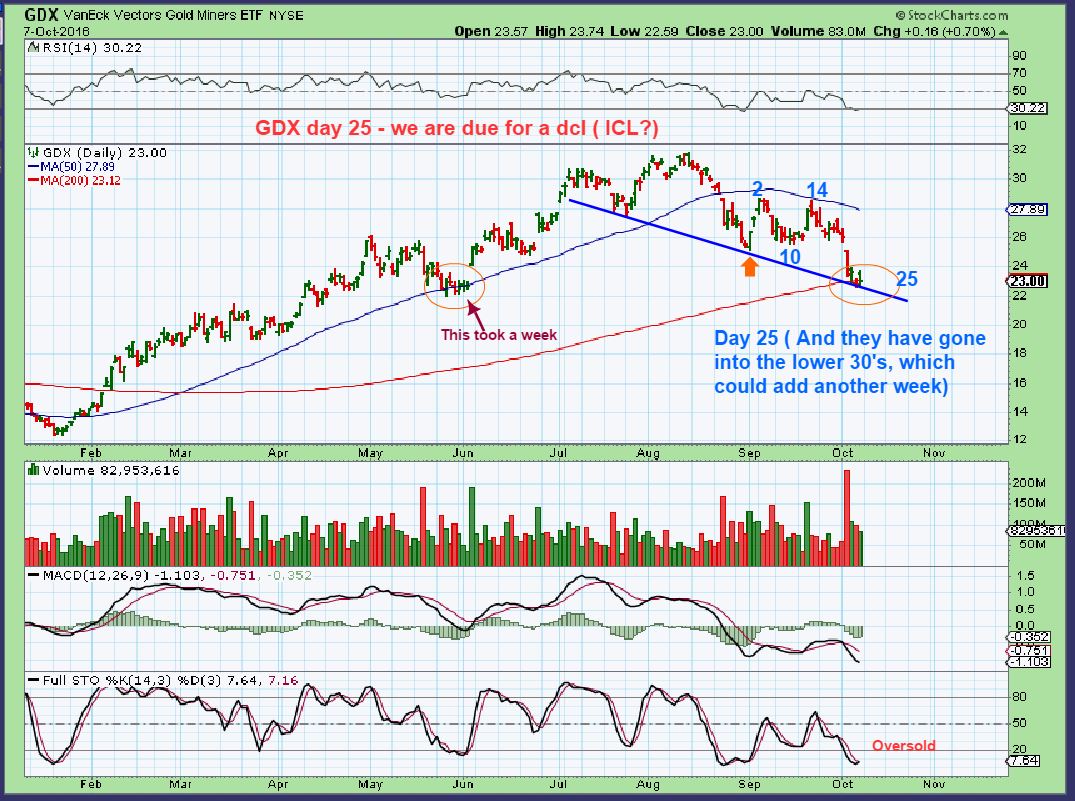
GDX – Please read the chart (Another week or done?).
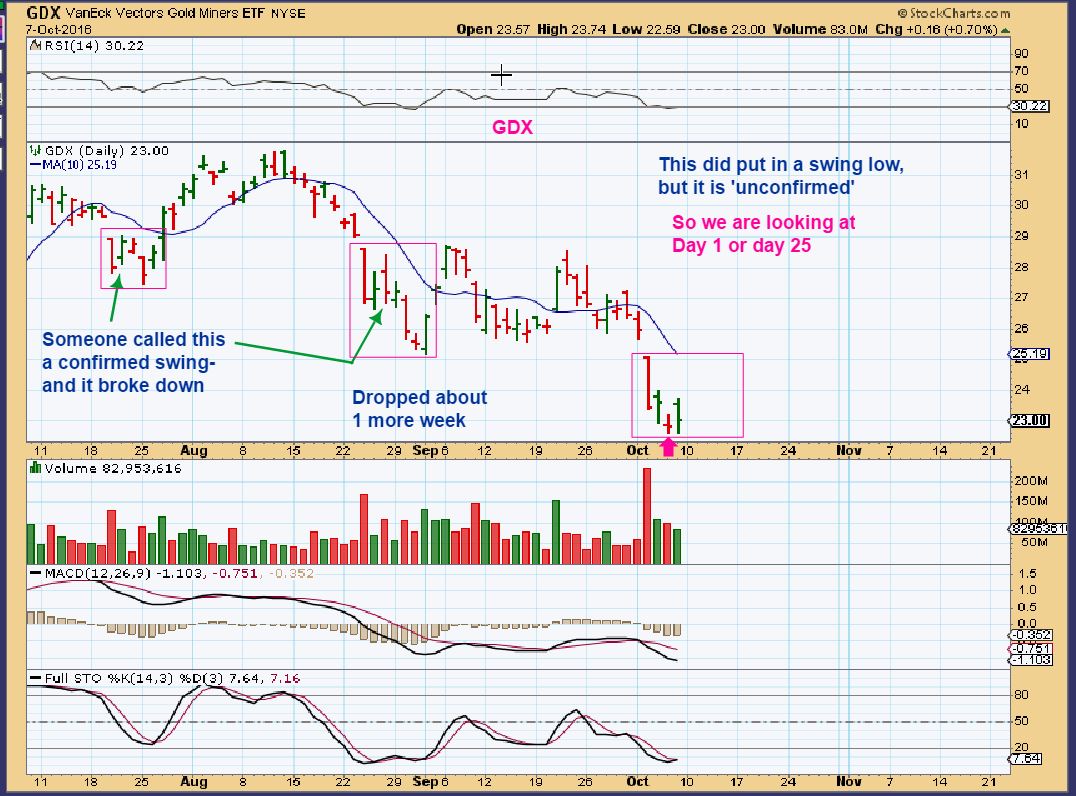
GDX – Please notice: We do not have a Confirmed Swing Low in place. I got emails asking am I buying leverage now that we had ‘the confirmed swing low’ in place for GDX. Notice on this chart that just because there is a Swing in price, that doesn’t mean it is a confirmed final low and that it will not roll over. Buying every swing with a tight stop will frustrate traders, since one could get stopped out if a stop is too tight. I will discuss at the end of this report that we should be very close to our lows and if I am adding to Miners here, I do NOT use tight stops on day 25 ( I will use mental stops and monitor positions). Even a dead cat bounce later will get price back higher than this point.
GDX – One more small dip this week? Maybe. Please read the charts. THE lows may or may not be in, next well will make that clear.
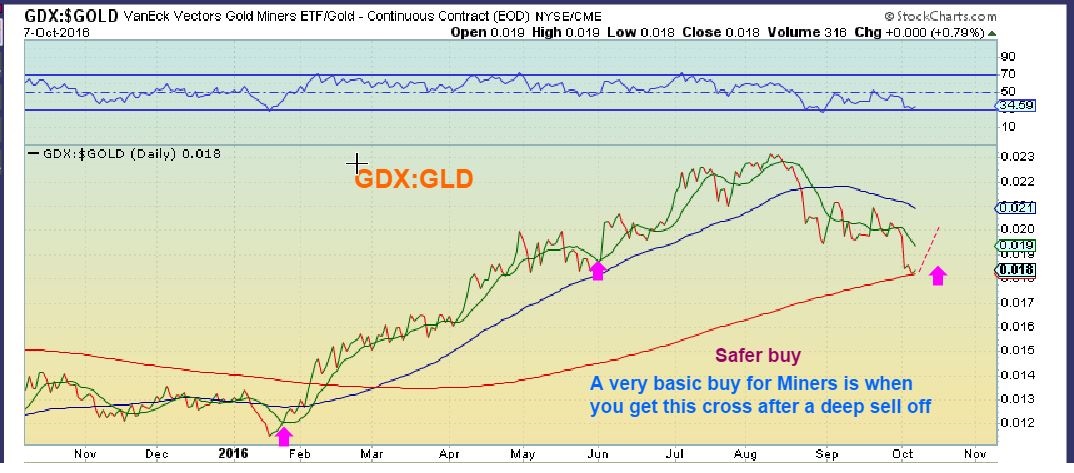
GDX : GOLD – GDX : GLD will trigger a buy signal shortly after the lows in Miners comes in. Miners out pace Gold over time. Read the chart.
.
One concern that has been brought up is “What if this isn’t an ICL and we get 1 more daily cycle?” Is that possible” I do think it is possible, but unlikely. Even if it was, we are due for a daily cycle low and we would see a bounce higher soon and we will know as time goes on whether we have an ICL or another daily cycle ahead. The best thing to do is take this trade and make some gains, watching it step by step. Lets discuss this…
.
Let me show you 2 examples of what this could mean using Hecla Mining
.
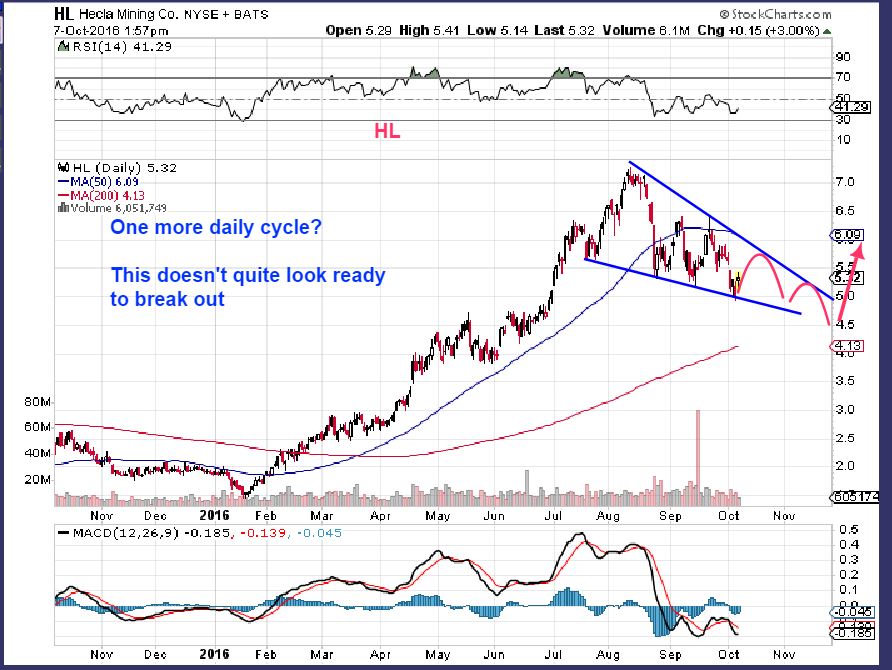
HL– You could buy it expecting an ICL, and you would get the bounce, then watch it do something like this if the ICL is in.
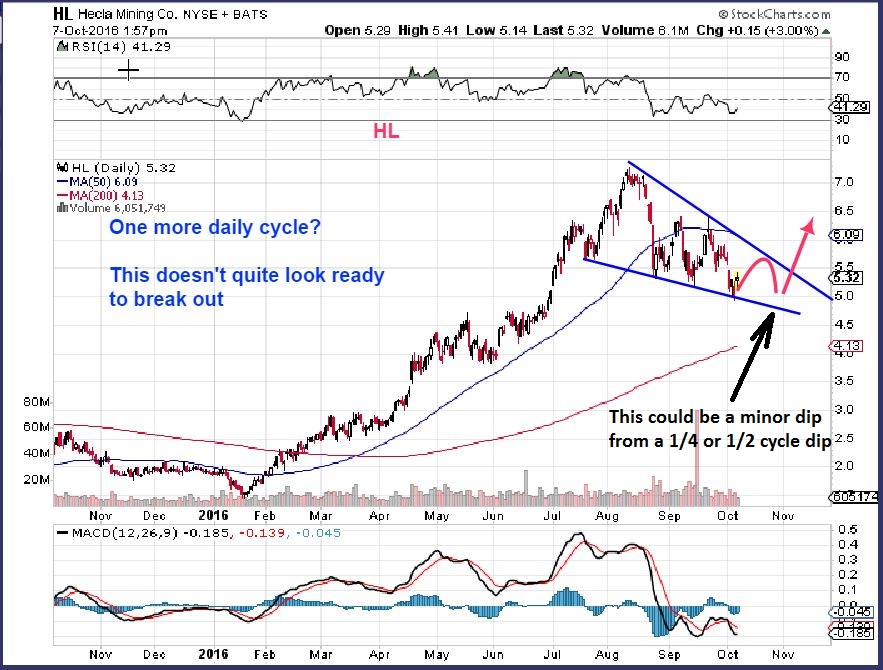
HL – If we have another daily cycle ahead of us leading into an ICL in November, this does look like it has room to roll over 1 more time, but decent %-Gains can be made now too. One could sell partial position after 8 days or so from the lows and ride the rest until things become clear if they are still unclear then.
When the ICL is in place, I actually think many of these miners could move 50-100% higher again, so it is worth the risk to take a position either way. Now lets look at charts showing how some Miners are setting up to a bullish look, and I will include HL in that mix.
.
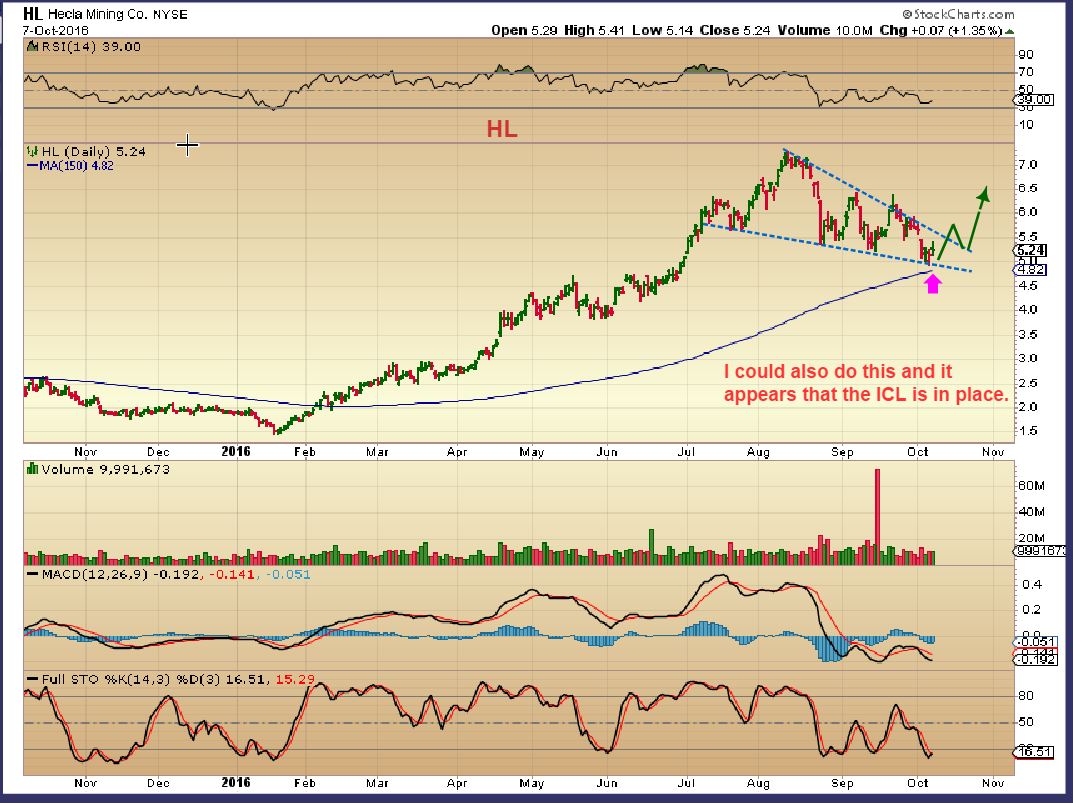
HL – This can be drawn too, by adjusting the upper trend line a bit. This would be showing that an ICL could be at hand, and a break out & back test would be next before a strong run higher.
Lets look at a couple more Miners and see if they have bullish set ups too.
.
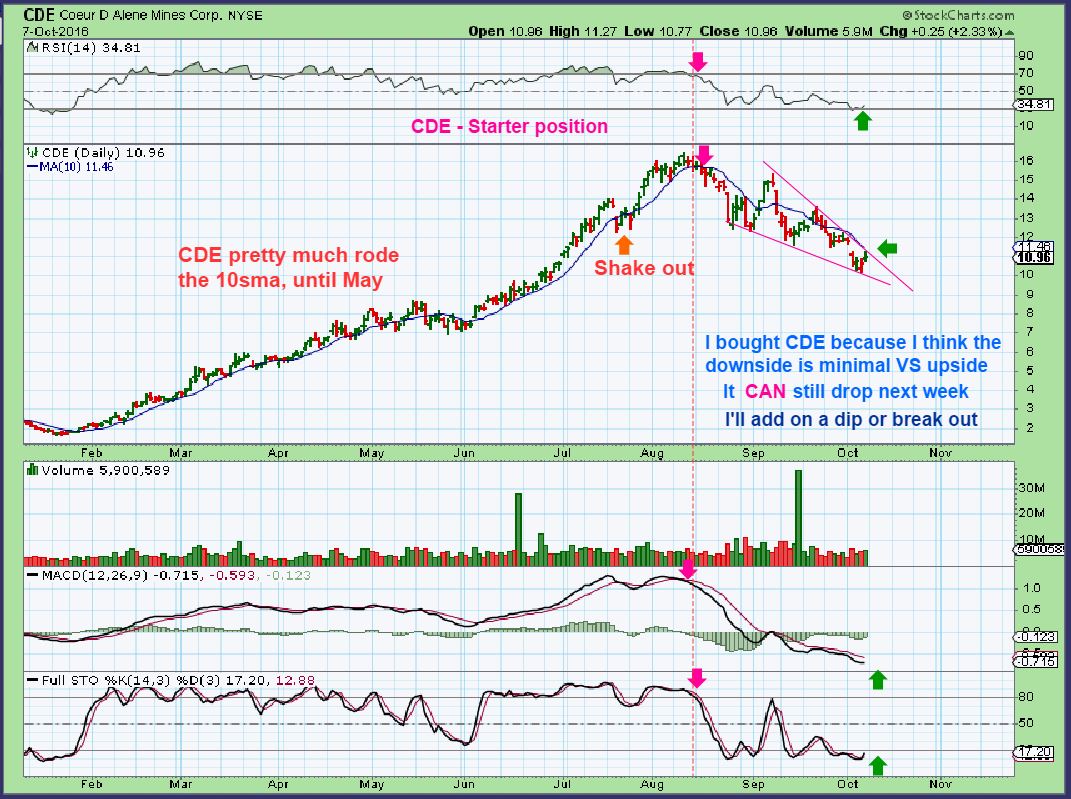
CDE – This looks like a low risk set up. It can still drop, so please read the chart.
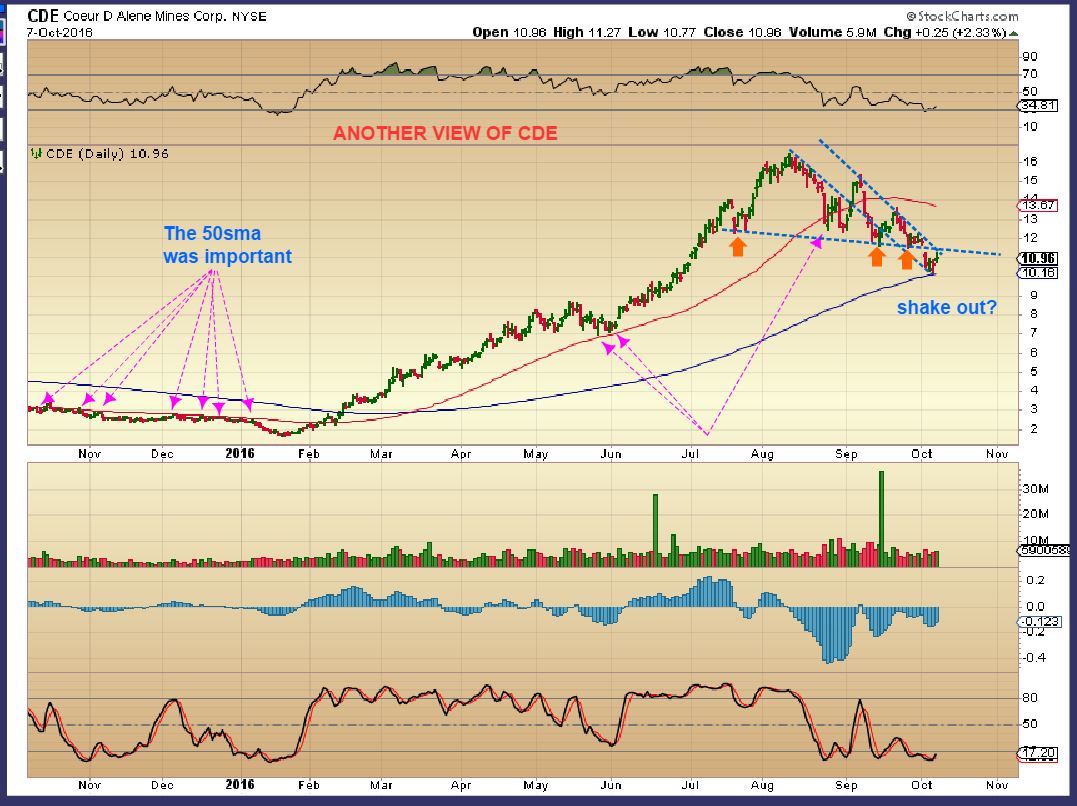
CDE – Another view is a possible shake out from a different pattern, a break higher would be a buy.
.
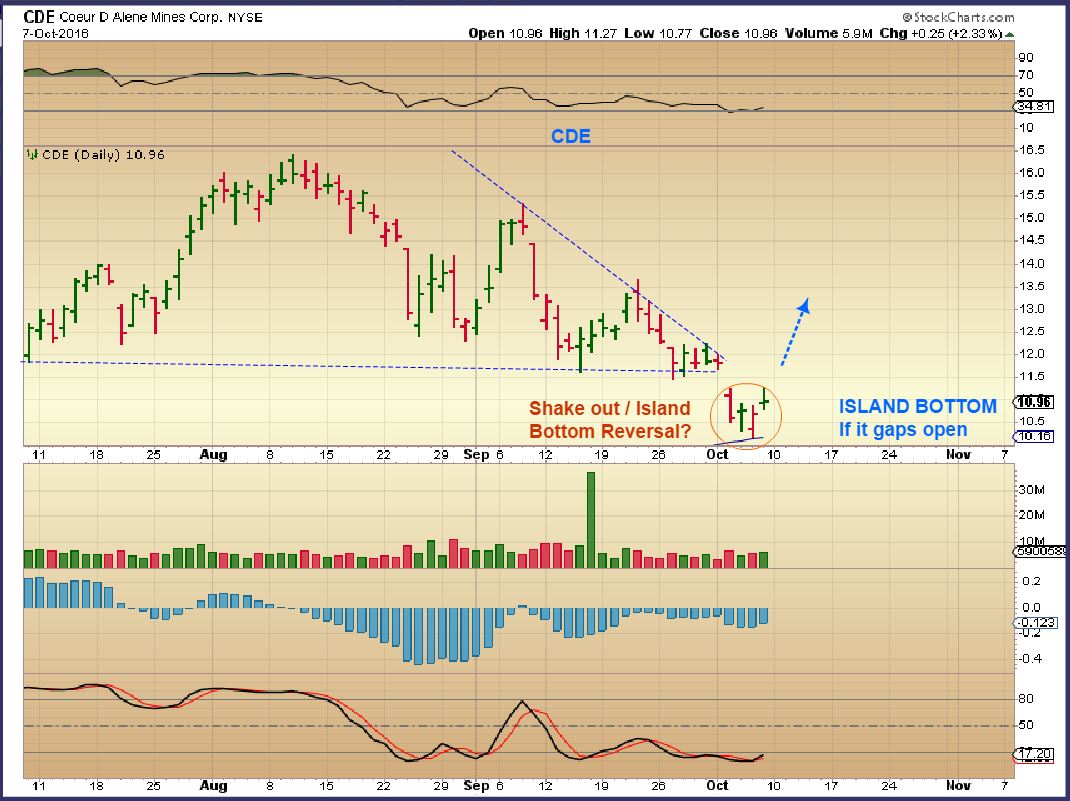
CDE ZOOM IN – A gap higher would be an island bottom reversal buy.
.
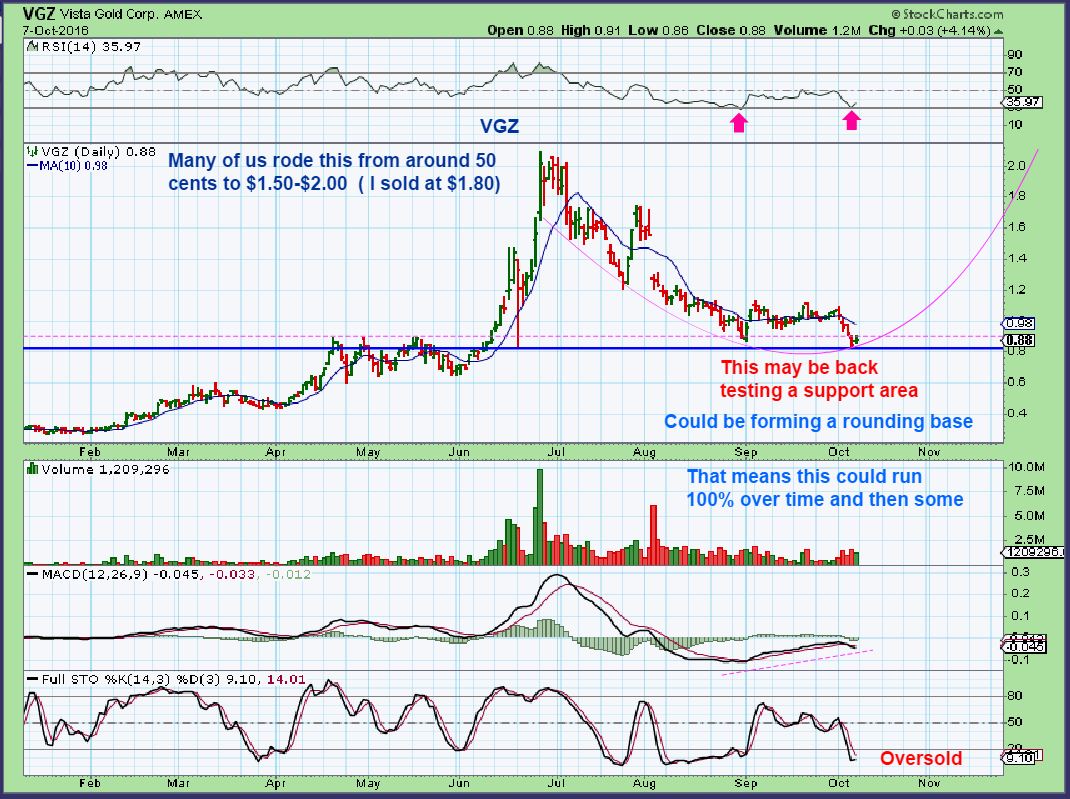
VGZ – If you have been here for a while, maybe you made huge gains on VGZ and MUX . It has corrected a lot and looks to be trying to form a round bottom base. If so, these should be the lows. This could double or triple over time just by running to former highs and breaking out.
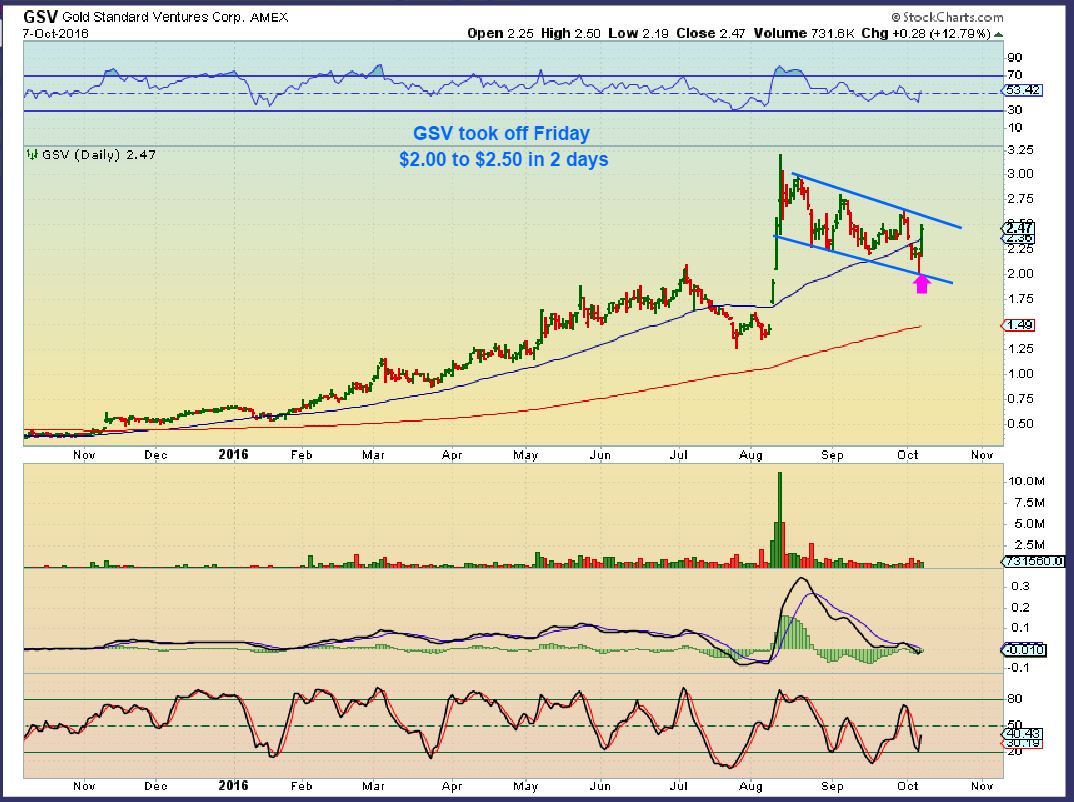
GSV – GSV took off upside Friday and was up 13%. It ran from $2 to $2.50 in 2 days now. When Gold is finishing up a sell off and some Miners start moving upside, it’s a good sign.
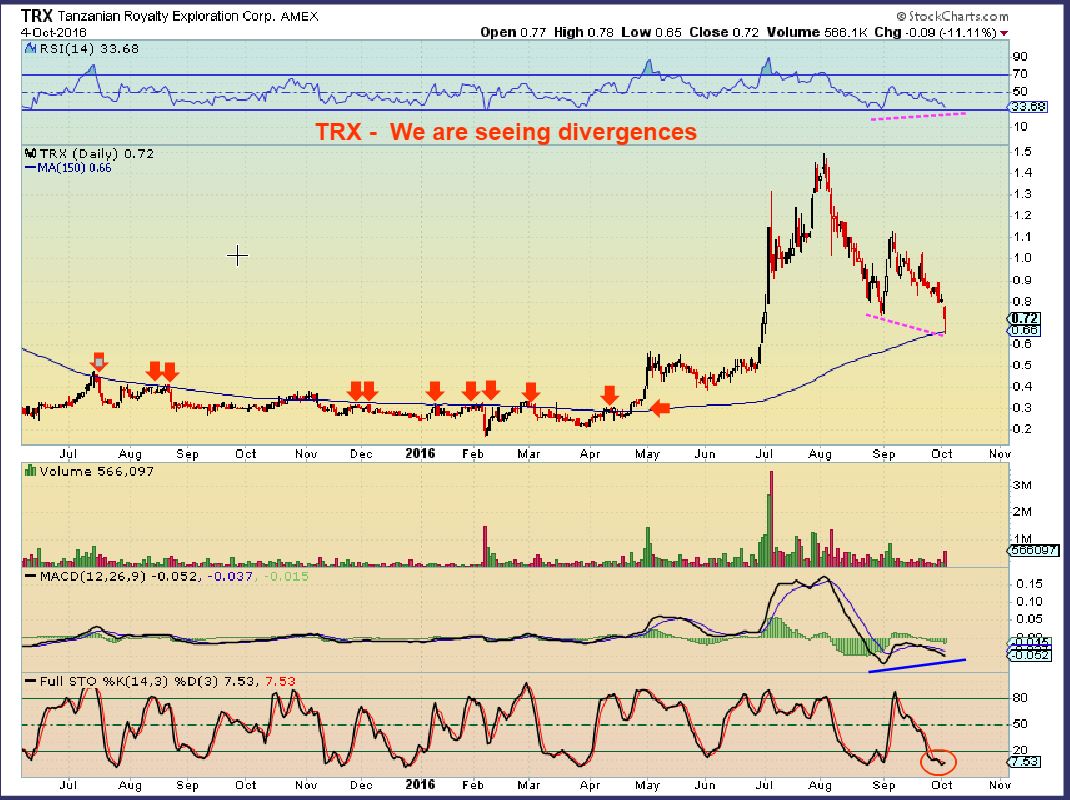
TRX OCT 4 – I pointed out the divergence on Oct 4th and possible support at 65 cents.
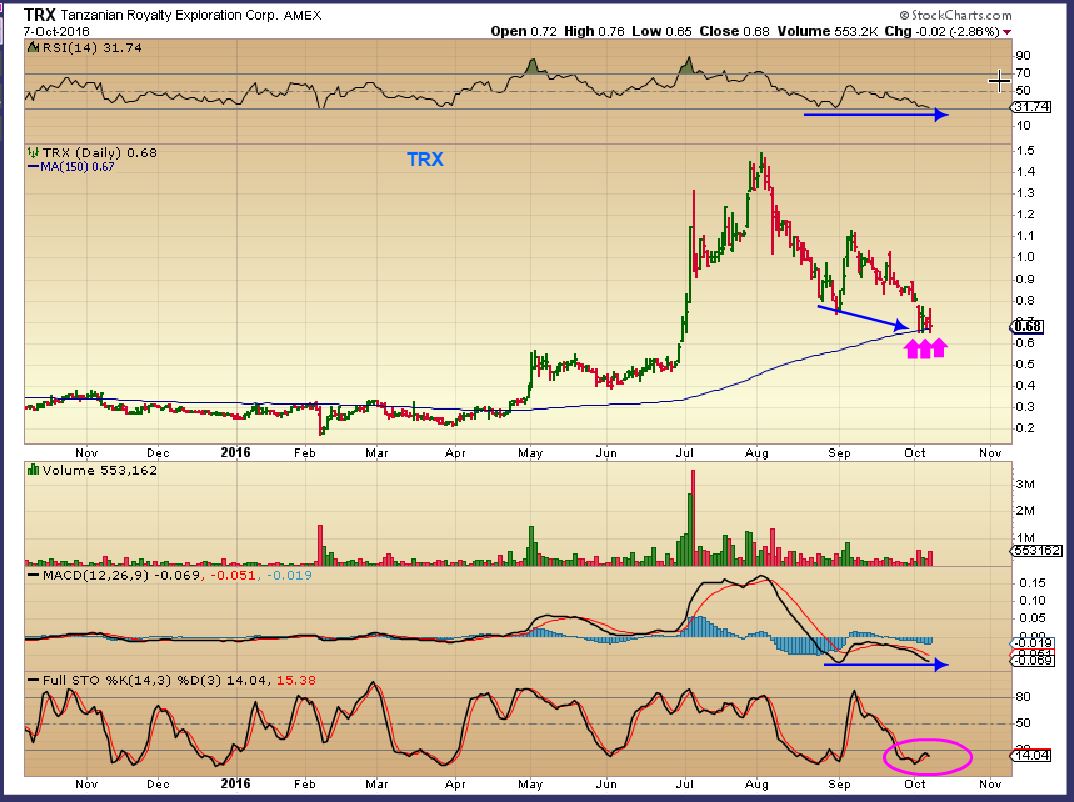
TRX OCT 7 – So far price has held that support for 4 days at 65 cents, while Gold & Miners sold off.
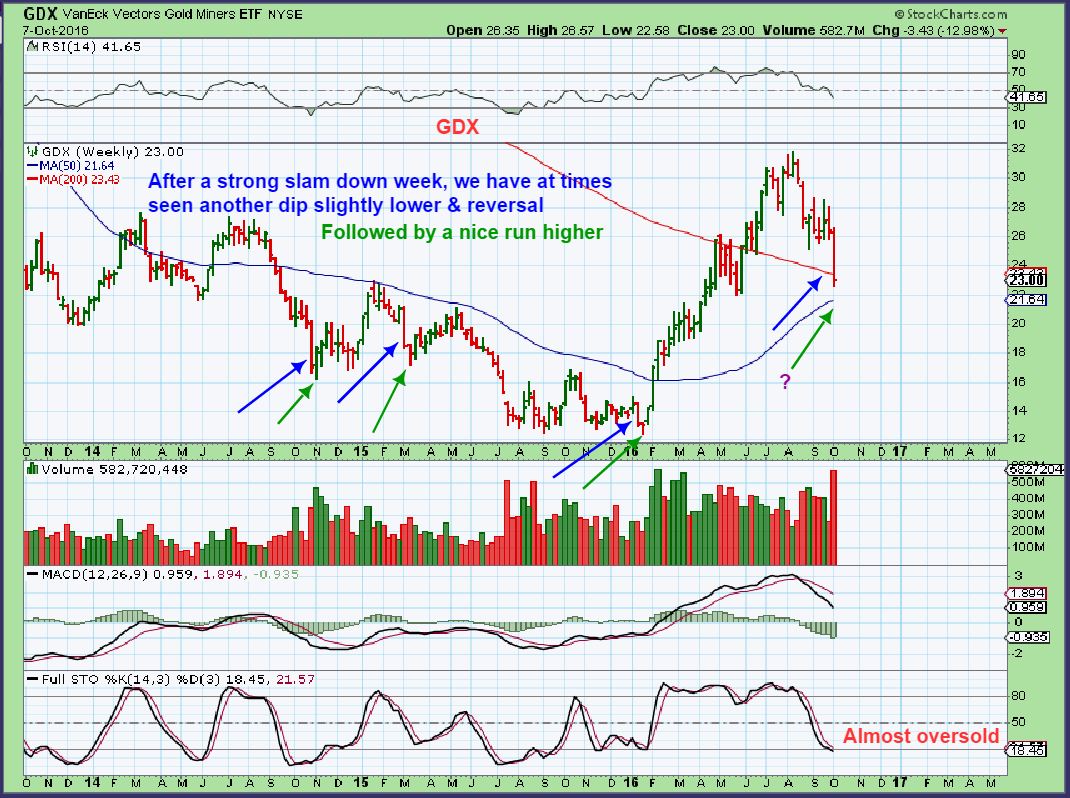
In Conclusion: We are still waiting on a swing low in the Precious Metals sector, but using cycle timing, we know that we are there or very close. ON day 25, these cycles usually put in lows around now or they can go to 30, 31, 32 days. Either way, it could be this week that the final lows are in place. There is no hurry in catching THE LOWS if you cannot stand watching your account values drop day by day. I will explain that in detail after signing off. The point is, if we are putting in an ICL, that is a deep meaningful low that often rallies for 2-3 months. We could see Miners rally right into the end of the year, so adding a few small starter positions may not be such a bad idea, but as I stated in prior reports this week, each must make their own decision. For some, waiting for that confirmed swing low is a safer play and since the rally could last for weeks and months, you will have plenty of time to make good money. ALSO – not all Miners bottom at once, and I will be showing trade set ups as they form, so that we can also rotate out of some good gains and enter into the next best thing. 🙂 I look forward to the end of this long choppy price action! 🙂
.
Enjoy the rest of your weekend and we’ll see if Monday or Tuesday clarifies whether or not we have our lows in place. As always, Thanks for being here at Chartfreak!
.
~ALEX
.
I want to release this Sunday morning , so for the sake of time, I’m not going back to proof read this report. Please excuse any typos 🙂
.
SIDENOTE LESSON FOR REPETITION: Due to cycle timing, I do think that we are close enough to the lows that starting a position in some Miners may be fine if one can endure a little draw down. We could have the lows in place or we could get another quick dip, but I think that we really only have about a week of dipping possible since we are on day 25 and sentiment is bearish. With that said- If you cannot stand to buy a position with $1000 and see it at $910.00 the next day ( Thats only down 9%), or buying positions with $50,000 and seeing it at $45,500.00 ( -9%), THEN DO NOT ADD YET, because Miners can easily drop 9%. Until we have a confirmed a swing low in place, this can be tricky. Picture this – You go in heavy with $50,000 and then get stopped out at $45,000 2 or 3 days later. Then the lows come in on day 28 and you are too frustrated to buy anything right away because you already lost $5000. Now you see the stock goe up 20% in 2 days. Happy? No. 🙁
I am a trader and that is how I make a living, and we have others here that are experienced traders, so we all have to trade according to our own experience and confidence level. I know that I am talking to at least 2 different groups of traders in my reports, so please know which group you fall into. YOU WILL NOT MISS THE MOVE if an ICL gets put in place next week and you are in cash, Miners will rally for Months and you will do well. Even if we had another daily cycle leading into an ICL in November ( Less likely in my opinion – I am 90% certain that this will be an ICL), it is still going to be a great time to make money ahead. This is why I have started to add to set ups that look good to me Friday. If CDE drops further, I will add after it drops and reverses. If it takes off and just runs higher, I will add there too, confident that the entry was correct. For the next few weeks, but I will NOT use tight stops, I will monitor positions. I will discuss these ideas further as we go forward and things become confirmed.
.
BY REQUEST – Look up CLD, SID, VALE, etc and I think that the metals commodity stocks still look fine. I was asked to look at ‘X’
X
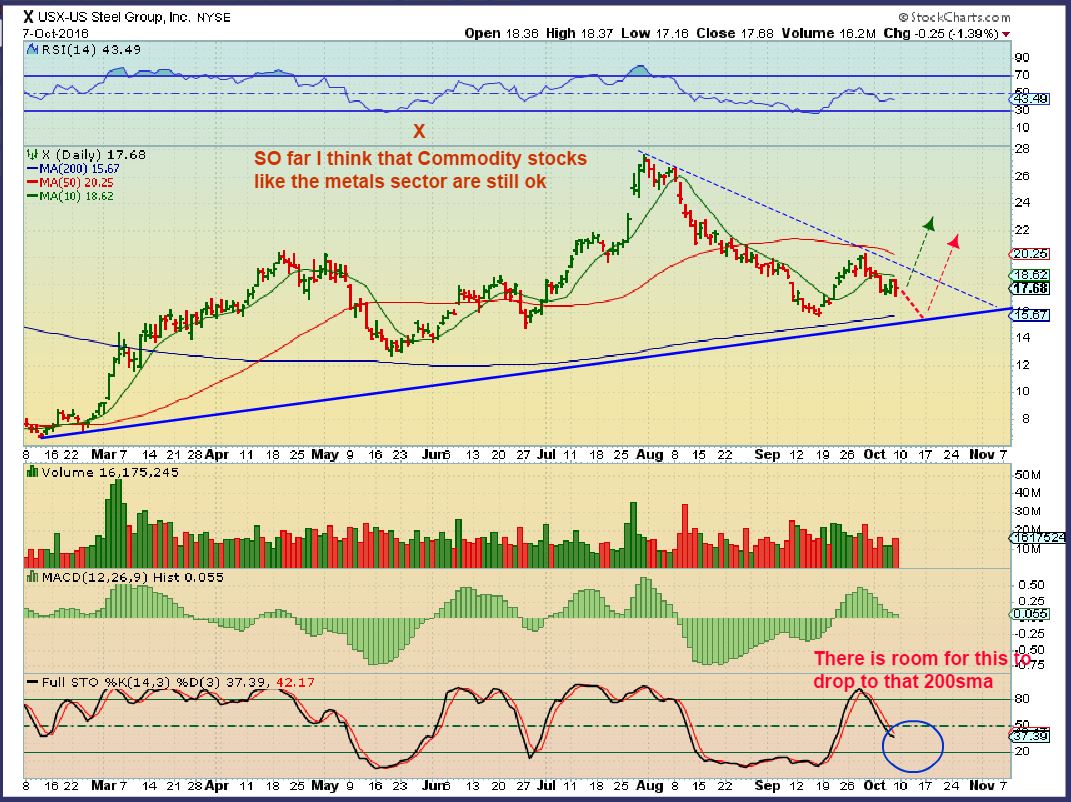
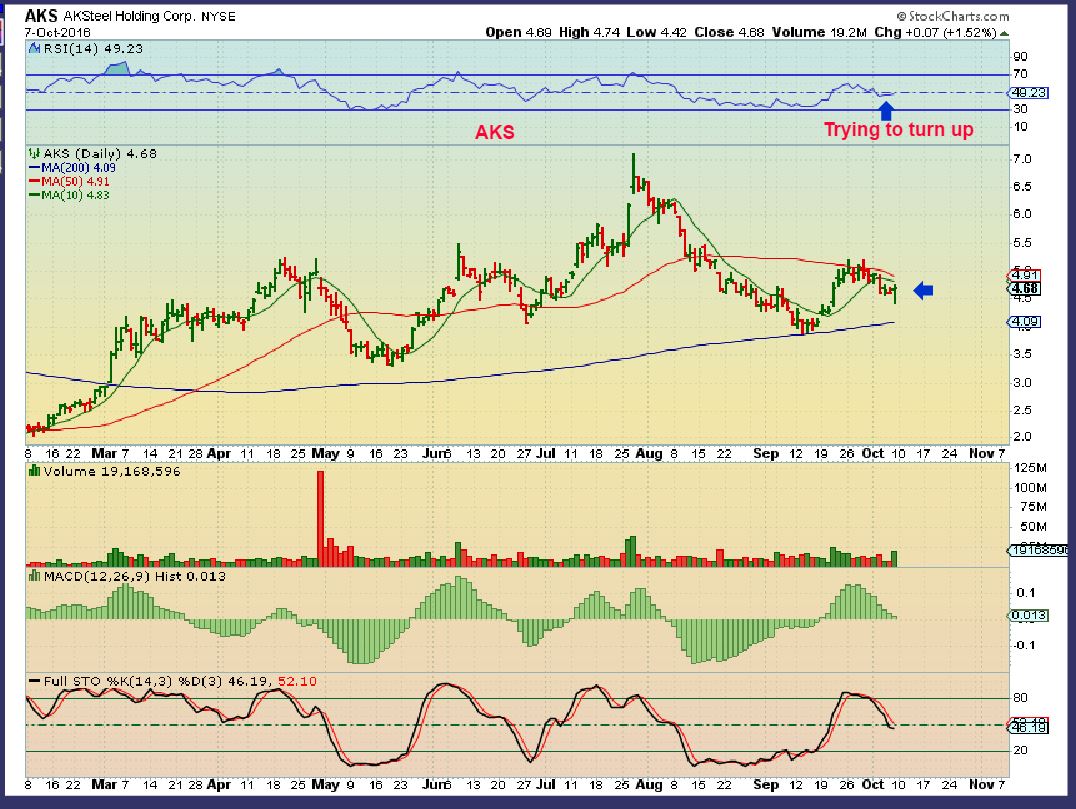
AKS – THIS LOOKS LIKE THE TWIN CHART OF X. By looking at another steel company, we see that it sold off Friday and then reversed back higher. The RSI looks like it may want to turn up, and so AKS is also dealing with the 50and 10sma as resistance, but lets see if it can break out higher. If so, that gives us confidence that X may do the same, since the charts are similar.


Thanks for the weekend report, Alex. Good stuff.
Thanks for the early report! 🙂 Takes me a while to let it all sink in so this is great 🙂
Great report, great to have it out early and be prepared for next week!
For those who are still learning the ropes, I have
visually back tested a simple method to avoid catching a falling knife on sharp
pullbacks (!) like AG now for example. It is guaranteed to miss catching
a bottom, but almost always catches the next uptrend early. Also, it will
avoid stress and heartache. I wait until a stock in my watch list has
WEEKLY RSI1 (yes, RSI one) equal to 100 and CLOSES above the WEEKLY 5EMA.
One can place a stop where you are comfortable, maybe under the low of the signal
bar or half way down if it is a large bar. I think that you can check the
weekly chart any day or simply wait until Friday for a Monday buy if you like
sleeping weekends. This method caught virtually all the metal bottoms in
Dec/Jan, but some after a 20% rally off the bottom. But that is a small price to pay for
a 6 bagger. The 5EMA can be used as a trailing stop also. I wait
until the close is below it. I use TC2000 to help me easily identify
these turns when they occur. This method will likely trail Alex’s calls and thus can serve as
confirmation. Alex mentions SID, AKS, X, VALE in this
letter. These have already given a
weekly buy I described above and may now be competing or have competed their
daily pullbacks. Keep in mind, nothing is perfect. For example, HL and AEM had
recent whipsaws in their weekly pull backs. But this beats guessing
in my book. NOTE: I am
not a professional trader, but I continue to look for ways to make money while
avoiding trouble. Gary
Thank you Glmus! That is so cool!
Johnny, I noticed that you had a question re IAG. I just looked at the weekly and it has not had a whipsaw even though the daily has been bumpy in September. If you like IAG you might consider buying using my method with an appropriate stop. Of course, if Alex says to buy, you could buy and perhaps double up using the method. The Jan 29, 2016 signal came at $1.45 close to a high of $5.87. But there were two weekly pullbacks along the way where the weekly 5EMA would toss you out, but the method would have you buy a couple of weeks later. I hope this helps. Gary
Gary, thanks for looking at IAG. Its now down even more ($2.50ish) from August highs. I have been using your method on the charts for my group of miners. It helps. I don’t look at the weekly charts and the EMAs as much as I should. Your posts definitely help. We are here in part to help each other and I appreciate yours!
GIMUS what is your take on AG now? and IAG? any favorites to buy?
Neither are close to their weekly 5EMA. I would watch what Alex has to say – quiet so far.
I just looked and none of the metals have a 5wema buy. The only one that had one in the last couple of weeks was GSV and I would have taken a small loss in that one. Today looks like a dull day for the metals. All the action seems to be in the oils, but I am not trading them awaiting for the metals to pop.
Gary, thanks for sharing.
Studying some charts tonight….see that 94 millions shares on BTG on 9/16? Wonder what that was all about…that’s way above their normal average…..? Someone somewhere really wanted it around that price which was $2.76 for the high/2.62 for the low….now it’s sitting at $2.22….
Hello Tammie. I found some info by googling “Research Reports on Gold Equities — B2Gold”.
Happy Thanksgiving to all the Canadians – our markets are closed today, but it looks like the miners are moving up in the pre-market. A few of the oil stocks as well – SDRL and WLL are moving – up over 4% on lots of volume
Yeah, oil really getting a boost this morning. I was ready for a pullback but I’m definitely good with this as I’m still pretty long energy here. Glad I didn’t get all shaken out by a little pullback late last week.
I’m committed to this oil trade so I’m naked without stops on most – I don’t want to get shaken out if WTIC is going to dance around the $50 mark for a while, and I don’t really want to trade in and out on DCL’s.
Oil moving up strong this morning after opening lower overseas last night. I was preapring for a pullback myself. Ken, or anyone else, where do you have the count. (5) of 3 looking for wave 4 pullback shortly (in a few days likely)? Wave 2 was a real B, so maybe more of a zig-zag flat pullback (alternative from wave 2 impulse down)? That would also put a handle on the cup!
Agree Cason….I am seeing that Oil is in a wave 5 of 3 currently.
I would hesitate to chase at this point, getting overbought at these levels but 3 of 3’s can stay overbought for longer than one expects.
Can you show us a chart of your alt. count?
Not really an alt count – here is my primary – USO, 1 hour chart.
my (ii) of 3 looks a bit off. The alt would be that (i) of 3 was longer and we just finshed ii and started iii – that would be really bullish, but that’s not my primary thought. I also see support moving up (50-day) towards USO $11 and depending on how high we go now, would be near a 50% retrace of current move off of wave ii lows. A squeeze higher now and then a shallow iv to a 38.2% would be pretty exciting. Yes, I would not initiate a fresh long here either, but wouldn’t just auto-sell either.
https://uploads.disquscdn.com/images/3fa2e80cf1a6e99a319a5ac0118c139656f4d15d260d27954e1fd2edeb4f0c49.png
big THM jump
13% didn’t stick,… but now got a possible higher high/higher low daily candle for trend change
Alex, I’m looking at CPE and ECA both are steadily moving higher. CVI looks like its ready to break out higher after consolidation. Which charts do you like better with OIL moving higher?
I’m interested in CF’s comments about these two too. I have full positions in both of them – but hesitated on going into ECA because of the overhead it has to contend with soon. CPE has clear blue sky ahead – it reminds me of CDE with a steady and persistent climb. It seems the stocks without overhead to contend with tend to stay stronger whenever we dip into a DCL. I would only ever buy one of these on a dip though (minimum 30 min or 1 hr chart) – every time I get this idea that something is breaking out I get burned, so I just decided to leave the breakout trading for someone else to enjoy.
I like both CPE & ECA, but what R.Byram said is valid…CPE breaking out with no overhead resistance does give it a good chance to run strongly.
I like CVI here, shook me out this summer.
Alex, you said before, that you had an indicator that you used with great efficiency with GDX. Did it give you a BUY yet?
not yet – I would report it when it does
At least we are getting a chance go get in, right? We went sideways last December before the take off, but we didn’t know at that point yet that/if the bear was over. Once it took off, it locked everyone else out. So, I appreciate the time to leg in before the next rally! 🙂
Me too! 🙂
In the movie “World War Z” there was a 10th man rule. Basically it said when everyone thinks the same thing it is the 10th mans role to think the opposite. If everyone here believes that the GOLD bear is dead and we are starting a Gold Bull market. What are the chances that the Bear is not dead?
An EWT guy that I read thinks that we are still in a bear that a rally is nigh – likely multiweek. Maybe he is the 10th one. 🙂
in this group people are more bullish on gold but there are still a lot of bears on st etc
Have you ever looked at any COT reports since 2008? 🙂
Sigh…..
Twitter down another 13%………
$25 to $17 in 2 days, ouch
Just skimming through the markets this a.m. – not in front of the screen all day- so far…
CVI shook me out in the summer, and I like the looks of it too. It is breaking back over the 50SMA & has a nice base.
PDS has been steady
AREX, DNR, OAS, CVI, AMRS ,AXAS, CRK, SM, SN, TVIA, Doing well today too
CLD, MDR, VALE, CRC, etc etc
MIners making some 3-5% gains , but basically still sideways, no real change to speak of yet.
Anyone else watching XLU? Utilities, look primed! IMHO
Not really. Money flow has been “risk on” and flowing into bio, tech, semi’s, energy, etc.
AMRS – turning out to be a very nice trade, almost up 100% from the first buy. I still think this wants to go to at least $1
Its a buy the dips trend now ( 10 or 13 sma)
Yes. I missed that one.
Very nice trade Alex…..
Had it and dropped it. It got boring for a while! I’ll have to work on my patience.
The USD is just staying really strong here, so not much help for the miners.
Can someone tell me what the diff in all the gold prices I see….? Up top on this page it’s up $2.40…..kitco site when I pull it up has up $1.50…..marketwatch and cnbc has is up $9…..?
marketwatch and cnbc has is up $9- this is Gold Futures
Kitco.com gives ‘live’ Gold price
and the Kitco feed to this page also gives the ‘live’ Gold price at the time it was refreshed – so if you refresh (F5) this page it should give you exact same price as it is on kitco.com
Thanks, Conrad! I thought I had been refreshing my page…but I hadn’t….so couldn’t figure out why the kitco prices were different….:)
CNBC and marketwatch show you the price change since PIT CLOSE, which this morning was as of last Friday at 1:30 PM eastern. Any change AFTER that is considered ‘after hours’ since the pit is closed and it goes to global futures (electronic). That’s why very often when we have a big Fed day (which is at 2 PM), gold will actually be flat the next morning but if you turn on CNBC it looks up/down $30. So today you were actually seeing Friday afternoon’s move. Also, there is often a small difference btw the Futures (current front month is December) and spot.
Tammie, this site is handy too for live gold prices. http://www.livecharts.co.uk/MarketCharts/gold.php
Two things:
1. Does anyone follow SLCA? I am not suggesting a buy here, but it has been slow and steady since March.
2. A trader I know is going long GLD today for a ‘rise over the coming months’. I don’t have a buy yet, but nice to know others are also looking for a multimonth rally.
Gary
For accountability:
I am adding the 2nd half tranche in SLV Call Leaps before the close.
Looks like GLD, SLV, and GDX will close back inside the BB’s.
Not to mention Alex’s DCL timing and how oversold PM’s are……
I’m looking at adding silver at some point before long as well, but for right now have only accumulated miners. Fairly slowly since we seem to be given the time to do it.
Oil closed pretty strong but energy stocks pulled back from initial push about 1000 and never got anywhere back near morning highs, which was a bit disappointing.
Alex, loved the chart of VGZ above. Sweet looking. So, I had no choice but to buy today! So, I’m ready for it to take off!
If we bonk around at the bottom for awhile could it then start to look more like a bear flag? Right now cycle timing is keeping me leaning bullish.
For the record, I got a weekly buy in PGLC, but the stock looks poor. There are several metal stocks that had great runs, this is not one of them so I will not take the buy.
Hey Gary – using your system you mentioned earlier today…with the RSI 1 at 100/5 EMA…..it seems like EPE, ERF, AREX…might all have “buy” signals based on that…..is that correct? Just wondering if I am looking at things correctly according to your system or if I am missing anything – thanks for the info!
haha! …..
https://www.youtube.com/watch?time_continue=3&v=Fq_ZosSy_9I
LOL!!!