What Do We Have Here?
I just want to get right to the point here, lets look at the charts.
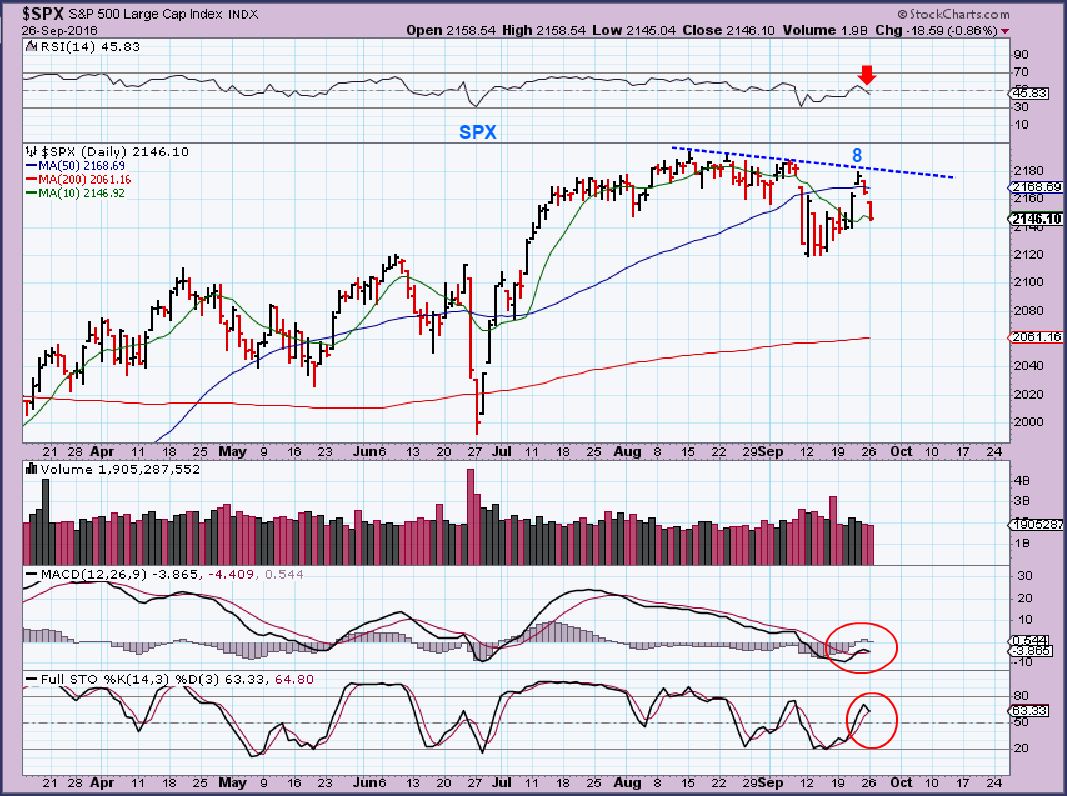
SPX – This is not looking healthy and it should be monitored closely if one is long. If this were to cut below the lows near that 2120 area, it would be a failure. Let me show you why it may be worse than it looks…
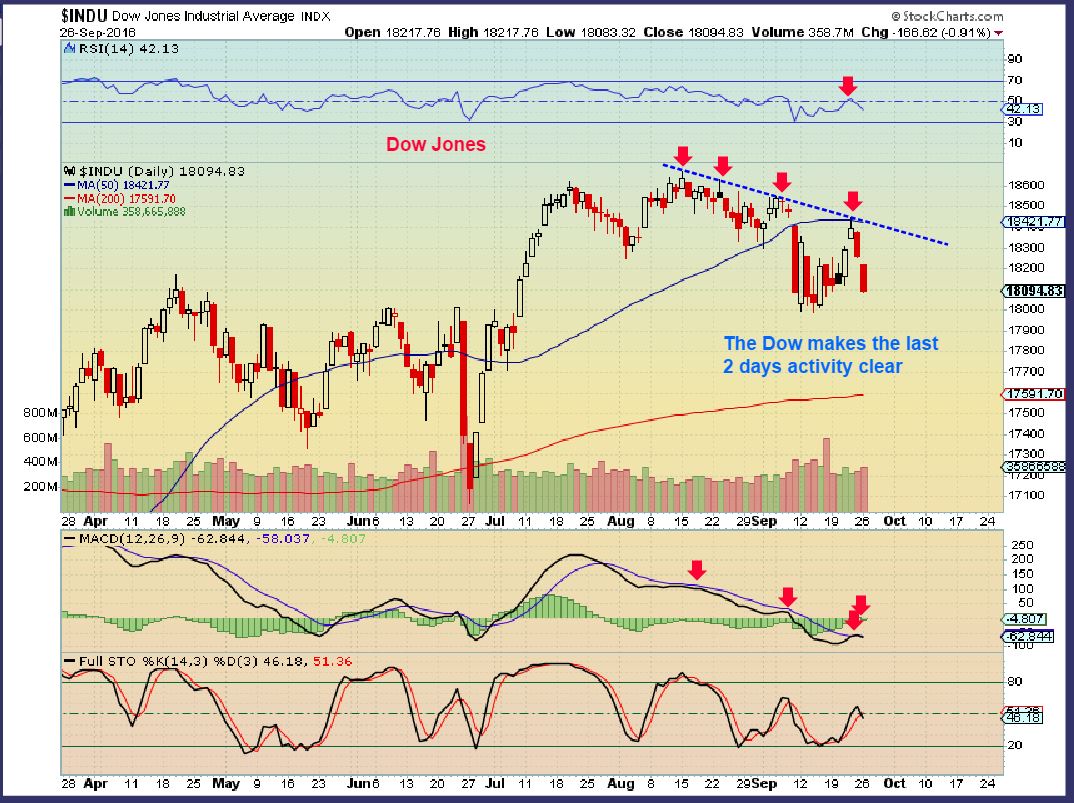
The DJIA and NYA and a few other areas really show the weakness that has come about from just the last 2 days of market action.
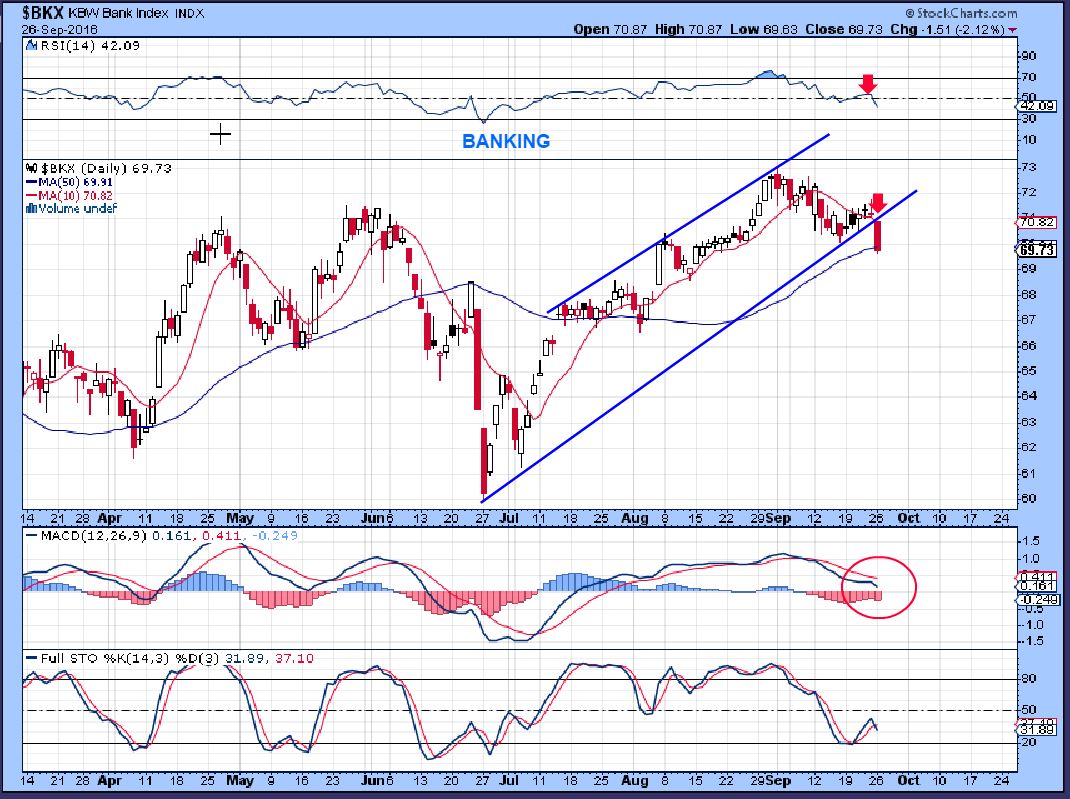
BKX – Banking. This also looks quite bearish all of a sudden, since it broke the Sept 12th lows. This set up is bearish in my opinion. This adds to my cautionary note about the SPX, even though the SPX hasn’t violated anything yet.
.
Moving on to OIL & ENERGY and GOLD & MINERS and honestly the picture is not a lot clearer. Let me just quickly show you what is going on, and you should be able to draw the same conclusion as me at the end of this report.
.
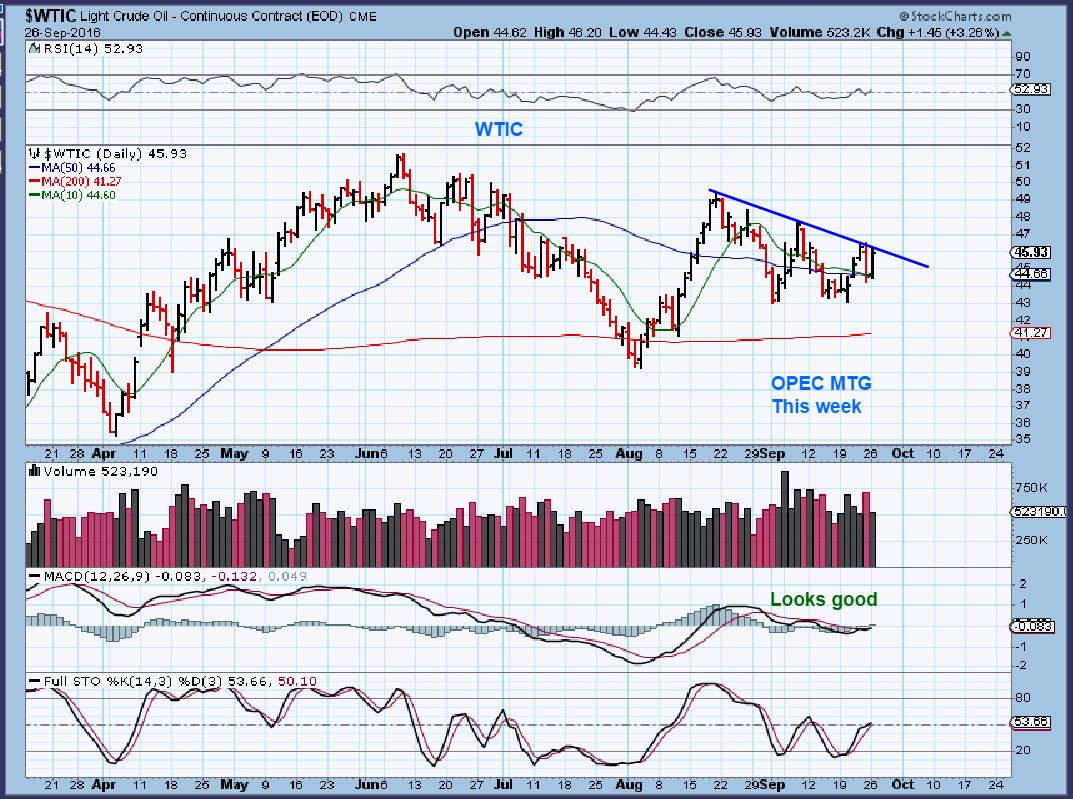
WTIC – Oil looked excellent today, up 3.26% . Fridays big drop was pretty much undone, Oil remains above the 50sma, but…
XLE – The XLE ( And quite a few of the energy stocks that I follow dropped. Red) . XLE is below the 50sma and lost the 10sma today. That was with OIL up 3.26% ??
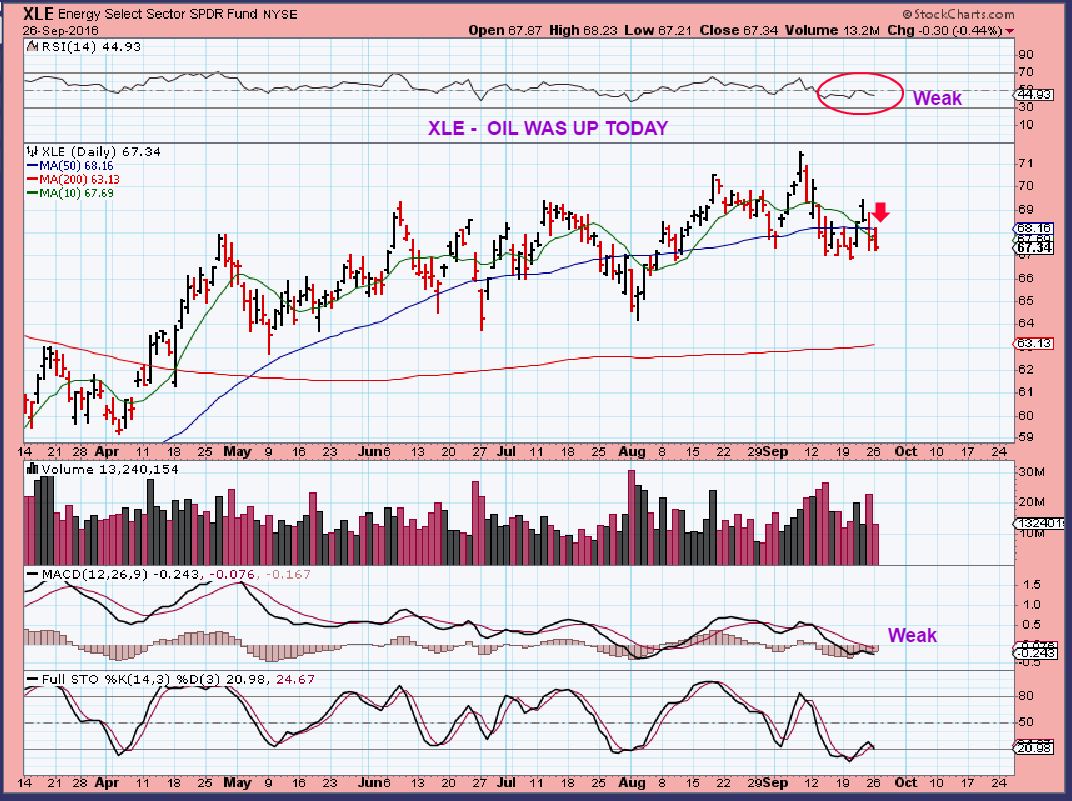
What is up with that? I look at Gold & Miners and I see the same thing.
.
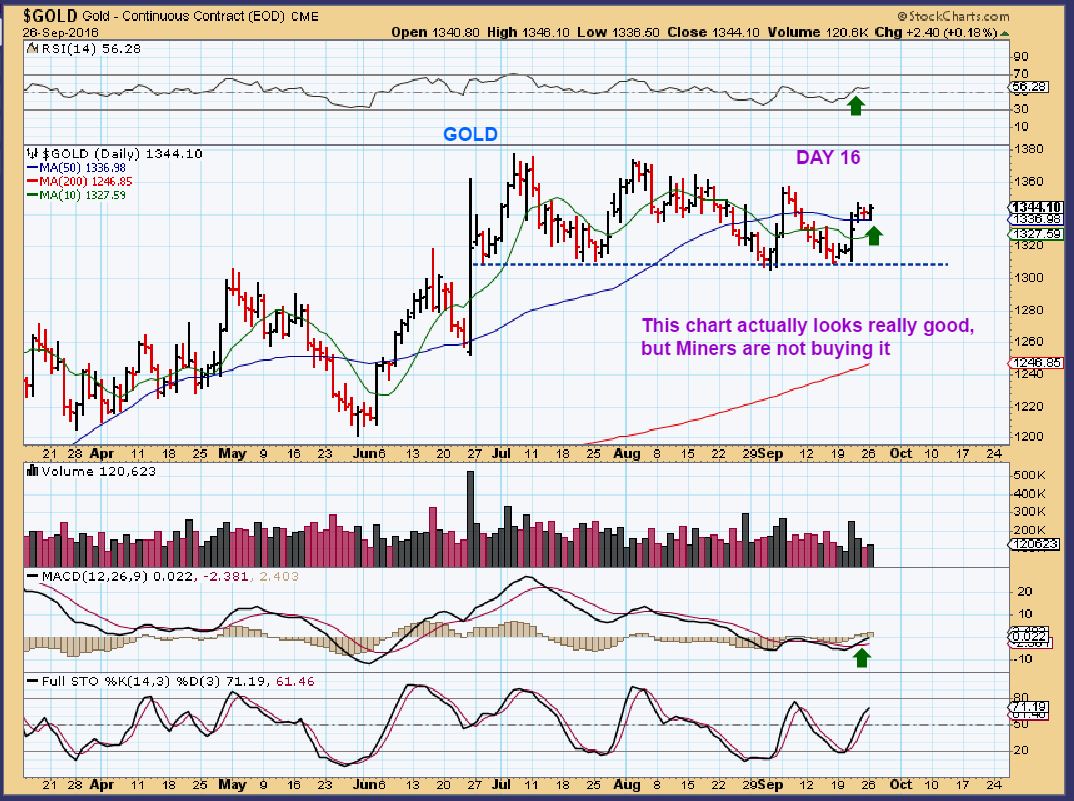
GOLD – Gold held the 50sma and was up today, and it has been bullish for the last 4 days. This chart actually looks good too, and the USD remains weak in my opinion,but lets look at Miners.
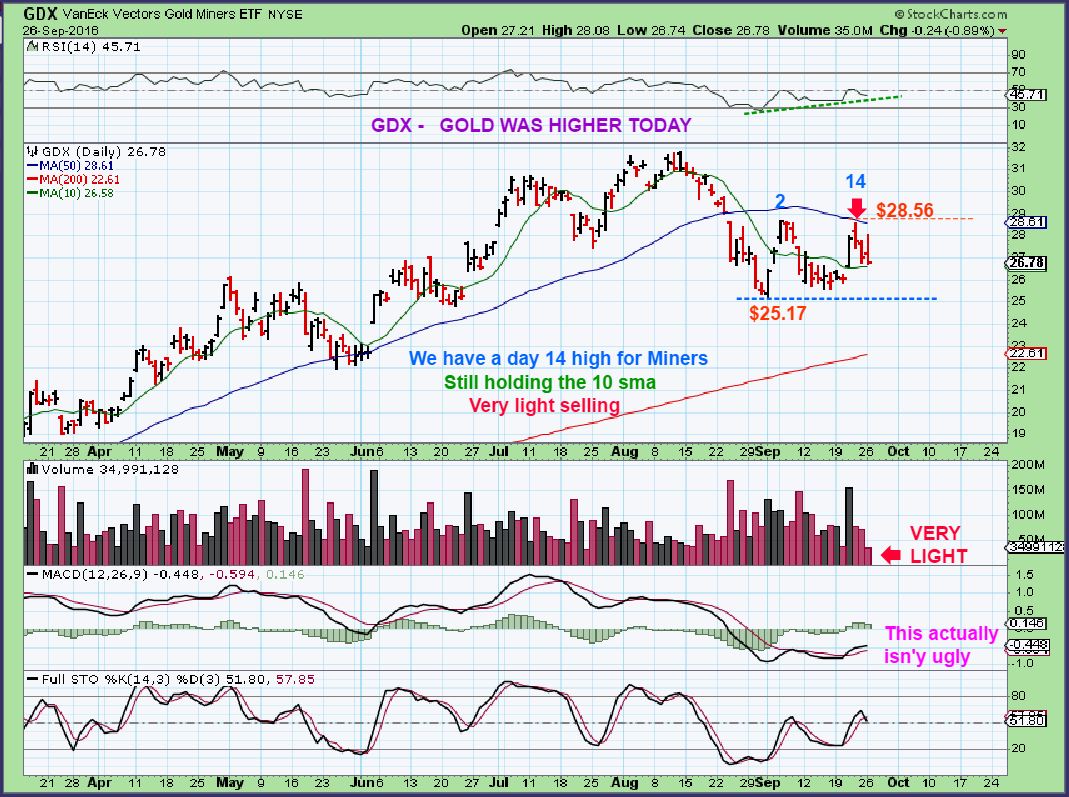
GDX – GDX has been rather weak and bearish for the past few days. It got rejected at the 50sma and dropped again today while Gold was Green. This isn’t an UGLY chart, but it is a bit difficult to explain with Gold higher. Read the chart for additional info.
.
So what we see from this is that after Mondays trading, GOLD & OIL LOOK BULLISH, THE XLE AND GDX look weak. That is inconclusive and leaves the picture hazy. I dont think that the Miners chart is bad, but if Gold drops, what will miners do if they are dropping while Gold is green? Gold is above the 50sma, and GDX is below it. It’s a mixed picture.
.
I have mentioned this before and it is worth mentioning again at times like this:
There are definitely times to go in heavy, and using leverage can even be acceptable and rewarding. There are other times, however, when uncertainty pops up and the picture gets hazy. At those times, it is important to protect your funds. We went to mostly cash a while back, and after the steep sell off in Miners, I did find some encouraging looking set ups forming. I didn’t recommend using leverage or 3x etfs as though we are at an ICL, but I did say some of these set ups in Miners looked bullish and could be rewarding. They still could be and I did take a couple of small positions in case we did get some upside follow through. The warning was that we may just bounce to the 50sma and be rejected, and so far the 50sma has capped the GDX.
.
So at this time Miners and Gold are not in sync, and Oil and energy stocks are not in sync. We have to see how this uncertainty plays out. Remember that there will always be another trade, and if any current positions that you hold do not look right, it could be best to cut it loose and wait for the next set up. Stay Frosty and watch your positions, honor stops, until we get a bit more clarity. This will take a little more time.
.
~ALEX
.
SIDENOTE: GDX was down over the past 3 days with Gold green, so that is concerning, but the chart isn’t ugly yet. The selling was quite light in both GDX & GDXJ and took price down to the 10sma.
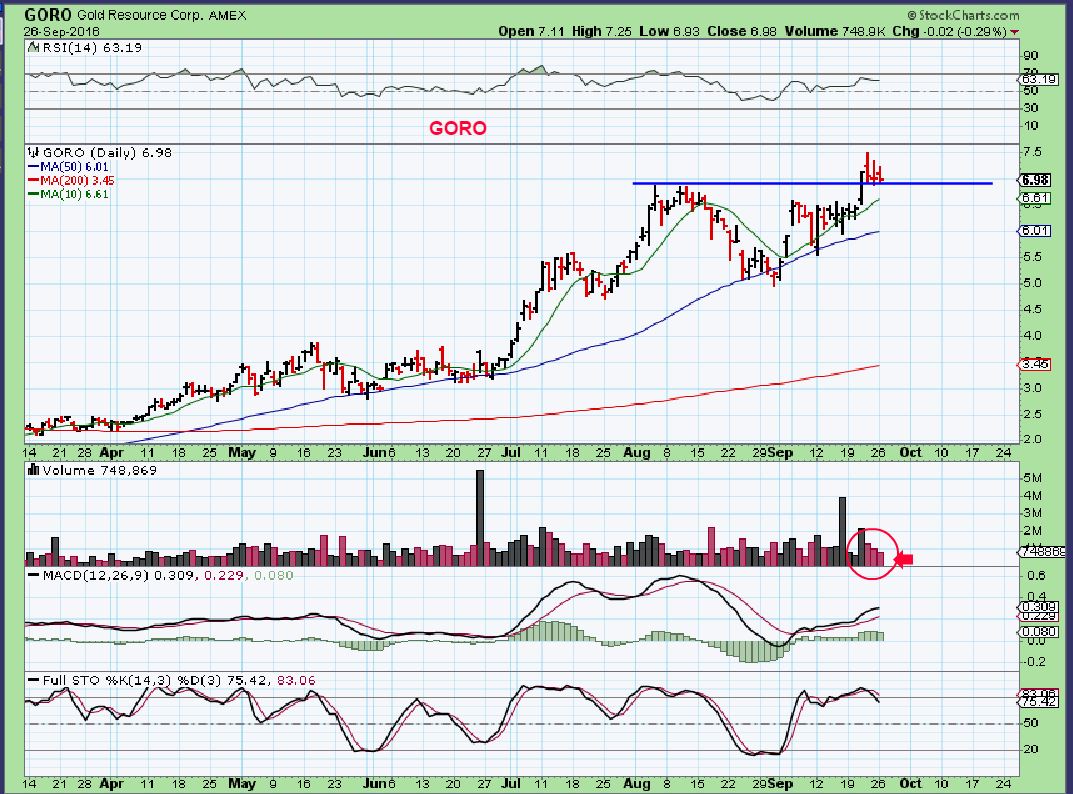
I looked at a few of the better looking Miners, and they also remain decent set ups, so again we have to wait and see how this hazy picture plays out. GORO , for example, is a break out and back test so far. This is not ugly, but what would it do if Gold sold off? So lets remain cautious.


Alex you definitely clear things up and have a straight forward way of doing it! Thanks for the road signs and map. As you know I’m more of a leverage swing trader so I have been in quiet mode like a hunter waiting for the right weather patterns. It certainly seems that more time is needed to clear up direction. Day 14 is interesting. I just wonder if we stay sideways for the remainder of the week on Gdx if this is a daily top in the making. Thanks for the early report.
G-Morning Shermo,
Yes, there is definitely a time to be heavily invested and a time to keep it light. There is ALWAYS going to be another trade set up and an easier entry to get some follow through.
As I write Gold just dropped straight down, but only $4 – $5 so far. I would LOVE to see a POP in the USD and that DROP to an ICL that we have been expecting. AT least we can take positions and ride them and the trading will be good for weeks.
This Pop & Drop & Pop sideways Chop is boring and difficult to benefit from. Patience will pay off : )
https://uploads.disquscdn.com/images/6dd8ecf8c814e7ce57ceb16f31bf8f3f95e77214881050a8f6a13410944e293a.gif
Nice work S.P.P.
LOL
haha…..love it…Underdog coming to the rescue.
I was watching ‘RICE’ yesterday and wondering why it wasn’t higher with OIL up so much.
Announced they are buying Vantage for $2.7 Billion including debt. And they say there is no insider trading? Someone knew something with that fake break out and deep sell off that followed. : )
Thought you might find this an interesting read – love the pic they chose to lead it
https://www.bloomberg.com/gadfly/articles/2016-09-27/rice-energy-vantage-energy-deal-gives-opec-a-black-eye
Got it, thx
TWLO is breaking out from that cup pattern that I mentioned. Good looking charts ( I.P.O., so not a lot of history).)
Alex, looks like we need to play defense here. Is it still likely ok to hold some energy- some I’m held since early AUG lows were identified? NAZ was a highs just last Thursday. Am I ok with stops or should we just cash out of TQQQ while we can? Would we be better to go to all cash?
It’s hard to stay away for me sometimes, but seems like the smart move. The chop is tough to make much money in unless you are day-trading, which is definitely not my specialty. With Fed out of the way was hoping we put in a trending move in by now.
Is anyone else seeing Gold sell straight down and a few Miners going higher? Definitely holding the recent lows from the miners steep selling.
Interesting,
Look at AU, GORO, NG, HMY for example.
AU Has strong volume and rising.
Yes…my AUMN is actually up a penny….my silver stocks I bought not doing so hot though….FSM and AXU have gotten creamed the past couple of days….:( Trying to decide if I should just bail on them or keep holding…
It looks to me ( At this point) that some are going to try to hold the lows of Sept 1 – even if Gold does sell down.
That remains to be seen, and GDX is just doing a gap fill so far today, while some are losing the Sept lows, like FSM did.
F.W.I.W. – I owned ASM and sold it the other day just because it broke the 10sma, but it isn’t waterfall selling down like I thought might happen if it lost the 10 sma and Gold sold off, so it too may hold the Sept 1st lows.
Need more time, but need to honor stops too.
BTG is sinking 10% what happened there?
not sure but shows that risk/reward isn’t there to buy miners here. Sure some are slightly green light but can you pick all of the right ones? Nope. I’m just going to have to wait. So in that sense this is good, lower price to purchase in the future.
oh crap, my stink bid to add to my ‘core’ hit for BTG. I didn’t see that coming this morning. May have to drop it; we’re not to the ICL yet. Yikes!
I couldnt find anything on it, and then this came out 5 minutes ago ( Were insiders selling it off?).
.
http://www.marketwatch.com/story/notice-of-philippines-denr-department-of-environment-and-natural-resources-audit-results-2016-09-27?siteid=bigcharts&dist=bigcharts
NG, GORO, AU – still looking good with gold selling off.
I say this so that anyone thinking that they should buy dust or go short Miners if Gold sells off, will see that this may play out a bit differently.
Gold may sell down, and Miners did sell down in August, that might be enough for some of these Miners , if they are now under some form of early accumulation.
Still in all cash, waiting to see some more obvious values. Plus, it’s comforting that cash in the trading account is always “green.” On an unrelated note, I’ve developed a new lamb meatball recipe (based on an Afghan dish I tried in Burlingame)–so gud! *bort!*
Yummmmm, Lamb!
Not that I am the biggest fan of Head and Shoulders Patterns, here would be a good one if Price breaks the Neckline on Oil: https://uploads.disquscdn.com/images/b76772964e69beb332ad1af602c752fb12f2addcbbec4b2669181eb860c43042.png
I like it. Fingers crossed.
Fingers crossed also for a fractal repeat of this double bottom pattern of DNR from last jan/feb (4hour charts.. then & now) https://uploads.disquscdn.com/images/57616b6573246d4807e9b561bb12a1fe057db846bc52fcd9771f6f101f3e5eae.jpg https://uploads.disquscdn.com/images/d61ac4d5f373e7b66040f6109bb14db47b40d7aced58ebacc6a20899ae160631.jpg
Just as a cautionary note – compare the MACD at the 2 double bottoms . Quite different / less bullish this time.
well she’s putting in a turnaround… but will it stick??
… and PGH may have just done a july-sept trendline shakeout?
left behind a long candle tail on 4H chart, and now back above TL
I’ve been watching my PGH all day…..so glad I didn’t bail yet – it seemed to be holding up well this morning in comparison to some others so thought I’d just keep eye on it as it went back and forth a bit……walking away from my computer today for a little while has helped…:)
GL. I couldn’t wait to get rid of PGH last week.
this is the TL im watching for PGH…
i may bail if we drop below this again https://uploads.disquscdn.com/images/7439836689bb5fdbaec3a5613b070409140c6f9d4d52a8df867f13a06bc962bf.jpg
I’m dying here, thought we completely Wave 2 earlier last week but we did not.
Can you show me your count Cason ?
F5! Not really sure – I need to have 5 counts up but I only see 3 on the daily (I could break into lower time frame and try again) so that is incorrect as show, but I show where I thought the DCL was. This could also maybe an irregular flat for the 4? AFTER I snapped the chart, I now see a triangle forming if you connect the 8 Sep high to the next two high green candle (through yesterday) and then connect 20 Sep and today. It would at USO $10.30 very soon – likely this week. I can update with that if this is too hard to follow. Are you still looking for near term bottom? The other issue is if we have a Wave 5 – going off of the Feb final bottom theory then we’re unlikely to have a large breakout above the inverse neckline in the near future. Constructive comments appreciated! 🙂
Sorry that it’s late.
A https://uploads.disquscdn.com/images/3ca0031a2e8a31a51b51606f21466fda4e46dc7f5397a763578c7754dd263a75.png
You sure we shouldn’t be short? Of course, I usually mess that up and would chase her instead of selling into strength as one should. But shorting bottoms is also part of my strategy just like buying at the tops!
Stopped out of GPL, HMNY, GUSH at this point. Will continue to convert towards all cash IF market allows.
Sure you can go short if you feel that this is just going to drop. I’m not sure exactly what you are looking at.
As for me , I see the GDX filled the Sept 20 gap on light volume, and the USD move higher doesn’t quite look real to me
I see NG, AU, GORO, and a few more green almost all day, with Gold down $11+
and I see HMY , RIC, BAA, AXU, PLGTF, NRP trying to go green, but sure –
You can short if you want : ) I just want to be patient
I can be one of your sentiment indicators…
The short was the underneath tag of the 50-day and I knew it and I still missed it, which was really stupid. MUX has been eviscerated the last few days as well. I just can’t see taking a new swing here knowing we’re looking for a ICL even if a few are turning green. It doesn’t make sense and the risk/reward isn’t there. I knew that, did it anyway, and lost the $$ just like I knew I would.
Well, GDX bounced to the 50sma twice, frustrating shorts & longs. As I’ve been saying, this bouncing up & down choppy sideways action just wears people out.
If it bounces there again, you will have your opportunity to short .
I switched topics on you. Stupid subs!! 🙂
Yeah, I’m all over the place. 1) The short was 3 days ago and I missed it, don’t chase after it due to anger. Though I am very frustrated that I called for a pop n’ drop and you laid out a pop n’ drop but didn’t play it. I don’t know of anyone that did, in particular. 2) We’re in a range right now, buying at the top 3-4 days ago as I’ll-advised as shorting the bottom now until we have a clear break either way, 3) Somebody please tell oil to straighten up and miners to bottom, I’m dying here waiting. I have already mis-identified the oil bottom as discussed with Ken. Don’t need that to lock up funds that will be needed in miners in a few weeks.
Really frustrated right now, won’t comment anymore.
You’re gonna hate what I put in tomorrow mornings report 🙂
Just a bit more chop chop chop
Cara is up 22% since entering: thinking of swapping for oil depending on OPEC decision 🙂
Very nice trade. Have you looked at a YTD chart of CARA? It could just be breaking out here, but Biotech is very tricky.
There have been so many nice set ups in Biotech, just Hard to trust individual stocks in that sector.
I ALMOST bought VBLT for a small trade yesterday, and I still would today, because it looks like it wants to run to the recent highs.
Also like JUNO a lot right here. MACK recently caught my eye.
LABU has been working for me. Keeps exposure to the SRPT downfalls to a minimum
Yes, and catches some of the good jumps. KITE jumped today
XBI (biotech etf) Strong looking chart….I own it.
yep my KTOV taking off today….long term play for me.
Very nice, many of these have the mini round base and then POP
I did look at the long term chart and it’s lovely… but at the same time it’s a lovely minefield.
Case in point NVAX recently.. ( I actually had the nerve to buy 2000 shares the afternoon of the day it tanked 85%.. but then sold at at $1.50 ish because I chickened out and didn’t want to hold too long.
I am soooooo eager just to enter a trade and stay in it for a few weeks. I was thinking the OPEC decision might clear things up. Fingers crossed
It has been a crude rollercoaster ; )
CHK getting pounded, looks like a 3x
REFRESH – I really like the look of NG and AU today.
We have gold down $11 and these are actually moving higher off of the 9 sma with what looks like strong volume. https://uploads.disquscdn.com/images/2e6e9476340cc992a298e26a0eca9a0275cf6ed8e3c556fdca05645fd7b22c06.jpg
The USD was up over .30
It just gave most of those gains up. Gold didnt move higher as the dollar dropped though.
RIC reversed higher off of the 50sma – now green.
Since we are looking for some bottoms in the golds, I like to draw trend lines and set alerts when they are broken to the upside along with some indicator alerts I have developed on TC2000. However, as you can visualize in NG Alex inserted below, one drawn from the Aug top was broken in early Sept, but it pooped out. Since Alex has not called a bottom, I drew another one from Aug to Sept 21. That one was broken again and pooped out. So I drew another (hopefully the last one) through the Sept 22 top. I am currently resetting many of these hoping that many of them will break out within a day or two of each other which would help me have confidence of a bottom (hopefully agreeing with Alex’s bottom call). I hope this is of interest. I just started using this technique recently. Maybe someone else uses this technique successfully.
What do you think of TAN here? With a stop of course….
Looks good …what do you think of RGSE?
That one had 2 reverse splits of 1:20 in one year – lost money on it and never want to see it again
looking at the chart I wish I bought It 5 days ago for the giraffe effect! Think it might drop back below $5?
Saudis say mtg is over without actually attending it yet:
http://www.cnbc.com/2016/09/26/oil-prices-slip-on-profit-taking-as-investors-eye-us-stockpile-data.html
scuttlebut here is that the Saudis deliberately and carefully crafted a deal that the Iranians would refuse – so the Iranians would take the fall for the deal failure.
It was expected to fail from the outset ….
Yeah, I could see that. But trying to reconcile that with the Wave structure since the low and the recent US inventory numbers. entire sum? Confusion!!