
Sept 3 – WEEKEND REPORT
Knowing that my readers are both short term traders and longer term investors, I want to always look at the charts and view them with a long term, medium term, and short term perceptive. At times all 3 views are sunny or all are murky, but in times like these, I also get a mixed bag. Lets review the charts and you will see some good and some questionable things in various sectors. This can help to sort out our short term and longer term investments.
.
Back before Aug 26th and on this Aug 26th chart, I mentioned that we could see price continue sideways until it tags the 50sma, or maybe even break it in shake out fashion.
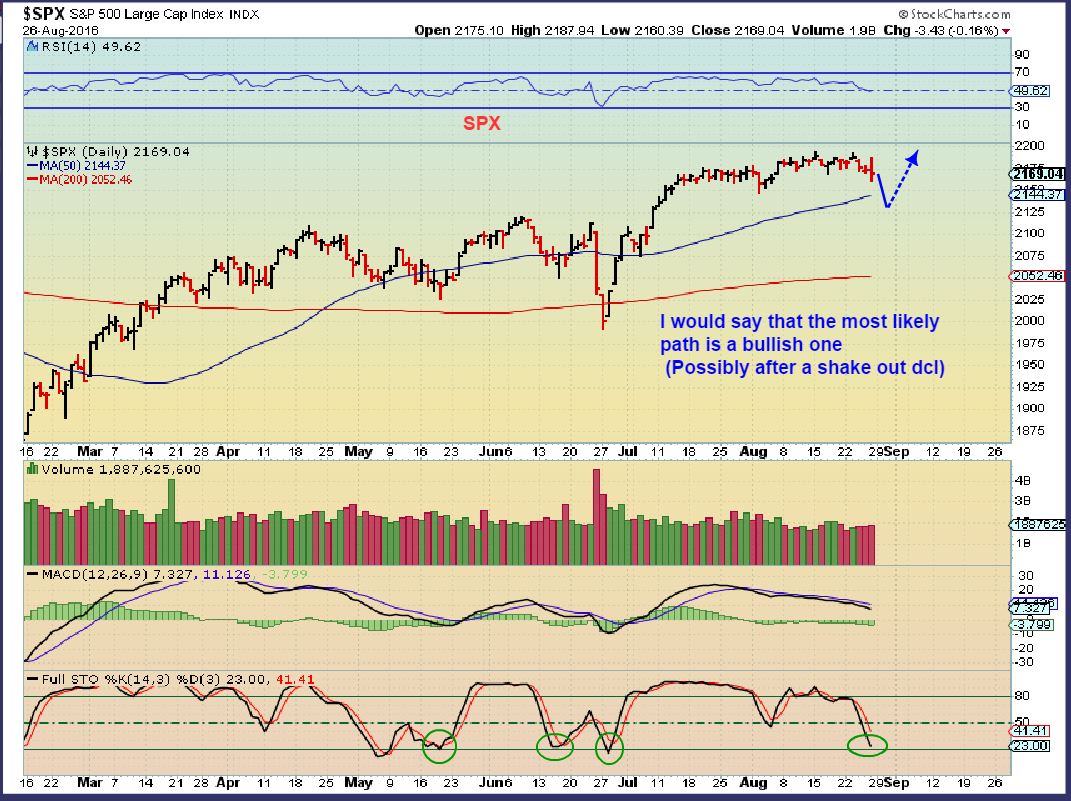
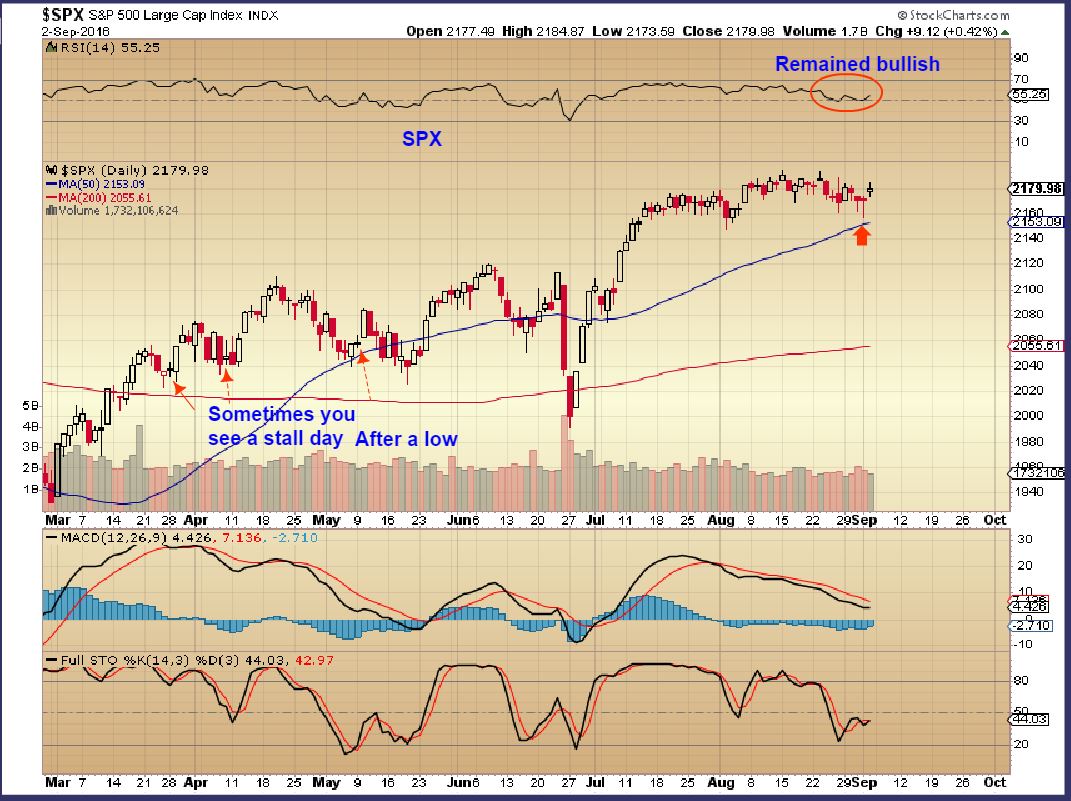
SPX – Each sell off is met with buying reversals, so this reversal with the Jobs Report “might” be enough to put in the daily cycle low. If so, this should break out & continue higher, instead of more of this 2 month choppiness.
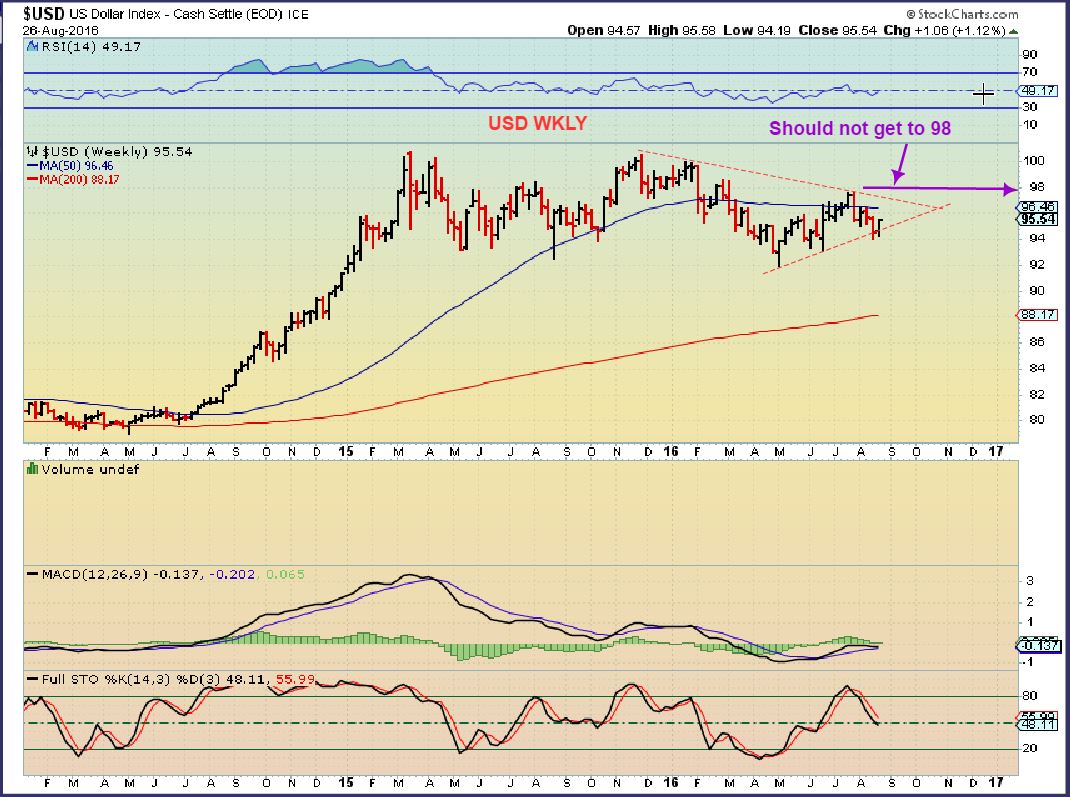
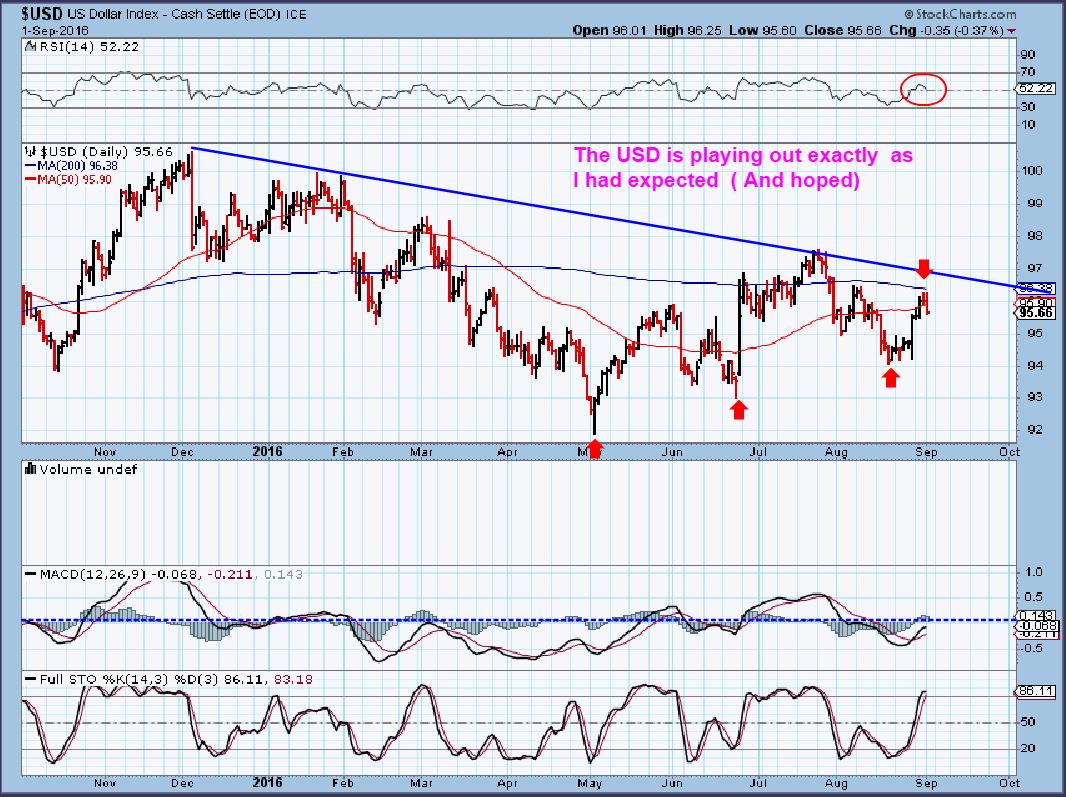
USD – I do recommend going back and reading reports from 2 or 3 days ago at times, to refresh our minds on what we have been watching for. On Aug 26th – The USD WKLY looked like this. I didnt expect a lot of upside, even though I saw a strong reversal.
SEPT 1st, rejected at the 200sma and lost the 50sma, so that looked bearish for the Dollar. This looked good for Gold.
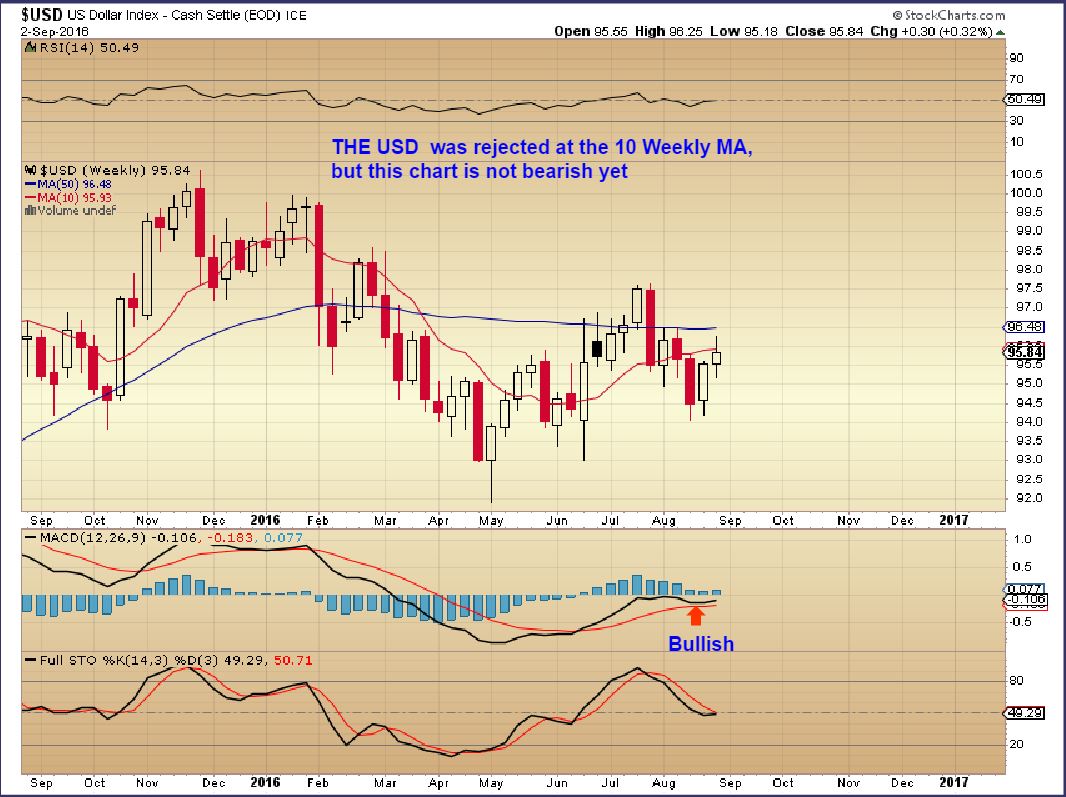
NOW THE USD WKLY- After the jobs report, the USD dropped fast AND THEN RECOVERED, so the weekly chart looks like this. The USD WKLY is not bearish at this point and the MACD actually curled upward along with the RSI. A weekly close above the 95.93 ( lets say 96) gets even more bullish. I’m hoping for further weakness next week, because it would help Gold & miners and weaken this chart. Gold didnt fall as the USD recovered however. 
.
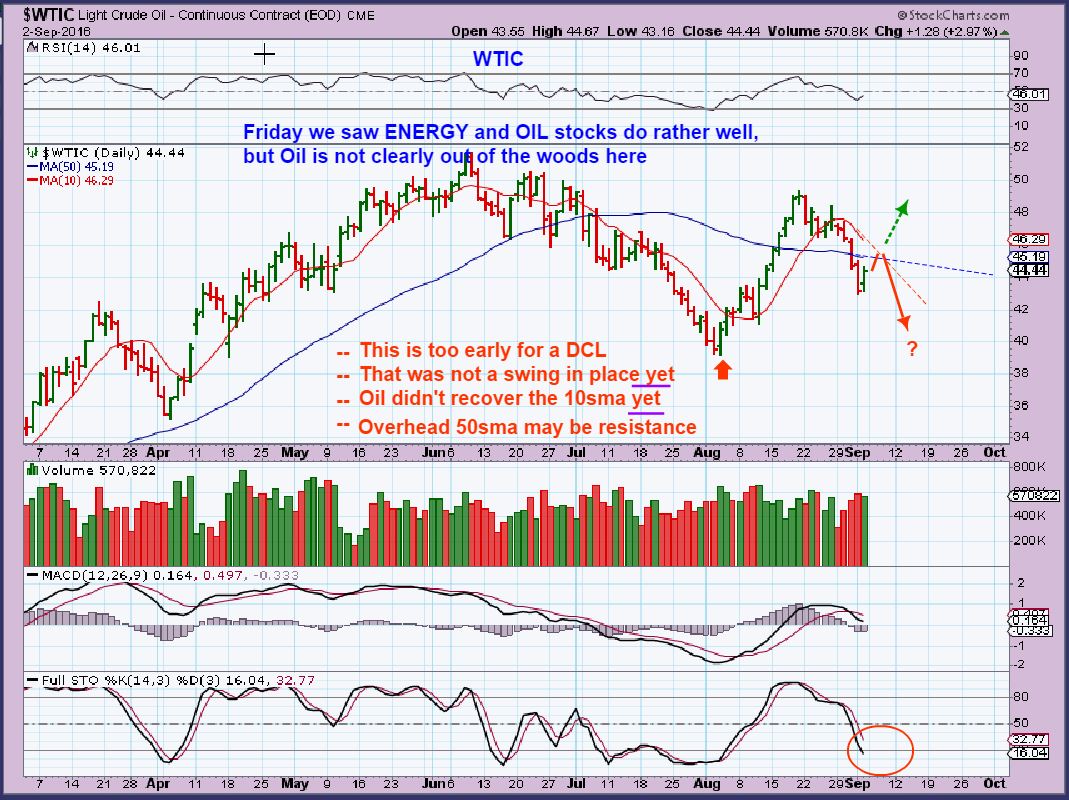
I was asked, “Now that we have a swing in Oil, do you expect $60 or $70 oil? I’m in UWTI”. My reply was , ” We do not have a swing low in Oil yet.” Oil is one of those areas that can be viewed as both Good and Bad ( feature Image). I am seeing very nice action in many Oil & Energy stocks, but they are ignoring the slightly ugly shorter term smudge that I do see in Oils chart. MAYBE the Energy stocks are telling us that Oil is going to improve? For now, I will let the charts point out the “Cautionary’ notes of OIL right now.
.
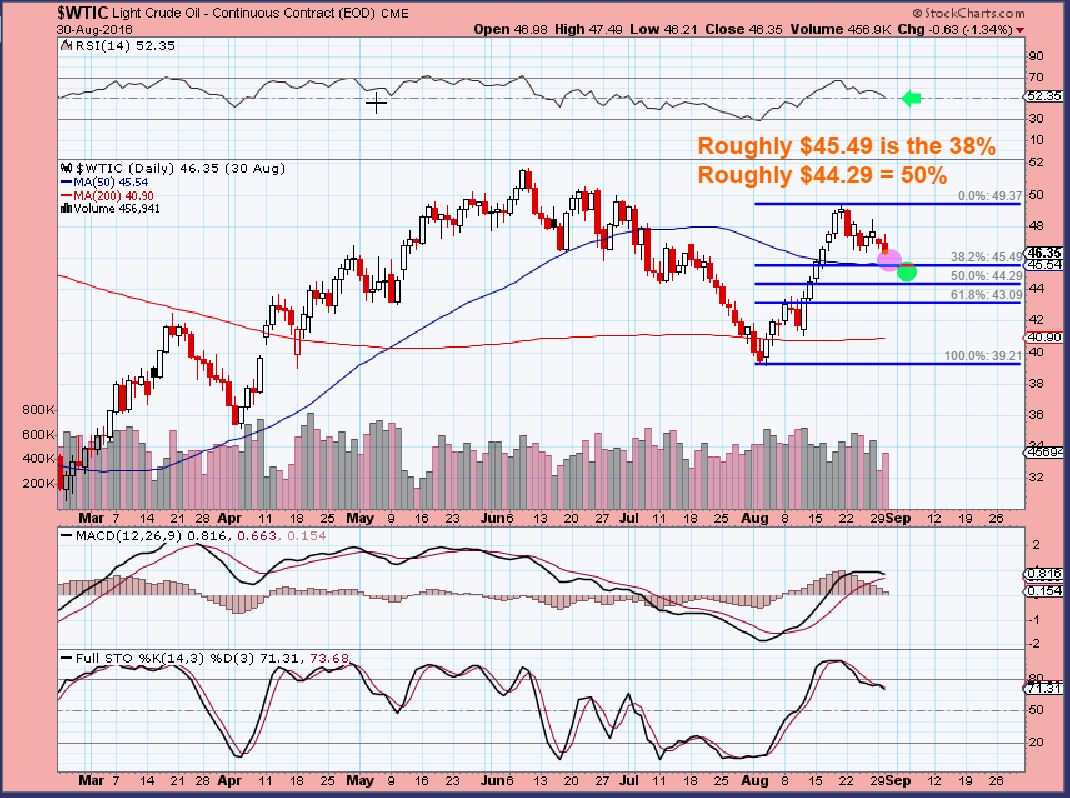
AUGUST 30th – I was seeing a more bullish Oil chart. MACD healthy, normal pull back, RSI holding 50%. Fib targets in sight.
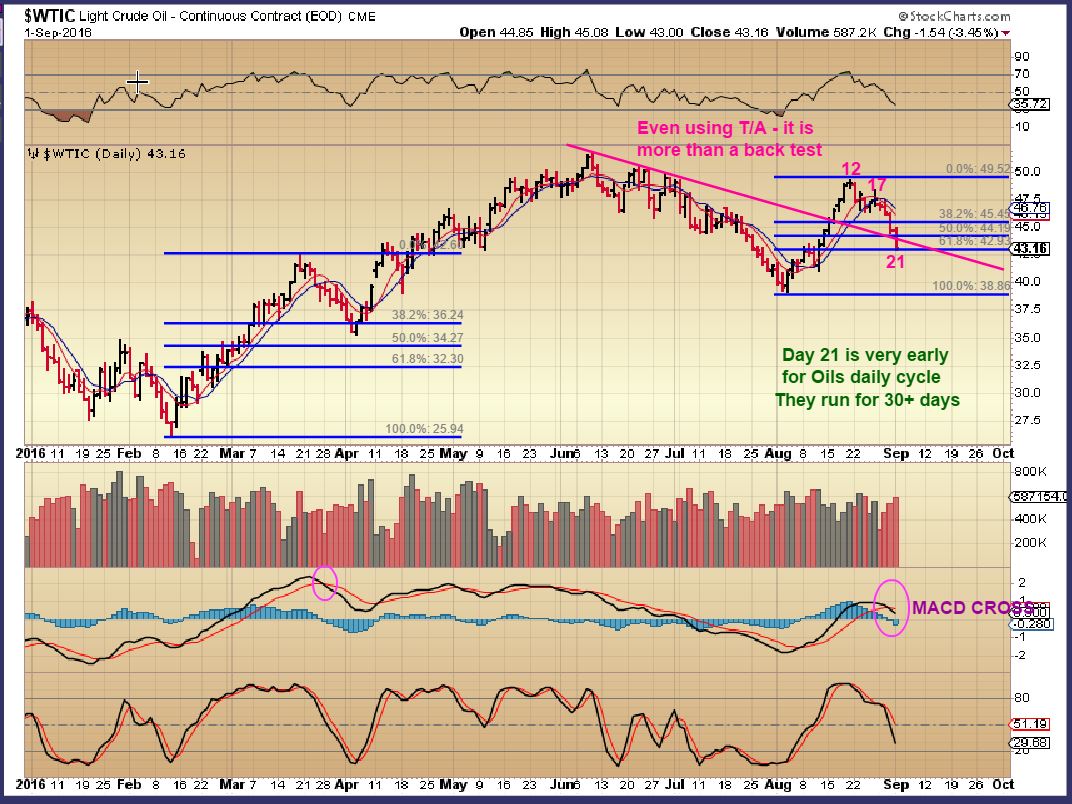
2 days later, please read what I wrote in green. We were at the 61.8% fib number and it was only day 21. You do remember watching these go for 40 days, right? So this was ‘concerning’ and even though I can see it changing, this must be noted. It became ‘cautionary’. What about Friday? Nice reversal, right? Yes…
WTIC FRIDAY – The chart didn’t really become any less cautionary to me. It is a start, and this could have been just a 1/2 cycle low ( a mid point correction) – but we need to see follow through on oil. This is still a break below the 50sma and trend line to me.
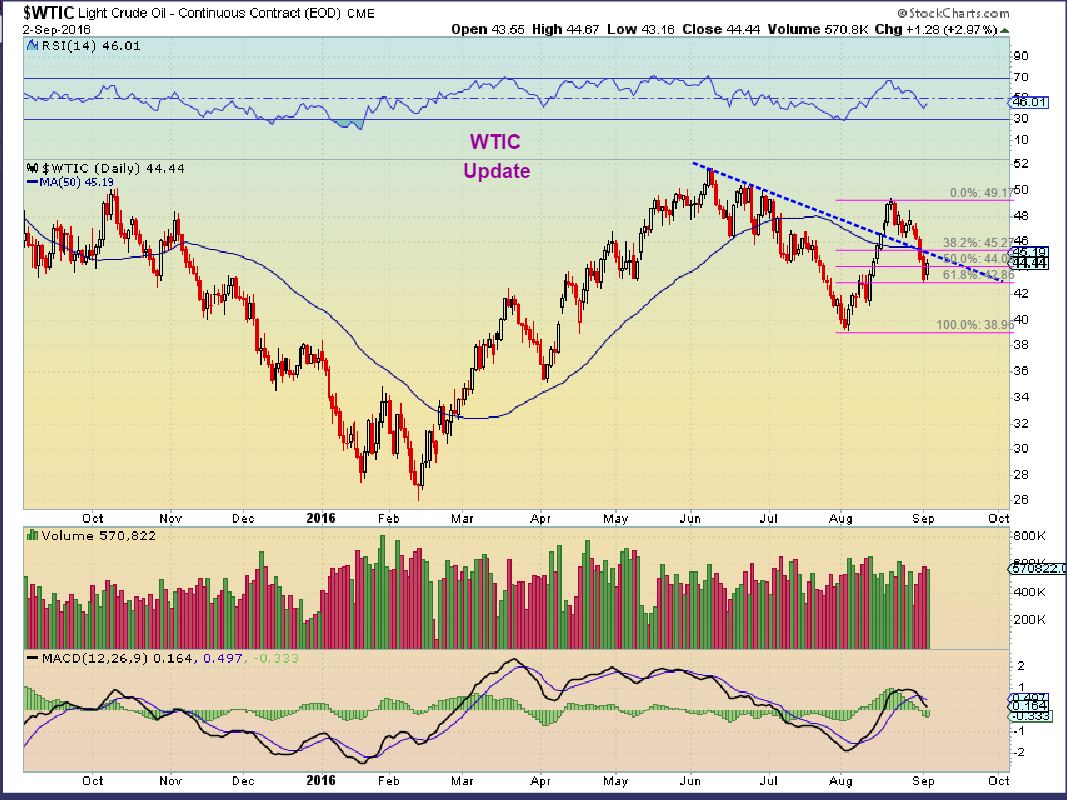
WTIC – Please note that Oil did not put in a swing low ( yet). Also there is the possibility that it could be rejected at the 50sma next week and continue as day 22 here. Oil could drop further after a bounce. That would be the bad news for Oil short term. The good news is that I DO see the ICL as Aug 3rd, and that low shouldn’t be taken out. Could Oil really drop to $41 as shown?
.
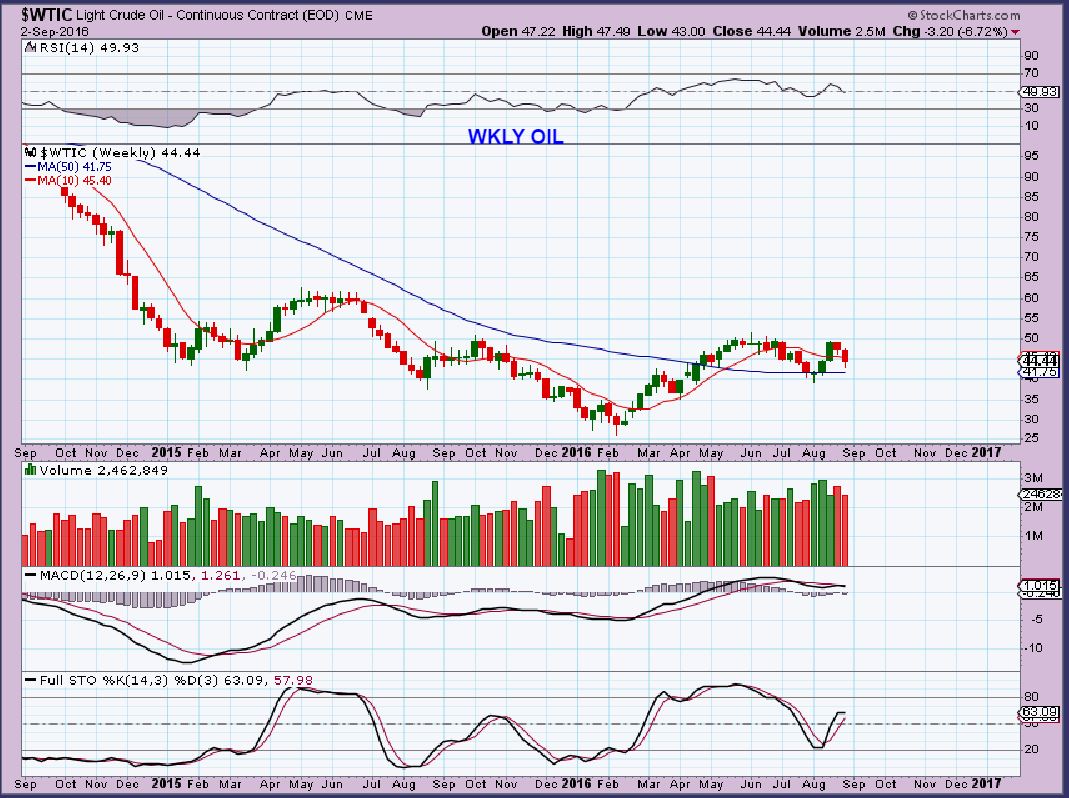
WTIC WKLY – Oil could and would remain O.K. at $41. So OIL & ENERGY STOCKS look very promising, they are either ignoring Oil and being accumulated by smart money , or they are foretelling that Oil will have follow through next week upside and recover. They may be showing us that this pull back was a 1/2 cycle low, just a deep dip to the 61.8% retrace.
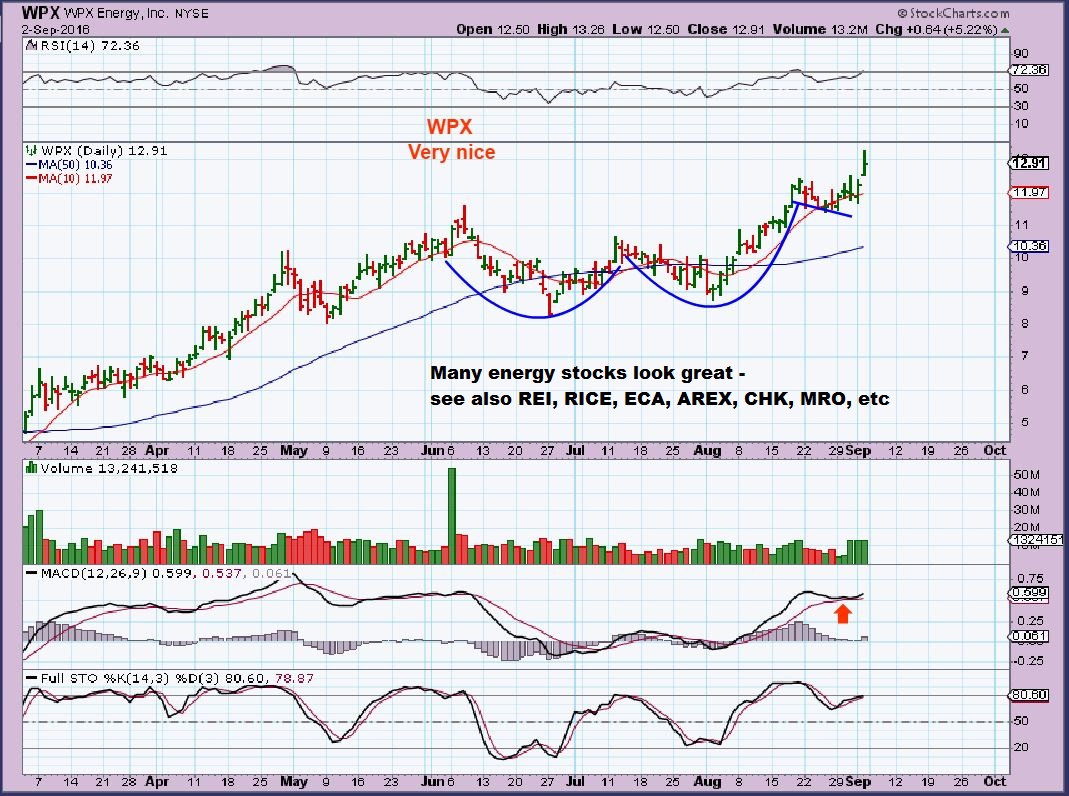
WPX – And so the good news is that this and many other Energy stocks are far more bullish that Oil looks. I have not sold my Energy stocks that I bought in early Aug. These are acting great.
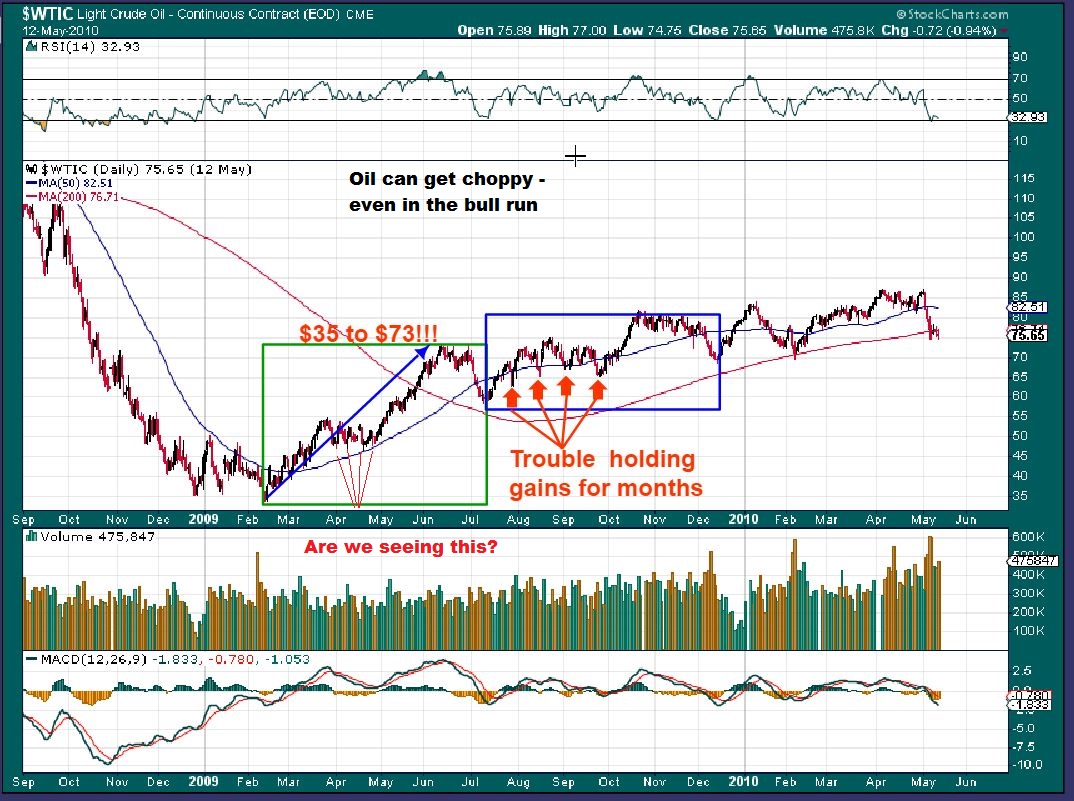
So the following chart will answer all of the questions that this raises about Oil. Questions like : If Oil is only on day 22, and can have 40 days, wont it have to drop a LOT lower? No. What might we expect if Oil doesn’t blast higher all next week? CHOP. What about Opec? What about Russia – they said they may cut production? Etc etc .
.
OIL – Out of the 2008 lows had a strong rally similar to what we just had. Notice in the green box that it went from $35 to $55… then it was just chop – chop – chop. 1 solid month later, still at dcl (lows) it took off big time and ran to $73. Leverage during that ‘chop’ in Oil would be tough, but the Energy stocks are being bought up in the “Climbing the wall of worry ” phase if you ask me. XLE, XOP, (maybe GUSH for the super experienced in front of their screens all day, desiring leverage trader) etc .
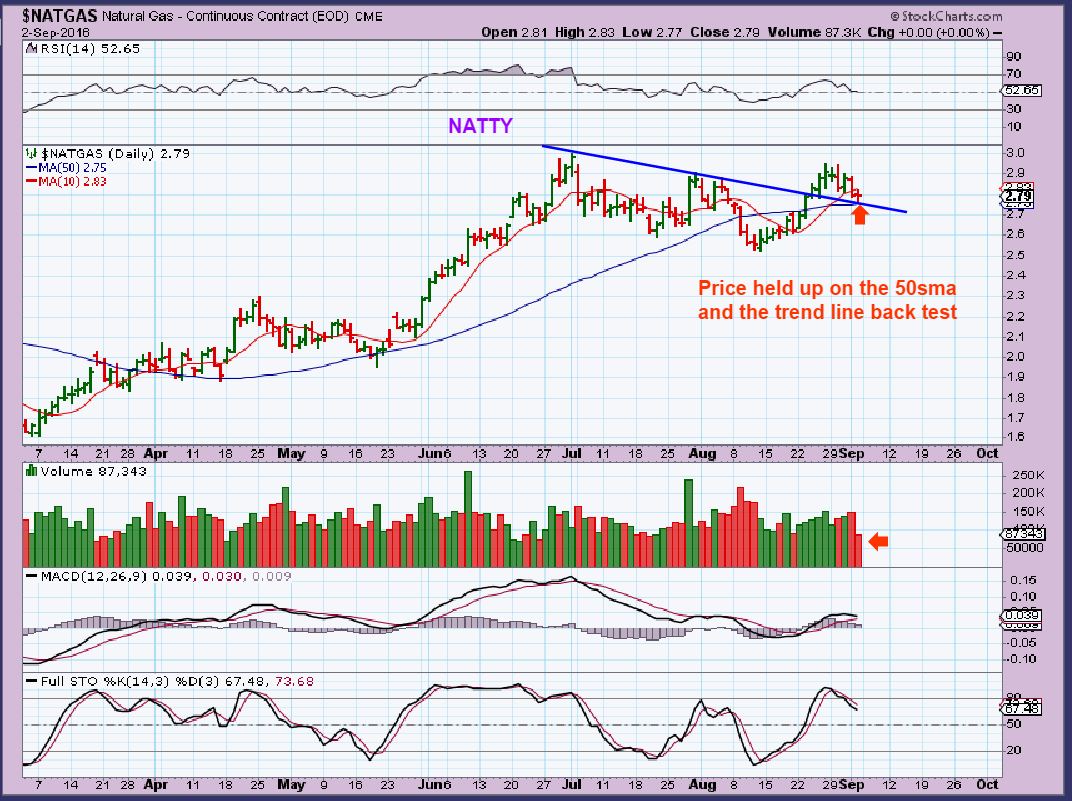
NATGAS – Still a bullish back test at this point. Going long here is a rather low risk trade as long as you use stops in case it breaks down.
GOLD, SILVER, AND OIL
.
GOLD – Gold and Miners are as complex as Oil right now. Things that just look straight forward, did not always act that way in the past. When I looked at OIL in 2009 and saw all of that choppiness, it became clear to me what I may be seeing now. Thinking back from memory, I just remembered a run in Oil from $35 to $73. I have a tendency to forget the pain 🙂 And so it goes with Precious metals at this time, so let me do a summary first.
.
Summary – WHAT A YEAR, LONG TERM BULLISH, possible tricky and hard to predict choppiness in times of correction. Now back to the present charts. I’ve mentioned this in past reports with charts.
.
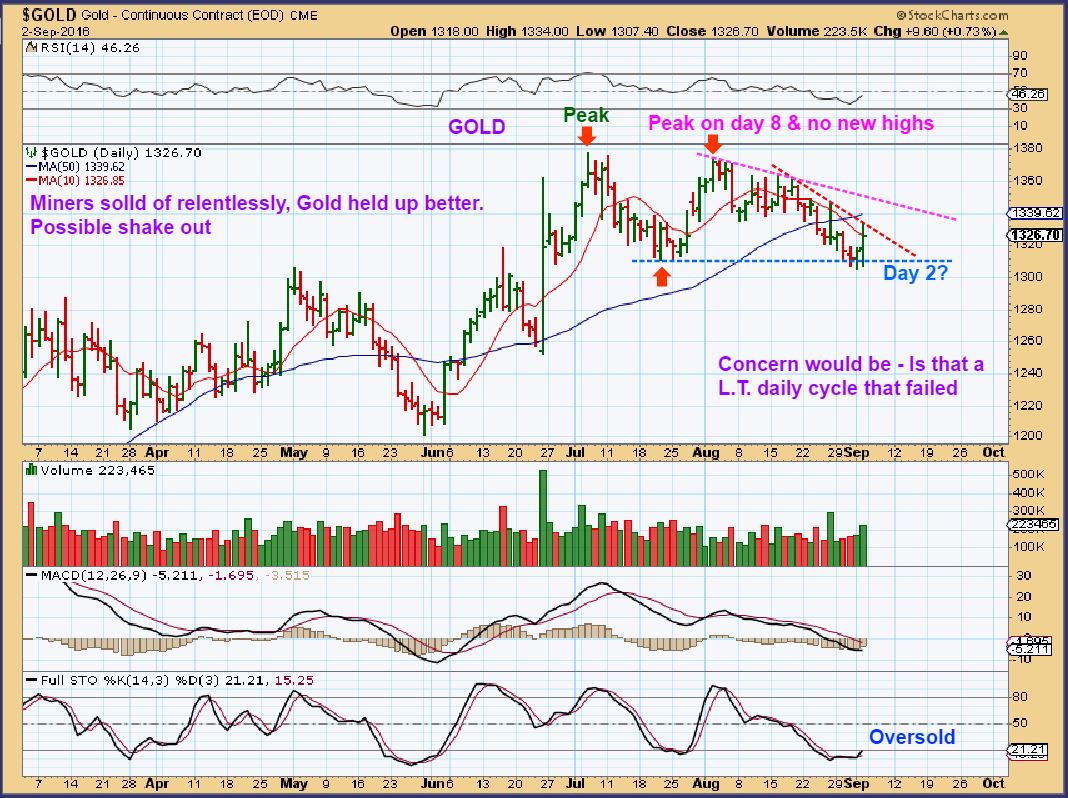
GOLD – The way Gold is acting, it does need to prove itself. Why? The low was at THE END of May 31, the PEAK was only 1 month later during the 1st week of July. That’s barley 1 month later and with all of the passing weeks, this has become very Left Translated. Also our recent daily cycle undercut the last dcl. That is failure. It is usually a sign of weakness, and would call for a drop into an Intermediate Cycle low. They usually come 4-6 Months apart low to Low. THAT would be the end of May to the end Sept the earliest. Enough said, we’ll see if Gold can defy cycle timing. If not, we have to expect 1 more daily cycle drop.
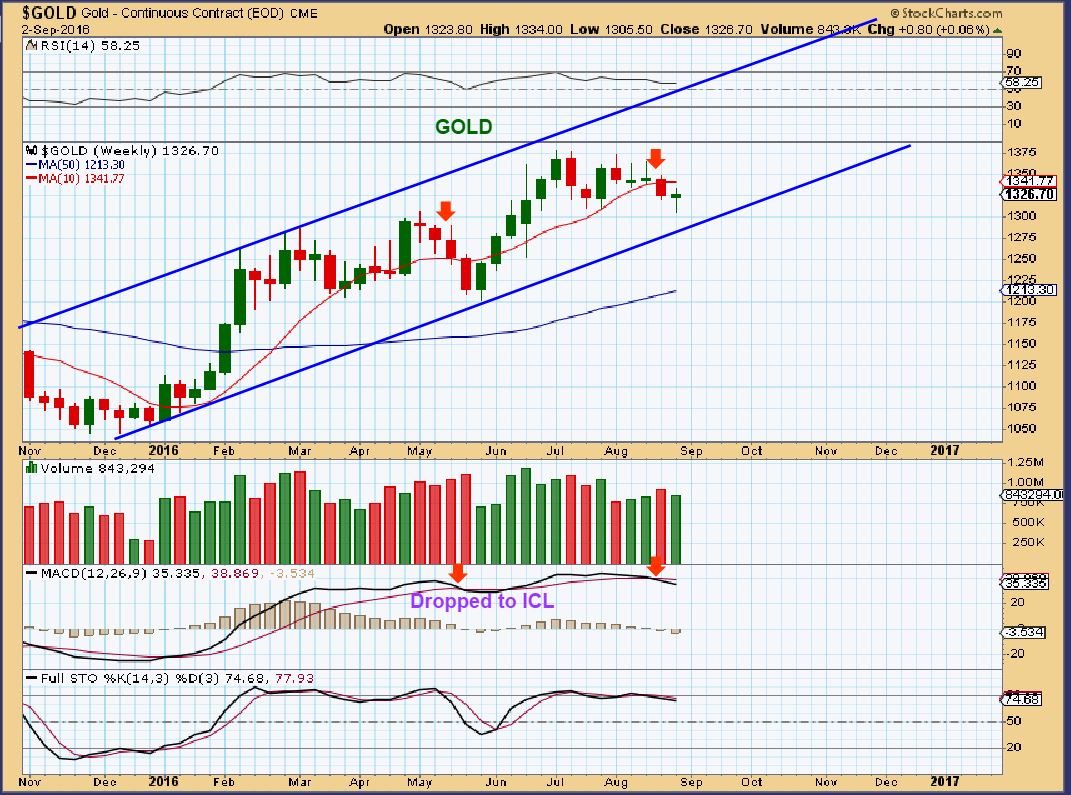
GOLD WKLY – 1 month ( 3 more weeks) of weakness could easily fill this ‘time & space’ after a bounce.
.
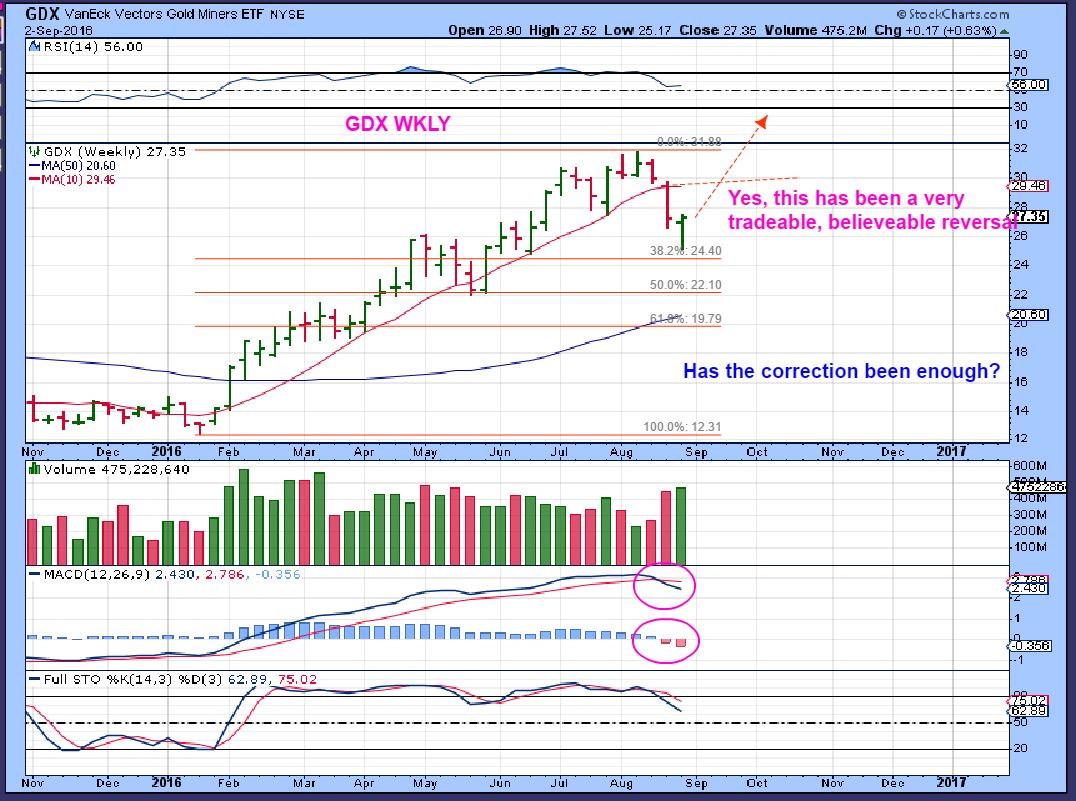
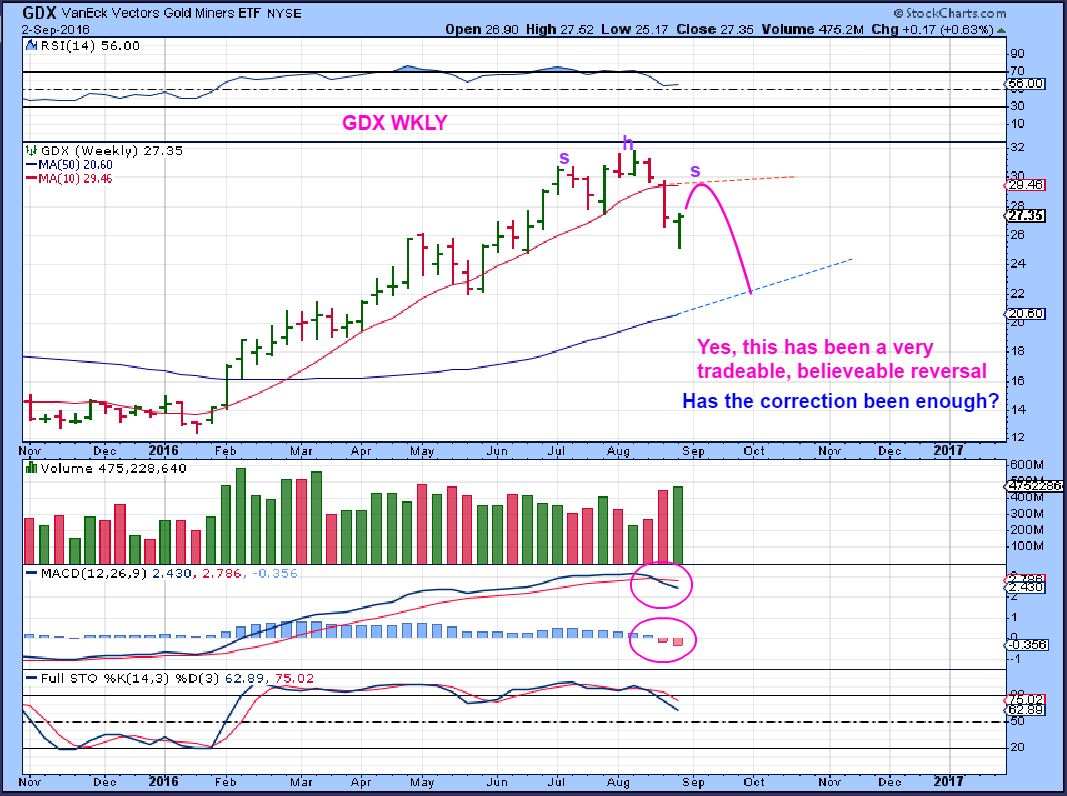
Next I will just show the GDX WKLY Chart. I want to show how Bullish this looks, but it is important to see how this could just be short term bullish. If you bought those lows, we will be walking down this path questioning bullish or bearish daily for 8-12 days.
.
GDX WKLY BULLISH REVERSAL – This is a Bullish looking reversal after a steep drop. Many want me to call it an ICL, but it did not even tag the 38% retrace mark and it has been 3 weeks since the last ICL. I mentioned that I bought the lows Thursday, added Friday and expect some upside. I now have to wait and see how this plays out. I AM CAUTIOUS and my next chart will be a bearish version.
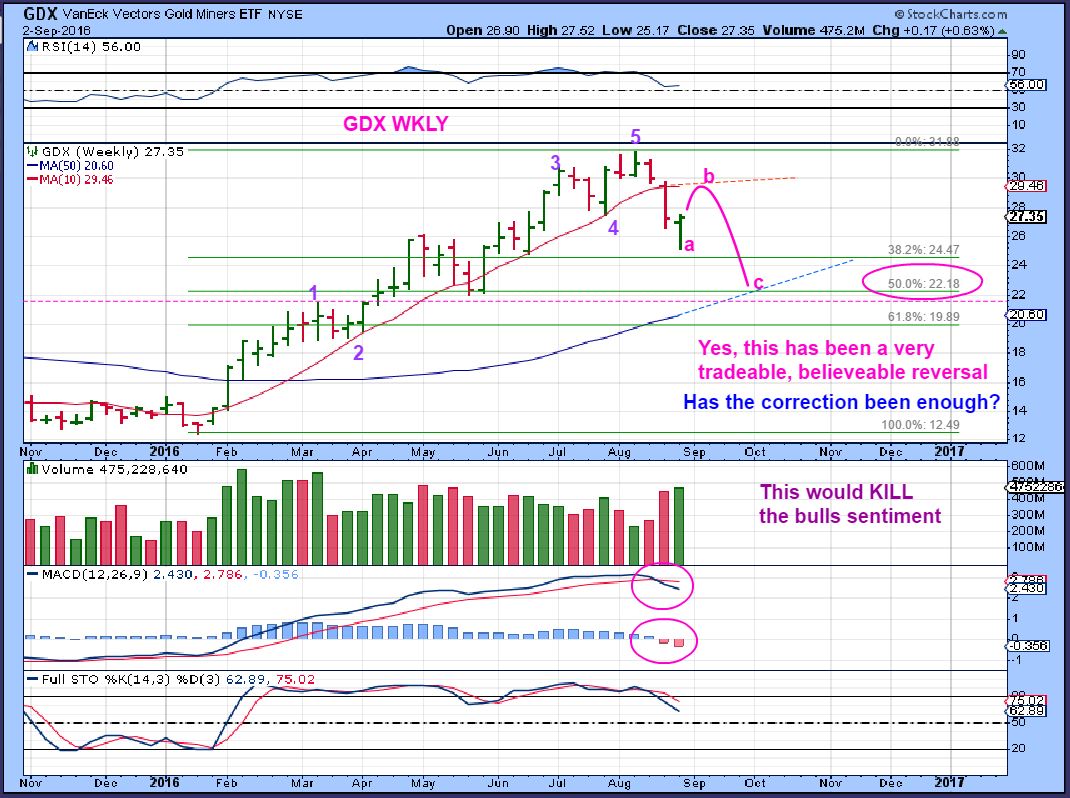
GDX WKLY BEARISH VERSION – All of a sudden, this looks quite possible, right?
GDX WKLY BEARISH VERSION #2 – Upside target near $29? And all of a sudden, the 50% retrace looks possible and this E.W. count could play out with an A-B-C down reaching near $22. THAT will be a great buying opportunity if it happens. THIS COULD EASILY PLAY OUT.
.
My thinking is that you have to know how to buy near the lows in a sell off, and then be ready for the good, the bad, and the ugly. We will be watching things unfold with a few different possibilities, until one is confirmed as the correct one. The Bigger picture for OIL and Precious Metals remains quite Bullish to me.
.
Have a great weekend ( long weekend in the U.S.), your next report will be after we see what happens on Tuesday. Thanks for being here.
.


Long weekend in Canada too.Neil Peart is disappointed. 🙂 Have a great Labour Day, Alex, and to the rest of the CF community.
did you see this Alex?
Yes, I’m not worried…what do you expect should happen from this?
In other words, you have posted this twice, what is it that you are concerned about? What do you think the outcome is, and what is your downside target? Thx
Sorry I didn’t get a chance to respond. It just looked like a scary bearish wedge but I still think longer term we are in a miner bull market. I’m waiting for that ICL
Thanks Thomas. Looks like the end of wave 1 in a big ew picture. Small pullback followed by resumption of the main trend. I wouldn’t spend too much time on it imo On the seasonal trend something to be mindful of but I don’t base my trades on it. Quick trip to the poor house. What if the seasonal trade is not in agreement with real time analysis? For me I take the cycle analysis coupled with macd ,tsi, pattern recognition, 50/200 Dma, and insight from chart freak to know how to buy low for me this trumps seasonality and subjective ew analysis. The most money I ever made on a trade was the off season for silver and buying when the technicals and divergences said a massive retracement rally was imminent. $5 move in 2 weeks with 250 call options but seasonals said worse time of the year to buy and everyone on stocktwits was short.
September historically is the best month for gold though http://www.marketwatch.com/story/gold-investors-prepare-for-the-best-month-of-the-year-2016-09-02?siteid=rss&utm_source=tf
Natgas not looking good..
so this is what Fidelity is giving me on PGH – I don’t see any signs of a strong candle (though that 3% bounce on Friday was a bit of a help) – does anyone have a more promising outlook?
Still sitting right on the 30w MA, been great support so far as Alex pointed out.
As you can see in this chart Crystal, Its been pretty much at the mercy of OIL prices, so really have to decide what you think OIL prices will do. If they continue to bounce Id think PGH will at least see 50d MA. Im sure Alex can give you a clearer picture, but im just watching oil for now regarding my oils stocks which include PGH as well
Thanks for your charts. I am in PGH too, in the red, and I want OUT!
If it can retake the 50d ma that would be a great sign, don’t sell just to get out, maybe just place a good stop and stick with it. Alex can help with that, but If Oil can recover this can still be a good trade.
My only concern is that this is a weak company from my reading. I already experienced the sudden bankruptcy scene with 2 of my positions and a 3rd possibly recovering. I meant this to be a fast turnover.
They have made encouraging improvements in Debt reduction and cash on hand is expected to go from currently $51 Million to $150-200 million by year end.
I’m not trying to talk anyone into holding it, I would sell if I was worried about them going BK. I’m not worried about that at this point.
http://www.marketwatch.com/story/pengrowth-delivers-strong-second-quarter-operational-performance-and-continued-debt-and-cost-reductions-2016-08-04
Thanks for that update.
PGH looking great today, just needs to keep it, performing much better than OIL, almost retook the 50D
I’m still in the red but not by too much…gained back as much as is still red. Yay! Good volume too.
Same here…still a little red but not nearly like it was! I could sell here and be happy (compared to what it was!), but I’ll wait a bit…..and see what happens!
PGH moving out on good volume, Hope it can blow right the resistance around $1.68 this time.
Yeah, woo hoo! I’m almost back to break even…maybe it can keep running!
I prefer to go right to the SEC financial statements when looking at these instead of the promotional piece. What I see from the last 10Q is they had a loss of 239 million in the quarter which results in a total deficit of 3.2 billion, debt of 1.5 billion and a current ratio of .75.
The 54 million in the bank is compared to the actual payable money owing at the time of 162 million.
I did not look into the debt reduction but it was probably a swap for shares rather than actual cash paid
Thanks…that was more what I had looked at. Either way, they are not the strongest company.
I remember when everyone was saying that before Gold could bottom, all the junior mining companies with debt would have to go bankrupt to cleanse the system, since there was no way they could go higher with their present fundamentals. NO ONE would buy TRX, XRA, THM, AUMN, etc.
Markets look forward 6 months at a time. Higher gold has Miners working on their debt, and there are deals to be made along the way with their debt holders . Last years fundamentals are a blur, as long as it was manageable.
hi Alex
with today big move in Gold is there no stock recommendation for miners?
And no comment either.
Hi Wally –
Unfortunately, the time to buy Miners at a low rsik point was last Thursday and friday. Unfortunate, because buying and holding over a 3 day weekend is tough for many. A pullback in Gold monday night and Tuesday would be difficult to hold.
So I tried to make the comment before a big move, not after the move. At that point, some Miners can be up 20-30% and you need to wait for a pull back to enter. My comment was Fridays pre-market report, it pointed out buy signals were triggering at the lows. Also we were due for a daily cycle low in Gold. I mentioned in the comments that I had bought JNUG on Thursday too. I posted charts of Miners ready to trip the Buy signals. Today, Miners have run higher for a couple of days and now it would be best to buy a pullback or one might get caught in one.
Also -now we see most miners are up quite a bit and since this could be a final daily cycle in this intermediate cycle – it is not a strong buy type of situation. It is only wise to trade them short term at this point, and at this point you would also want to wait for a pull back since the low risk entry has passed.
If this is a final daily cycle of an intermediate cycle, there will be a pullback that is as strong as the last one was, many were ready to swear off miners at that point. It will be a great buying opportunity. Right now it is not an all out buy unless you are a skilled trader and can handle your own trades with stops and possible draw down..
Echoing my sentiments…in the red and want out!! Haven’t had time to study it out this weekend to see what I need to do…..will do tonight….sure wish it would surprise us tomorrow….
Woo hoo! Up .08 so far.
F.W.I.W. – I like the look and action of PGH
It made a 300% move and hasnt even pulled back 50%. I see divergence in the MACD on a 3 month chart.
I just want to clarify that I wrote this on Monday , before this move : )
I like the set up and I drew up a chart last night after writing this for tonights report, but may or may not need it now. Todays action proves the potential bullishness.
On Friday I stated that Oil had a daily swing buy signal…..that was incorrect as Alex has pointed out……my apologies. I saw a Heikin-Ashi buy signal not a swing daily buy.
That was you? I think some here thought it was me 🙂
Decent follow through today, but back below the 50sma.
I am really hoping for a break and close above the 50sma . I think todays action did put a swing low and break of the 10sma, but it didn’t hold the 10sma yet.
C’MON TUESDAY!
Wait just a second here……WTIC did Not but USO did give a daily swing buy signal And a Heikin daily buy signal, both bouncing off the 62% Fib.
Now I can sleep well tonight….lol.
Yes, but unconfirmed, like the one 5 days before it. A swing alone can lead to failure. This early in Oils daily cycle, I still recommend caution for the readers here that need a safer entry. This cautionary chart is still the valid one for readers worried about possible draw down.
I do like the way many of the Energy stocks are holding up, and I would love to see Oil just take off and make that a 1/2 cycle low. 🙂
Alex what chart are you using to watching the intraday action for oil. I am using the free version of stockcharts and it only gives me day end.
There are a few, you can use this…it has a 5 minute chart, hrly, daily, wkly, monthly
http://www.finviz.com/futures_charts.ashx?p=d1&t=CL
I use the finviz heat map and charts and really like it. It shows up good on a phone screen too, but it does not give the moving averages, and just looking for something a little more intractive.
this one is realtime, & has all the interactive bits
http://www.livecharts.co.uk/MarketCharts/crude.php
thanks
Yes agree too early for a DCL ……. Sept. 6 as a HCL (wave 2) ? I think the Sept. 6 low will hold if so that would mean that Oil is beginning wave 3 into its 40 day DC. Risk Reward Very Good……
Sept. 1 low…….
My Energy stocks are sure acting like the upside is the place to be ; – )
well .. remember … he DOESSSSS use the black&white CF emblem for his avatar…
… just sayin….
*smirk
My Heineken gave me a buy signal this weekend!
Hi Alex – I followed your footsteps and took the trade on JNUG at 17 and just sold it at 23.5. It was an awesome move. Thanks for the tip. I didn’t want to risk holding it because I assume it should peak soon before the miners drop into an ICL. I intend to heavily buy then, if the move plays out as planned. Thanks for your awesome reports and perspective. Although I don’t post often, I always read your reports carefully before making investment decisions. Cheers
Thanks Goldsa – Nice trade, glad it was helpful- Cheers
Nice!!
Gold:
Held the major TL and now breaking out of its wedge……
Along with the USD H&S pattern in play looks very positive at the present time……
yeah… that 1330 break confirmed abc and not impulse down… aye? ;o) woop
AREX looking good the last several days. If it’s going to do some reverse symmetry if might head for the mid 6’s soon.
Visual From last weeks weekend report
.
refresh
.
mmm mmmm good 😉
That’s not Campbell Soup, that’s AREX
… yeahhh .. the CHART .. NOTTT the Chartist .. ;o)
MEEEEOW
..
woof… go arex
Hi ALEX….. Thank-you for your weekend-report.
I’ve a short question: How do you see gold today or this week, just hope for a short answer from you. AGAIN…. thank-you Alex!!!
One day at a time
Just my 2 cents on the US Dollar. After being rejected at the 200sma the dollar is fast approaching the lower trend line support zone. I’d like to see it cut right though, but caution here in the next few days. F5
Bill, thought on LABU? I know you trade bios a lot.
I bought some LABU. It looks like the markets are moving higher here, IF they continue higher LABU will be a good trade moving higher with them. There is some thought that the markets will break lower, if so you have to have a stop in place.
suggestions, silver stocks, thank you
You might look at PAAS, SSRI and silver miner ETF SIL.
thanx, cheers!
EXK has been killing it for me
The metals are just ripping out today, Going to sell 1/2 position in NUGT if gold hits 1350, let the other half ride, in case it just keeps running. Not sure on my GDX calls, yet,
PGH – Look at a 6 month chart and notice todays volume at 1/2 way through the day. This is with Oil down ; – )
Yes thank you!
Yeah, Im hoping for a close above $1.68 today, like you mentioned in the report, a lot of oil co. catching a bid today even with oil flat, BTE my only laggard,. Even ERX up decent with OIL down ,strange,
Being up over 11% at one point, and with this volume pushing behind it, it may close just under it and take it out tomorrow. Either way, a weekly reversal looks to be in order, and the weekly chart shows me that this can run from $1.50 to $2.50 fairly easily. 🙂
I like the way you think, lol
Yes, please!
RE PGH One of the the great resource investors Seymour Schulich (google him) bought 22 million shares of PGH since May… he just bought 2million on Aug 18 at 2.04 canadian.
I’m staying in it…. he is not a fool!
Man, we get BTE to unsuck and we’ll really be on to something!!
Another oldie but goodie in my account is breaking out BWEN 🙂
Alex,
Could Gold be left translated…but still break the previous highs of 1375 in the next say 4-8 days then roll over into an ICL? Or does breaking the old highs negate the failed daily cycle allowing this rally to continue longer hence becoming right translated? Thx
Alex, could you please comment on miners now. With gold/silver/GDX etc . zooming up today, do you have a new possible upside target for gold and GDX now? I am getting antsy to unload some positions, but if this action has you rethinking the target up for gold now before heading down to the ICL, I’d appreciate your thinking. I don’t want to unload too soon. Thanks.
Alex- have you exited your JNUG trade?
Alex,
Let us know if this is a time to lighten up on miners for the icl coming or to continue to ride for a little. Thanks
Miners can rise to peak for as much as day 8 -12 and still be L.T. and roll over.
How far they get or how they travel there is an unknown.
Will they run up everyday of say the first 8 days? I kind of doubt it. Can they pull back for the rest of the week and then pop and peak next week. Yes. Will they? I dont know.
How they get there is an unknown / JNUG could run to $32, I don’t think we can know for sure
I sold the rest of my JNUG on the overhead gap fill, but that doesnt mean that this is the top, it means I am satisfied with my trade and this MIGHT pull back for a couple of days and then peak higher.
lgcy…perky
I’m just wondering when SGY is going to blow its top again ( like RENN, CDTI, etc)
Soon I hope!
SGY is sitting on its 30wma. low volume. Bot some today.
Lgcy…dead to me. And Bill
Thanks, that calmed down my antsy-ness, for today.
I’m going to trail stops here.
Alex,
Do you have GDX on Sept 1 as the 3rd DC in the current IC ?
If so…..the 4th DC’s are historically pretty weak correct ?
That is correct, and it also undercut the last dcl, so this should prove to be weak. Mainly because it is too early for another ICL at this point ( 3 months from Mays lows).
This is a pretty convincing move, but it isn’t the initial move out of the lows that is weak, it is just that it would prove to be L.T. and drop similarly to the last daily cycle that we just saw.
The 4th DC’s will still last around 20 days or so though correct ?
Yes, 20 – 30 ish, maybe even less since this is more of a bull market than the bear market rallies.
Got It !! Thanks…..
If this DC is a left translated cycle that lasts 20 to 30 days then am I correct that the peak could be anywhere from 8 days to less than 15? EDIT: I just noticed you answered this earlier in the day.
What days do you count in the cycle for the long weekend we just had? Just Friday and Tuesday or do you use some of the weekend days for the count?
Great question, im trying to grasp cycles but hard to find info on even the basic “rules” or parameters of what qualifies the beginning of one or the end of one,,dcl or icl and just general trading rules of them
No, only count trading days
Hi Alex …. wouldn’t 3 months from the May 27th low, be around the end of August ?
Yes. The recent low was 3 months later – Sept 1
Maybe Gold will test the TL above tomorrow ???
If it breaks to new highs, we have something all together different.
That is the dichotomy we are in ay?
Take profits soon and if Gold breaks out to new highs then ReEnter OR if Gold drops down into an ICL we would be happy we took profits? Risk is losing out on a $25 move in Gold…….
That is very much what I was thinking…ride the first few days and take profit ( be happy) and if it breaks out, something different is going on, try to find a goo re-entry.
The thing is, I havent been in front of the screen all day, just an hr here, h there.
SILVER looks very bullish, so I need to review things and maybe cycles arent acting correctly at this point.
I just dont want to go jumping in and get caught in an ICL sell off- those are brutal and stops are NECESSARY.
Agree !!!
Yeah that drop and this bounce both bigger than I expected. But timing is wrong. Glad I decided to go long at DCL but I went pretty light. Wish I had gone heavier. But if it had been weaker would have wished I was lighter, right? Good discussion with Kenny
Alex, would you please look at SVMLF [Silvercorp]? It has been moving up and had a very good day today.
Its a break out – no reason to sell it yet if you own it
Well, I’m skimming Mining charts and these really do look like they want to just run higher.
Some like THM, AAU, AXU, TRX, NAK, etc ( Many more) really just look like they want higher price.
This could be a “use a trailing stop’ type of move.
Yes! guess who wants to break out? my old friend BAA
I was looking at this today! I didn’t jump in, but it crossed my mind…..I’ll have to keep my eye on it tomorrow…
Not too late tomorrow?
not too late. I am long for ever ago. Patience :))
(sold my NUGT too early but $$ is good)
I also entered AG on this reversal.
I know! I did add on my core bc I expected miners to come right back down but then EXK shot up 10% today so pretty much missed it (since I’ll end up round-tripping). So I need more positions, esp ones with potential, will look to add some BAA tomorrow!
I’ve had that for a long time too…still read, but not by much.
SB broke out today too and is up another 4% in the after hours market
Wow! I almost sold last week for a small loss, glad I held on!
UUP looks like it could keep dropping quite easily F5
ISM really smashed the $$ I didn’t realize how bad it was until after close (when I found the time!)
Alex, just a ‘weak bounce’ right? Someone forgot to tell that to my account! 🙂 🙂 🙂
Good grief, even SB was up big today. I forgot I even had that one, it put us all to sleep.