
Is That A Gift?
It looks like a gift so far, but until it is unwrapped, we really cant be sure. One thing stands true though, I dont want to be ungrateful if it is.
.
The gift that I am referring to is the burst out of the lows in Gold, Silver, and Miners and the light volume pull back Wednesday. It looks like a gift offering of a lower entry before another leg higher. I’ll discuss that further, but first lets quickly cover Oil and Energy Stocks.
.
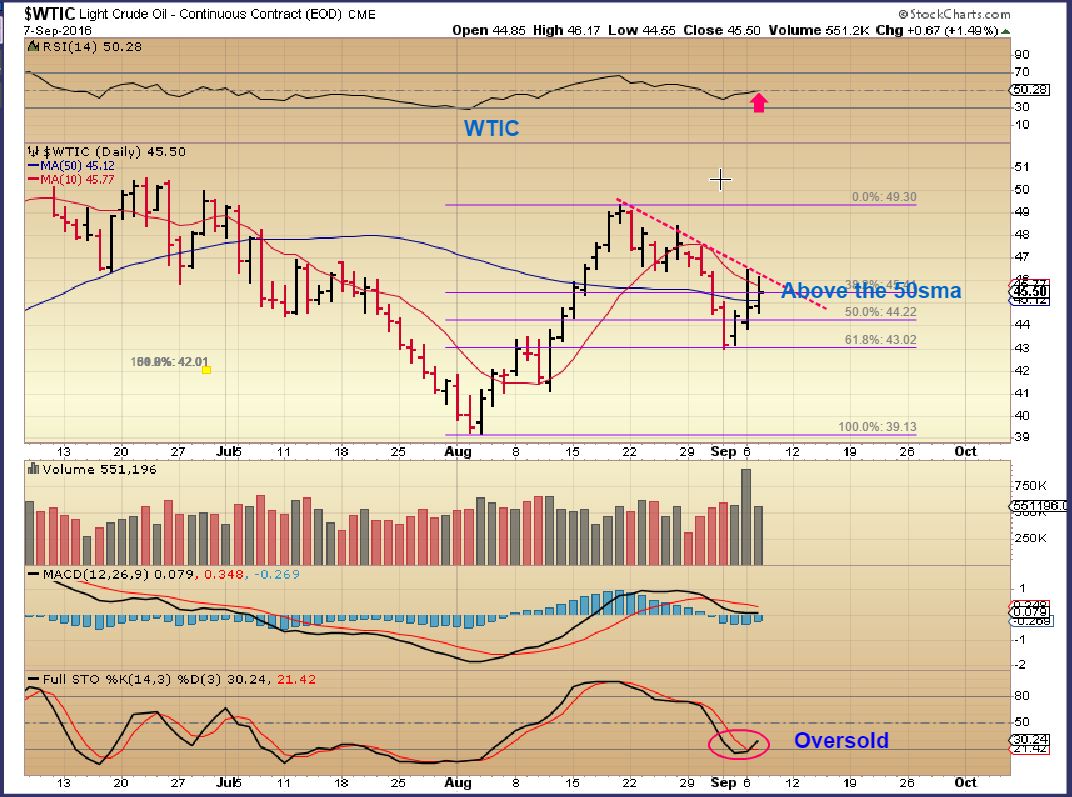
WTIC – Oil did get above the 50 sma today, but a little follow through Thursday would really build confidence. The set up actually is improving since that sell off at the end of August. Hopefully todays report will give Oil some help.
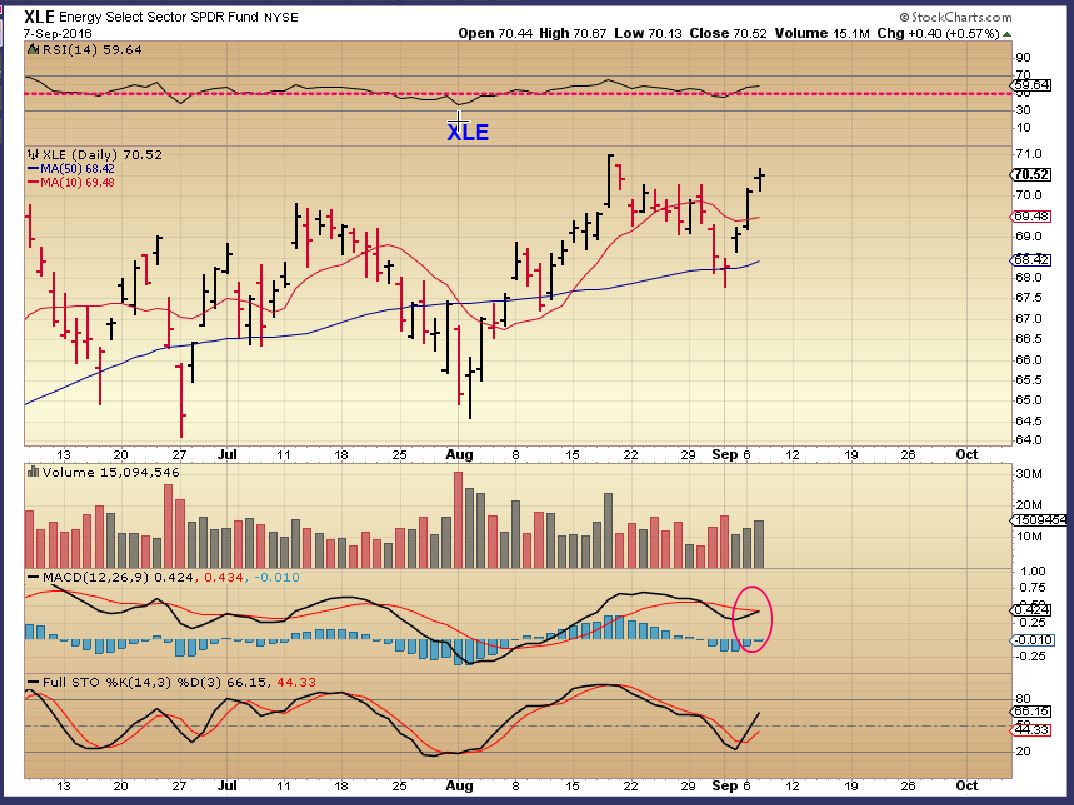
XLE – Another boost of confidence is the bullishness of the energy stocks.
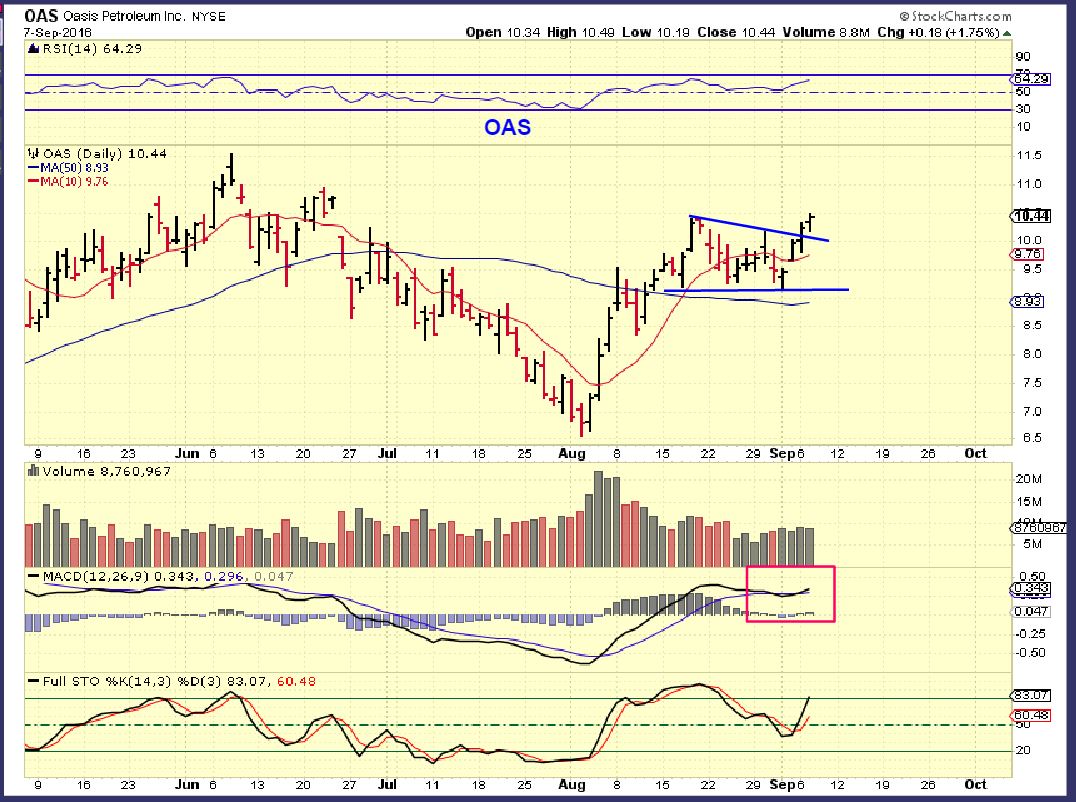
OAS – For example, OAS looks to be breaking out from here. AREX continues to climb. RICE, REI, WPX , and others mentioned in prior reports continue to do well, even as Oil meanders along. I continue to like the Energy sector.
.
GOLD , SILVER, & MINERS
.
You all know my thoughts and analyses using Cycles, I have explained it extensively. At this point, with those dangers already mentioned, I want to just use Technical analyses and view things that way from here. If you take on a trade and it begins to break down, just get out.
.
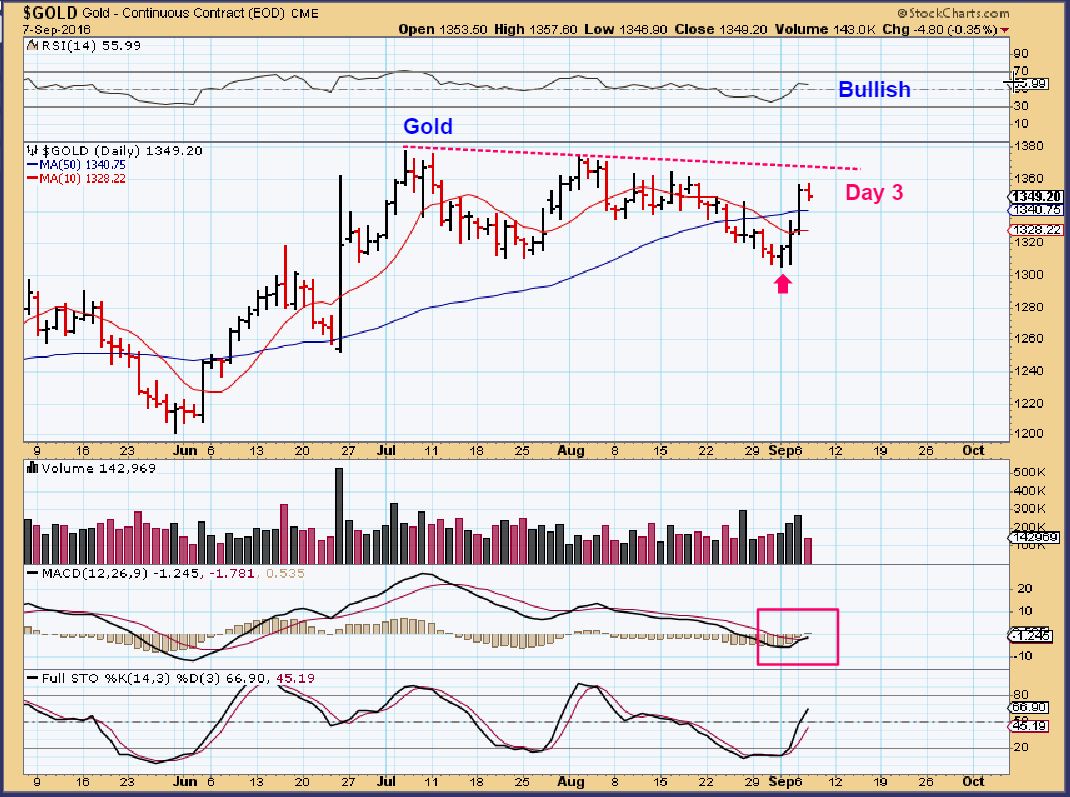
GOLD – It is only day 3, and Gold broke back above the 50sma like a shake out. Now we got a small pull back toward the 50sma. The chart actually looks bullish. A possible gift is this light pull back. If this breaks to new highs, it should be game on for a strong run higher.
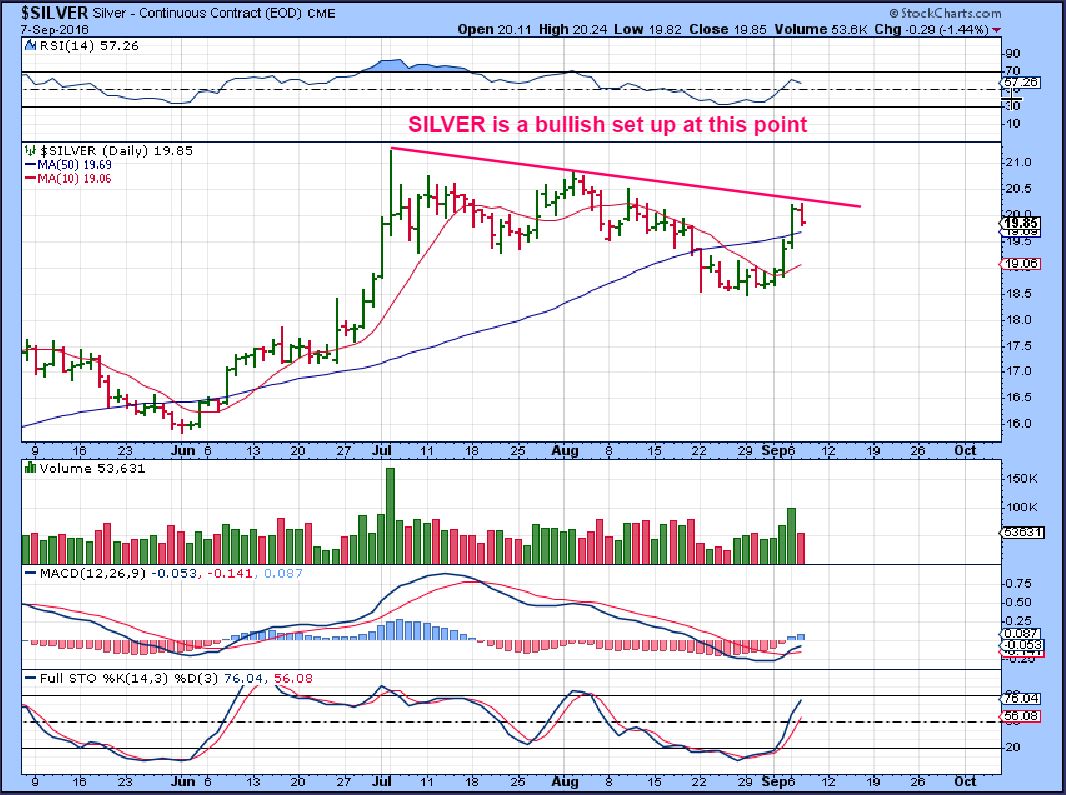
$SILVER – Even more bullish. This really looks like a 2 month consolidation setting up to break out.
GDX – Was todays pullback a gift too? I mentioned in the Wednesday report that a lighter volume pull back could lead to a low risk entry, and much better than buying a stock that has gapped open 2 times and could pull back. GDX dropped to the 8 ema and recovered.
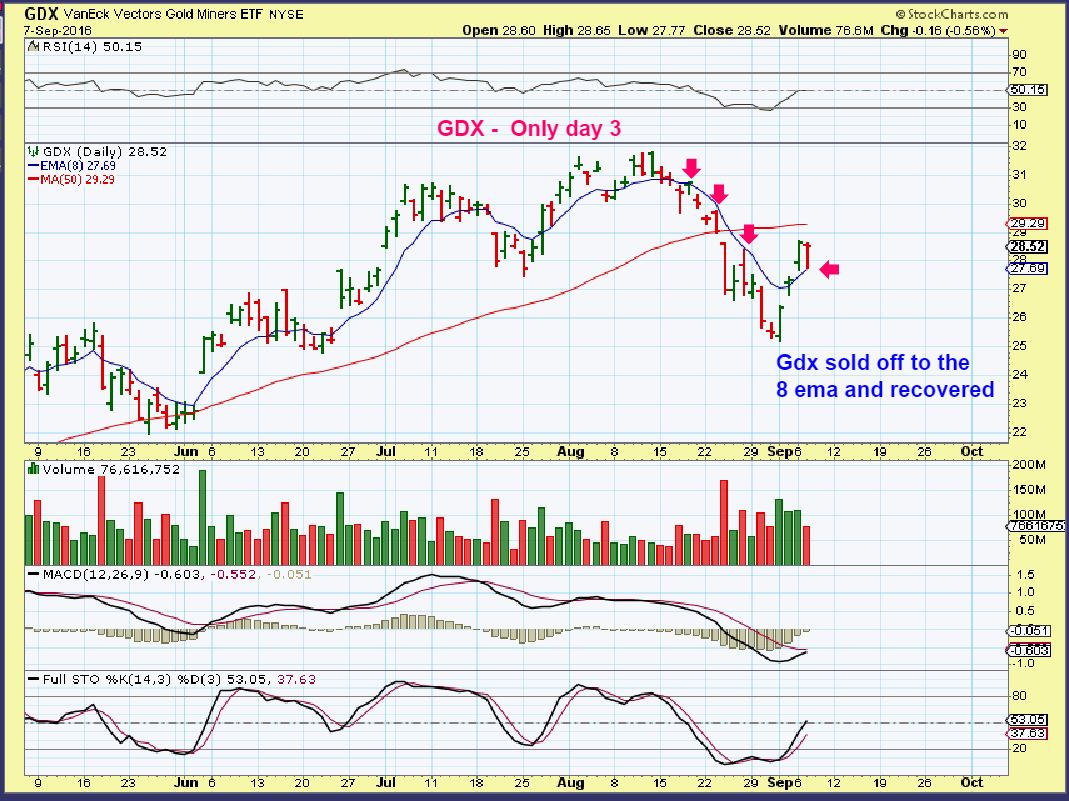
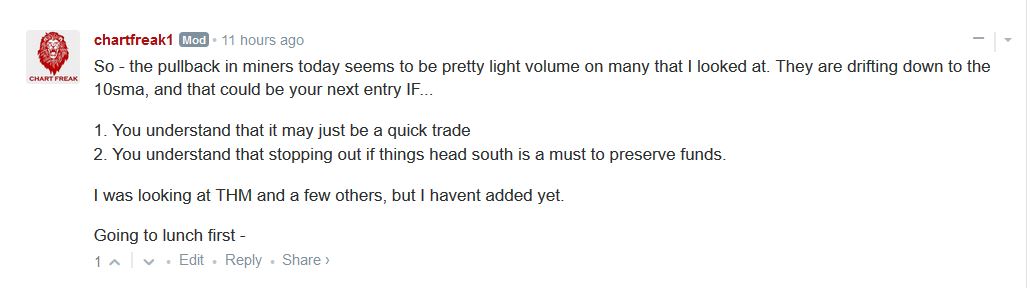
SO AGAIN, This is what I posted in the chat area today. The GDX daily cycle could peak on day 8-12 if it is going to be left translated and fail using cycles. Using technical analyses, these charts do look good, so there still is time to take a trade, but we just want to be alert. Click to enlarge.
.
I will again post a couple of charts showing what I look for.
.
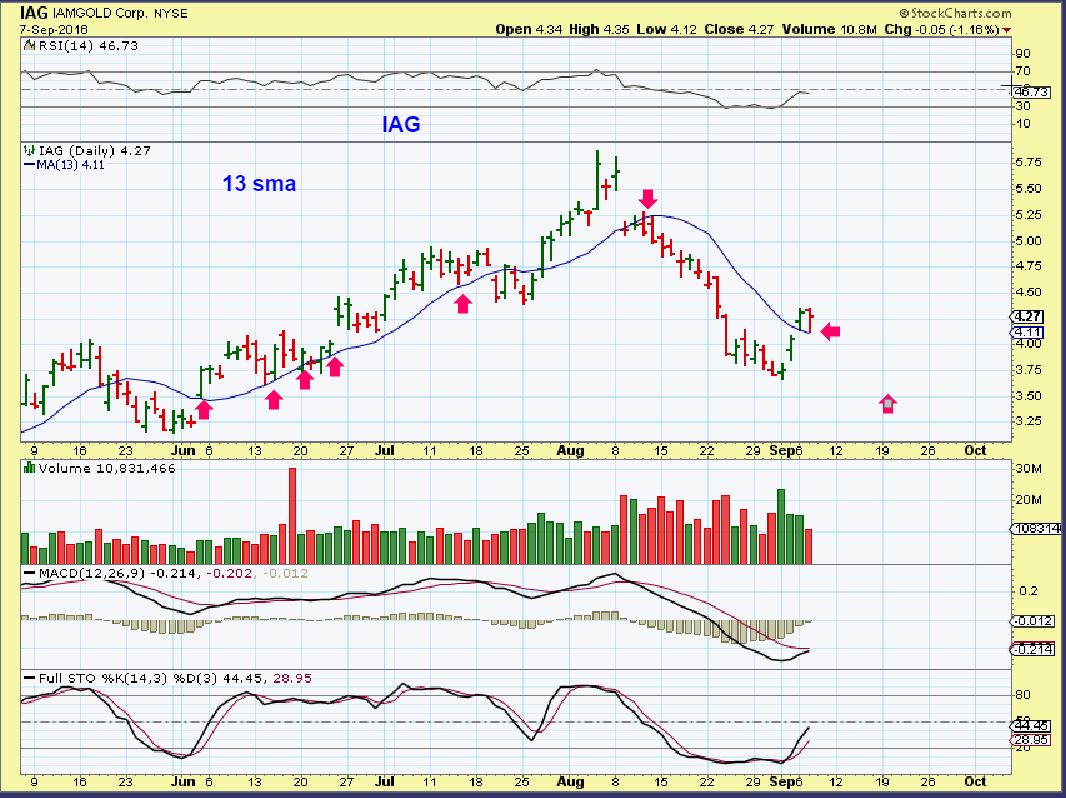
IAG from yesterdays report – Note the purple line looking for a dip to the 10sma and then a bounce ( or rally).
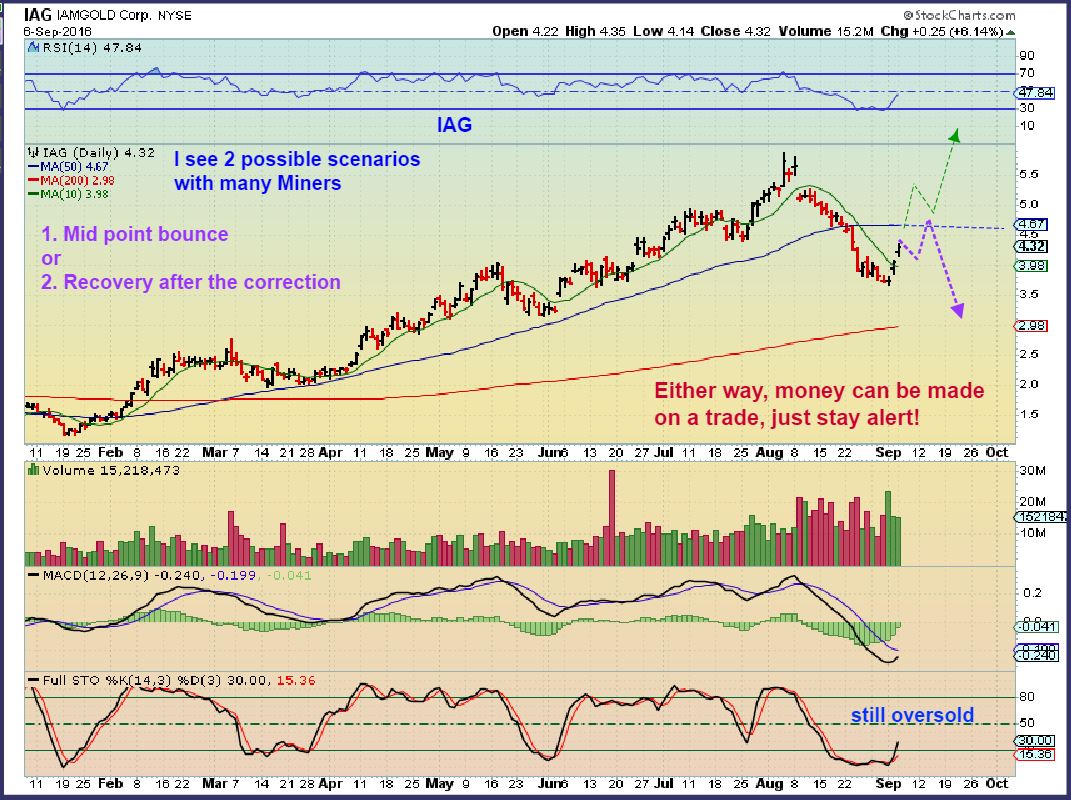
IAG – Dipped to the 8ema and then bounced back. I noticed how closely price followed the 8 ema

IAG – Also the 10 & 13 sma offered support. The price may now just go higher or it could do this again, going sideways for a day or two. Since this line slopes downward, another dip ‘could’ fill the gap and then go higher. These are examples of slightly lower risk entries for a trade. Your stop can be loosely below the 10sma, or below last weeks lows.
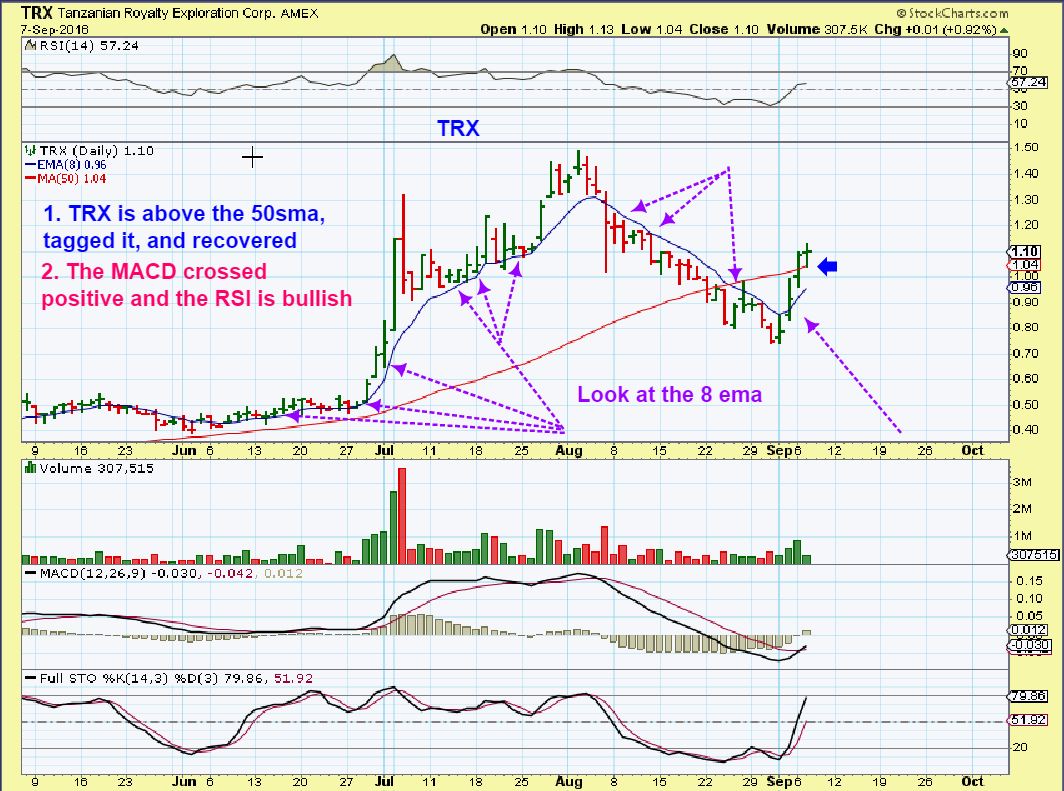
TRX has already moved up a lot. This is about a 50% move from .72 to $1.10! It is above the 50sma . If it goes to former highs, it is a big move.
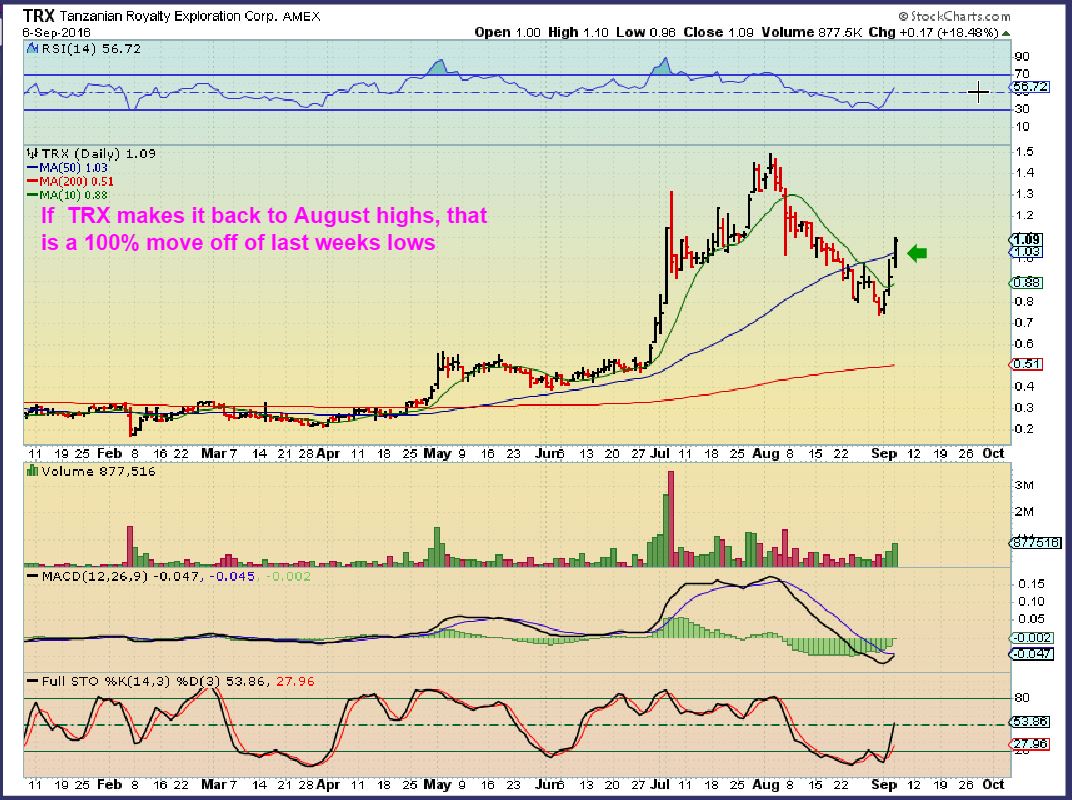
I mentioned in the comments / chat area real time that I bought TRX as it sat on the 50 sma line. I also mentioned why, see the chart.
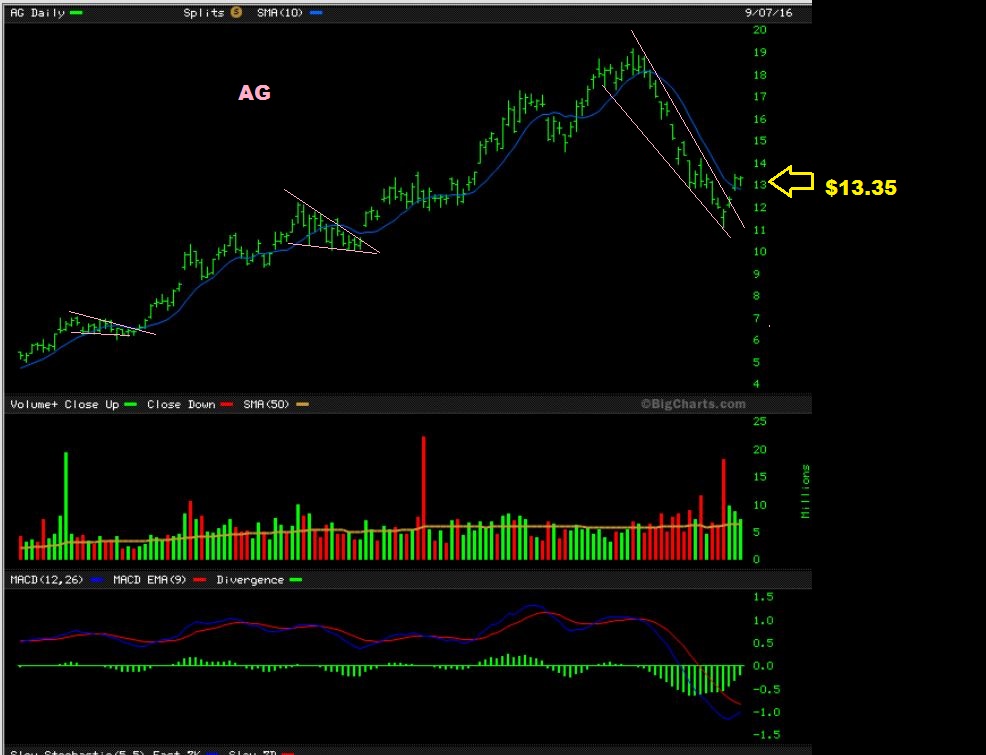
AG – This chart I tweeted out when someone asked me about AG on Monday as a buy. It was very oversold and did a 50% retrace. Since then it has only moved to $13.35. There should be more upside if we are to rally.
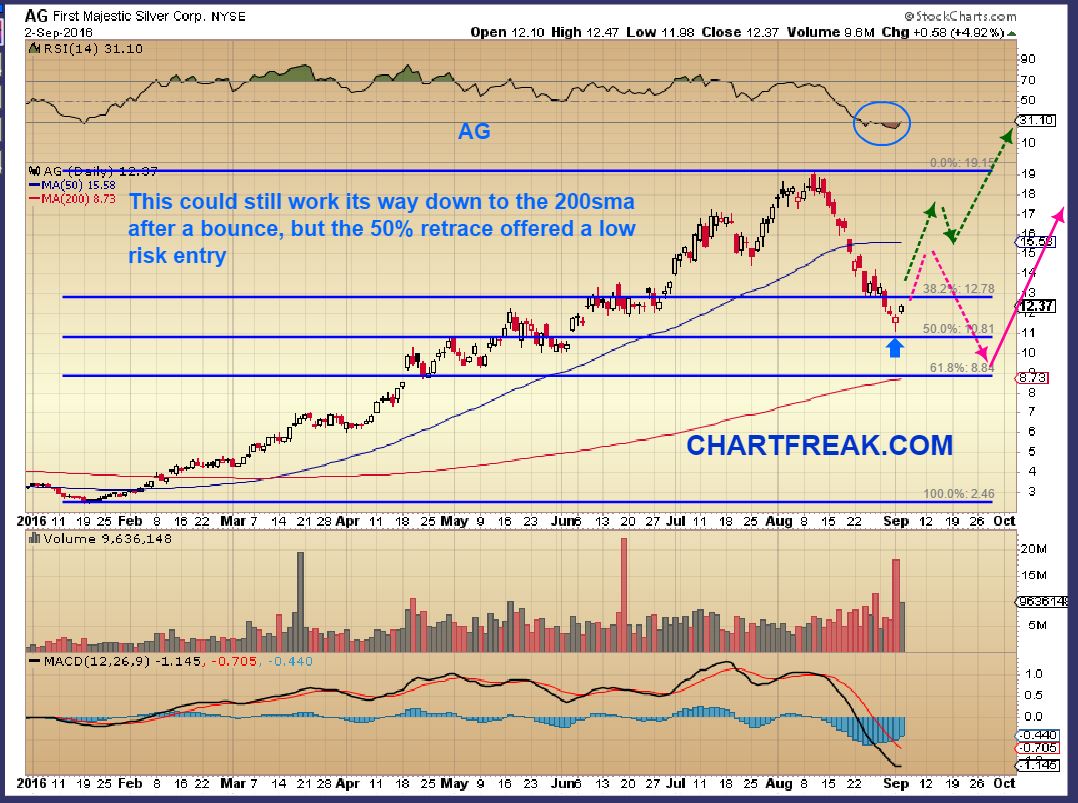
AG today – It pulled back to the 10sma ( hard to see , but it is the blue line) and recovered Wednesday. If it does that again, I may take a position.
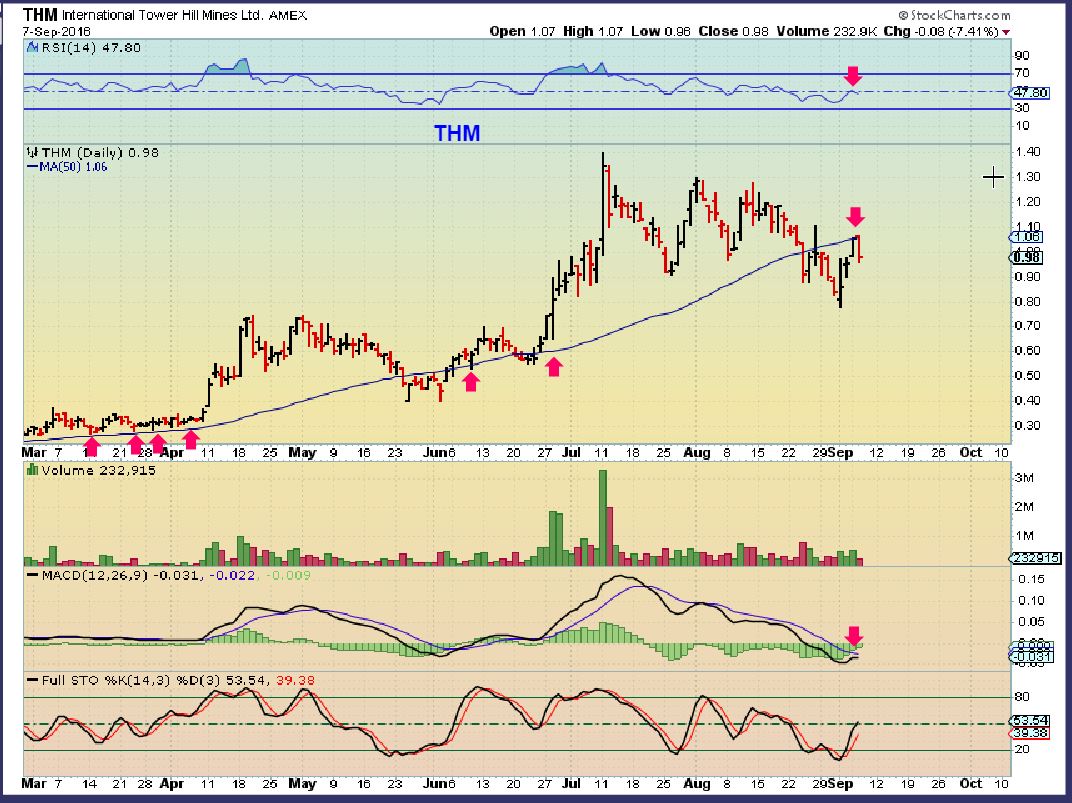
THM – I was looking to buy THM. It hit the 50sma as resistance. I decided that I want to wait for it to break through.
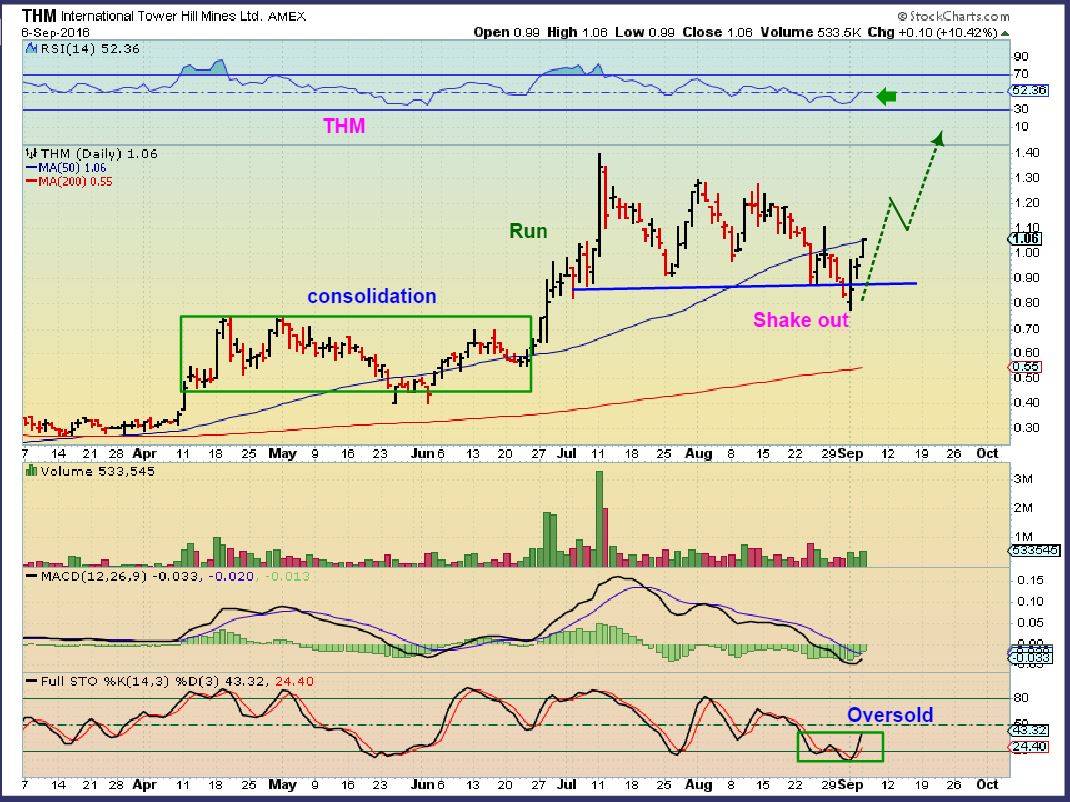
I thought that this looked good, and it does. Tagging the 10sma, but then I noticed that…
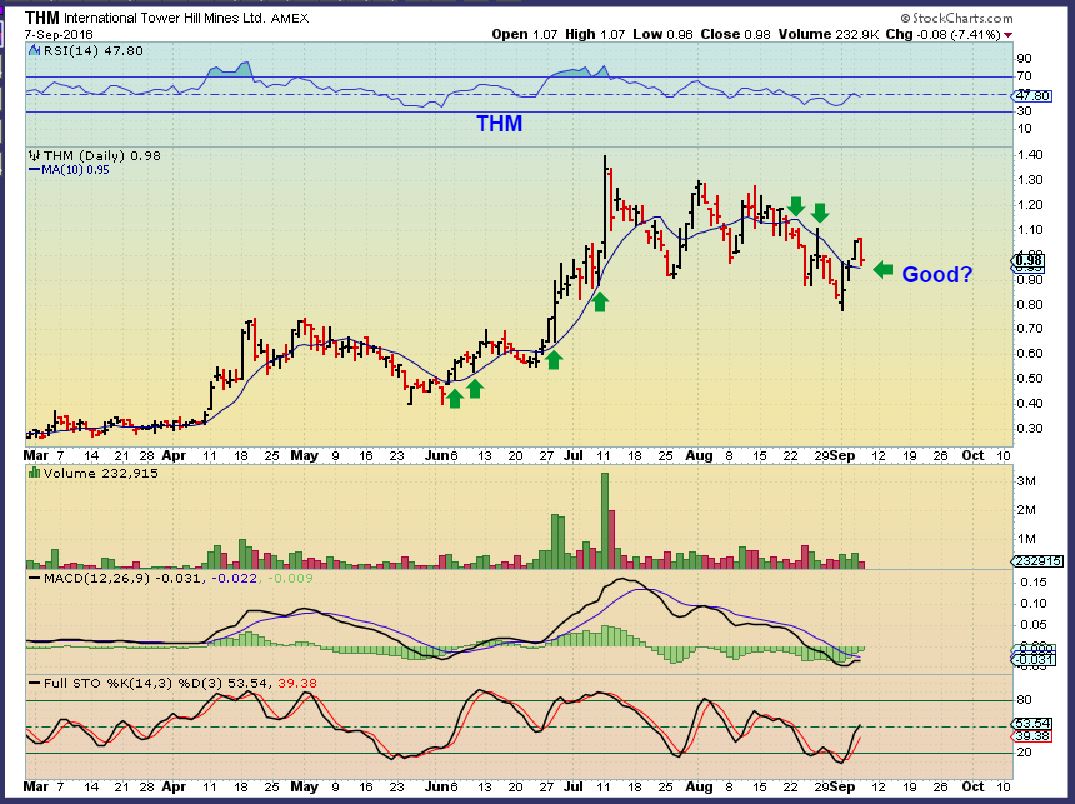
THM – It really should recover that 50sma before I take the trade. I do not want to own a bunch of miners quite yet, until this recovery proves itself. The cycle set up has me a bit more cautious, but I do like these set ups so far as low risk.
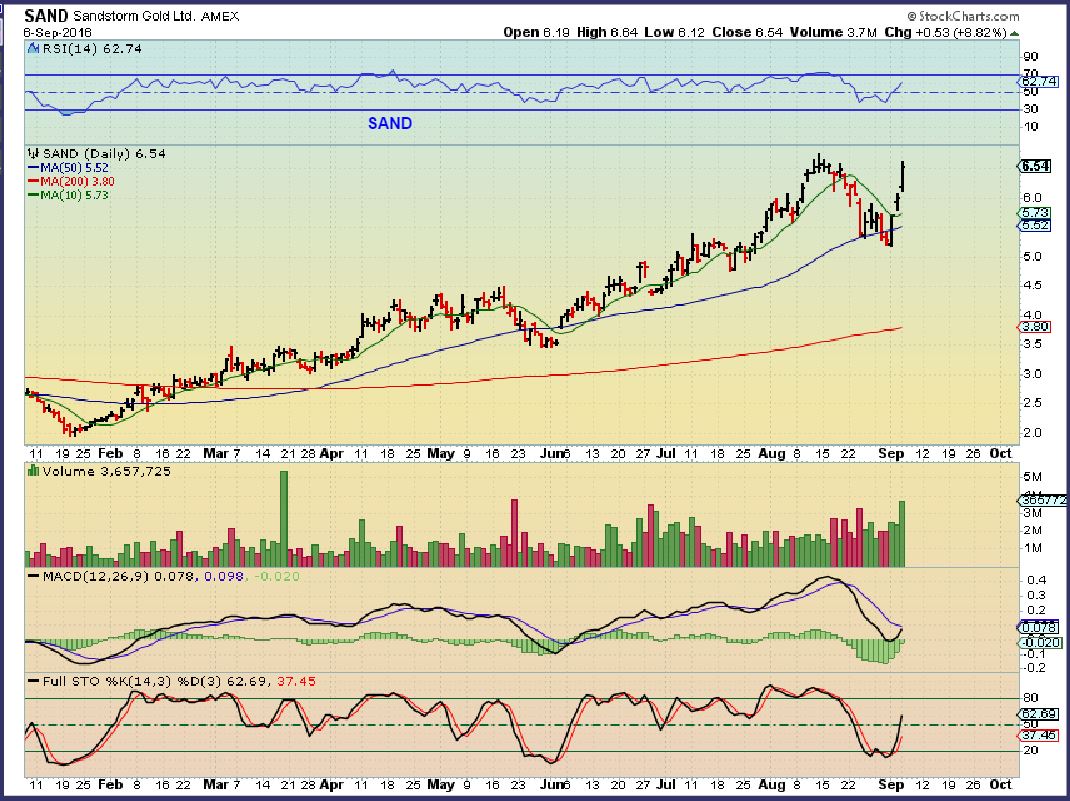
SAND from Wednesdays report. It dropped and recovered too, so it remains near 2016 highs along with a few others.
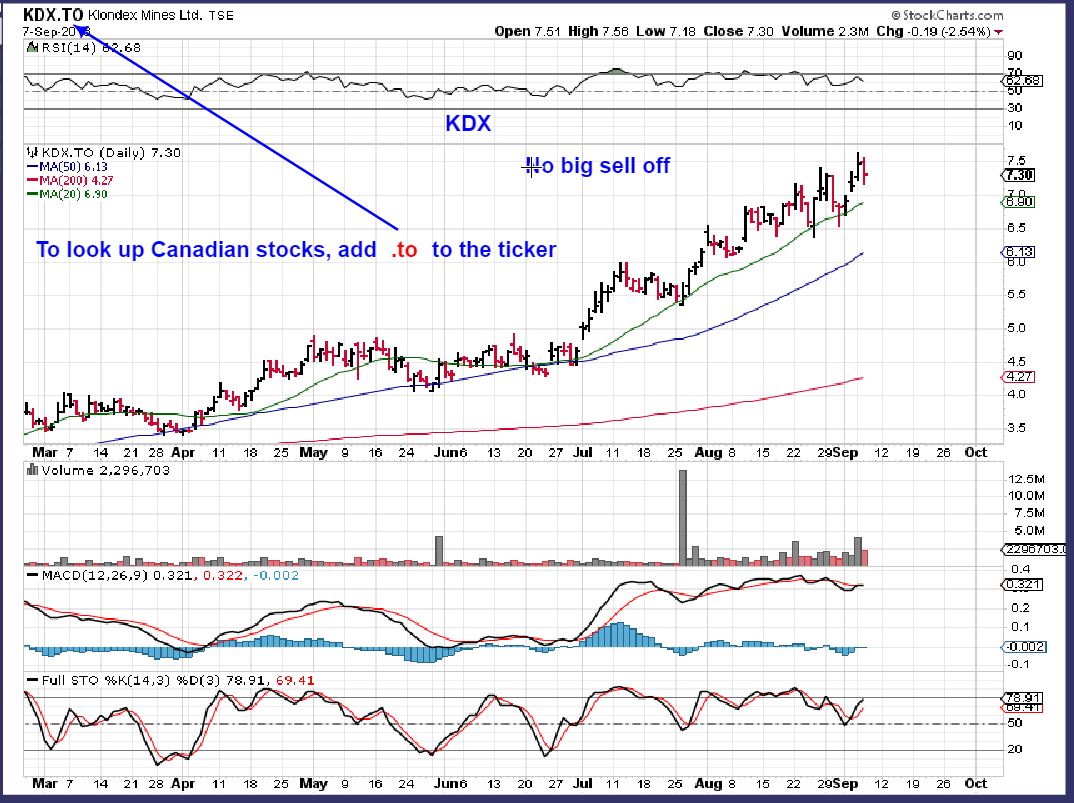
Also I showed this list. A note about this list. Most are traded on the Toronto stock exchange, many look excellent.
Since most are Canadian, some couldn’t find their charts. They can be looked up by adding a .to to the ticker, as shown on stockcharts. ** Some of these Canadian stocks did not sell off at all recently. If you can buy some of the miners listed on the Toronto stock exchange, it may be a safer play.
.
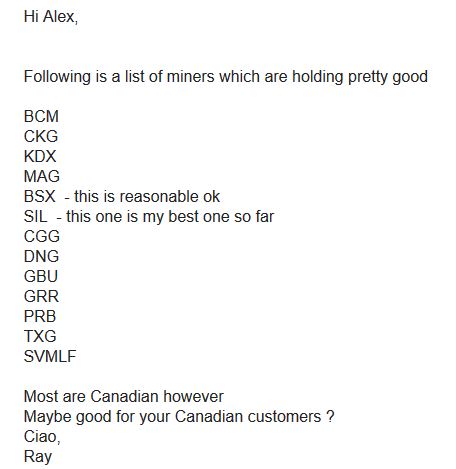
I pointed this out yesterday for example– This is the OTC listing. See how there was no big pull back and it is still almost breaking out. This is a strong stock chart.
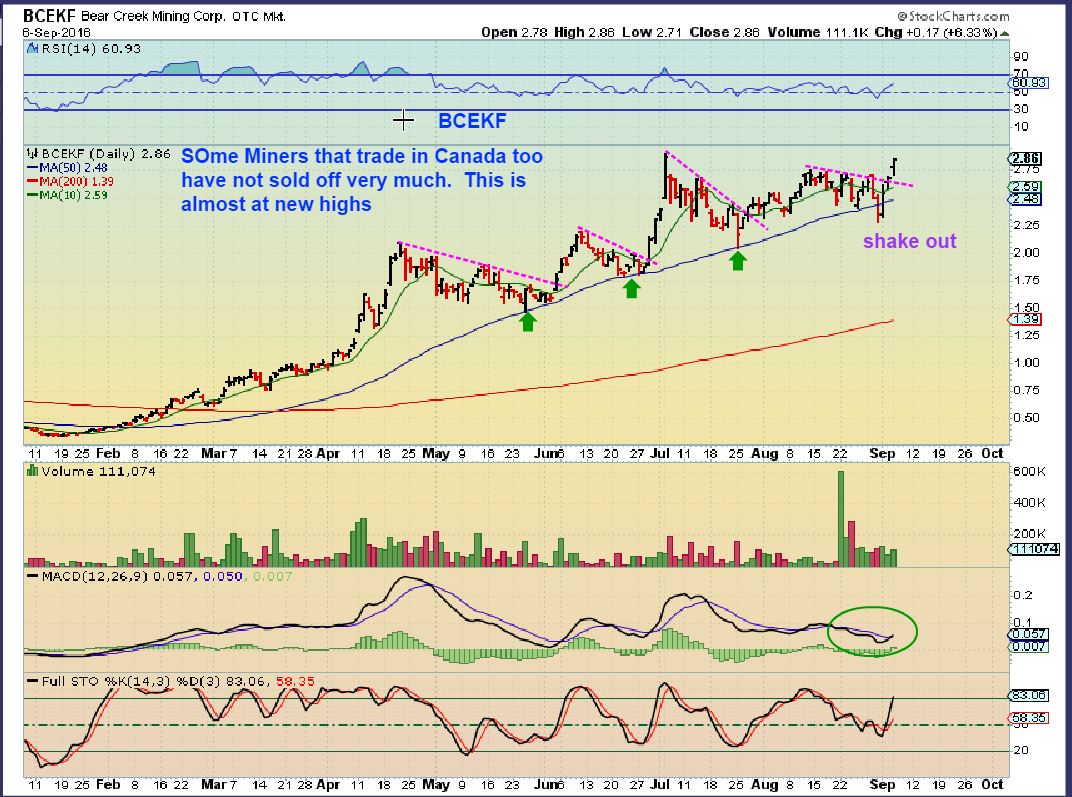
KLONDEX MINES – ( KLDX on the NYSE ) This is another one that didn’t drop with the recent sell off. Buy a pull back to the 20 sma. Even on the NYSE , it has stayed strong.
.
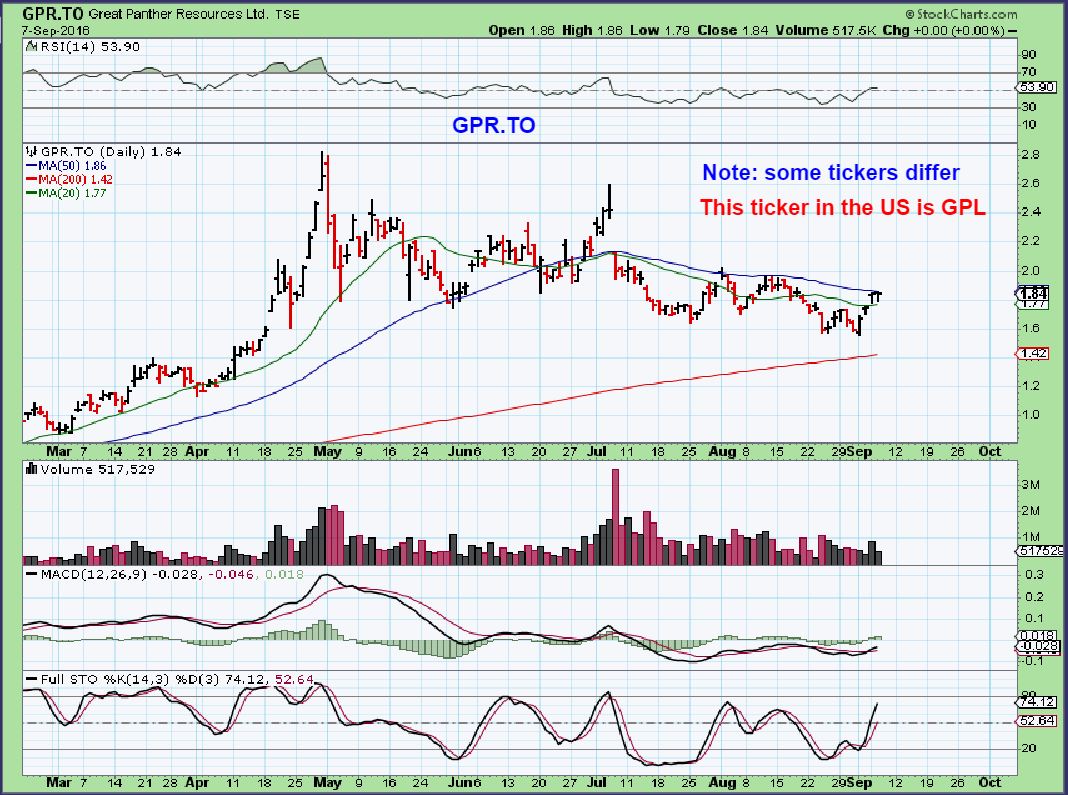
GREAT PANTHER – At times, the ticker will be different on the Toronto exchange. Great Panther in the U.S. is GPL. In Toronto it is GPR.TO, so you may need to take that list and work with it a bit if you are trying to find the equivalent ticker in the U.S. Some have OTC tickers, but the VOLUME IS EXTREMELY LOW. I WILL NOT BUY THOSE if they trade under 300,000 average ( maybe 200,000 average if the chart is exceptional.) .
SO pullbacks can offer lower risk entries, and then you must be cautious and use stops ( Mine are loose mental stops). Then allow the miners another week or so to prove themselves. I like the set ups on the Miners charts and Energy still looks good. Lets see what the OIL inventory report at 11 a.m. does for Oil Thursday morning. The chart for NATGAS does not look great, but I think that it is seeking out a dcl. 10:30 NATGAS report often moves it one way or the other. Pre-market, both are green. Best to all.
.


thanks Alex. Hopefully the govt. numbers will confirm those of API this morning. One that popped up as a buy on my radar this morning is one from the past CLF…..showing a buy on multiple time frames….went in yesterday….what do you see Alex? can you chart it for us? if so, thanks.
Hey Shermo
I do like CLF above the 10sma, looks good. Sorry that I dont have time to chart it up this a.m., maybe later if I get extra time.
Big drop just now in CLF? Wonder why?
late May and June it did the same break above 9 dma retrace to pivot before the run…..at the same time breaks above 0 line on macd
Trying to learn here…what does the action of the MACD around 0 tell you? And from post above, what is SL? Thanks
Thank you. I like to be a buy when macd is about to go above 0 on a daily chart…use 1 hour or 30 minute to time it better……I don’t like to buy if daily macd is below 0 to some degree.
SL for means means stop loss……I always have a stop loss normally the last daily cycle low or just beneath it for my comfort
Thanks so much. I’ll look at some charts to look at those things.
My SL is 5.50…. or cash out when macd stalls above 0
BTW, numbers for Crude will be released at 11 this morning eastern in lieu of the regular 10:30. NGas at 10:30.
: – )
Last paragraph in the report. Good reminder though .
USD index is rattled – swinging up and down. I can’t get into TD Waterhouse brokerage online this morning – overload, klitch, who knows. Maybe I’ll just go “chop wood”
No , no, no – today is Thursday. Practice new songs on the drums for pretend band day.
If you dont have drums, bike ride : )
😉
You can horseback
or actually work .. at work ..
What a novel idea…. giggle 😉
LGCY – I know you mentioned a little action yesterday. It is slowly creeping up.
LGCY- Big jump on Oil report. Good volume now.
i know its dead to Billybob & Cason, but i’ve jumped in on this one.
My indicator shows a breakout on weekly chart, as happened in april.
only problem is that it could reverse back and ‘unbreakout’ by end of week,… but i’ll risk it.
will put a stop below the daily 50 for a change!
I saw the same thing simply using the 10 MA
I like the set up
btw.. for anyone who didnt see.. there was a chart , so f5 refresh!
AXAS is looking pretty good here, too, eh? Weekly chart is kinda similar to LGCY–creeping up there.
Axas has done well, and if I owned it I’d hold it, but I feel that AXAS is too extended on a daily chart.
If I enter it here, it could pull back quite a bit and still be normal, but painful.
US Dollar breaking below the lower trend line this morning. Its been here before and rebounded quickly. Lets hope it holds and accelerates lower. Gold should start jumping higher if there is follow through. F5
Thanks Bill. News on Draghi not increasing asset purchases might help.
http://blogs.marketwatch.com/thetell/2016/09/08/ecb-live-blog-what-does-draghi-have-in-store-for-bond-buying-program/
With the EURO being devalued, would you expect the FED to devalue the USD as well? To keep an equal trading landscape so to speak?
Dollar moving sharply higher here. Looks like support at trend line held.
Alex, I don’t like the way the metals are ignoring this half a percent drop in the US dollar here. Any thoughts ???
No thoughts yet
US Dollar 1/2% higher in the last 1/2 hour. Stalling at the 200sma on the 15min chart, maybe.
USD started the day at midnight at 94.88 and now it is at 94.85 – just a bunch of noise so far
Hey, there is wood to be cut,split, and stacked!
… i can help with your wood …. im pretty handy with a sledge&maul
orrrr i can just be the beer girl…and watch everyone else swing those axes&sweat … yowza
teehee 😉
I watched you use the sledge and maul and that guy yesterday……very impressive
😀
ADDED to PGH position again
Yay team PGH! Rah Rah Rah…[cheerleader here]
Any idea why AREX falling like it is?
Pull up a 3 month chart and look at the 10sma.
It is an awesome chart, they cannot go up everyday 🙂
Ok, true…thanks…..I’m learning alot from you about looking at those moving average lines and trying to notice more when they are stretched over, etc. 🙂 🙂
So the way I use it at times is like this….you want to “Buy the dips”
If I was thinking of adding to my AREX, this is actually what I look at . If it gets down there on lighter volume, or sideways and the 10 catches up, that is where I would add with a stop a bit below it ( Allowing for wiggle room)
Do you use a particular average…as in the 10 day or 50 day? Or does it depend on where it’s at in the cycle?
It does depend.
For arex, it has been climbing that 10sma, you can see that it bounces off of it since I bought near $1.60, so if I buy down there at an ICL, and it keeps acting correctly, I add on those tags of the 10sma. I am fully loaded at this time, so I will not add anymore.
I follow an oil analyst who has a big following. yesterday he started selling AREX because he figures it needs a LOT higher oil prices to be viable. Just the act of him mentioning that online would have caused a big group of investors to sell. Probably a short term anomaly, but he for sure contributed to the distribution today.
Ah, thanks for the info….it kind of tried to come back but now is back down again, even with everything else rallying pretty good…..
Maybe it’s a good time to scoop up more….or not…or…:)
Alex, are we on day 25 of the oil cycle? And if so, we should have a few more days (10 or so?) before it will start falling into it’s next DCL, is that correct?
As I have mentioned, OIL itself has been acting odd. Oil cycles can run 30-50 days.
Energy stocks have been acting correctly.
Oil inventories may clear things up for oil at 11 this a.m., but cycle wise it had a rather deep 1/2 cycle low if that is what it was
Anyone using Merril Edge? Im thinking of changing from TD. 30 free trades a month! Is there a ticker to watch the US dollar on Edge?
I use it. I had an offer for free trades too [not on options] and it is why I started trading again in Feb. with Alex. I like it. With a large enough dep., you get the Market Pro platform which is very useful. Lots of background data and tools. I know it has charts but I was used to my charts at my other acct so still use those. Not having to pay for trades really has freed me up to trade frequently and take partial positions.
Do you know the ticker for US Dollar? Im using DXY on Tradingview. Doesn’t compute on ME.
i use usdollar for intraday in TV
meow
https://www.tradingview.com/chart/iwxbhtdJ/
Really nice chart Maria.
I use DXY in TV! #HB
I have not figured it out…love Maria’s chart below…if you find out, let me know ok? I love the free trades…it really lets you act more freely.
Have you tried TD’s trading platform: ThinkOrSwim?
I’ve been on it for several years (since before TD bought them) and it’s pretty dandy
Concur. ThinkOrSwim mobile app is better than most desktop brokerage software.
I looked at it a few times, seemed too involved so I never got into it.
NICE CHART ON NAK – 10 day 30, 15 minute
I sold partial near the highs, held a core position, added to that core again ( just for a trade possibly)
good call on TK. In since 7.30.. Thinking about taking my 10% gains. Thoughts?
TK is an inverse head & shoulders – my upside target has it going to $8.50 or $9.50.
Take the 10% if you are satisfied. If it was a big position, you could take partial profits & use a trailing stop or mental stop & ride.
IT COULD BACK TEST $7.50 BEFORE CONTINUING HIGHER
OIL spiked on inventory report.
Now watch and see if the energy stocks will react
There goes OIL,, massive drawdown,
Good to see JNUG MACD going positive. I’m holding from 8/31. So far so good.
Nice trade Fred – I had that trade too ( I sold mine as a trade) .
I still think we get another leg higher, so it should work out rather well for you.
You’re sitting on plenty of gains anyway. 🙂
Another leg higher…that’s what I like to hear.
Yep, GDXJ looks like a bull flag here ( and only day 4 for cycles.).
Ignoring cycles, GDXJ actually looks like it wants to break out to new highs with that bull flag. I like the set up, but stay cautious for the sake of ‘just in case’.
If I could have caught the bounce at the open I would have sold the remaining half of my NUGT there,
Is anyone still in that CHK trade with me. hat has been a strong one. Heading to former April highs , and likely on to Oct 2015 highs
In the more attractive sister, CRK since 4.50 1700 shares
I wish I was! Got out already…..guess it’s too late to jump in now….
Absolutely! Wow. LPI is doing well also. But… I sold my OAS on Friday. Feeling pretty stupid about that, especially since you and a few others said they were still acting bullish. Here’s my summary of the OAS trade dialogue: https://youtu.be/VAFM3P1Mt10
Stay on target- almost there..lol
I stayed in OAS. Have done well with it before but it sometimes takes patience.
Man, I bought too early in OAS and was down quite a bit but CF gave me confidence when we struck the oil lows. I bought more, got some long calls and then sold calls against it in consolidation. Turned a potential loser into a huge winner. All bc of the reports and great community here. Thanks all!!!!
CF, I’m up big in OAS and WPX. Doing alright in LPI and DNR, WLL as well. Oh yeah and PGH now too. Do I need to sell a bit or from report sounds like we have more to go? Thanks!
nope i dumped this like a dummass earlier.
will it meet resistance at this point?
a nice pullback handle on that big cup, and i’ll re-enter
I had been too red for too long so baled out with a small profit when I got my first chance. That and CRK. Confusing to have CHK and CRK at once…lol.
Still holding CHK
Non-commodity related, but thoughts on SORL chart? 3 P/E
Looks like a NATGAS rocket ( dcl)
Yup. Bought it. I already knew the injection was bullish so I preloaded
I hope Ken had some free time mid day to add is position in Oil
I do but I will wait now for a pull back in Oil to add my 2nd tranche……short term over sold now after report And price reversed down off Trend Line……so I will be patient to add unless USO breaks that TL.
Needed to get that Inventory Report out of the way…….
USO Chart:
T1 pattern in play or topping out at the upper trend line?
It seems the mistake I make at a times like this is to buy on the bounce and then regret it as they pull back in a few days later.
I added to REI before the news, and bought SGY yesterday, but other than that I am going to try to just ride what I have until the next dip. I always get this greed thing happening where I think the market it taking off in a one way rocket and I will miss out if I don’t chase.
That is good self analysis, and the best way to learn.
I’ve done that ( I still do buy as they run higher at times, on dips to the M.A.’s ) , but buying the dip takes conviction, and when you are correct in your analyses….pays off much better,.
I get similar urges to buy when I shouldn’t, but not making purchases until the EOD can help with that. Most morning pops end up fading. Just an idea.
I’ve pretty much trademarked that move at this point!!
SGY update
I’m out of NUGT now, still holding NAK. Dollar moving higher
I’m not saying that it will, but the set up on PGH shows me that PGH can run straight to $2 from here without pull back.
The consolidation that everyone kept saying they wanted to sell….did its job.
Many probably did sell, and they may jump back in now that it looks like this ( Refresh)
.
.
I really like this chart, too. Two tactics questions: (1) if you were going to buy your first tranche here, where’s a good place to put a stop? I see the 10 and 20 are kinda close. Hmm. (2) given the breakout, and the fact that I’ve already got a good “hand” in CHK, would you consider adding to the CHK position on this breakout, or would you wait for some other condition? Or not even bother and just look for better “late bloomers” like LGCY to buy when they break out?
I often rotate my crops, trying to get better growth from fresher soil if the set up is there. I may sell
a partial on a big position that is very extended , like on a weekly chart, and buy one just starting out.
….but thats just me
Im still in it with ya, You’ve been dead on so far on this one so im hoping you are again, Ill take $2
Still here. 🙂
Yes, it has been a boring trade ( Just like SB was) , but I dont think that it’ll stay boring forever. We appear to be nearing the apex.
.
MEMP – refresh
.
amrs tryn2get jiggy
I know, I S-T-I-L-L own that one. Can you believe that??
yeah.. same
MEMP can be yummy.
Like the Shippers (SINO and TOPS) here
mmmm .. i like yummmy 😉
Using a 50sma, it sits on it and today has reversed. Maybe I’ll Tweet it out tomorrow and see if we can attract some more buying
and the 34 which i use…standing tall and pretty
i luv the hourly… count looks done…(obviously can extend)
The daily chart of gold looks like it dropped today to test the 50day MA. Alex (or anyone!), is that a good line in the sand to use for a stop-loss for non-core positions?
I think it went below it, but I’d wait until the close. Also I dont think it is breaking down here, it is only day 4 GLD may fill that first gap.
GDX maybe finding a double bottom on the hourly chart at $27.80. I should take a chance back with NUGT? I’ll watch
Nope, GDX breaking lower.
There are some energy stocks appearing on the SoS list (e.g., KMI). Does anyone pay attention to SoS numbers? If so, is there a way to interpret what matters?
Anyone in UWTI with me?
shorting DWTI…stuck in neutral
I tried. I had a limit in on USO calls and the price was there but broker didn’t get it filled. Don’t know why. Stupid work making me busy when I’m trying to trade!! If I had the time would have switched to market. The ones I was stalking were up 200% today. Agh!!!
After suffering through the draw down from 27 to 17 with NRP it looks to be regaining the promise it once held. There is something to be said for just blind luck, and the eternal hope for a “pot of gold”. large volume.
Speaking of boring shippers…been holding NAT for a bit. Looks like it might have doubled bottomed recently. I make few comments here but have been stalking shippers. Was shook out of all but NAT, DHT and SB. Glad I held those. Shippers are volatile but much unloved and many in long low bases.
Man, I was ready to give up on SB then she was suddenly resurrected this week. Might not hold much longer. We get another pop and I’ll take the $$ and run!
Anybody got news/views on EVEP? Been holding at a loss for some time and trying to figure if I should dump it for something that is moving a bit quicker.
No advice and have no idea on the company and no recommendation to sell or hold, but I feel your pain, and today may be your best day,, I rode that dog til even the fleas died,,finally bailed as close to even as I thought id get and moved on,, that thing bounces around enough just to keep you on it, best to you though,
I was actually thinking of buying that this a.m. . Funny that you brought that up.
I like the long base on a 6 month chart . I like the volume today, but it keeps doing that and giving it up. ONE OF THESE TIMES, it will just rocket higher I think.
lol.. me too
looks like that one is about to break out as well as LGCY
just still trapped below the surface of a large consolidation triangle
i bought this EoD.
closing above 50 & 200 on the daily SMAs.
..nevermind.. lol
ok .. here it is . GDX weekly… so -by this count we have completed “1” and are still currently in “2” which should end before OCT… does that fit your ‘cycle’ theory Maestro … (quit pretending your practicing)
.. https://www.tradingview.com/x/m9jj5vD0/
ps. I copied and ‘flipped’ the last leg down .. it LOOKs verrrrry familiar … hmmmmmmmmm ????
This chart would definitely fit the way cycles look.
The ICL would b the next drop labelled 2, and then the next leg up.
hmmm… i like it…
SGY
dang… im seeing IH&S everywhere in miners and energy
https://www.tradingview.com/x/ucWmu5OK/
i may be going crazy….
*no comments from the peanut gallery… giggle
That’s a masterpiece. Great artistry! Thanks Maria
well.. far from that but thank u shermo…
one of these days I’ll get it … then I’ll be off like a vengeance … it might very well be when I’m 95 and sittin in my granny rocker counting stars… buttttt … I will get it ;o)
You said Butt!
… yeah i did …just 4u
I’m drinking the Kool Aide
yeah… are u seeing these?
https://www.tradingview.com/x/FETwOZNl/
I see the USD in the middle of a T1 pattern headed to $95.63. I’ll buy NUGT when that completes. I can see it on XAUUSD as well, $1325 target.
yea.. well IDK what that pattern is since u DIDNT show me #HB … butt .#HB … . im kinda watchin to see if this pattern plays out…. kinda similar..
https://www.tradingview.com/x/NeYWirQy/
refresh.. i added labeling
I don’t know what that is? 3D?
three days
*giggle
I still am lost? 11800 in the USD?
ohhhhhhhhhhh sorry – my bad – it’s Forex
the DXY ticker on TV does not allow for using different time intervals… I’ve been using that so long I forgot … *giggle .. sorry 🙂
Sorry, we talked about T1 patterns a few weeks ago. Thought you were up on it, like you are on everything else. T1 is same as AB=CD, different terminology. F5 for $1325 chart.#HB
LOL
kiissmyA$$Pecos….
Oh My!
ahhh.. tx
30m looks like a bull flag still to me!
I hope you’re wrong on this one Maria, I hoping for a bit more upside before we head to your lower target, and I know hope is bad 🙂
no worries millerTime.. most likely i am…;)
That what scares me. You’re usually not. It’s uncanny how sone over your overlays play out right over the current times.this time I’m on the wrong side. Lol Im just going for leg up to unload some calls.
This is how I’m tracking it. Can it be that easy? That wave 3 could make a lot of green $$$
Hello Cason, I worked all day and missed the dialogue. I got in and everyone was gone. I was curious if you knew if Alex was putting out a Friday for tomorrow? The reason is that Gold has me puzzled. Its on day 4 of this last DCL and it can’t make up its mind! When I use my imagination, I see a left translation over the last few days but….I can also see $GOLD going sideways for a few days. What do you see? ($GOLD daily)
Hey Johnny, I’ve been grinding all day as well. And MISSING the USO trade (grr). Alex has been on point with Fri reports recently, we’re getting spoiled.
Gold is right on the 50-day, MACD just crossed up, low volume oullback, early in cycle. I like it here. Wouldn’t marry my position here but like it. If she busts above 1372 or so then it’s a new ballgame.
GDX right on 10 Day might be a nice trade! Few days only for right now. Also all miners in the report. So far I see a bull flag! GL
Thanks Cason. I always appreciate your post! Back to work but…… Happy Friiiiiiiiiiiiiiiiiiday!
Thanks, man. Glad someone gets use of my midnight commentary. Haven’t had enough time to post charts recently. 🙁 will take a look at CLF this weekend
You bet! Everyone is spent by the time I get here. Its good to talk after hours. I have a few ideas for the weekend too. Have a good day!
Cason, I was glad I was away from the screen today. I stopped out of most positions and made some money. I am no expert but I am thinking $GOLD ICL. And oil has me cautious just because of bankruptcies. I check out Dallas Salazar on stock twits and he has so much debt info on oil companies…..its sobering. & yes I do enjoy your post. Alex is so good …he makes us all try harder. Its nice to know everyone works together here. What are your thoughts on today?
Hey Johnny, put my reply in line below Ann’so question at top of comments to the Friday report. This was ugly. I mean UGLY, like hide Momma and the kids bad. Barf!!
Hahahaha!
I will Johnny, Working on it now .
Mainly energy, brief GOLD MINERS talk
Ended up buying SALT instead of more energy. I liked the set up for stops better, and looks like other chart goodies are still in play as well. Done for the day. Off to *bort*
why shippers ? techs fundamentals ??? CHEERS !
BAS…… +82% today
‘kin hell!
Yeah they released a doc last night that staves off bankruptcy for at least a few more weeks. But they’re still buggered!
Haha wish you hadn’t posted that. I pulled that one up when it was up 10% this morning and thought about buying…….
Energy names always do a 50-100% move once they get to .40 or .50… ACI, KWK, ANR, HERO, SUNE. They were all obviously going bankrupt but had one massive short covering day.
Look at the volume!
ohmyword
I wanted to see how it looked on the monthly chart.
The weekly chart for CMG looks good right now, I think:
-Two weeks ago, broke out above the 10ma, met resistance at 20ma.
-The following week it successfully backtested the 10ma.
-This week it broke out above the 10 and 20ma.
-Downward trend line broken as well.
-PSAR flipped bullish.
-Divergence of price and momentum/money flow since March=bullish setup.
-Also seems like a double bottom, June and August.
-Also setting up possible inverse H&S, so could buy part here and add on a break above neckline around 550.
-If tomorrow adds some decent volume, the volume trend will be up as well.
That’s my two cents! Of course, the real question is whether or not consumers still use Chipotle as a euphemistic verb to describe major GI issues, as in “I gotta Chipotle!” Maybe this is what attracted Ackman?
This is why! Google drones will start delivering Chipotle! http://money.cnn.com/2016/09/08/technology/google-drone-chipotle-burrito/index.html