
Attention Please
After all of the sideways chop, I think we finally have something interesting to talk about.
.
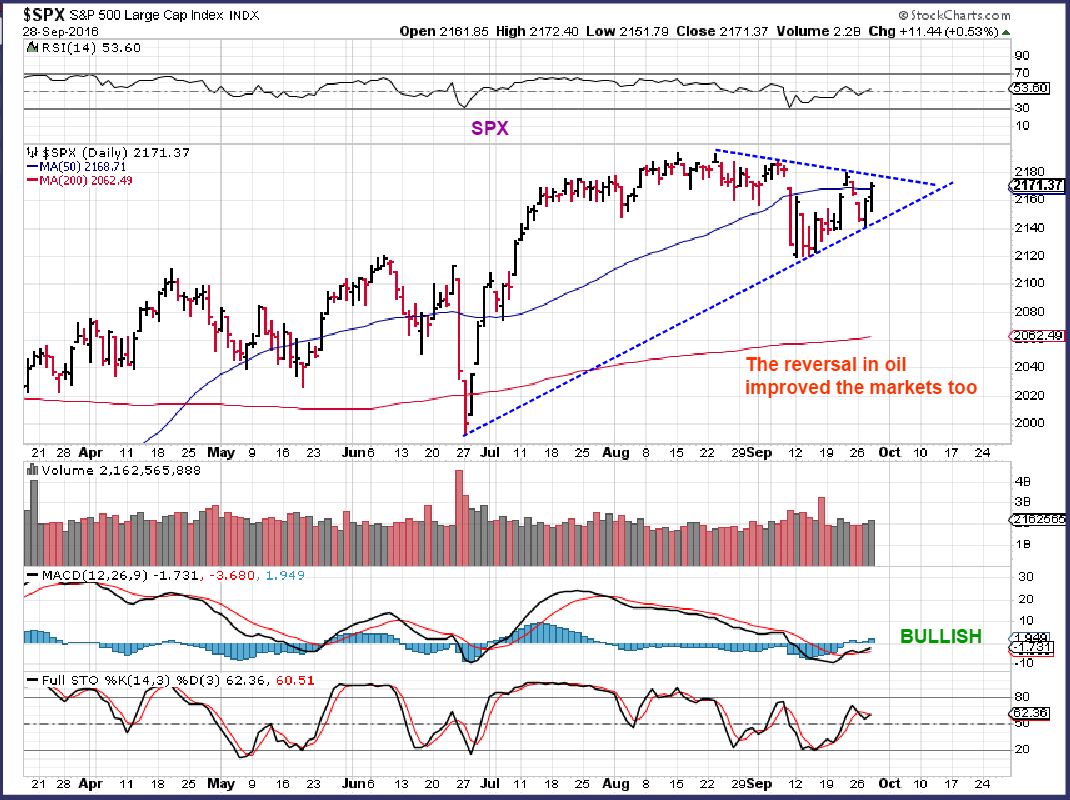
SPX – If Oil could get moving higher, I think we’ll see the markets moving higher too. After all of this sideways chop ( in many sectors), this is a bullish set up with todays strong reversal.
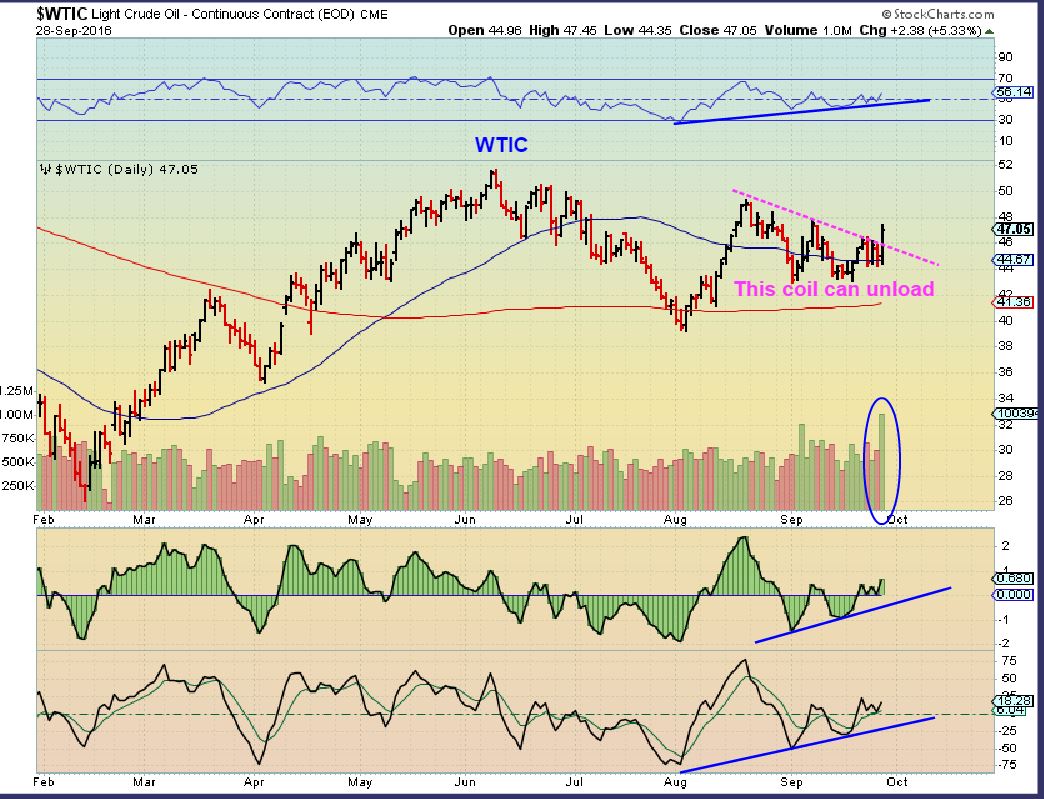
WTIC – This is a solid break out, and even if you see OIL down on Thursday morning, I believe that it will have follow through. This would be day 6 of a new daily cycle with the blue arrow being a dcl. ( Edit: I think this is actually day 8, see next chart).
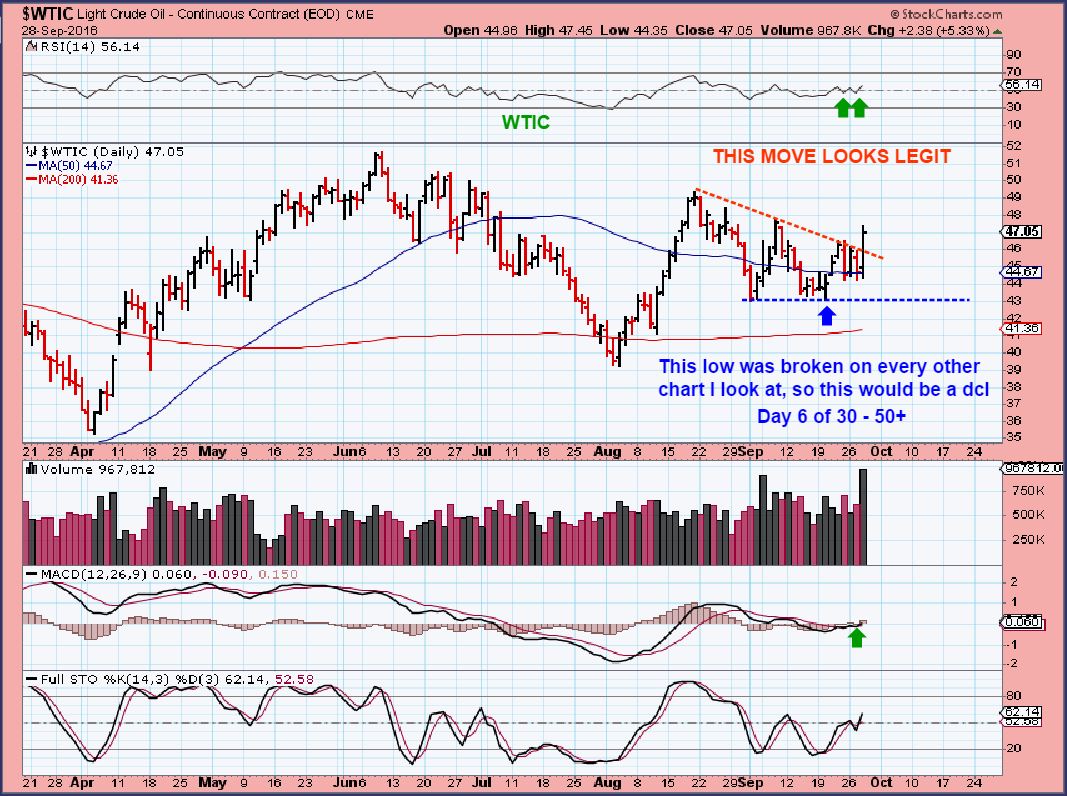
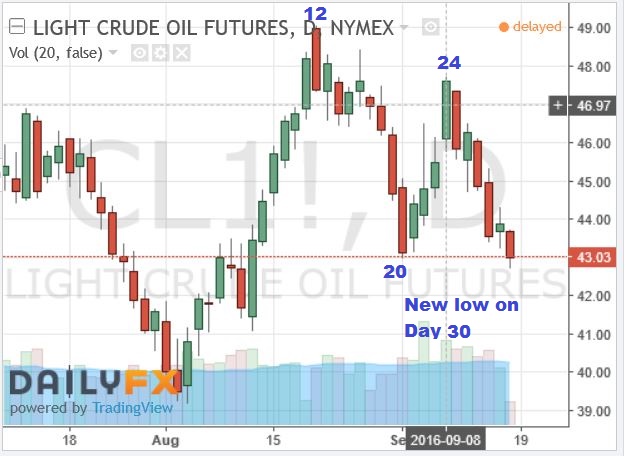
I posted this chart before to show that we did get a new low on day 30, which was Sept 16th. For some reason, Stockcharts doesn’t show a new low on that day, but other charts do. That allows for a DCL on the 16th.
UPDATED CHART –
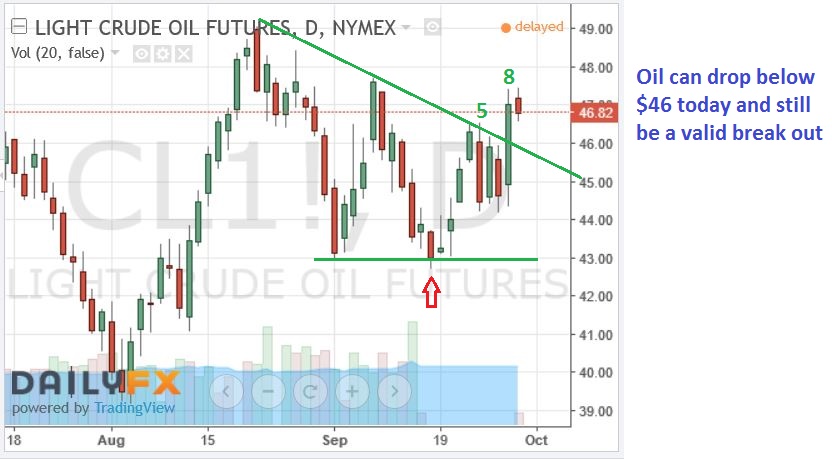
So again, after coiling and building energy in this sideways move, Oil can run higher in a big way, especially if no one believes it. I have read tonight that plenty do not believe this move. This chart and the indicators are bullish.
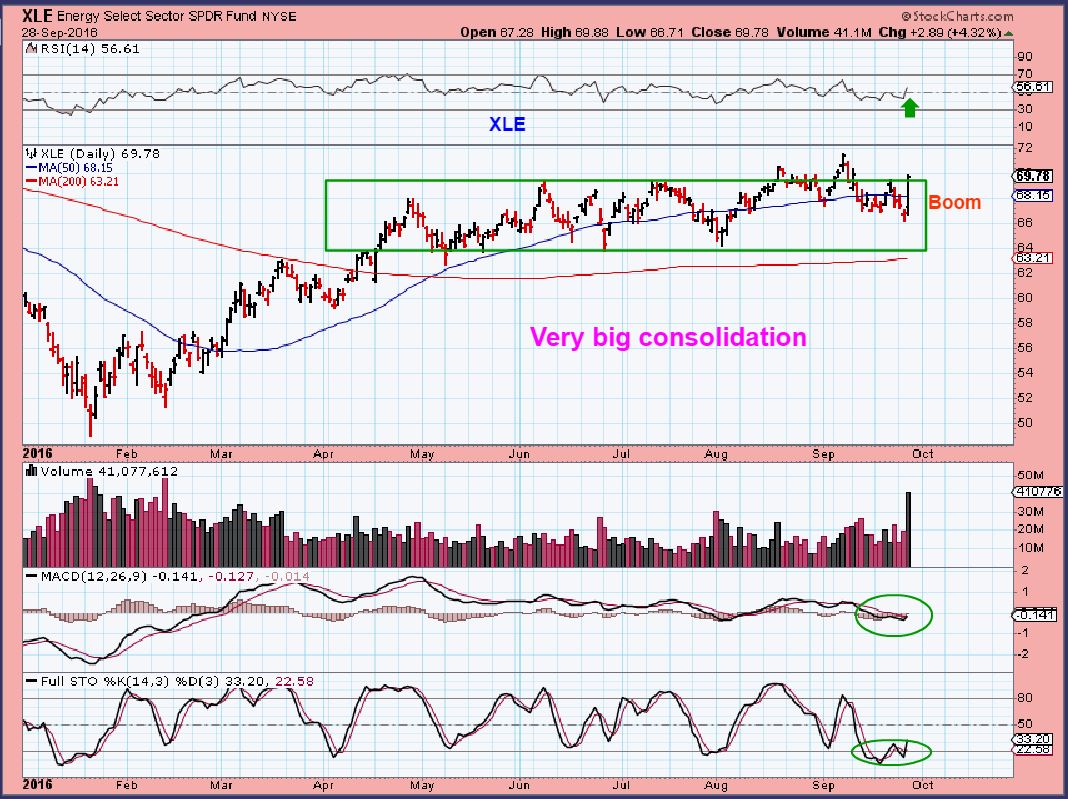
The XLE believes it, and this consolidation can also lead to a strong run higher. Follow through could be very strong, so a pullback today may give you an opportunity to enter a lower risk position.
.
I will discuss more on the energy sector at the end of the report.
.
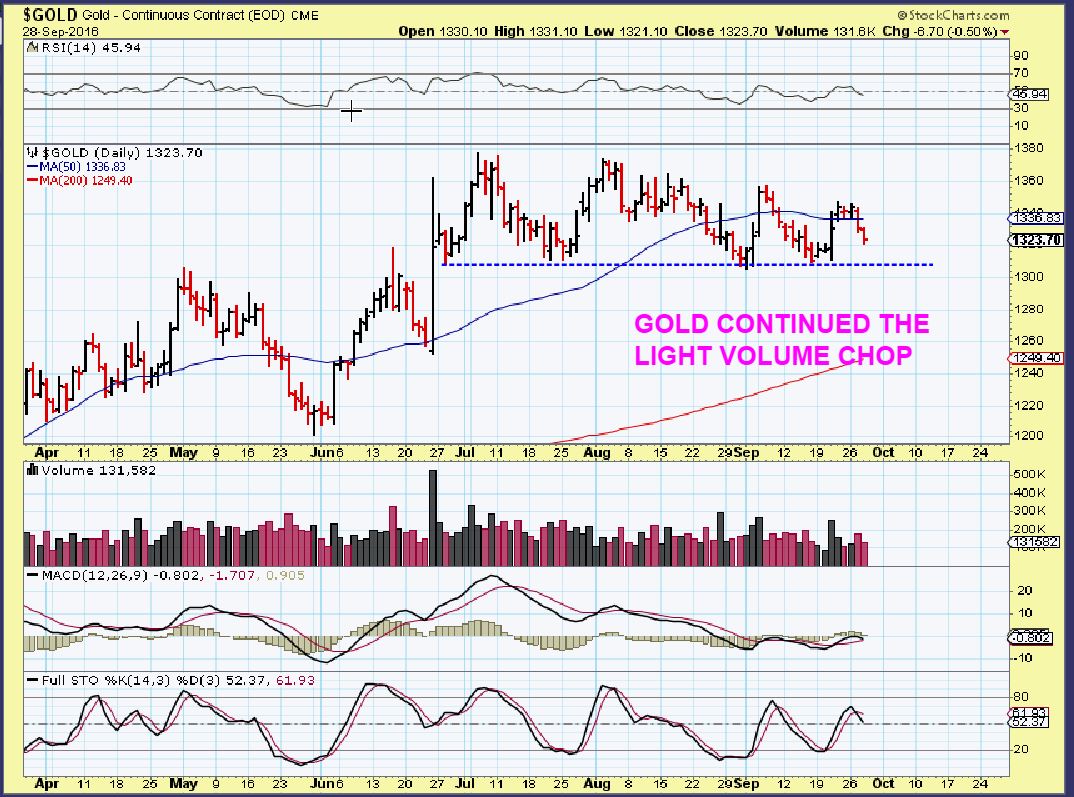
GOLD – This was interesting, because GOLD & SILVER both continued their sideways chop and they dropped down on Thursday.
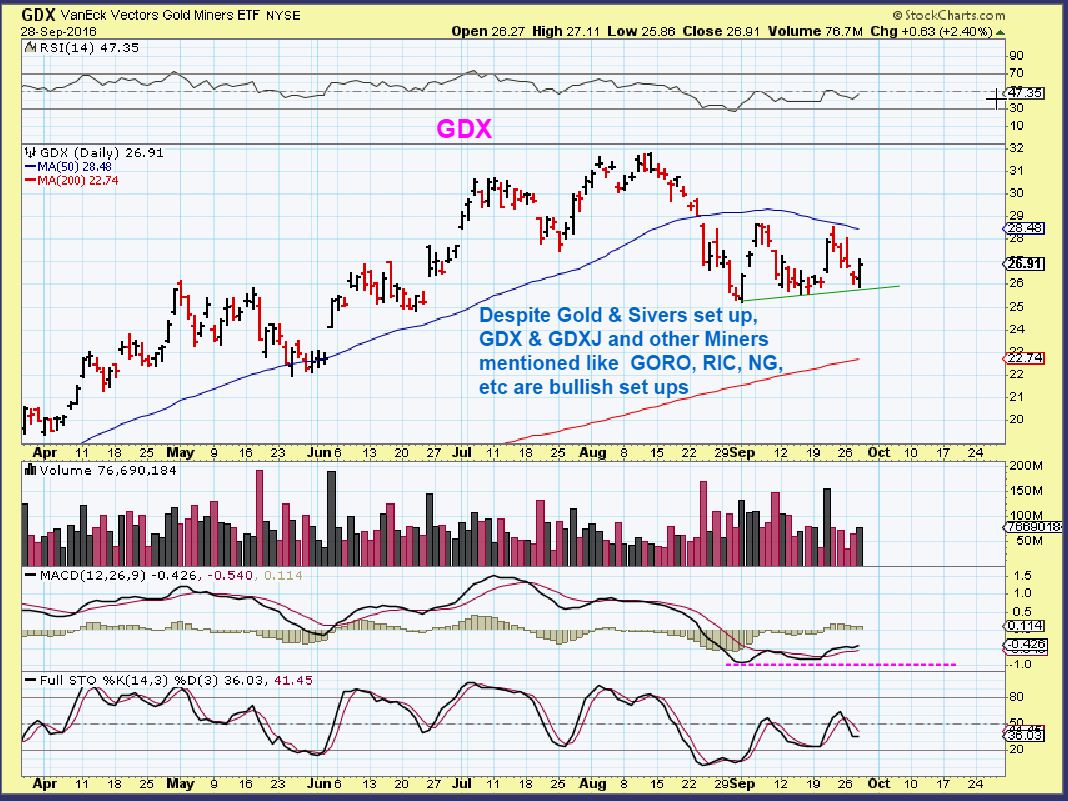
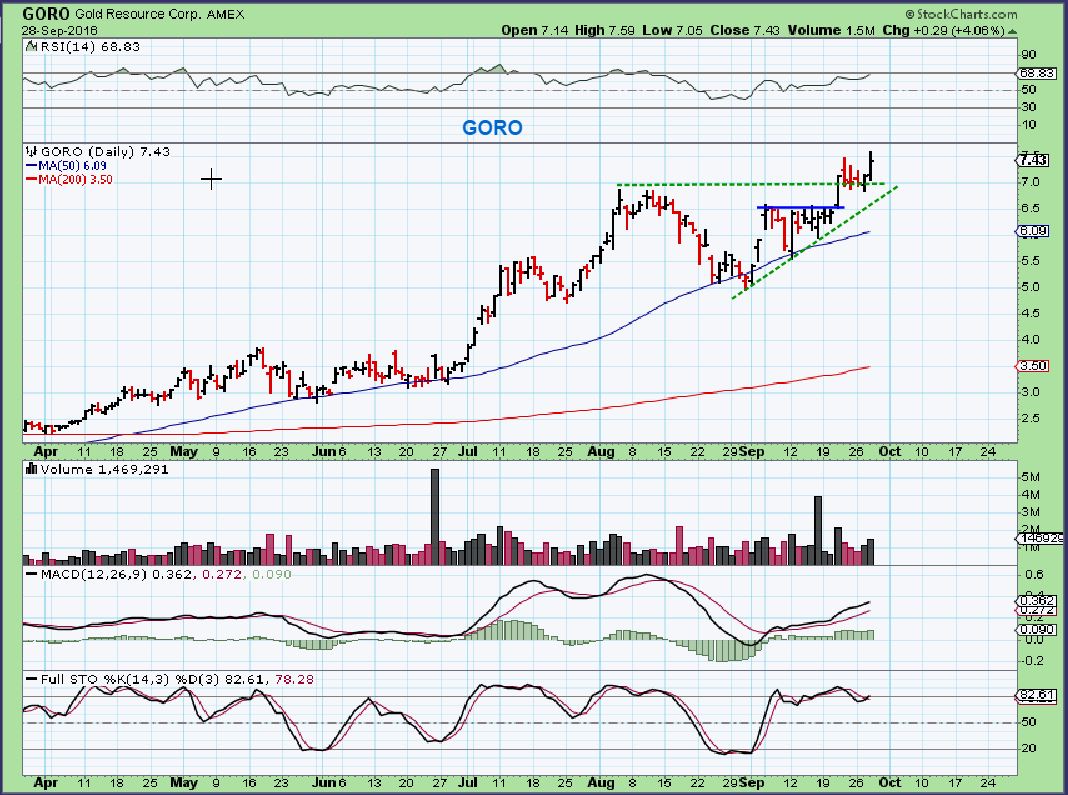
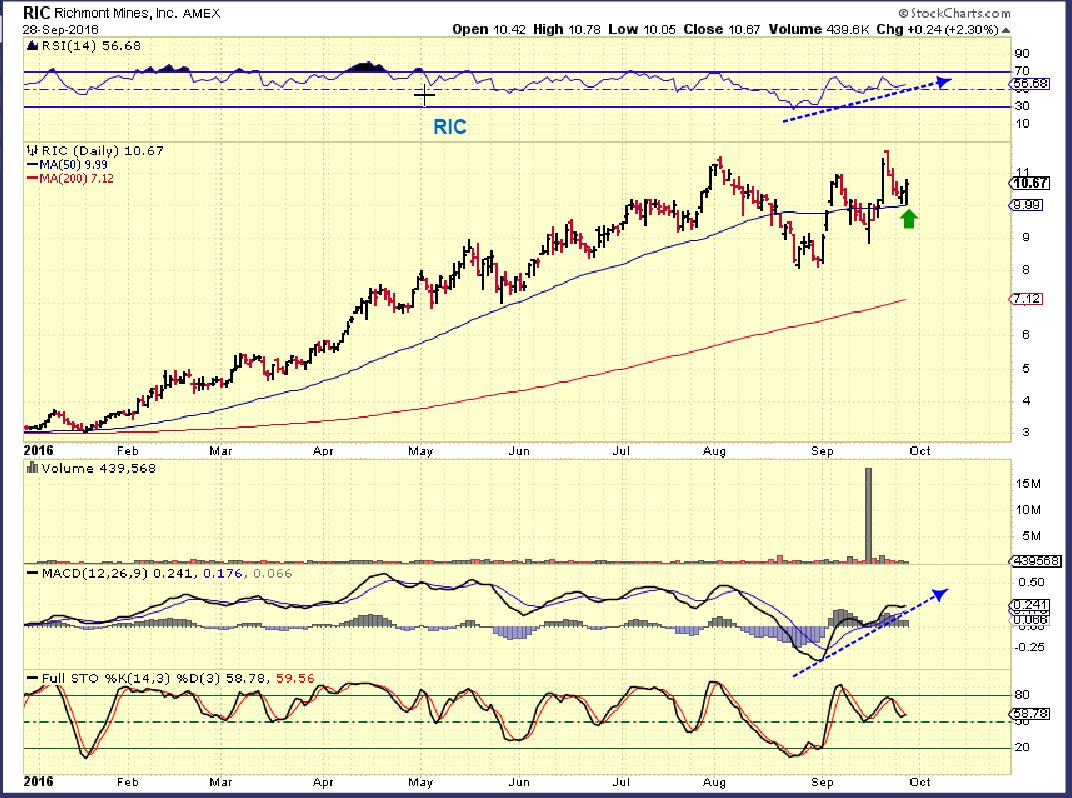
GDX – Why did Miners reverse so sharply? And I have been pointing out that several Miners actually look bullish with all of this choppy action. GORO, NG, RIC, etc.
.
GORO – Does this look bullish or bearish?
RIC – This re-gained the 50sma last week and held up on it this week. I think that we are going to see some Miners being accumulated after that steep August sell off . This is why a ‘core’ holding pays off. In bull markets, we do see surprises to the upside and this is quite surprising.
SO Oil broke out yesterday and recently I have watched OIL turn higher and energy stocks didn’t follow along with conviction. I reported earlier this week that OIL shot higher by 3%, but energy stocks did not. Look at the charts and you will see that on Monday OIL surged higher and the XLE was red. Well on Wednesday, Energy stocks DEFINITELY did surge higher with Oil, as we saw on the XLE chart. I wonder if they will pull back this morning and offer a low risk entry? I want to look at some Oil / Energy stocks now, because I do think that they are ready to run higher.
.
~ALEX
.
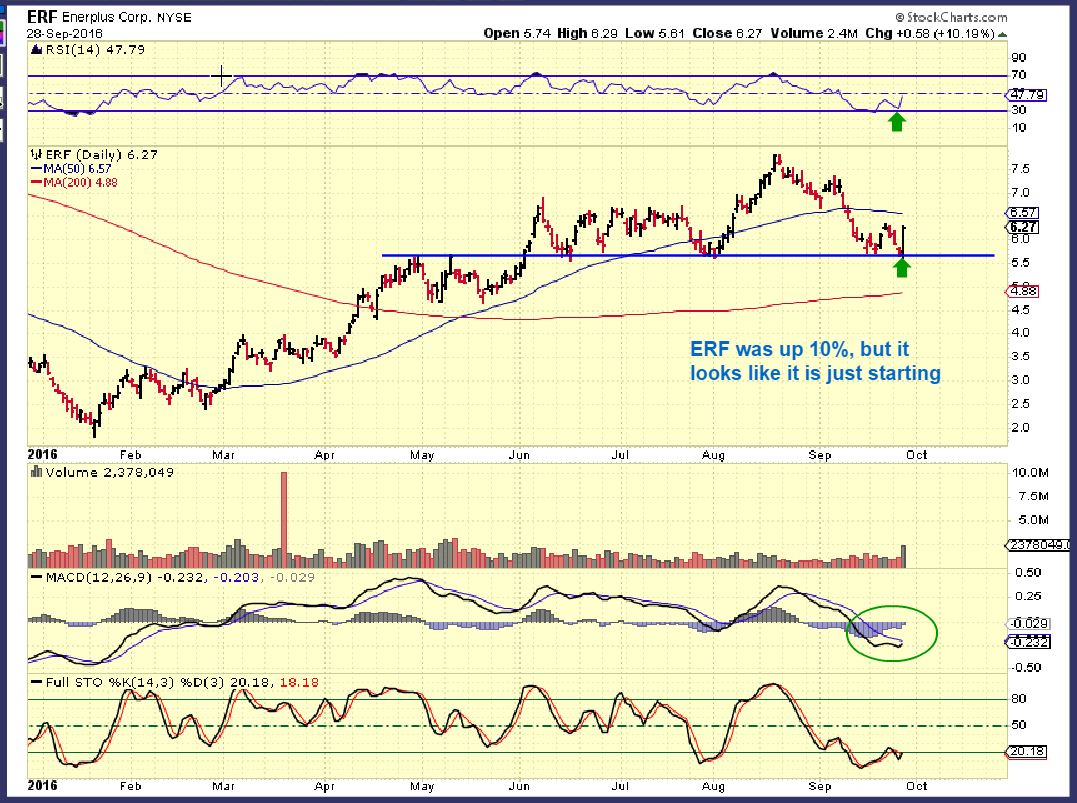
ERF – Low risk, with a stop below the support line. This might stall at the 50sma, but if Oil & Energy are ready for the next leg higher, it should not last for long. A pullback this morning may offer a lower entry.
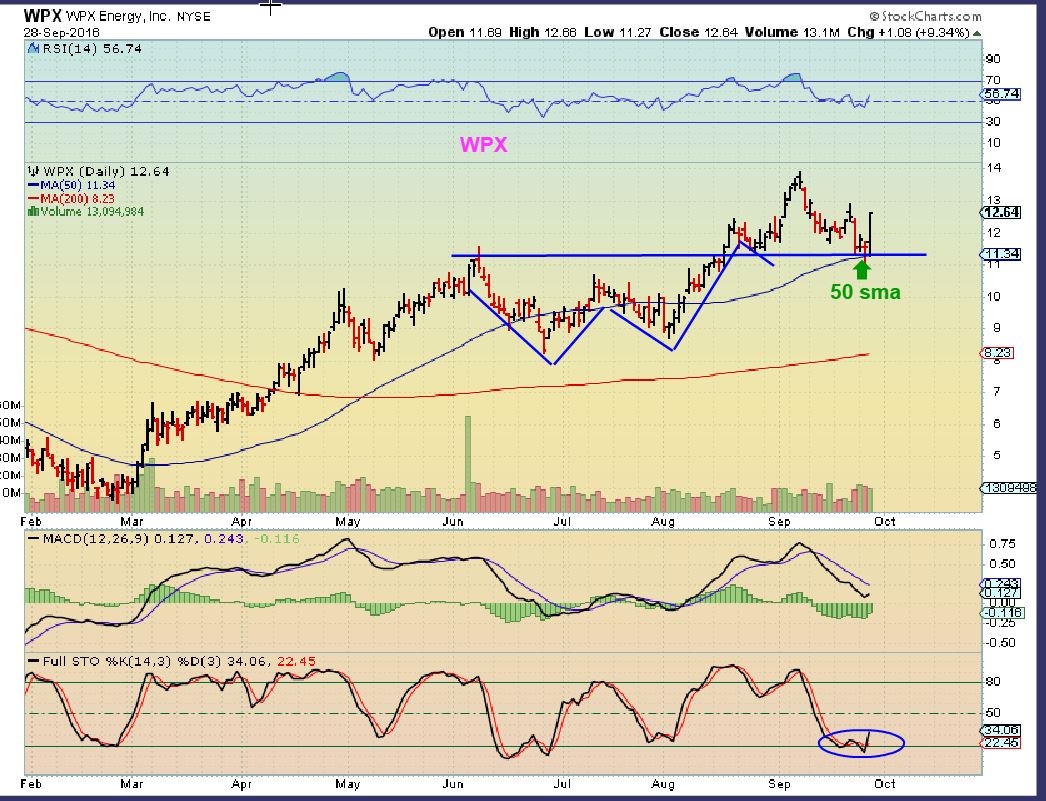
WPX – We have traded this in the past , along with RICE, REI, CWEI. That looked like a H&S, and then suddenly it takes off higher. The 50sma held as support and this is a bullish set up. A stop placed loosely under the 50sma is best. You can see a slight break of the 50sma on some of these.
.
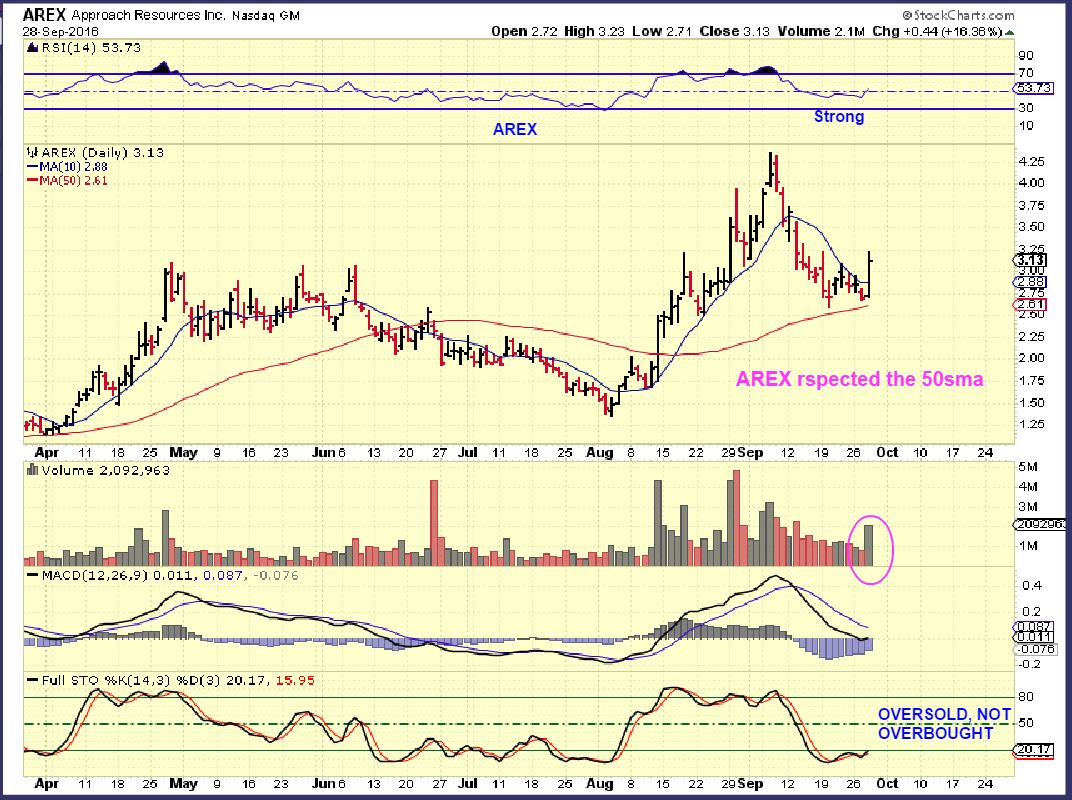
AREX – I owned AREX and tightened up my trailing stop below the 10sma. It dropped for days I sold it, but notice now that price is almost back up to where I got stopped out. Wednesday basically erased the last 10 days of trading, and I got stopped out about 12 days ago. Amazing. It was up 16 %, is it overbought here? NO. See the stochastics.
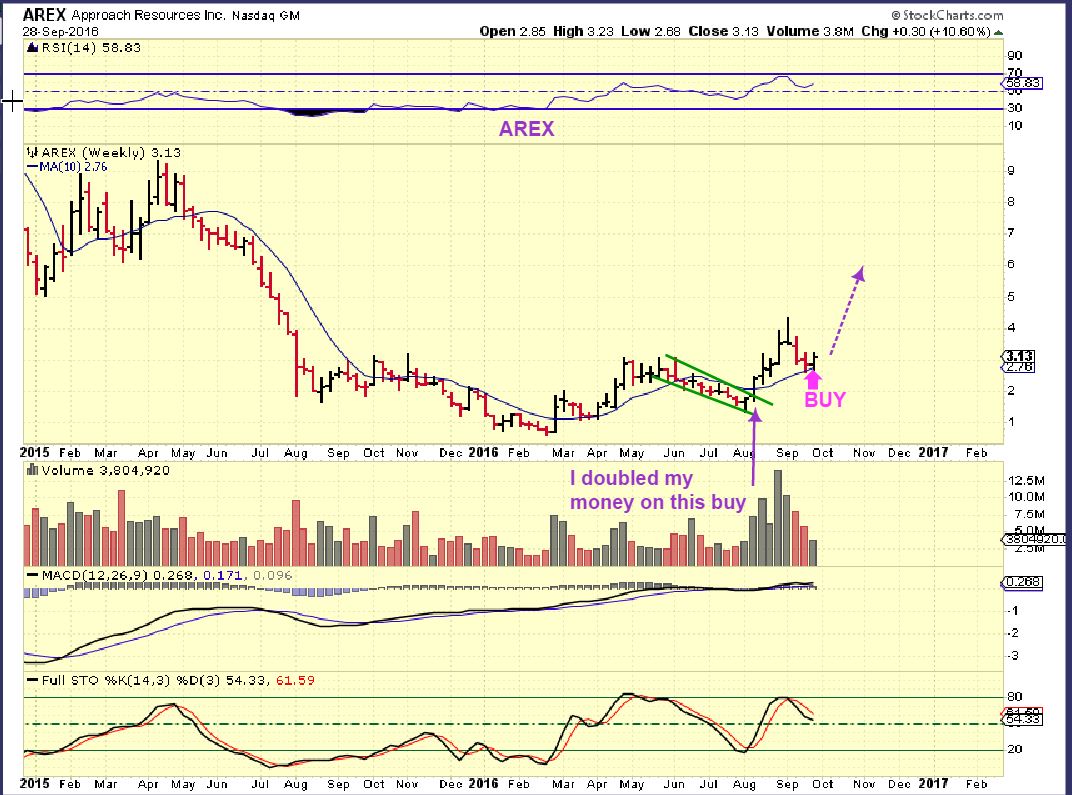
AREX WKLY- This weekly chart shows just how much potential AREX has. I doubled my money on this trade, and I think it could double again from here. Maybe a pullback this morning allows me to enter near $3?
.
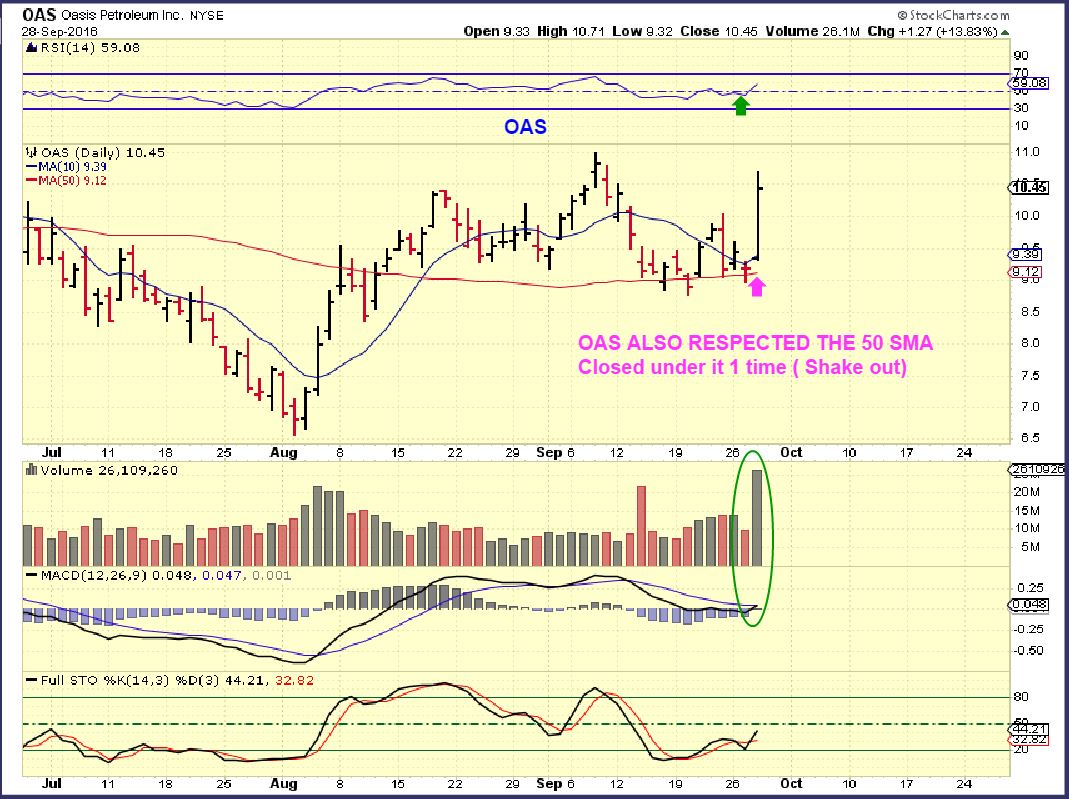
OAS – I know, this surge was huge and many think that it is too extended to buy here. Waiting for a pullback is fine, or taking a partial position and adding it if it drops is too, but…
.
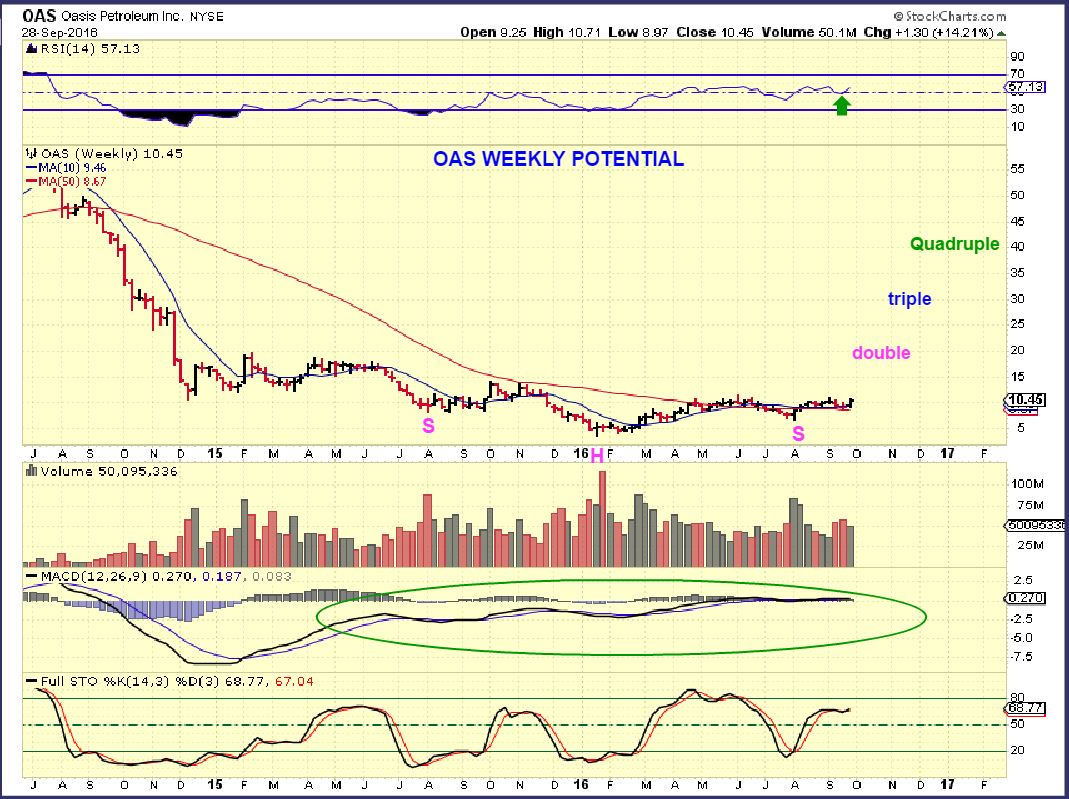
OAS WKLY – This has HUGE potential in the big picture. Many people see the wiggles and get nervous on any selling, even when the big picture looks amazing. Oas never really violated the 50sma, though it did close below it once. I like to remind people to look at this potential.
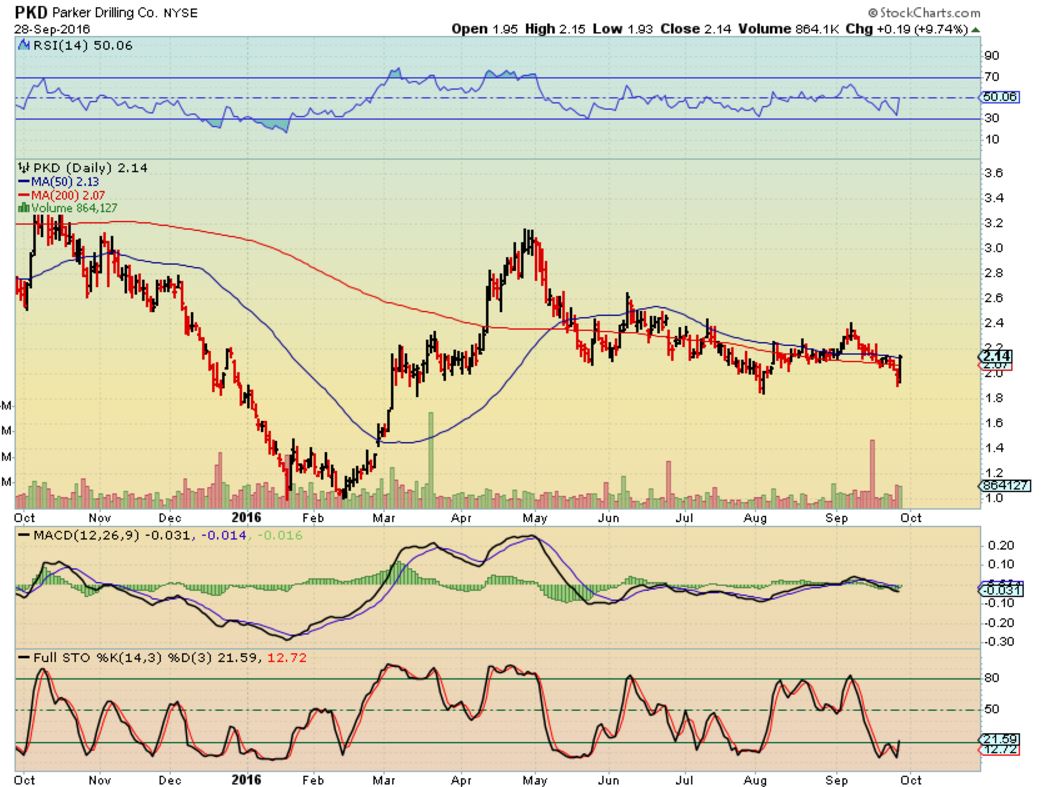
PKD – After a long sideways consolidation of the gains from roughly $1 to $3.20, PKD is oversold and regaining the 50 & 200sma. Possible inverse H&S.
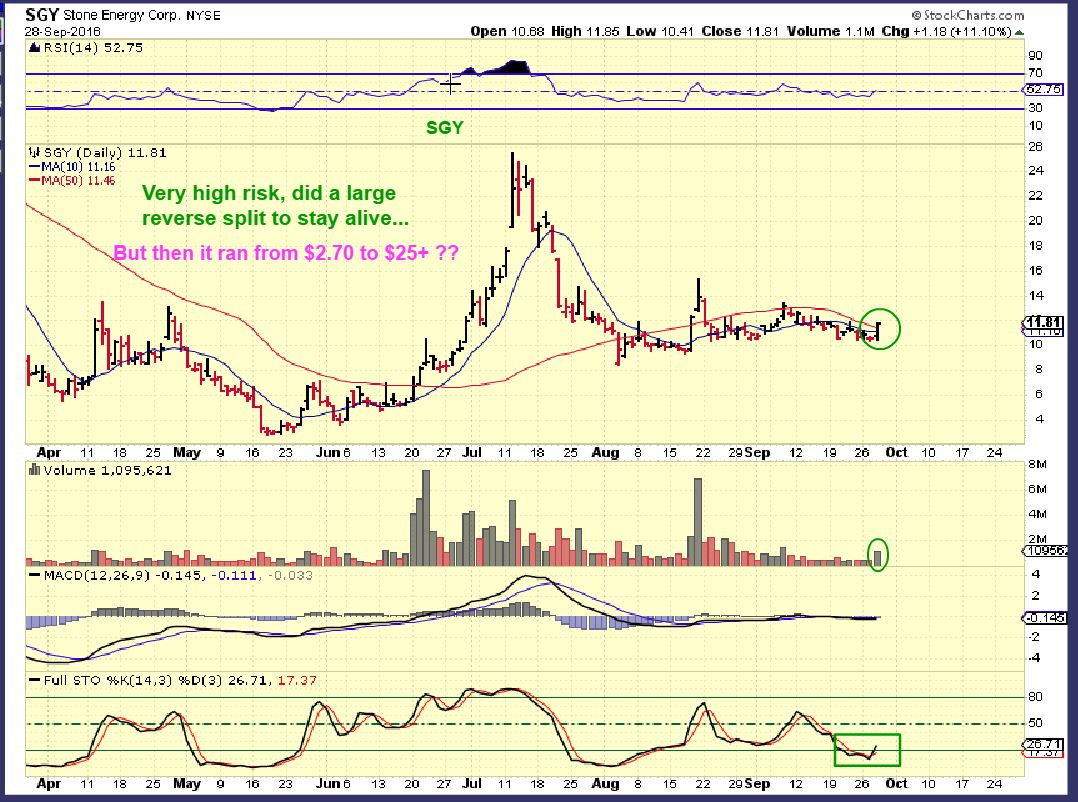
SGY – This could be very high risk due to fundamentals, but technically, it ran from $2.70 to $25 and pulled back to $8 and consolidated.
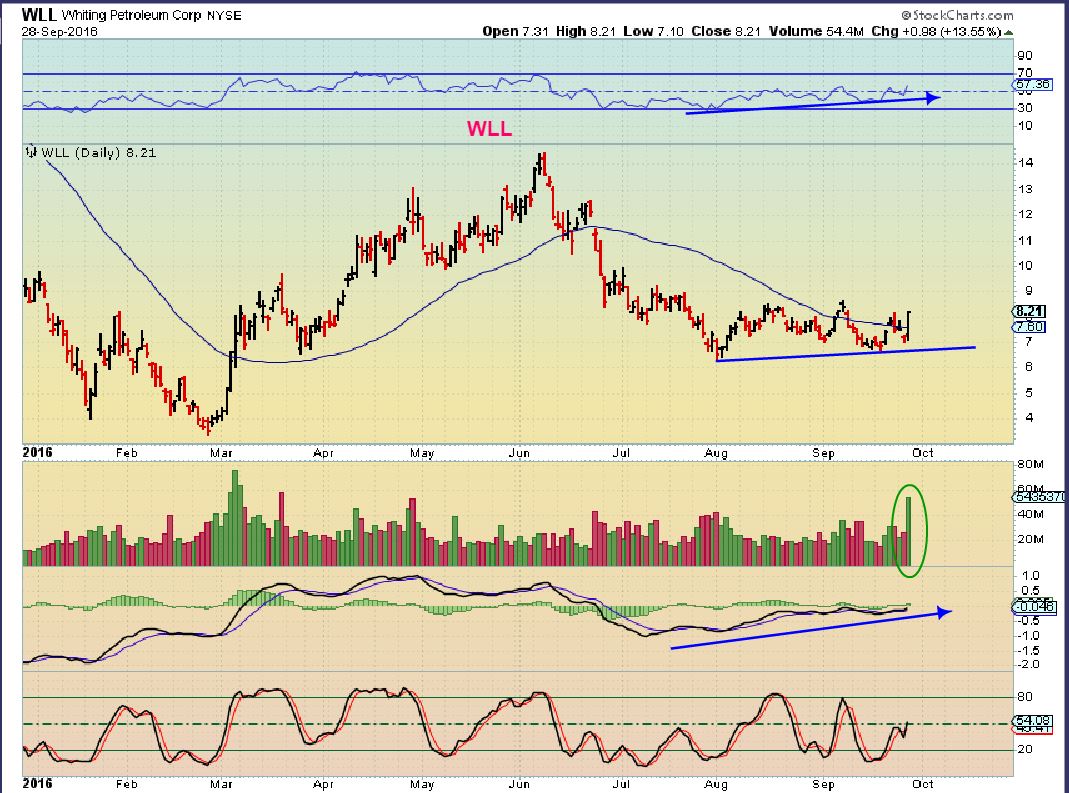
WLL – Breaking back above the 50sma with strong volume.
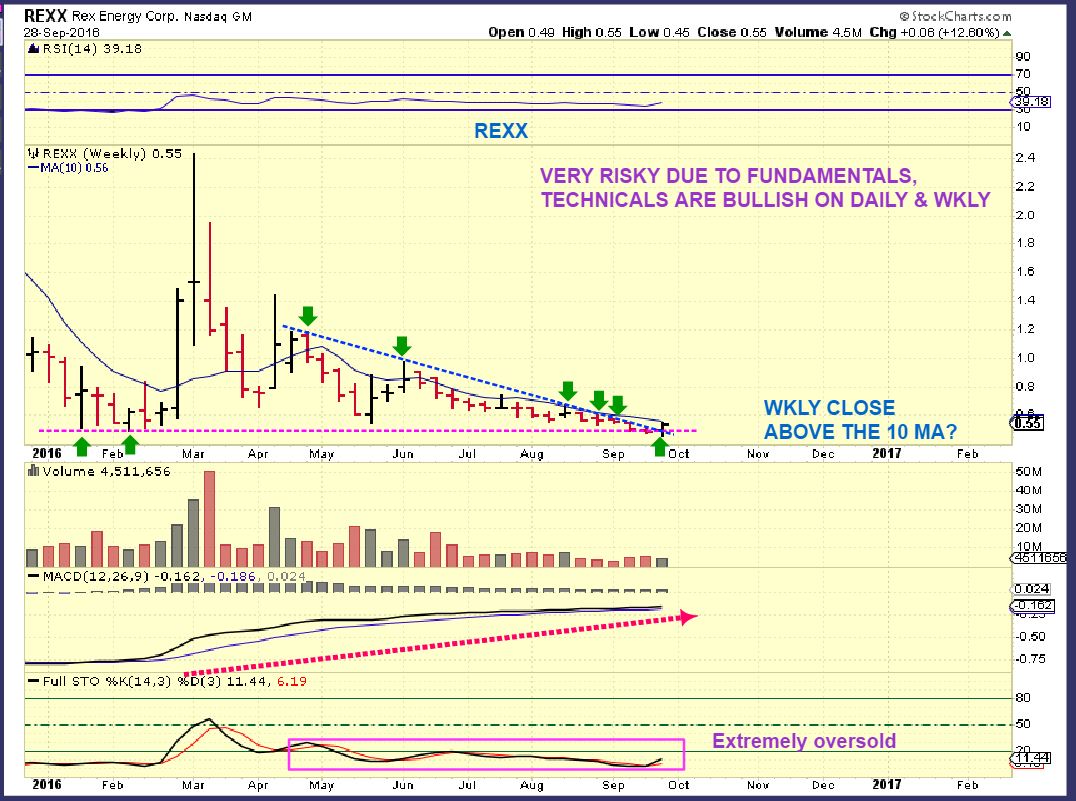
REXX– Again, risky but still in business and breaking out from a weekly triangle double bottom low 🙂
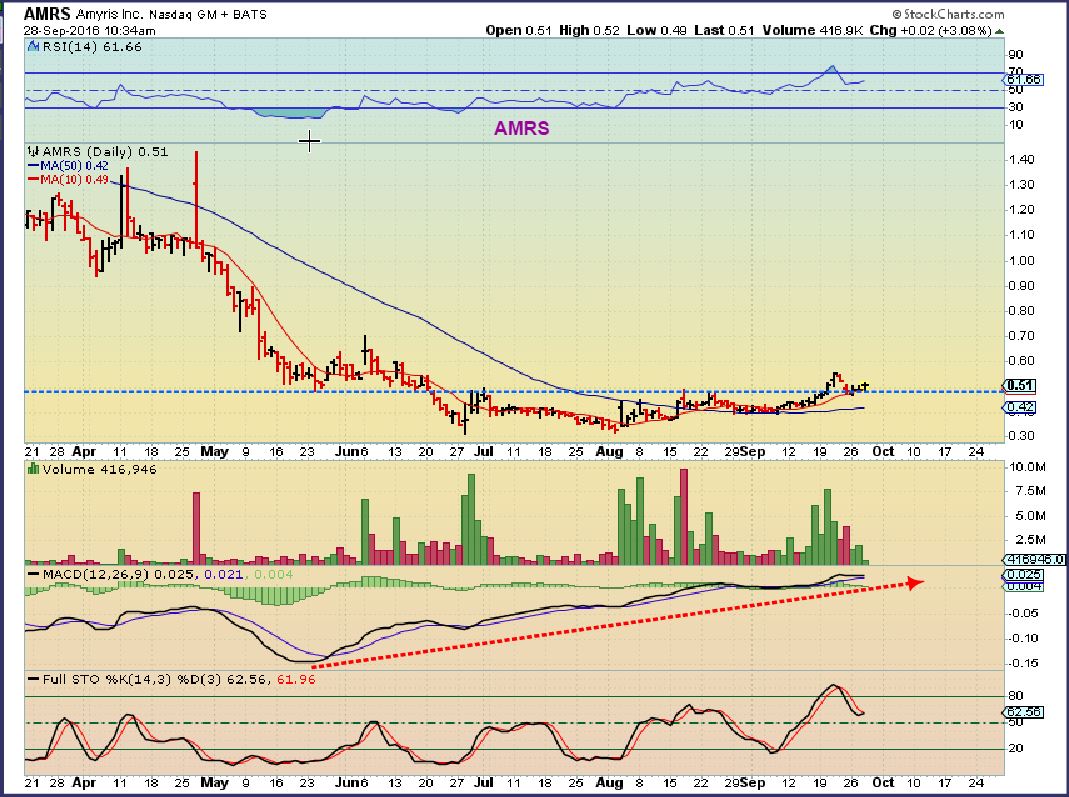
AMRS, PEIX, BLDP, PLUG are energy stocks, but mor eor less clean energy. I do like the set ups in these too.
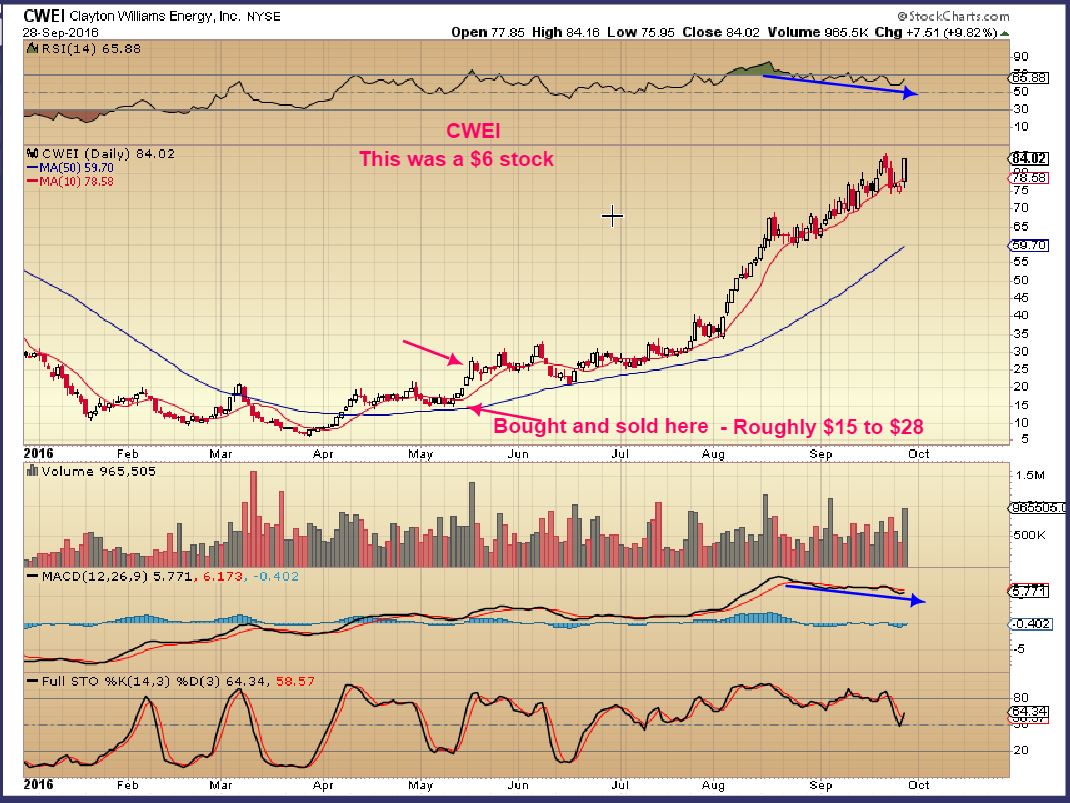
POTENTIAL – Longer term, some of these energy stocks have great potential as seen on their weekly charts. This is one that hasn’t been waiting for anyone. I remember recommending this stock and saying that it could easily run to $60 in the big picture, and now it is at $84. Oh I wish I could have a ‘do over’ on this one. I sold it under $30
So these are just a few ideas of what I am looking at in the Oil / Energy sector, and the longer term potential can be seen too, if they can stay in business and trim the fat / cut debt. I think the break upward Thursday was real, and even if it drops back down inside of that triangle, I think that it can go higher from here. For more ideas, see the charts of ..


I hope a new cycle has started, to save my account. I got locked out for 8 days while moving from TD to Merrill. Bad timing, took a draw down. My worry is that we say NUGT and other miners jump 21% last week, only to give it up. Fingers crossed. 😉
Bill,
why did you switch from TD to Merrill? did you get some extra incentives?
TD was charging me $10 a trade. Merrill will give me 30 free trades a month, plus $6.95 a trade after that. Plus there was a cash bonus for moving. I’ll get a deposit in my account after 90 days with them. The move was painless, only takes a few minutes of paperwork. The bummer is having your account frozen while the move takes place. Only thing I am trying to get a handle on is why I can’t have a margin account in my IRA? I did at TD. I don’t want to wait 3 days for the transaction to clear.
yeah that’s def a bummer with the Roth.. but I get around that by rotating/recycling trades.. its more brainwork .& the little men upstairs get angry at me sometimes, but the benes of the Roth (no tax on gains) FAR outweigh a little paper/brain burning… ;o)
as a ‘friend’ says (and i use that term loosely).. ahem … ahem…
“keeps me frosty” ..
meow
btw: it’s 3 days from the sale .. so – if today u sell X and rebuy Y with that $ (same day) u just cannot sell “Y” until the 3rd day… comprende?
https://uploads.disquscdn.com/images/165b2f12acdd1c74943ae07e58afb97d4f0d1d9ddf54eda3d78c75adf79a85c9.png
If you sell X don’t you have to wait three days to get the $$$ to buy Y? No Comprende, comprende? Plus, I had my IRA at TD set up as a margin account. I could day trade if I wanted. Comprende #HB
exactly… im at Vanguard …call them and clarify .. i would imagine it’s the same every where else…
Cash i immediately available for purchase from the sale of “x” … but .. u have to wait for that $ to settle … before you may sell Y.
abcdefg…
HB
Okay, got it. Thanks, Like I said, I was used to a margin account and didn’t have to wait. #HB
the *key is staggering purchases……. so u can have a constant flow of cash readily available at a moments notice…
WhereThere’sAwillTheresAway
SHAZZZZZZAMMMM
But you’re never all in that way! Right!
yes .. if u want to be… .u just ladder purchases ..
day:
1. buy POOP
2. buy PHLEM
3. buy BOYs
4. sell… Poop Buy Boogers
etc …
and constantly rotate.. funds ..
only for the first 3 days you are tied up .
comprende?
ps. I expect a SHINY red …… apple ….. on my desk in the morning
Signed
TeacherMaria https://uploads.disquscdn.com/images/63359a12b739236045917bdf7672e410b23c9fbf4d52aa4063011f713cc8c93c.jpg
Nice look for you , #HB
Maria is correct, you can buy immediately but you can’t sell tag 2nd purchase. If you need a tight stop, you are better off to not buy until the first sale settles at D+3
*if u know u wanna scalp that week .. .let the cash sit a day or 2 .after sale . (obviously)
i often buy on day 2 .EOD .. sell morning pop ;o) … when scalping…
#GetThingsDone
You also can’t short without margin, even if you aren’t actually dipping into margin funds.
Were they able to move all of your open equity purchases? You didn’t have to cash anything out, right? Asking b/c I was thinking of switching one account as well, thanks.
Cason,, all the purchase came over, no cash out.
https://uploads.disquscdn.com/images/24323cc8c4d21d99e4c375900c1bfc11963fc195dde99e16ae37197866c5335b.png
https://uploads.disquscdn.com/images/ae12c82aeca346a1db2b05672825eda2581258aed7670f0e98359ced854d5488.jpg
Bort 😉
LOL .. (i have NO idea what that means) lol
Its the sound you make after eating toooo many meatballs
Or not getting any!
How can it possibly be that the GIF queen has never seen the Muppets?
ohhh…. ok .. the MUPPETS… got it… my mind was elsewhere…..
Its when someone treats you in a way that Y-O-U haven’t earned.
RESPECT
JUST KIIIIIIIIIIIIIIIIDDING!
BY the way, I bought your DNR
#MariaFlordiaFund
ive been nibbling on drys ….little… one of these days… pow..or plow
plow? lol …
turd https://uploads.disquscdn.com/images/35e1e86772f083d5964d30157e6d350179b2449d57ec0772e6c792f2c1fc5a3c.png
OIL over $47 and moving higher as I type
… keep typing ;o)
#HB
I’m always watching the small cap oil etf PSCE as it really levels out the bumps – but it even got excited yesterday and was up 7.43%
Alex, Just curious as to your thoughts on $WTIC finishing off a LT cycle. That would suggest that we may not make any higher high here and there will a short burst and then roll over. Or am I interpreting the cycles incorrectly? Thx
Unless its an ICL, in which case the previous DC would probably be LT and the ICL would go much higher and be RT
Thx Bill but could you pls explain. The Aug low has not been broken so not sure how anything after Aug could qualify as an ICL (i.e. these are all higher lows). I guess it could be RT if the first DC was extremely short and ended beginning of Sept and we are now into the 2nd DC. Seems far fetched but I guess in these markets anything is possible.
hi Deshy
we had the same discussion yesterday – so check what Alex answered in yesterday’s blog
indeed icl in August, not a great first DCL since it’s left transl. however the rules changes if we’re in a triangle formation so read that again – Hope that helps
Thanks Ray, I missed Deshys question
Deshy, I may be the only one that thinks this way, but in my personal experiences, when I’ve seen GOLD cycles for a triangle, the translation is always L.T. because of the peak of the triangle, and then a break out has occurred above that peak on the next daily cycle….so…
‘
My personal opinion is that I use cycle counts and L.T. & R.T. expectations, unless I see a triangle consolidation. I see one in Oil. I DO NOT like to make exceptions or bend & ignore rules, but past experience does allow me to think this way
Hope that helps
Alex, your past experience is telling you a higher high in OIL? Higher than the August high or the June high?
Thanks all! The learnings here are great!
If we have this correct, this would be Wave 3, btw that and the triangle I would expect a new high above the Aug high during this 2nd daily cycle. Expect. But we won’t be for sure until it happens so need to stay tuned to the fact that this could change.
That chart of BAS looks explosive
Yep……+13% again today.
Net Margin % not too bad …. I have certainly seen worse in this sector for sure.
Is this finally PACDs moment to double bottom & shine
Big volume.
Yes agree……
PES should not be forgotten…..
That is rather huge volume today – Big volume in the 1st 15 minutes drew me in, and now 700,000 + in the first hour alone, breaking out from a base.
I haven’t liked this chart ….until right now : )
Your Welcome….:)
*giggle
*keep chartboy on his toes…. he was prob out practicing for his pretend band again 😉
Drillers are hitting it. RIG, ORIG etc.
CHK is treading water, not sure if it will survive
Hi Bill. Not sure where this would stand in the grand scheme of things but they’ve announced a privaate placement of $850m of convertible senior notes.
I see they are being investigated for accounting practices, I sold.
Better safe than sorry! And plenty of other fish in the sea!!
hi stranger :o)
Howdy. 🙂
if I am reading this right the short positions decreased by 53% yesterday. Not sure if that is accurate but I think so. So the bump could have had a lot to do with shorts getting out or the way.
BAS was priced for immediate bankruptcy so maybe now higher oil can ‘save’ them so will likely get re-priced to live. Could be like that SGY move, but this is extremely high risk. Their last quarterly earnings report was one of the worst that I have ever read in my life, regardless of sector.
It was very good to see WTIC break out (USO has not)…..
USO looks to be breaking out to me. F5
https://uploads.disquscdn.com/images/757538d04be2ef05d7b84f2408c186e3d942e4209ff2c6861bb6fe7849c9ca17.jpg
Why is that candle red…take that back and paint it green please : )
I see a Red Candle and I want to ….
Green now, you’re welcome!
I’m still seeing a red candle, but thx for trying : )
Im showing green, up 1.5% today. F5 . Am I getting different info that you and Ken? USO daily chart
https://uploads.disquscdn.com/images/508f201dec8b40e296e5b832a95d72570eb97a2f63c7a36eb93138e1f94d36d6.jpg
There ya go…no I was pointing out your chart above. The candle is higher, but colored red.
This one is much better : )
Not based on my chart using stockcharts……
What’s your look like, thats a daily chart of USO from Trading View.
I posted my chart last night with triangles and wave structure, pretty much what Alex had in his write up today. I see a breakout
Broken now ……
Broken or Breaking
50sma was heading south, so some pullback to be expected?
.. its all good…means we dont havta chase higher prices to enter
Still in cash. Didn’t trust the move in oil yesterday. Locked out until back test (if there is one). Is there consensus now that this is a new oil DC?
Happened to me with miners last winter, by the time I believed I was locked out until May when they finally pulled back just a bit.
PACD has very strong volume today and has been lingering near the lows, I like it here. I own it as of this morning and may add if we get that mid day pull back. The June run up did a $4 to $24 run, but it has also done a reverse split. Reverse splits didnt hurt NADL,SGY, REN, etc performance on the last run higher.
.
refresh
https://uploads.disquscdn.com/images/06964469e4cf2ac5e6f9256a8a9cab34be1e363bbfb6541511e078b3bbc796bc.jpg
u should prob go tweet that out….
*giggle
Ur funny…Hmmm, Maybe I should … after you buy some. The twitter fans may drive this to $10
done&doneDude (me snapping a Z in the air)
*sooo yesterday (eyeroll)
I need to add to energy, this might be a good candidate!
Based on my discussions yesterday not only is she funny she aparently has other attributes also. 😉
… if u only knew…
#hiddenTalents 😉
😉
what u do to DNR .. (me cocking my head to the side)
hoping its gonna drop down to the 50sma/34ema, then reload
!!! Can’t believe I walked away a few minutes and came back to red DNR….argh. I’ve made money on this in the past, but the past couple of trades I’ve done haven’t gone well…..sitting in red in one acct…..and had to go buy more yesterday for another account = slow learner.
pretty sure this has broken out.. maybe the top trendline of coil gets backtested?
f5! https://uploads.disquscdn.com/images/1925d2b078a45301367e58619b39001dabc90440416f263644b8bf7d4af8d13f.jpg
Could be that Mid Day dip ( that I always try to buy ) and then it recovers into the close.
If not, I still think we’ll see higher price going forward, nothing really broken at this point.
Was gonna ask if this was mostly just related to poor general market action today dragging down energy, maybe some gap filling as well. Does anyone see that differently?
I just got back in front of the screen, what did YOU do while I was gone??
My PACD is swooning too
pop…pop… pop
today’s imagine should have been popcorn….
*tho im STILL drooling today from those awesome looking chops….
https://uploads.disquscdn.com/images/5fcc05b42fccaf085ffb26208fa07f3d568cc40771ab88db840434723575a84d.png
in!
What do you all think of xra? its a gold stock with significant insider buying. The insiders buys for egi were just token buys
https://uploads.disquscdn.com/images/be3991a92a0b32866062655d869c957c39f9e783bff4bd1b8b77d358d3286260.png
mobile gaming stocks like ntes and tencent are killing it https://uploads.disquscdn.com/images/0ca982c135e0fd581b054403cb884c311ca5c7e51fe69a58080b94e80c9d1c65.png
Don’t know if anyone has noticed but GSS and CALVF two of my favorite gold stocks have been doing very well lately within this correction.
Thanks for the GSS reminder…that hasn’t been on my radar in a while – have to go check it out!
Dollar getting strong and gold going up?
Actually just meant dollar going up…not getting stronger necessarily…
Interesting
Well, don’t think gold has really been up….I have to stop looking at marketwatch…they’ve had gold up $3+ all day…and it hasn’t been…their price is always wrong it seems but I still look at it…old habits die hard…..geez….here I was thinking that all day….
My O My BAS +30%
THM tryn 2 do a lil sumthin sumthin….
Have I mentioned GORO? : )
Ummm………… maybeeee
“i do not recall….”
*smirk
Great moment at the Ryder Cup Today. Unbelieveable
http://www.rydercup.com/news-media/usa/ryder-cup-american-fan-calls-his-shot-sinks-putt-rory-mcilroy-couldn%E2%80%99t
awesome! lol
Right, some drunk American showed up the pros!
so you yankees gonna win?
get to it… that EU rag-flag is unrepresentative of us brexiteers 🙂
Yup, us drunk Americans are going to win. They are going to have to change the EU flag for sure.
Have ERF, WLL, WPX, OAS, PACD as of today’s close. PACD is new, WLL added, WPX limit buy (add) placed.