Thursday August 18
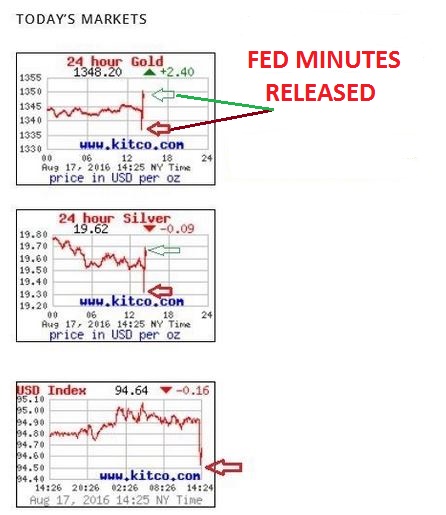
Today the Fed Minutes were released. Could you tell?
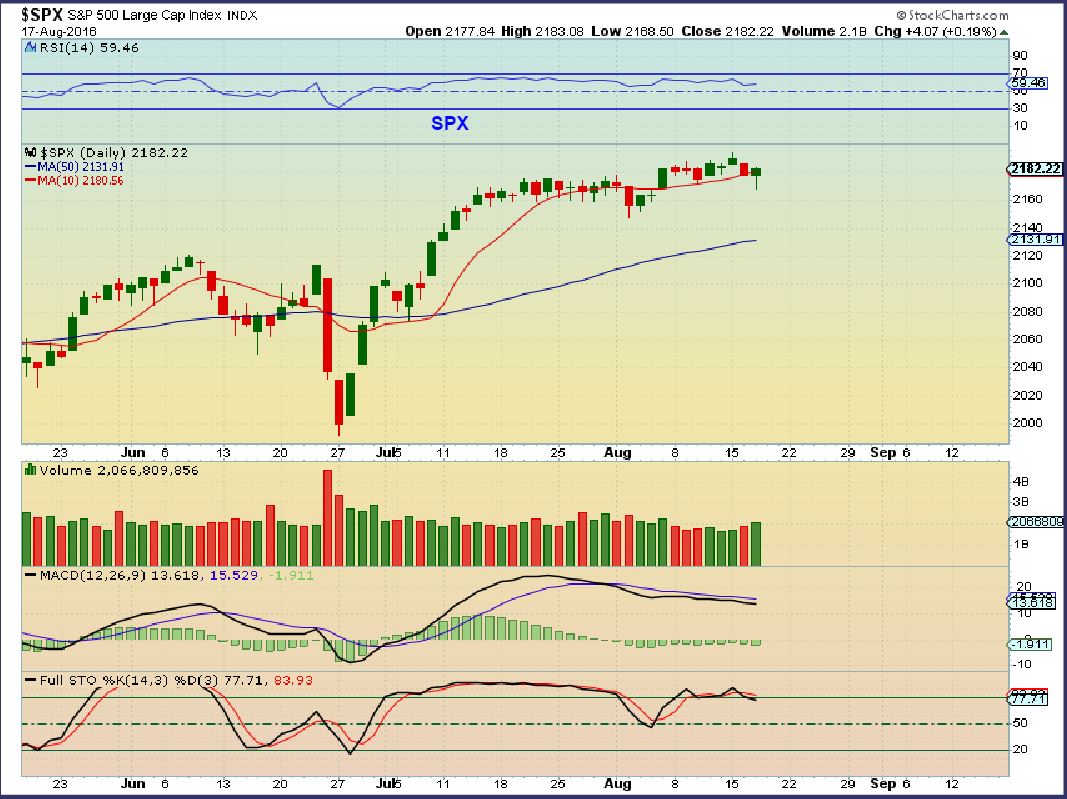
The SPX sold off and then recovered the 10sma.
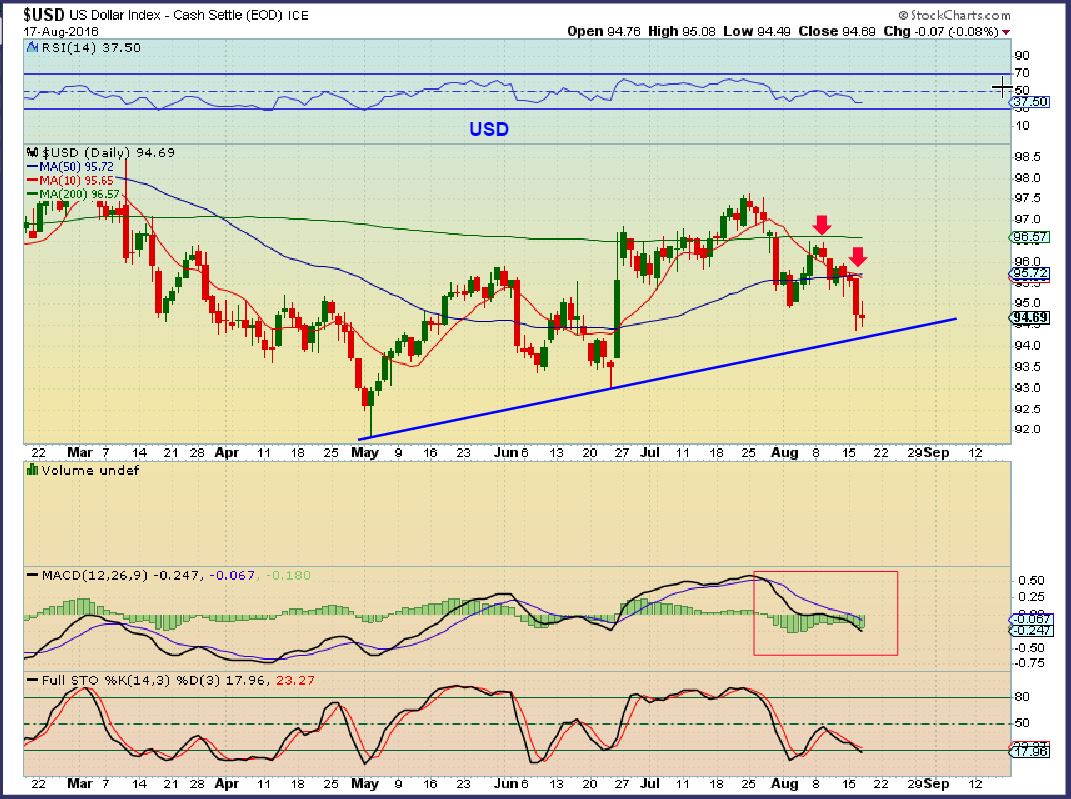
USD – The USD looks weak, but it is due for a bounce soon. We’ll see if the trend line holds or if this dollar can break down further.
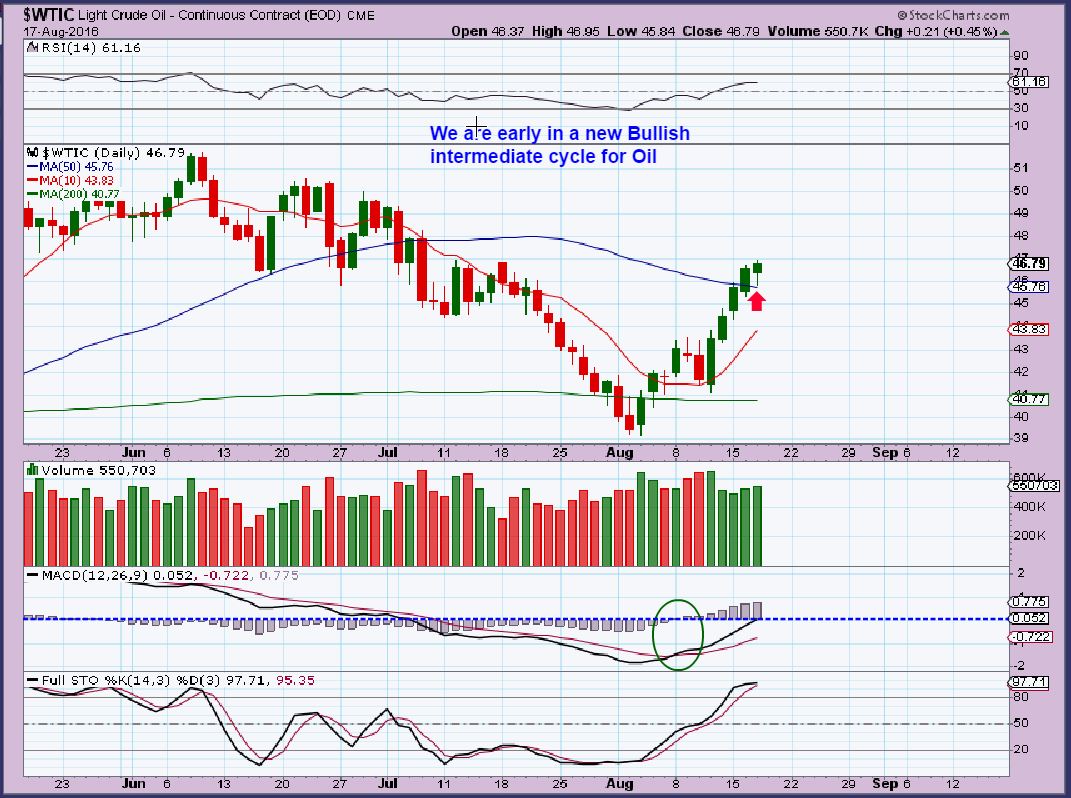
WTIC – Day 10 and Oil continued higher, even after a drop to the 50 sma in the morning. Oil can run higher for months, energy stocks have been a good buy in this area, and will continue to be ( or USO, UCO, etc).
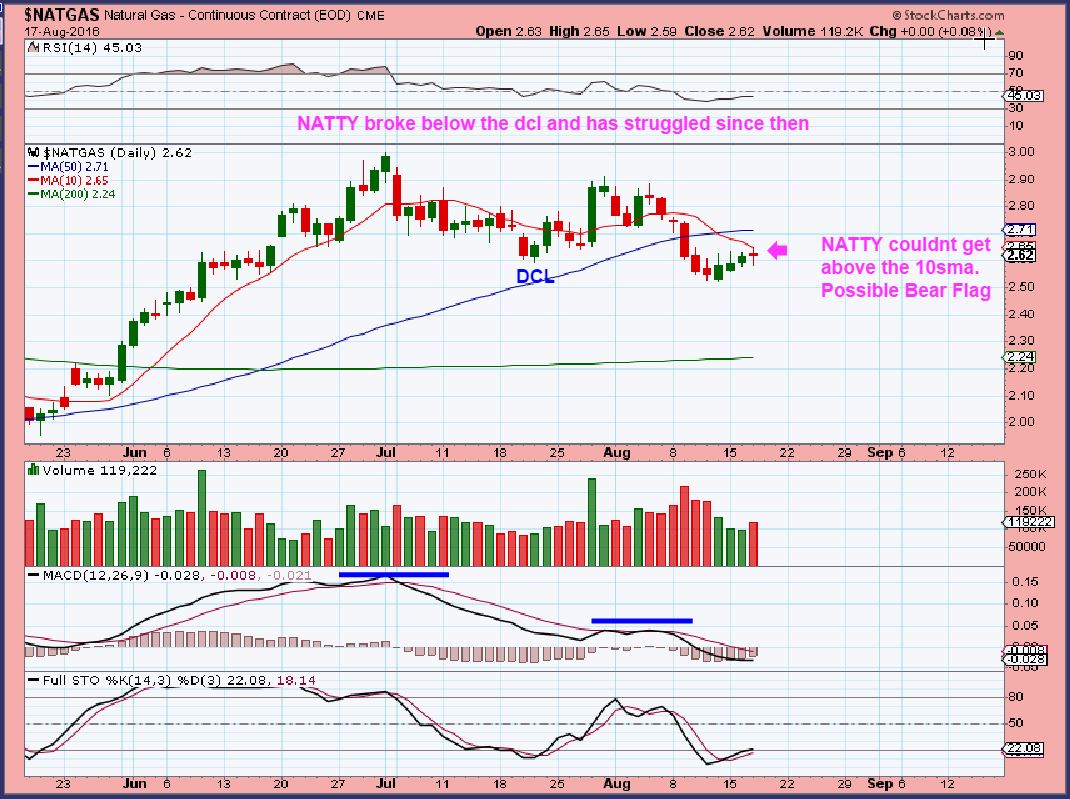
NATGAS – I have been saying that NATTY looks weak, it broke below the last Daily cycle low and the moving averages have acted as resistance. I would be very cautious if I were thinking of a long nat gas position. I am thinking that this will back test the 200sma.
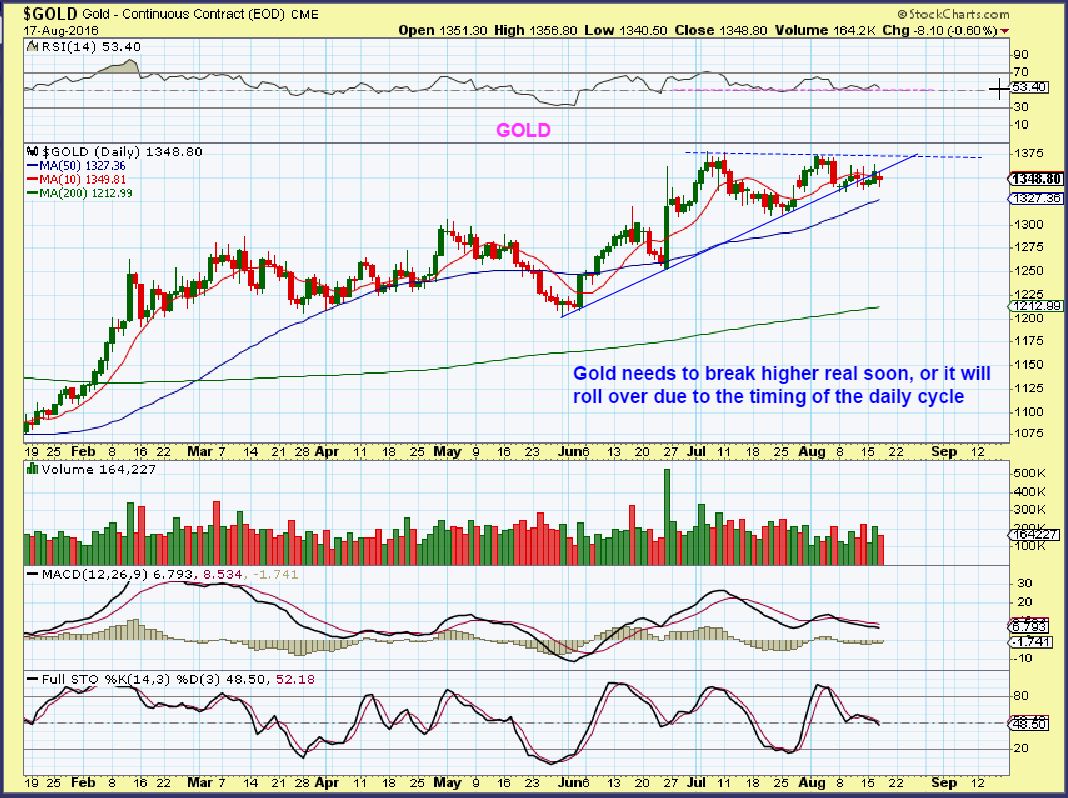
GOLD – If the dollar drops further, Gold can run higher. The release of the Fed minutes saw Gold drop quickly and then Pop higher. It looked like an intra-day “shake out” , to cause people to panic sell, and then it was bought up. We’ll see if Thursday has follow through to the upside after a possible false Fed shake out . Cycle timing indicats that the USD is due for a low, and GOLD could top and drop into a dcl soon.
Read what I wrote on this chart
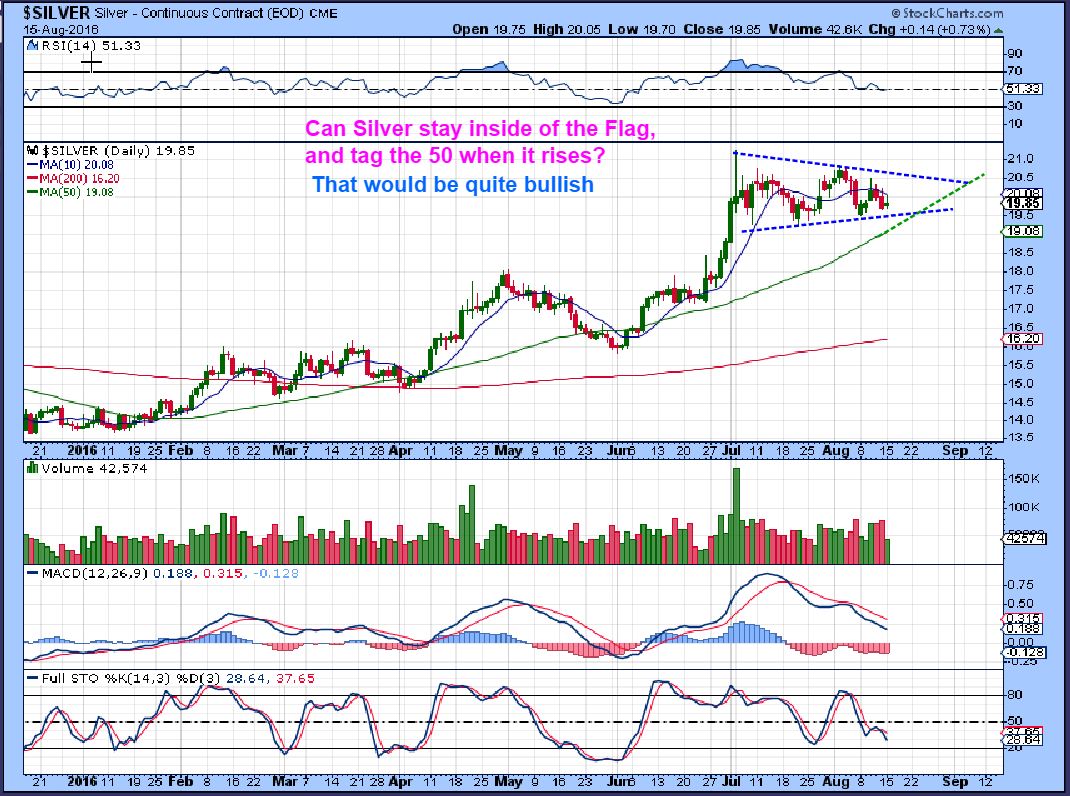
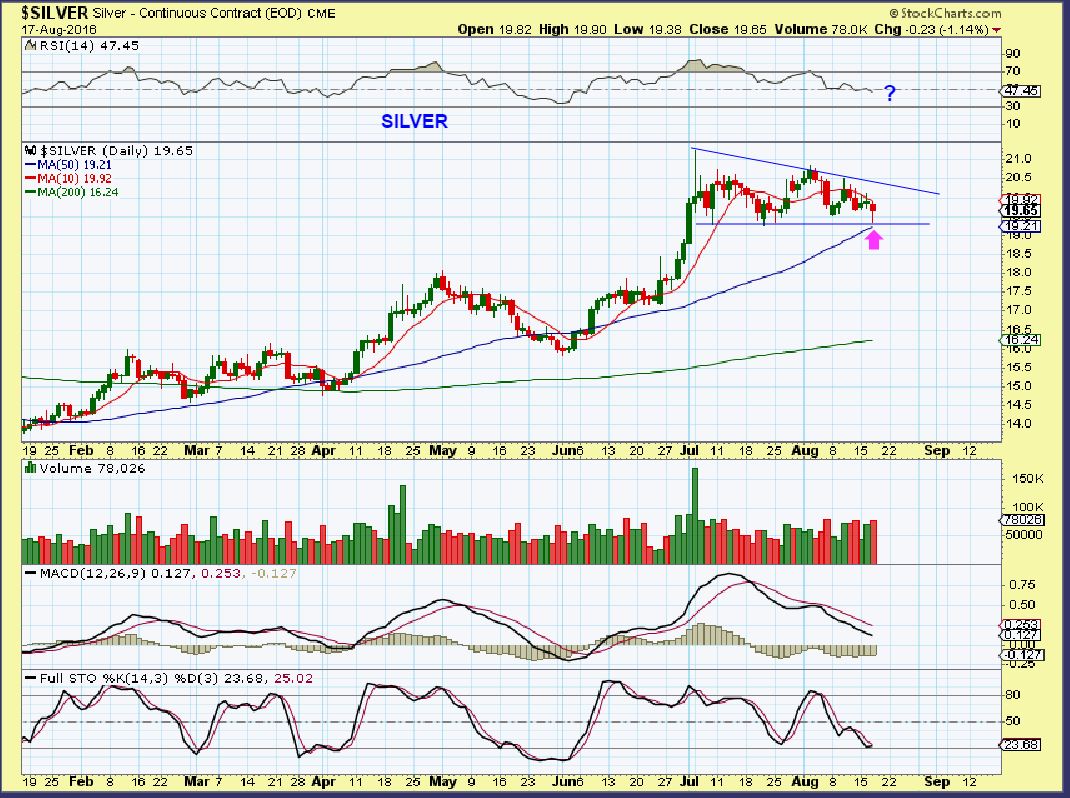
SILVER – Look what happened with the Fed release. Silver acted bullishly so far.
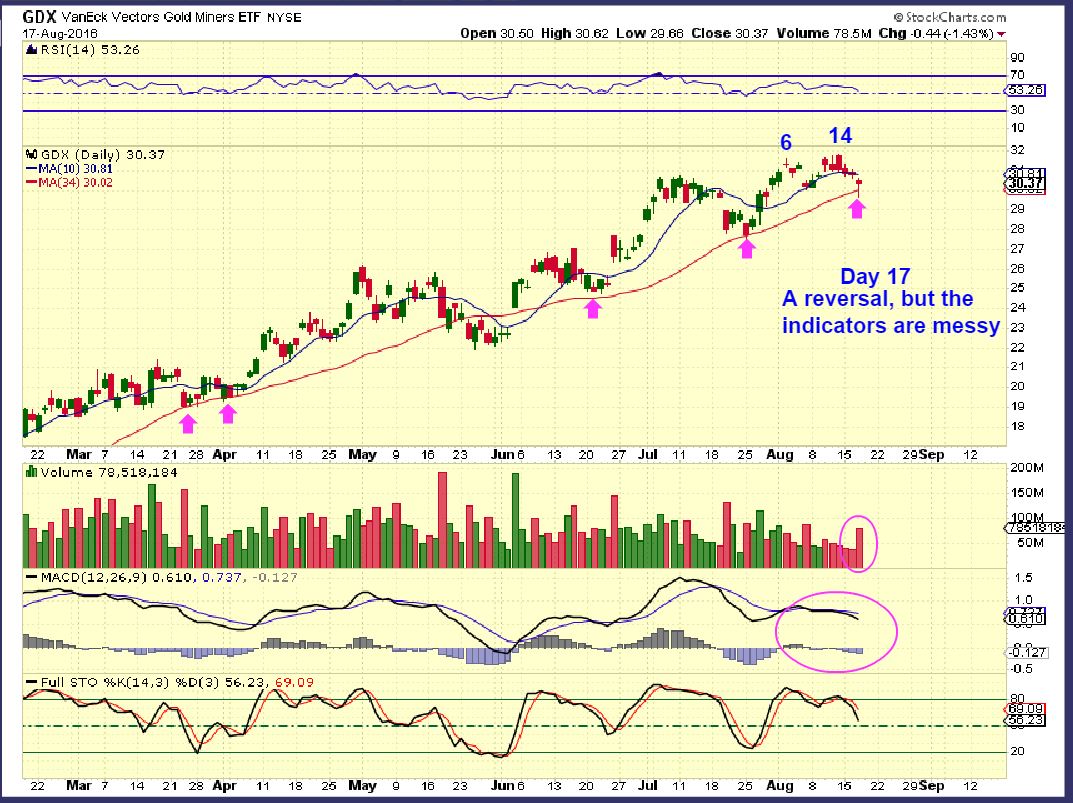
GDX – GDX is a tad bit shy of a normal daily cycle, but I have seen them at 14 days in the past in Bull markets, so can this reversal hold? Tune in Thursday.
.
Since Silver acted bullishly, I began looking at various stocks during market hours and mentioned some bullish looking set ups in the comments / chat section. I mentioned BTG, EXK, THM, AAU, etc . Lets take a look at a few ideas, understanding that we probably need Gold to follow through higher Thursday for these trades to work. These would be shorter term trades if this daily cycle is just about to top out.
.
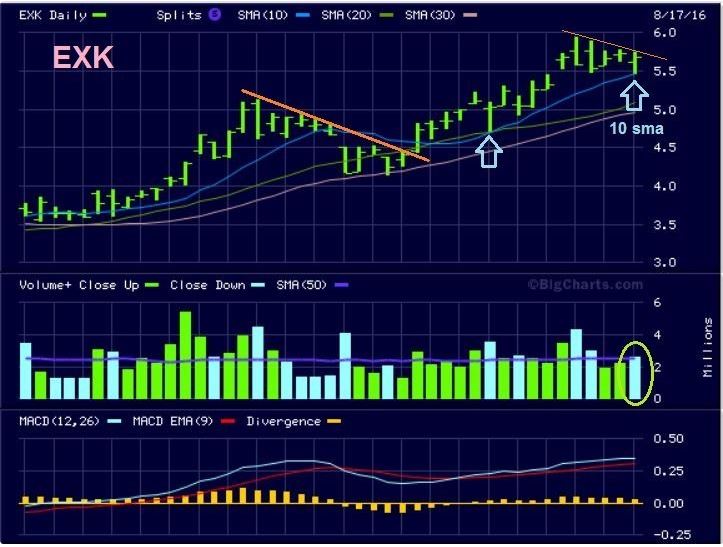
EXK – EXK is pinched between the upper trend line and the 10sma. Tune in Thursday to see if we get a pass or fail. This could also be considered a low risk buy, because you stop out if it breaks down. The only time the risk increases would be a gap down.
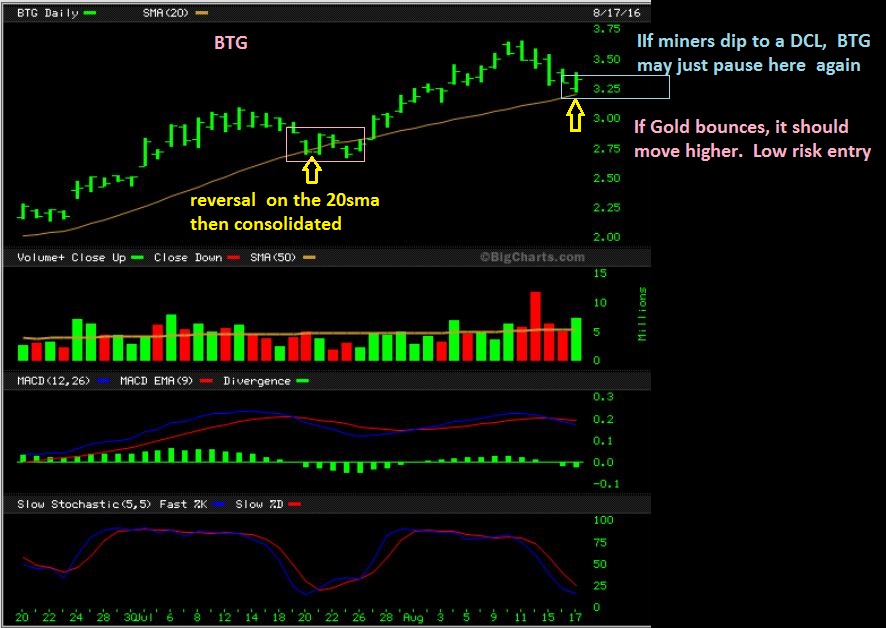
BTG –
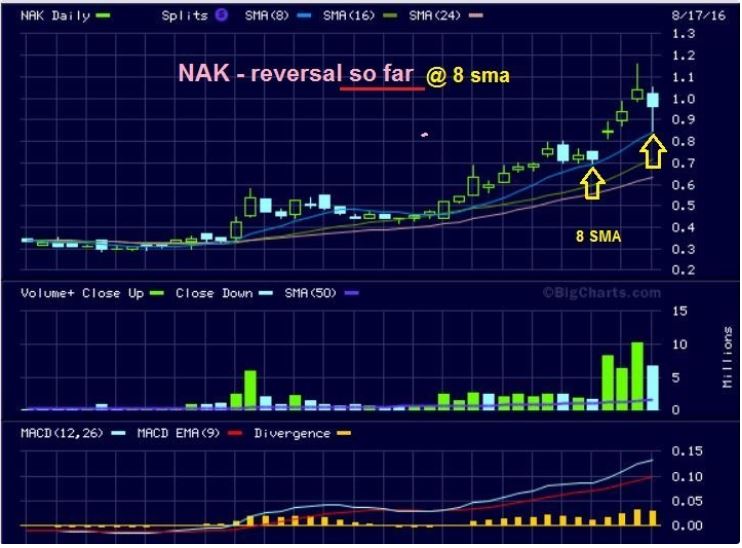
NAK – Nak dove down today, but did you see how the 8 sma held it as support and it reversed higher. That same thing happened on our other giraffe necks, so NAK may or may not be done with the upside yet.
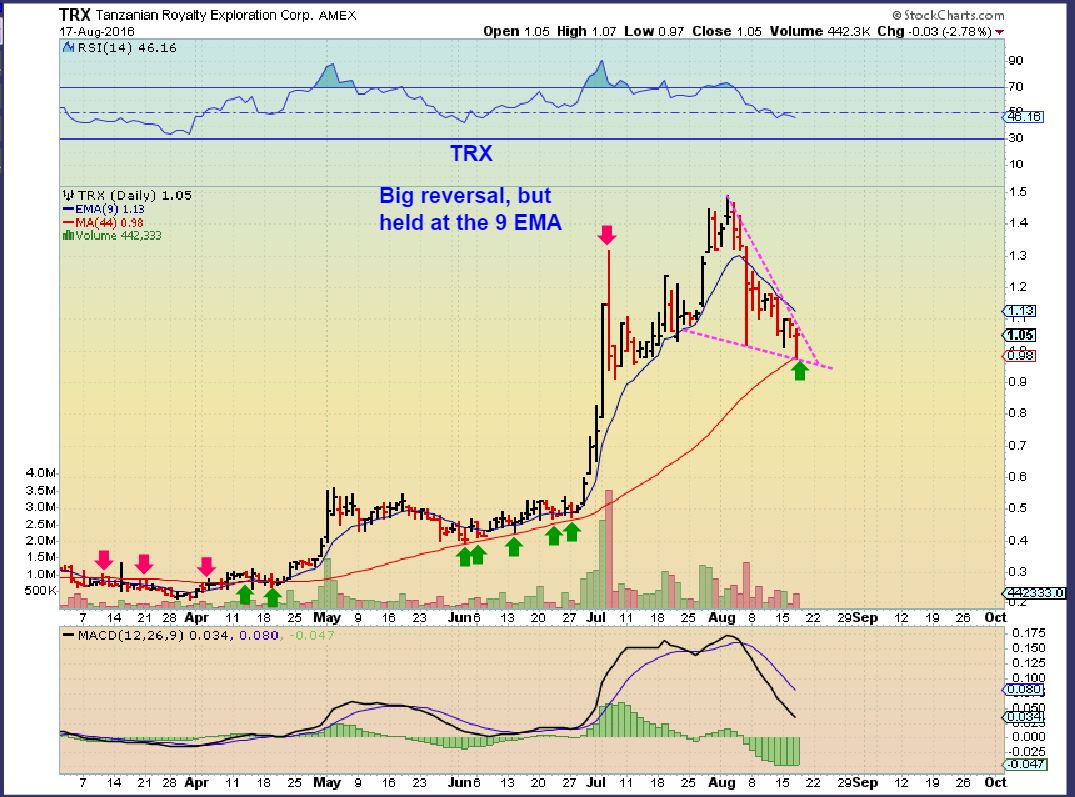
TRX – See how TRX dove down one day in July and then went sideways to the 9 sma and continued higher? NAK may have done something similar Wednesday. TRX also landed on support and could be forming a bullish wedge. A short term trade set up if it breaks higher.
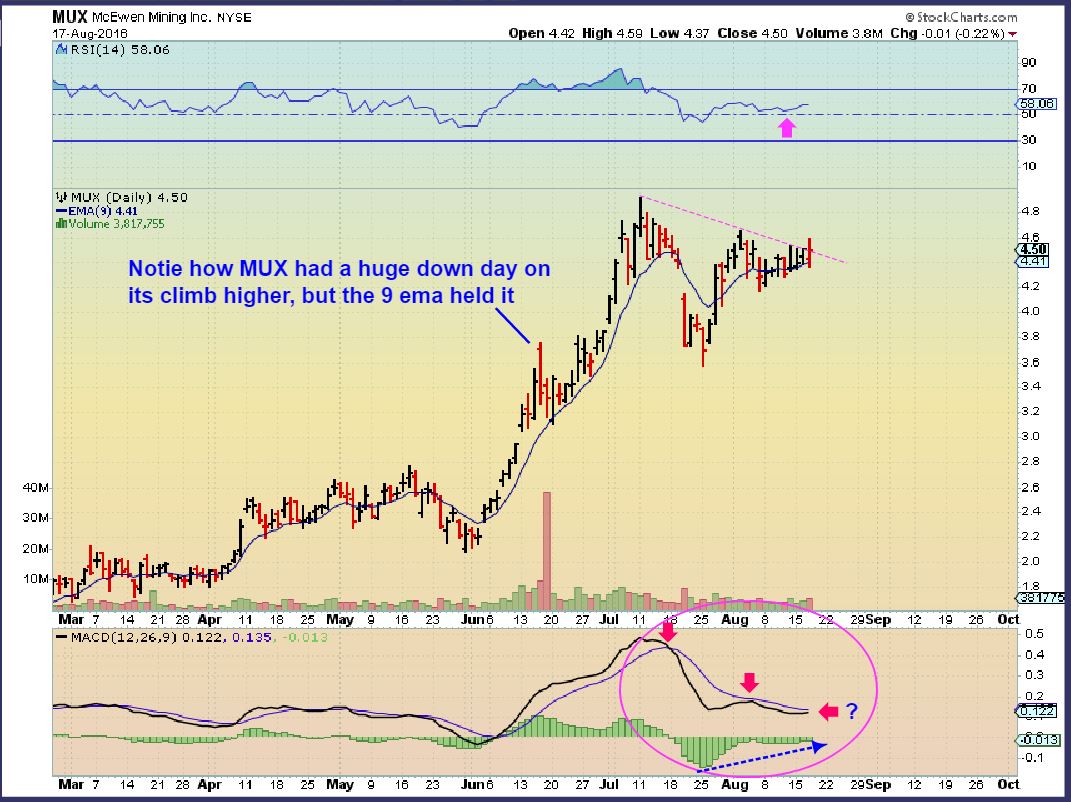
MUX – Notice again how on the climb higher it reversed and sold off quickly, but the 9 EMA held it as support a day later.Mux also may be trying to break out here.
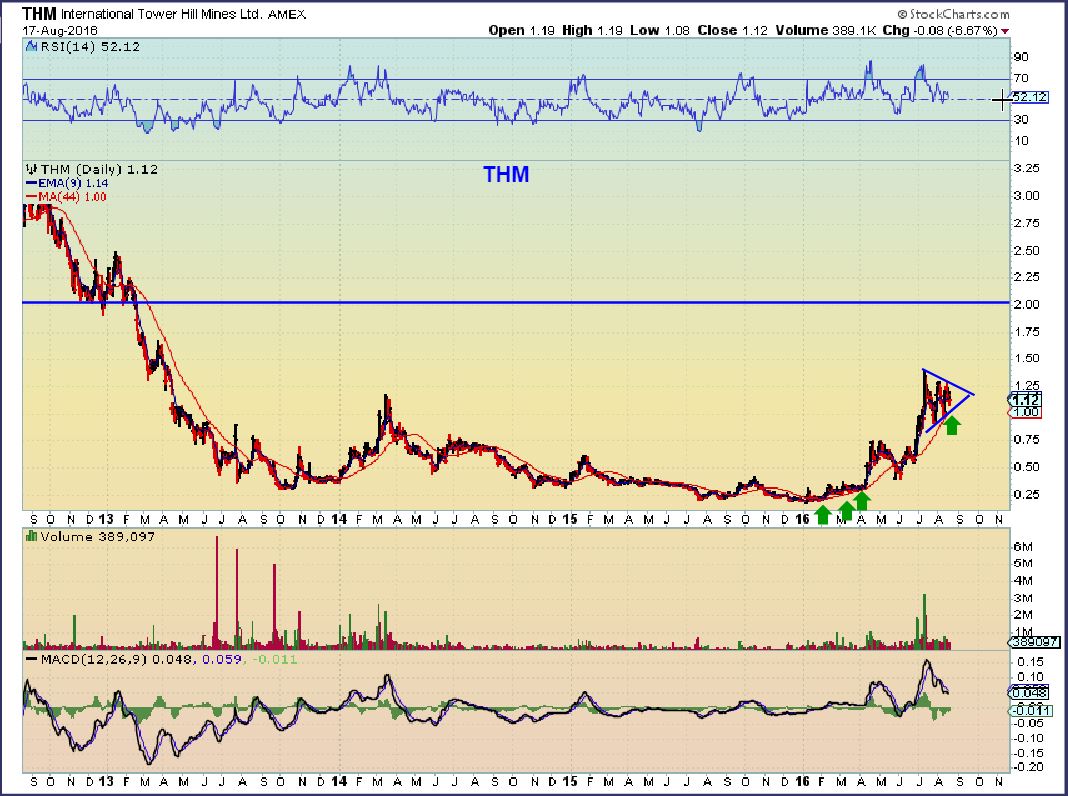
THM – I have been saying that stocks like THM and AAU and a few others are looking bullish in their current consolidation.
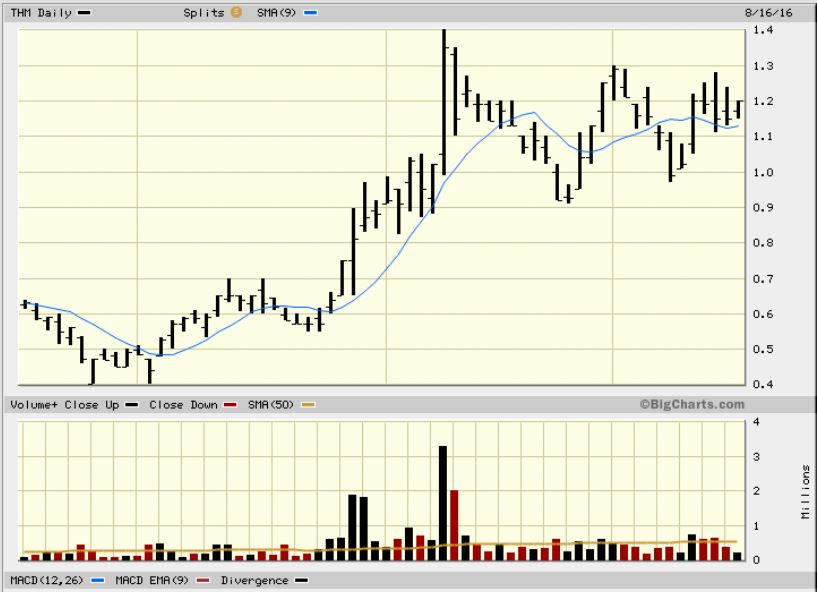
THM – If this drops to $1 and finds support, it could possibly….
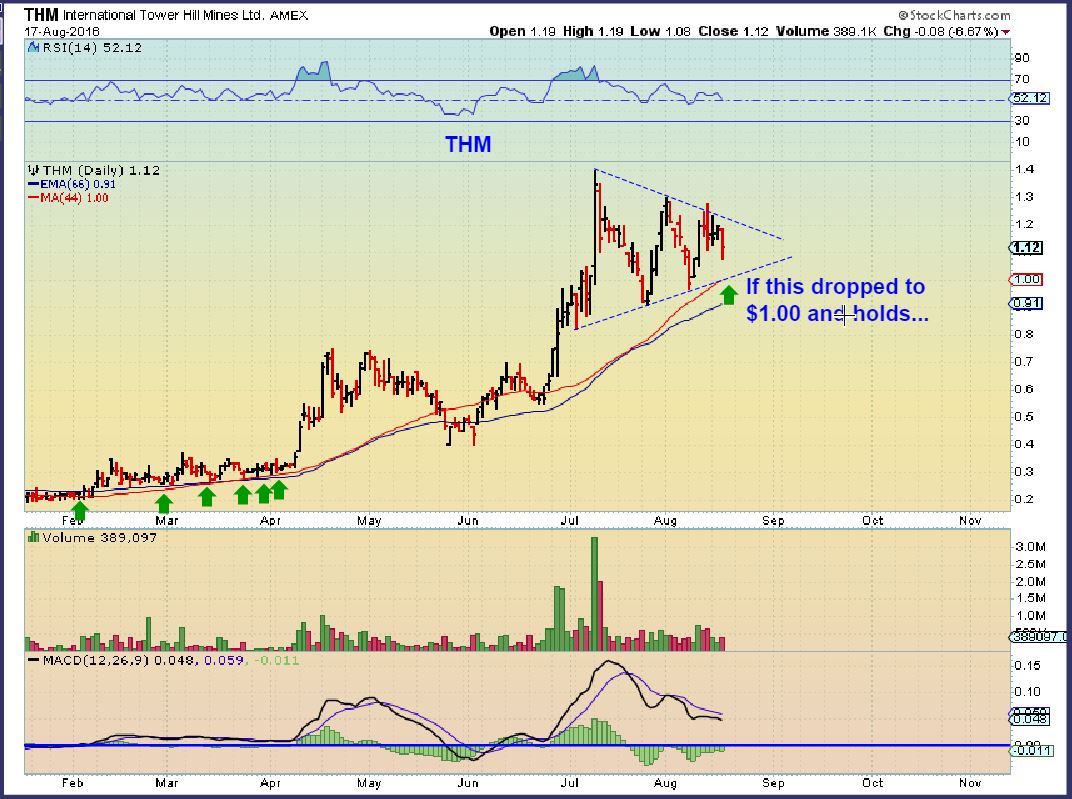
Run to $2 and double. It also could work around this flag for a week or so, and then go.
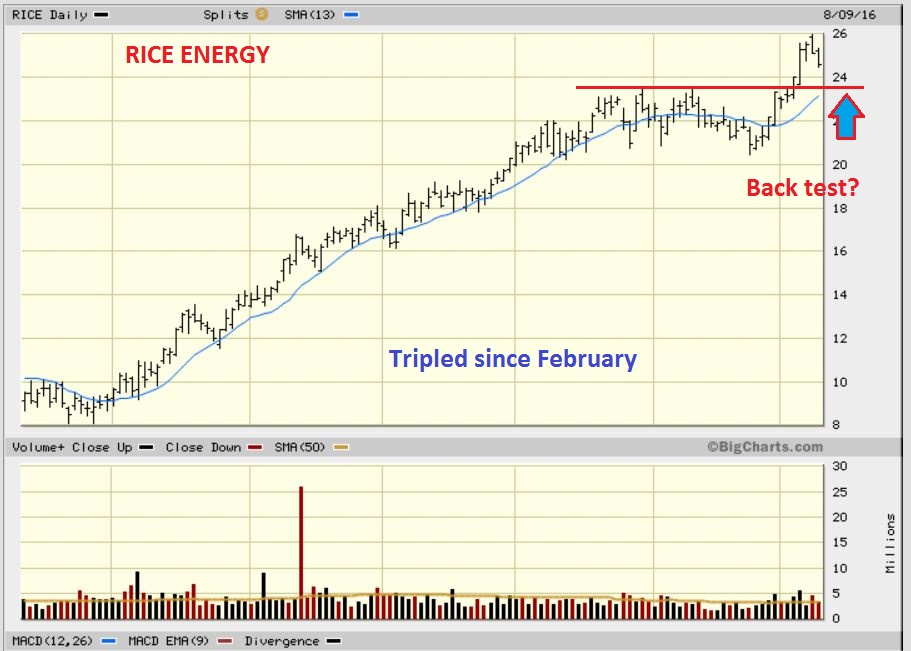
I am currently positioned in Miners and Energy, and I am also watching for Pullbacks in Energy and Miners for buying opportunities. We had a nice pull back in RICE and it is taking off again as expected.
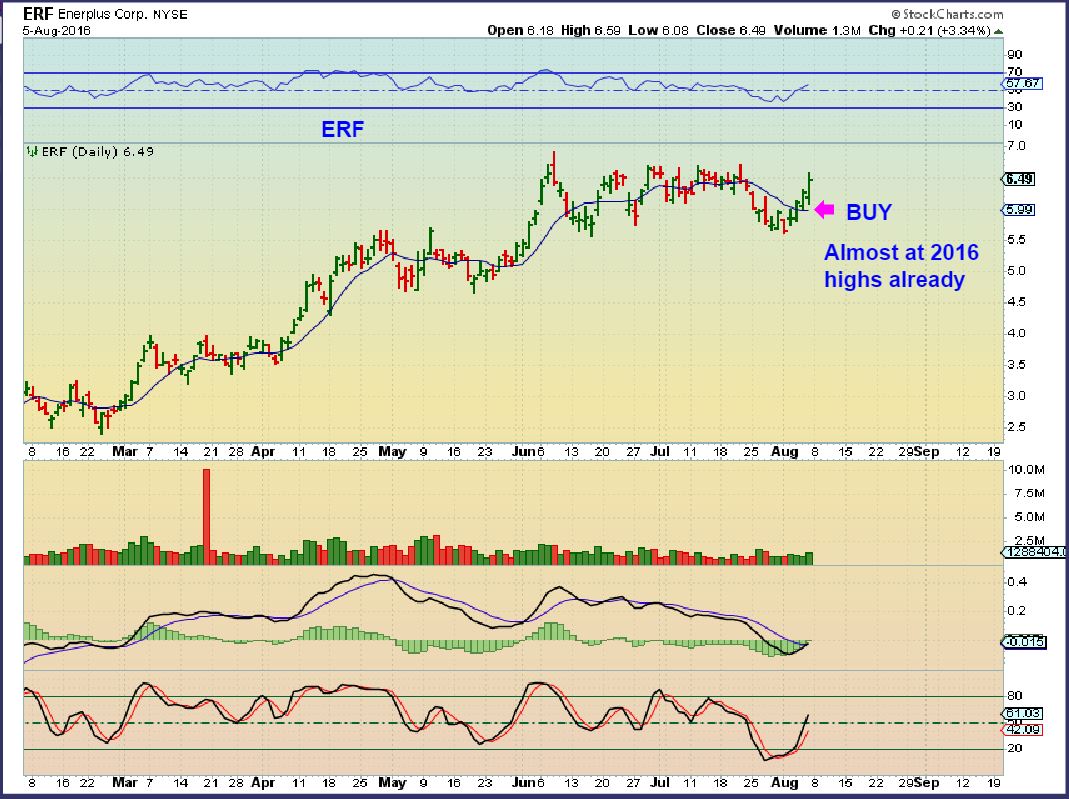
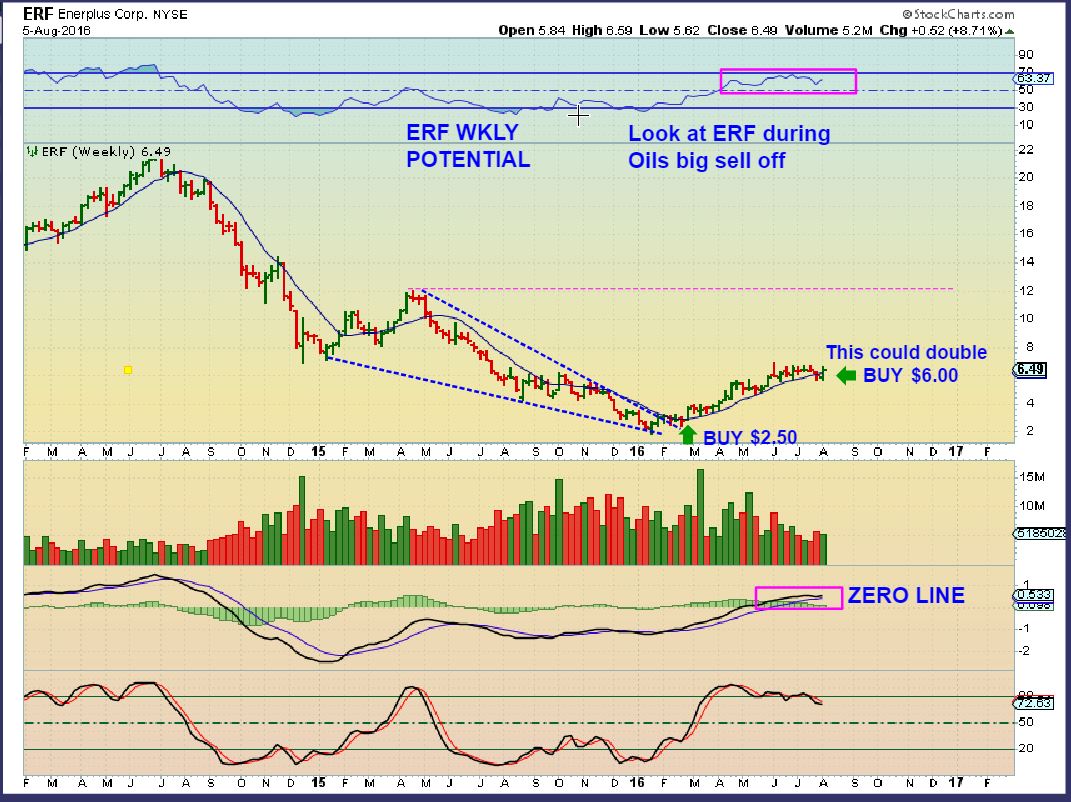
ERF was posted here on AUG 5th as very bullish, it is currently near $7.50 now, so watch this one for a pull back, it is acting correctly.
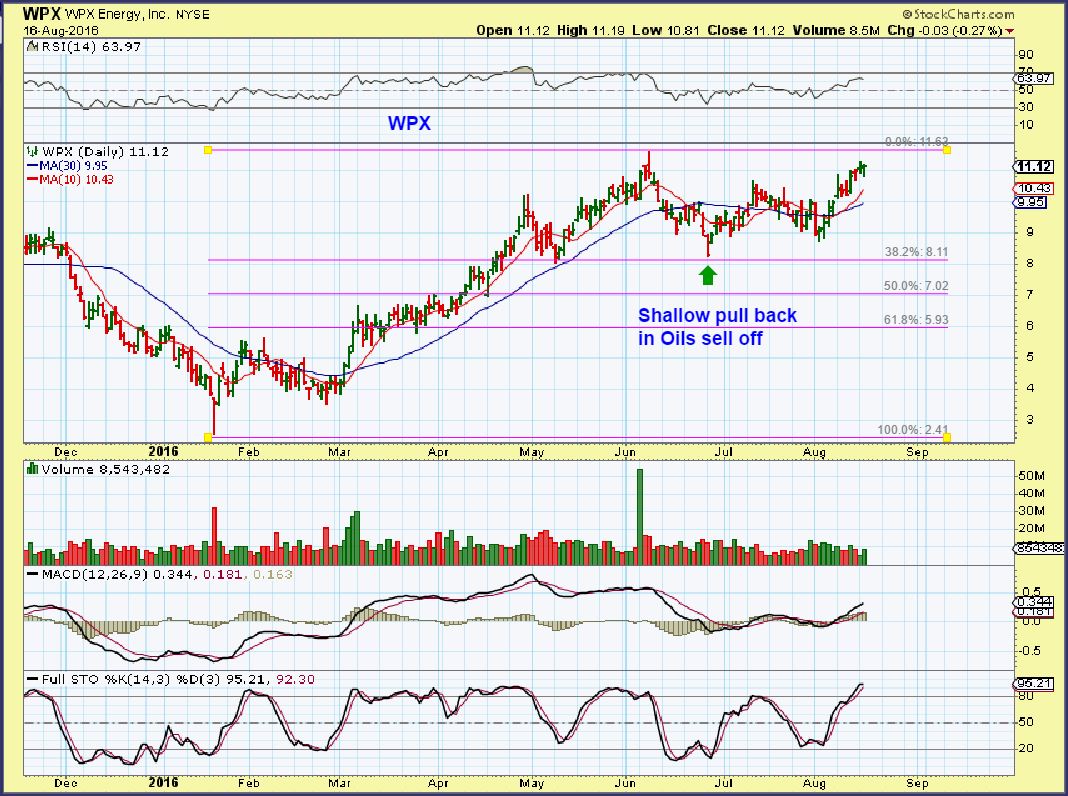
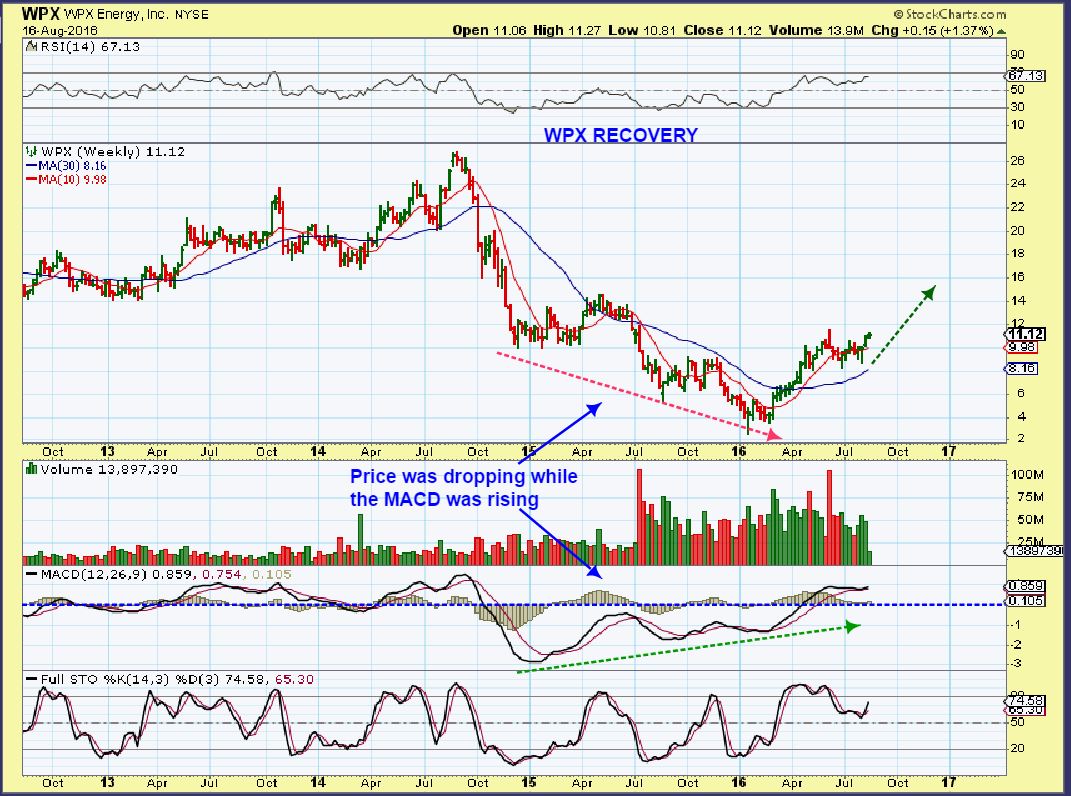
These 2 charts of WPX were posted this week too, and it is continuing higher now at $11.44. As I have stated, Oil cycles can go higher for 2 or 3 months. You should own something energy and this one is just getting going in my opinion.
I will point out more trade ideas as we go forward. At this time Thursday will help us to see whether or not we get Bullish follow through in Gold for another run higher, or do we begin to dip into a buying opportunity too. Happy trading!
.


thanks for the good work as usual, do you think WG looks good here?
It looks O.K. & should move higher, but doesn’t look very strong at this point
HCLP, another to put on the watchlist. CAVEAT – I have no idea of fundamentals or financial shape, I just love the chart. Do your own DD.
I like it Miller
I’m still holding some miners, (MUX, CDE, TAHO) but I’m not buying until gold makes a correction. Timing is bad here. Gold just bounced off the upper trend line, will probably head back to 1341 Today. I’m looking for NUGT in the $142 area as a buy signal. Just my 2 cents. F5
Thanks Alex – Brent already cracked the $50 mark this morning.
I let BTE go. Oil is up about 17% since this run began at the beginning of the month, yet BTE is down. Their fundamentals really suck, but they have their debt managed so the bk risk is reduced, so it will probably be good – I just see others that are free of the overhead that I like better.
BTE has been doing well since earnings release. Up over 20%. UWTI is the way to play energy, as long as you are confident the low is in! IMHO
Just my 2 cents….I still own BTE and today it got above the 50 sma resistance that I pointed out in past reports. It’s up 20% in the last few weeks and that was as it worked through resistance. If it continues higher, soon it will have very minimal overhead resistance to about $15 area.
It ran from $1 to $7 ( 600%) and pulled back very reasonably fron the first oil run. I like the wkly potential as shown in prior reports.
GBR is taking off! See if it can get over 13.80. the company has a rather strange profile having a retirement community in addition to its energy business.
EGI is a gold and copper stock in a nice base. I think it’s a good risk reward here as they have a good balance sheet
CHK financials. I see CHK has awful net income of ($14,685) million? I’ve read that it also is carrying enormous debt? I looked at the balance sheet, I don’t see the debt, can anyone else take a look and let me know? I read this morning that it did a deal for new loans.
http://financials.morningstar.com/balance-sheet/bs.html?t=CHK®ion=usa&culture=en-US
More on CHK, sounds dangerous….
https://www.thestreet.com/story/13677734/1/stay-away-from-chesapeake-energy-stock-it-won-t-recover.html?puc=_htmlbooyah_pla6&cm_ven=EMAIL_htmlbooyah
I sold today because of what Alex said about weak look of Nat Gas.
Whoa. The CEO got Michael Hastings’d. Ugh… I just bought some of this yesterday. Ugh.
Chart Freak, can you please weigh in on this?
The chart says it is going higher. Maybe they are getting their house in order and investors are investing in future prospects and not the past. Debt can be worked out over time.
http://www.marketwatch.com/story/blog-coverage-chesapeake-energy-puts-its-house-in-order-2016-08-12?siteid=bigcharts&dist=bigcharts
My data source here Bill says gearing at more than 500%. That would add to your suspicion of enormous debt. Don’t know if that helps?
500%? of what? Thanks Chris
Adds that this is also known as ‘debt to equity’ ratio and is total debt as a % of NAV. As a rank amateur on fundamental analysis is sounds like there are better places to risk your money!!
Accounts Payable of 702 million and 4 million in the bank. A long term debt of 8.6 billion.
Total Current Assets of 1,204 Billion over Current Liabilities of 3.777 Bill = a current ratio of .31.
Funny how all the fundamentally weak stocks are excelling ( ORIG, SGY, CRK, maybe RENN?) , and the ones supposedly with good fundamentals ( LIKE PACD) remain at lows .
I fully take your point Alex and I suppose one arguement that could be made is that the greater the debt and the more extreme the gearing then that leverage will work in your favour if the oil/gas prices keep rising. What I personally struggle with is when you see what appear to be really bad fundamentals it feels like playing with a hand grenade with the pin out and these could ‘blow up’ at any time without any real warning. At that pint and especially if the that news breaks out of hours you then get an horrendous gap down which blows away any stop losses you might have. But to each their own and higher risk will potentially bring higher rewards as you have been proving time and again. So all credit to you on that. 🙂
Good illustration ( grenade)
Some have gone the way of the Dodo bird – I am trying to stay away from the real risky penny junior oil companies in this second run for that reason ( but they do a reverse split and then take off like a rocket…its tricky).
I would say to any trading those to pay very close to position size and instead of saying “This could double” , try to say ” How do I feel if this could double or go to zero”.
This is a huge exaggeration of an illustration but if you had $10,000 and put $1000 on 10 of these juniors, you could see 3 go bankrupt, and the other 7 double or triple, and the end result is….Big.
You could see 5 go Bankrupt and the other 5 up 200% or 300% in a year, and do very well.
So I always say that you need a good basket, keep some solid companies riding ( Core) and trade the profits and extra funds on maybe a bit more risky yet possibly rewarding.
NOT FOR EVERYONE- The losses hurt emotionally, but for the NAKS, and TRX, MUX, VGZ, THM, XRA, etc catching them at the time that the charts says they are ready to go.etc it pays off.
You could put 10 positions on and lose on all of them, but that is unlikely under current conditions.
I fully take you point Alex and it’s food for thought for me. I’m constantly watching and learning not just about markets but also about myself and the psychological aspects are huge. But its three years now since I was made redundant from my old job and have been concentrating purely on investing since to surive. So hopefully getting at least the odd thing right as I haven’t gone broke yet!! Lol
Play it safe. I admire that, I just feel the need for speed and tried to study the markets and find a way to get there – lol
Seriously, If you’re using money that you need to live on now or in the future, being safe is never being sorry
It’s certainly proving to be an interesting journey and although a LOT more uncertain now in a financial sense the last three years being out of an office environment have been some of my happiest by a very long way. 🙂
Totally with you on that one Alex. I always look at the potential downside or what I perceive it to be and then think about how much that would hurt or damage me. So I pass on lots of things that turn out well but have also avided some real horrors. Obviously you can also play with much smaller amounts relative to your total capital and keep the riskrelatively minimal. We all have to work out in the end what works best for us as individuals and what works best for our persoanl mind-sets etc. I’m using my life savings for this and see myself as a tortosie rather than a hare!! So my approach, which is an ongoing work in progress has to work with that mentallity!! 🙂
“Slow and steady often wins the race”
This is a great thread. I love hearing all these viewpoints!
Came back in from work to find it had been a good day. So thanks again Alex. Good viewpoint and test you propose above. Good question to ask before you take a trade….double or nothing and can you deal with it and how much do you want to bet!?
Since joining here in Feb…I have bought 3 Dodos…HK [which I had played successfully 3 times but on my 4th trip, it went bankrupt…big loss]. ARP [now in death throes as ARPJQ] and SGY. I may still survive in SGY…but even with a total loss on the other 2….I am up over 5 times on other plays of what I lost on those 2. And that is only counting the ones I have sold. I have lots in my core.
So I think risk is ok, but with care. Since being burned, I am being more careful to at least do some research so I can keep in mind if it is just a short term thing…or something I might want to keep longer.
Again, thanks Alex, and thanks to all of you who share so freely here.
So now, are the leveraged ETF’s any riskier? Hmmmm…….
Are Butcher knives riskier than chopsticks? lol
Depends on who’s handling them I guess
My point is the diversification you get with the ETF, yet the explosiveness of the 3X
My point is that you can still poke someones eyes out with chopsticks – lol
yes, I agree, I use them at ICL’s and DCL’s frequently, until they at least double 😉
I like that as a strategy. Obvoiously the trick is spotting the DCL’s and especially ICL’s in real time!! But that’s what we have you for!! 🙂
posted about it on thread “eye of the beholder” toward top
Read it thanks.
Whose got a target for USOIL? $52 double top?
Some analaysts are suggesting the recent lows around $39 have formed the RS of a MAJOR inverse H&S bottoming formation with the neckline around $50. If thatw as the case then a clear break above 50 would suggest an eventual target around $74. Some would also potentially argue that the initila move up to 50 was an EW 1 and we have just completed an EW 2 (also potential IC low) and are now in the very early stages of a major wave 3. THat would also suggest MUCH higher levels to come eventually but ken or Maria would have much more idea than me on the possible EW count.
I see 2 scenarios. On the attached chart. EW 1-5 is clear with a target of $53ish. Also, I can see a smaller 12345 within current wave 3 (green dotted lines) which would have a top at $49.11.
That was how I origibally labeled my count but when I took a closer lok at the daily moves I started to think that there was a smaller daily count that suggested your wave (1) peak is actually wave (3) and thus the peak in early June was a wave % and the first MAJOR wave 1 of a new bull market. The recent pull ack into the AYG low also retraced an almost perfect 50% of the first major leg up and as I say looks like it could be formaing a RS of an inverse H&S. So all in all I chnaged my labeling to make the recent lows a MAJOR 2 and that would now put us in a minor 3rd wave up at the very start of a MAJOR 3rd wave. But only my thoughts and they could well be wrong!
Chris, very observant on the H&S pattern. Wow, that would be a huge move. I can see a pullback soon (bull flag), as the green dotted lines show, due to resistance zone, then a move to $53-54 as a completion of AB=CD from the start at point (4)
refresh… from the weekend report 2 wks ago
.
You really dont read my reports do you : ) ( J/K)
.
2 weeks ago! I can’t remember my lunch half the time.
LOL – Me either really. Unless my wife forms the meal into a bullish looking chart set up
I knew I’d seen it somewhere!! Lol And my excuse is ‘short term’ memory loss, which comes with advancing years!! 🙁
It would be a nice move!! Especially in your favoured UWTI!! Not sure what timescale would be involved though and of course it requires a clear break above that $50 neckline. But very much agree with your interpretation of the current bull leg, whatever the correct larger counts and labelling are.
I took big positions in UWTI, GUSH and ERX. Things are going on target so far.
Nice trades. You must love roller coaster rides though if you can ride some of those ‘wiggles’!! Lol Either that or you have a way of timing the moves…even better!! 🙂
There has been no real wiggle with UWTI since I bought it. I posted real time on this site. I bought UWTI and GUSH the same time and ERX a few days later. UWTI $18.xx or so.I can’t imagine if it goes to $42 or higher.
That and a few of your NUGT trades must have paid for an extra rare growler or two over there in western Mass : )
For sure! I was at TreeHouse on Saturday. Only waited 20 minutes to buy $57 worth of beer. Filled 5 growlers.
You do seem to be well on top of your timing. I was jsut thinking if someone was trying to ride a whole cycle in something like this…I know you don’t and Alex constantly warns baout doing so in x3 leveraged vehicles… but moves so far from $12.5 to $40 back down to $16.25 and now currently $28 all in the space of less than 6 months! But I do appreciate you time those swings rather than ride it all the way. That takes skill and a good system. 🙂
Just good luck! Thanks Chris.
A bit more than that I’m sure Bill! 🙂
Invalid count Bill.
Wave 4 broke top of wave 1.
Ken, Huh, that’s an EW rule? Okay. I don’t have a road map then. I’ll have to go with the H&S pattern
Make your (3) a (5) instead and that makes the first MAJOR wave 1 up. Your (4) becomes the MAJOR wave 2 and your (5) will be the top of minor 1 of MAJOR wave 3 up in a new bull cycle. I’m pretty certain that’s how Ken sees it currently and will have you on the same road map as him which is not a bad place to be! 🙂 Like you I see we are potentially approaching a possible minor wave 3 peak in that first larger wave up. So near term pullback for minor 4 then up to minor 5 which in turn will be the first wave of MAJOR 3. if that is close to correct we are potentially going MUCH, MUCH higher over time. But one step at a time! 🙂
Use Both !!!!! And add in some of Alex’s Cycles. 🙂
Your eyes are seeing EW Bill stay with it…….another tool in your holster.
#holster
meow
LOL…..
I went for a horseback ride yesterday in fact Tonto ……. I felt like the LR but with out my holster and gun 🙁 and Tonto by my side …… 😉
jealous….;)
CRK is doing a NAK
Of course,…. I sold it yesterday.
I sold CHK today after reading Alex’s view on Nat gas….so , of course it continues to fly up again after I dumped.
I definitely do NOT have my exits correct. At least I will avoid the confusion of having both CHK and CRK…that was really annoying!
I’ll take CRK over CHK anyday of the week
I had CRK as a dog for so long, I was really glad to be done with it …and I actually took some profit. However, in my old account..it is still WAY in the red [for YEARS!]…but I will surely be rooting for it to do well so maybe I can get out in that account too!
I let my EBIO go last month — still sad about that!
yeah and to think I sold at the bottom after earnings 🙁
Crude Oil STRONG…….. 🙂
I took a flier on ORIG last week when it broke down HARD, someone else here did too if I remember, +25% today. 🙂
Natty is clawing to hold that 2.65 mark – given the action in CRK and CHK wonder which way it will go?
I think their action is connected to their debt refinancing rather than nat. prices right now.
Yes… But I think sometimes the sentiment is sometimes so strong that it influences those trading the underlying — look at how strong CHK is trending right now …
Ya, and look at a long term chart too….was once a $25 stock…looks to me like it could go to $7.50 area which I think Alex mentioned…. And then to $9-10 area…..I was staying out of it due to the fundamentals but finally jumped in a bit due to chart…:)
I was staying out of it earlier too, but jumped in over a week ago due to the chart too. It has paid off so far, and yes, I do think that it will work its way back up to the $7.50 area. ( you’re a good listener : )
🙂 🙂
Bought LPI on bullish flip weekly PSAR. Stops in place, of course.
I had that in a prior report, its an inverse H&S too, and the upside looks pretty good. I think someone mentioned fundamentals iffy, but that chart looks good .
Alex, or anyone else….BBG…I have it and it is looking good finally…today I read a presentation they did and the reaction seems it was received well, or maybe it is just because oil is up. I traded this before and did well, so thought I would try again. Opinions?
Nancy — we think alike, which I don’t know is good or bad! I picked that one up too a week or so ago.
Alex,
I am trying to see what your seeing in Natural Gas to make you cautious at these levels, broke the 10 dma today, RSI, Stochs, MACD all look good to me……not to mention my EW count looks good unless 7.51 UNG is taken out which would mean it is still in a wave 4 correction but until then all I see is positives…..long UNG Calls 8/11 entry.
Well, for starters, you said “It broke the 10sma today”. My last 3 or 4 reports pointing out the possible weakness were not based on today : )
When I was looking at NATTY recently , I said that it had the appearance of a bear flag, it was still below the 50 sma and 10sma , and the MACD was not good 3 days ago , RSI was below the 50%. You can take a position, but you have to be cautious under these conditions.
So in my reports, those are cautionary remarks to keep the trader aware of what I am looking at. Until those improve, I mentioned to be cautious. If you see improvements going forward, you are fine. Gaining the 10sma and especially the 50sma would be bullish improvements . If we break recent lows from a few days ago, the correction could continue and Ive pointed out the 200sma as possibly being tested if that occurs.
If you remember, I also gave 2 scenarios where lows could come from an undercut like we saw in April May . The recent low was that undercut
Refresh, so it is possible that we got this shake out type move again, that I pointed out on Aug 9th.
I was just adding “Caution” until it recovers
Yes I agree that Caution was neccessary on Aug 9 which was prudent because It did break down below your blue dotted line, which is my wave 4 bottom and entry, But …….. today you stated you were Still cautious? I was wondering if I was misssing something is all.
BTW…..you never take a trade below the 50 and 10 dma ? 😉
Wiseguy :- ) What I do , and what I encourage others to do in my reports often vary for sure. – lol My eyes can be on the screen constantly. My readers may take a trade at the end of the day and not see it again until lunch time or the end of the next day.
I take the riskier set up if I feel that I am seeing something bullish potential ( Like your wave 4 possibility), but when I am writing a report, I want to ‘report’ the bullish and bearish things and get the safer .
My newest saying that I added to a recent report is going to be “Caution , not Panic”
LOL….I know ….. and understand.
We probably should chat in the near future…….I do not want to cause any misconceptions to others here.
Sure , We could chat anytime- people here probably dont think we’re going at each other, ‘going for the throat’ as they say – if that’s what you mean by misconceptions. I think that we used enough smiley faces and LOL to show humor.
and Chris and I were just discussing different trading styles and such below . I appreciate them all and think that different people need different styles to suit their goals and needs. If they make you money, you’re doing something right : )
Misconception meaning if I state a trade that is in direct opposition to your “caution”.
Ya know what…I am absolutely fine with that.
If you post that you took a trade based on XYZ, thats as valid as anything. No worries at all.
And my ‘cautionary ‘ note may prove to be invalid in a few days. I’m sure it has happened with Precious Metals in the past. Volatility is hard to forecast
I will use discretion……. 🙂
From a 3rd party perspective your conversation made sense and wasn’t confusing. Just sayin’
how come… some time you are Ken and other times Kenneth Velting?
will the real Ken please stand up? I not sure if I’m talking to the same guy … or are there two of u?
HeyNowwww…. meeeeeeYowww
No one in Ren? still going up 8% today
going up like a rocket to the moon
Not getting a lot of mention but LPI is making a move this week, finally! Looks solid here, ready to break out to new 52-week highs.
I’m buying dips in CLF …
Yeah, was gonna ask CF about CLF!!
I thought today was Friday all morning. The last couple of weeks have been crazy busy , but the trading continues to be excellent! : )
I’ve always thought you were ahead of the game 🙂
and i thought I was a suckup.. LOL
#Facts
yes daddy.. wonderful ….thanks in SMALL part to u….
😉
Hi Alex- wondering if you like the look of BCEI here? took some yesterday and added at 1.10 today. Thanks
scratch that- just saw your reply from yesterday. Any thoughts on Rexx? I took a shot at .60 on that one. Lottery tickets here only. Not betting the farm.
REXX looks good for a lottery ticket, meaning CHART ONLY.
Let me say this : I traded every Junior Miner and oil company coming out of the bear mkt ICL, because in the past I have seen that they ALL go up, and many of the most beaten down ones have short covering and buying that surges them 100%.
After the second higher low is in place, I put less in those because now if they have financial trouble, it becomes more apparent in their earnings that reflect last yr to this yr.
AFTER SAYING THE ABOVE : I hate to say this, but the REXX 1 year chart looks awesome here as a break out
Oil count:
June 10 high = wave 1.
Aug. 5 low = wave 2 correction. 62% Fib Retrace,
Currently in wave 1 of 3.
As I have stated before the CB’s need Inflation what better way to get it than to increase the price of Oil?
Giddy Up !!!
I’m pretty certain I’m on the same ‘song sheet’ Ken which is nice to know. 🙂
Cool…..lets enjoy the ride together !!!!! 🙂
… yeah lets
#ILuvOil
Tonto !!! Where have ya been ? It is summer time for crying out loud school session still on vaca?
Just observing… Learning… Crushin on my favorite boys…
#waveRider 😉
Chris and I have been missen ya !!! 🙂
miss u guys too…
and everyone…
IHeartChartFreak
xo
Edit: well .. everyone minus PecosBill
#HB
WTH! #HB
hahahahaha
https://uploads.disquscdn.com/images/533d22a404495f7d30e50f39debd62123cbe74d7661fce97f5133290f4d1170a.gif
thats for you chartfreak…
F5
.
HA HA!!!
I’m hoping for a record number of “likes” for that one – starting with you : )
dont u have some place to be …..
and dont you be texting in any hot stock tips while you’re perched on that gold throne… that would just gross me out…
for a minute anyway… LOL
All I did to begin this thread was give you both my Oil Count and all you two brought it down to this? 😉
giggle… u no u miss me… ha ha
So this is how we get to 160 comments on one newletter…
LOL LOL !!!!!
dont encourage him….
And a nice use of F5
No Growler sharing for her!!
Certainly not!
There’s a lot to like at the moment! 🙂
😀
I scaled out of my calls WAY too early. Back when we called bottom two weeks (extremely accurately, I might add!), I posted I was initially looking for $43.87 on crude so about $10.68 on USO. Wow, that was way too low!
BTE broke above the 50sma today – one less piece of resistance to this big picture thought from a past report ( refresh)
.
sweetness….
oh chartfeak
… there is not enuff time in the day for me to convey all my gratitude for you and this service..
thank you thank you sweetstuff
Damn..im lovey dovey today…
#Gross
Thx Maria
Happy to have you here and really happy to have such a good community of traders, investors here.
There have been and looks like there will continue to be some Excellent trades in 2016.
Ok, I just re-read this a little slower, are you drinking wine perhaps?
Clearly!
I imagine this was going on…
HA!! i was JUSSSSSST going to post that one to YOU!! ha ha ha
Hilarious…
I’ll just have to keep uncorking them this week to keep you on your toes!
Crazy minds think alike?? 😛
haha.. wasnt sure you would get the reference…
luv ur pearls btw…
They’re fab. As are my superbly posh gloves. But only dress like this for you guys. Not normally. 😛
PGH – REMINDER from the AUG 16 report. Today it is breaking above that 50sma. I bought it then and am adding now . This is
.moving a tad slowly as it approaches an overhead resistance area , so may take some time to play out, but I think that it can climb steadily above the 50sma with good upside potential.
refresh for 2 charts
.
Read the AUG 4th Earnings release at this link
http://www.marketwatch.com/story/pengrowth-delivers-strong-second-quarter-operational-performance-and-continued-debt-and-cost-reductions-2016-08-04?siteid=bigcharts&dist=bigcharts
.
I have some cash ready for a new position. Like the look of this chart, adding to watchlist – Thanks!
There goes SGY, starting to break out again. Due to the reverse split, it ran in a big way last time, but I’m not in this one.
DNR looks good again Maria
.
AREX has taken off . SO MANY good trades .
yes… it’s been wonnnnderful
#FebruaryFloridaFund
yes.. but i missed Arex.. but i love trading that one u no…
#watching
I missed it twice
Maria…DNR…
I posted charts that stayed strong during the OIL and NATGAS sell off like ECA, WPX, RICE ,CPE, CWEI etc for the longer term investors like Chris.
Look at those charts now, they are acting very well
Guys seriously, if you don’t own WPX on CF’s recommendArion, you’re wrong. I nailed the ICL lows on that one – it’s actually up now more than many of my miners are. There’s a party in the energy aisle and you’re all invited!!
here’s a crazy and interesting chart SRAQU – this is a new company being run by the dude who created EOG.
US Dollar just reached the lower trend line, will we see a reverse higher dropping gold into a DCL? F5
a few of the shippers are moving today – SINO, TK, TOO
I still own SB… really really getting bored with it and almost ready to dump it for an energy stock
So that means it must be ready to go higher now : )
it’s still riding the 6dma and rising so going to hang on for a bit
I know – The chart is fine, I would even buy it right here if I didnt own it – lol
I think it will pop & run, but I get bored quickly when I see all these other stocks running : -)
I need to work on that
Same. Testing my patient. Maybe I’ll add, that will at least make it do Something!
VIX retesting the lows. Could be a buy here in UVXY
HI chartfreak… can you comment on alj ? It had a bullish reversal yesterday but can’t seem to get traction today
Hi Frank
It still looks good overall. I known it is frustrating when energy ( Oil & Gas) are higher and a stock isnt responding, but that was a good reversal yesterday, it kept it above the 50sma and I think it still looks good here.
It has a little resistance at $7.50 – there may be people who bought the bounce there that just want to get out now. IF THAT IS THE CASE – When they stop selling, ALJ should go higher.
Refresh for a chart…click to enlarge
.
Pretty good day!
Anyone want to guess at how far dollar will fall before stabilizing into a low and moving back up? I think the trendline was broken today….I don’t do EW so….? It looks to me like it might find support around $93.50….? If that is the case then I would think gold still has more room to go up….?
Yep, I’ll take a guess – I believe it is on a long term down-trend, so it needs to move below the May 2 low – so at least to 91.50 or lower – maybe close to 90 on this leg down. It looks like we are just completing a giant H&S and will break below the neckline. Just a guess of course.
I was wondering how far down it would go on this leg, before hitting a cycle low and popping up – this leg down do you mean the daily or intermediate cycle timing? 🙂
Does anyone know much about GNE? I’ve never seen this one – energy – just checked out the financials and they are decent (really good compared to some!) – and the chart is interesting…..very light volume though – but…..looks promising…..
thanks ill look at it
Alex, thoughts on base metals and steel? X and CLF finally corrected – CLF and AKS have lost the 50 but are only just a bit away. X hasn’t worked all of the way down there yet, but could soon. Good time to start a position? Support seems to be just below so not too high of a risk if stops are placed correctly. Or are these more likely to continue to consolidate as gold and PM miners and the dollar battle it out a bit longer? Thanks.