
One Step At A Time
I am seeing step by step progress in the areas that we discussed in the weekend report, so I am going to go right there.
.
This was my weekly Oil chart
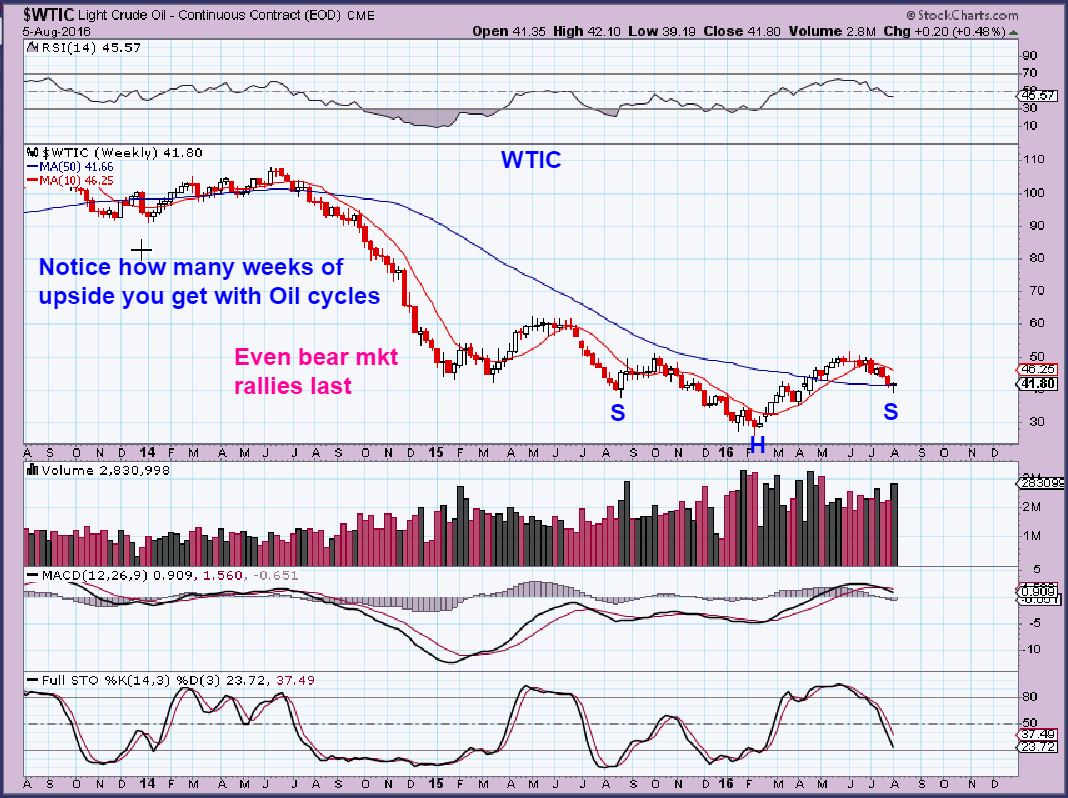
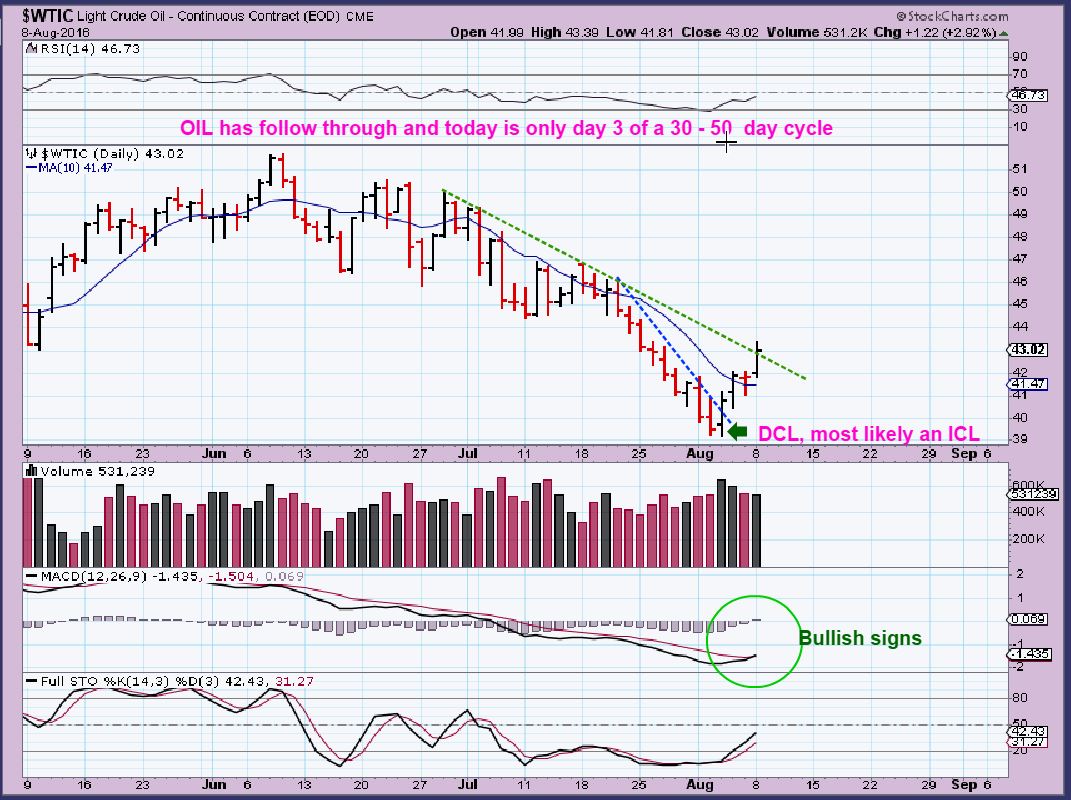
And we discussed that many Oil / Energy stocks were setting up bullishly. Many are a buy. The next step was to look for some continued follow though in Oil. Monday helped. It is only day 3 of a new daily cycle and most likely an ICL. This next run should last for weeks and months, so I want exposure to the types of gains that will come in some of these energy stocks . When I called the lows in February, Oil & Energy stocks made great gains.
I mentioned in my report that I already started buying some stocks and showed their charts and the reason why I like them. I also added this morning and put that info in the comments / chat section. I need to explain that some will just go up day after day, others will pop and drop back, maybe back testing a support or break out area. I DO NOT ALWAYS KNOW WHICH WILL DO THIS, but if you enter a starter position, at least you can have some exposure if it does run away. These cycles can last for months, you are still getting in at the bottom. In my past reports I mentioned that some have released earnings, so you can look for those. If you are looking at energy stocks from my Thursday report and they have been up for 3 or 4 days, you may want to be patient and wait for a pull back or start small and add as you go along.
.
I will cover more on this after I discuss Gold and GDX
.
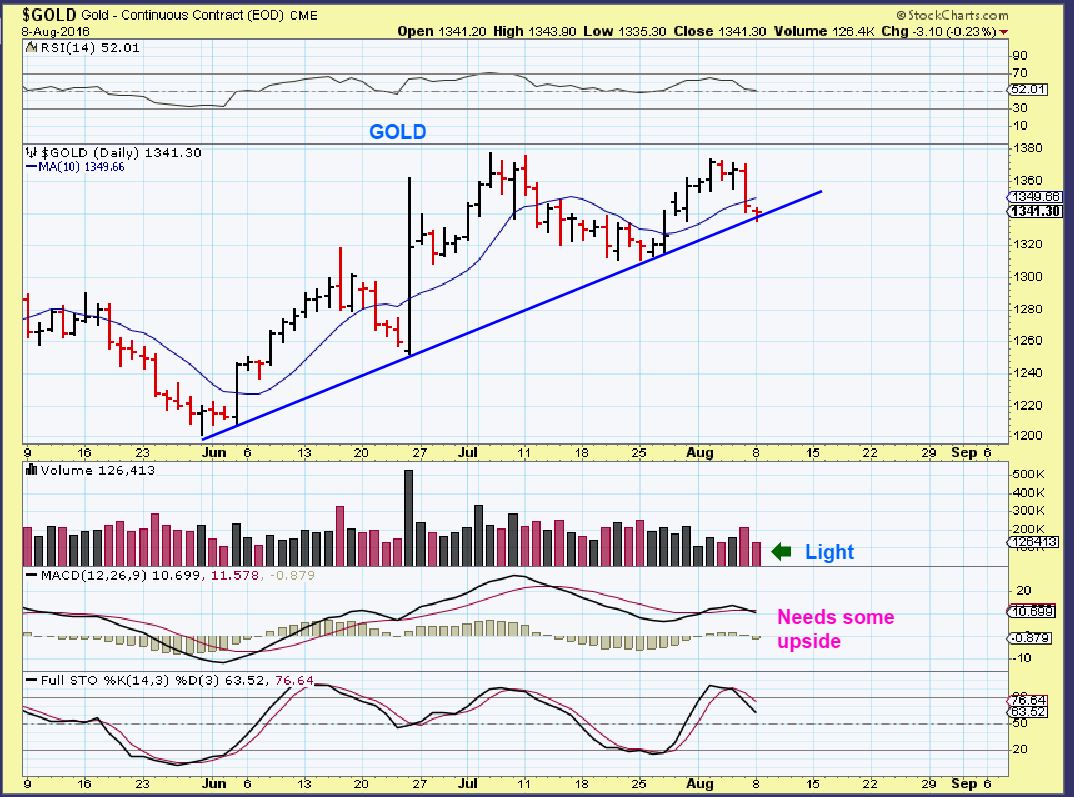
GOLD – Gold dropped a bit more, but held support. Consolidation at this point, as I mentioned in last weeks report. The good news is that…
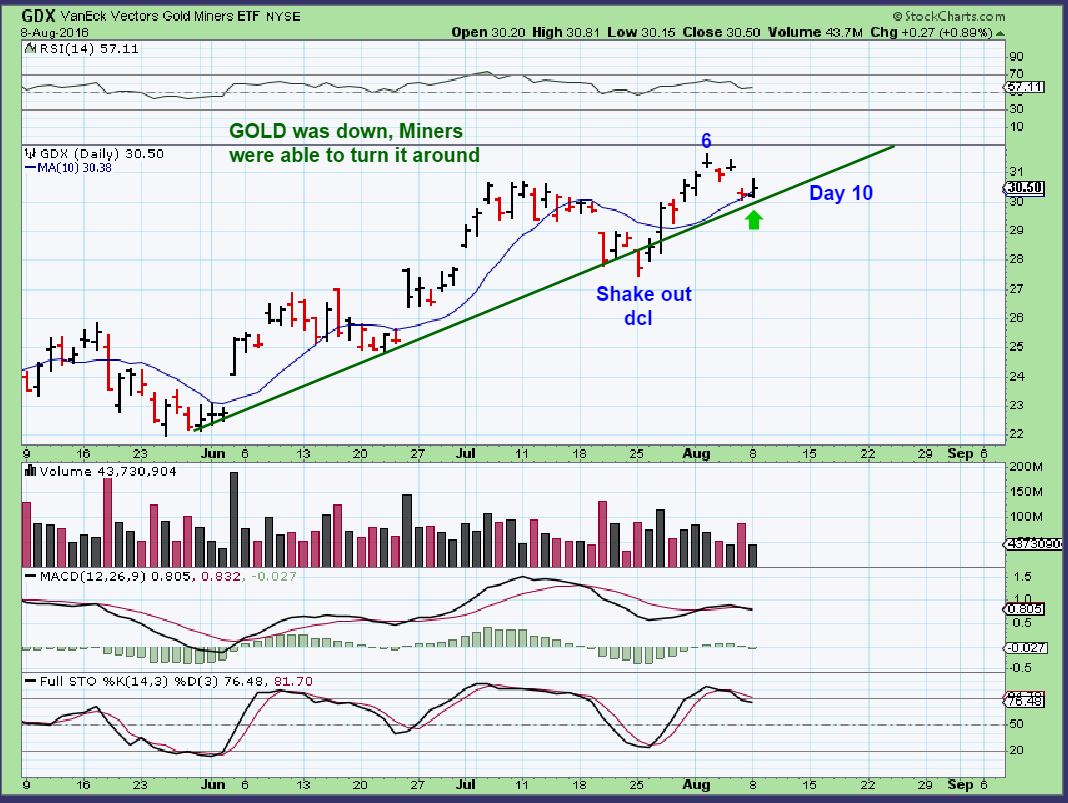
GDX – Many Miners were in the green, and could possibly be leading the metals. GDX put in a mini reversal on day 10.
.
Now I’m going to go back and point out a couple of ideas about Oil or Energy picks that I have posted. Some MIGHT run up day after day out of the lows, others may pop and drop and work their way higher.
I am asked, ” Is it too late to enter an energy trade now now?” My broad answer is , ” No it’s not too late, we have weeks or months of upside. I expect some of these to move 100% or more.” Could you enter and see a pull back? Yes,but I can’t say when or which stocks. I know that this question did NOT apply to the great majority of my readers, but maybe we can all benefit from the following review.
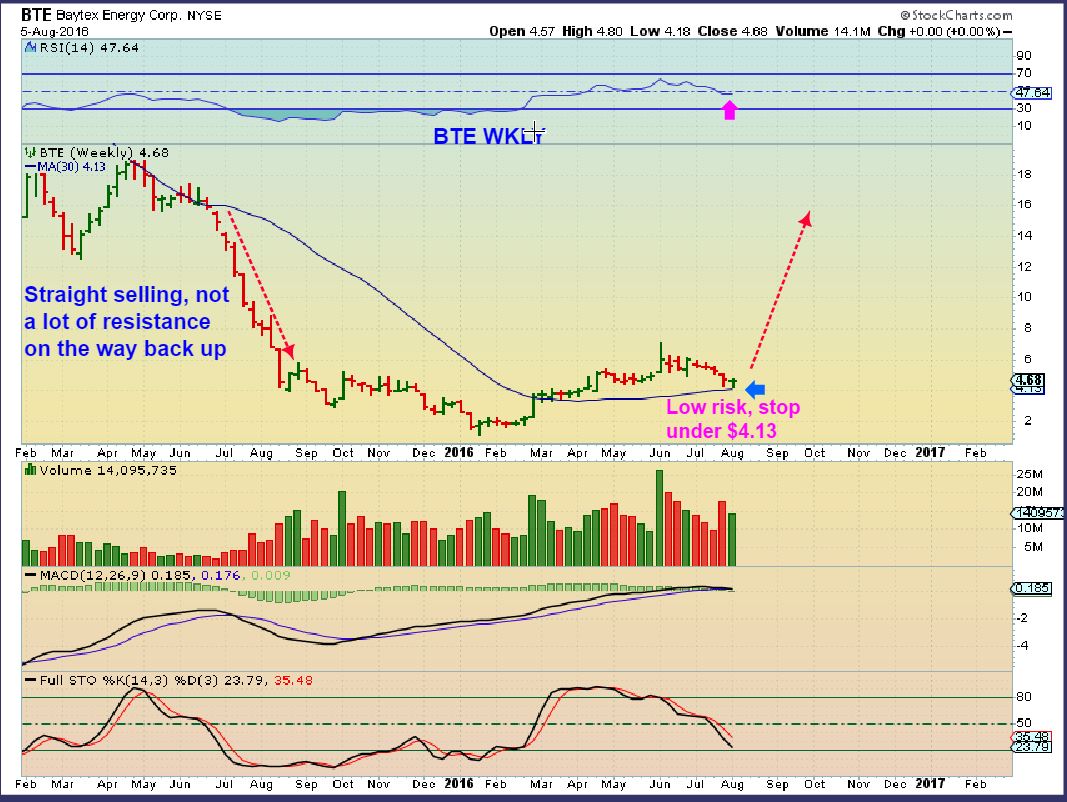
I posted this chart, and expect it to move higher for several weeks. I said that this could double, but look at it. It could even triple over time. It moved above $5.oo today. I have an arrow pointing at a possible $16 target over time. Where should you buy this? Anywhere here if you can ride the wiggles. If you cannot ride a pullback IF one occurs, do not buy until it pulls back. In January it went sideways for weeks, but eventually more than tripled.
I posted this and it could double. Where should you buy it? Either start a position now and add on the next pull back, wherever that may be, or just wait for the run to exhaust and buy the next pull back.
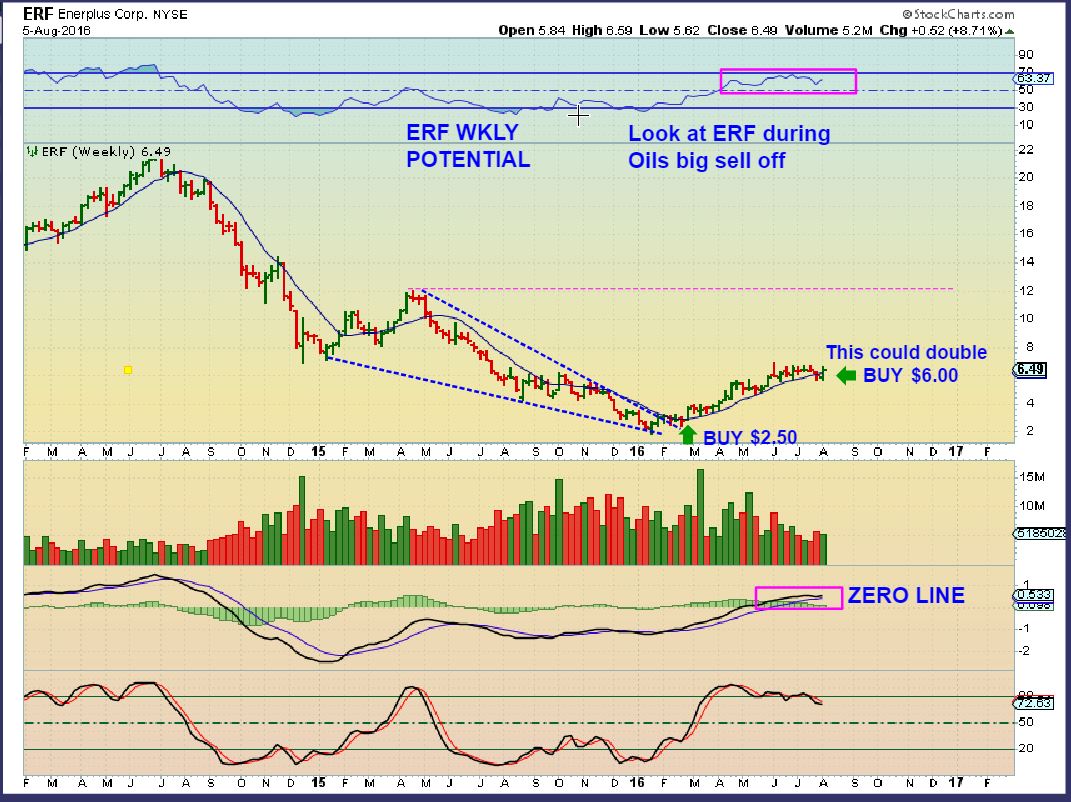
ERF – I even mentioned that
1. It did not sell off the whole time oil did.
2. It could easily double ( or triple).
So is it too late to buy? Look at the possible downside on this. When oil was selling off, it held up above $5 most of the time, it is not likely to drop there while Oil rallies.
.
SOOOOOOOO, Lets look at an observation that I had.
.
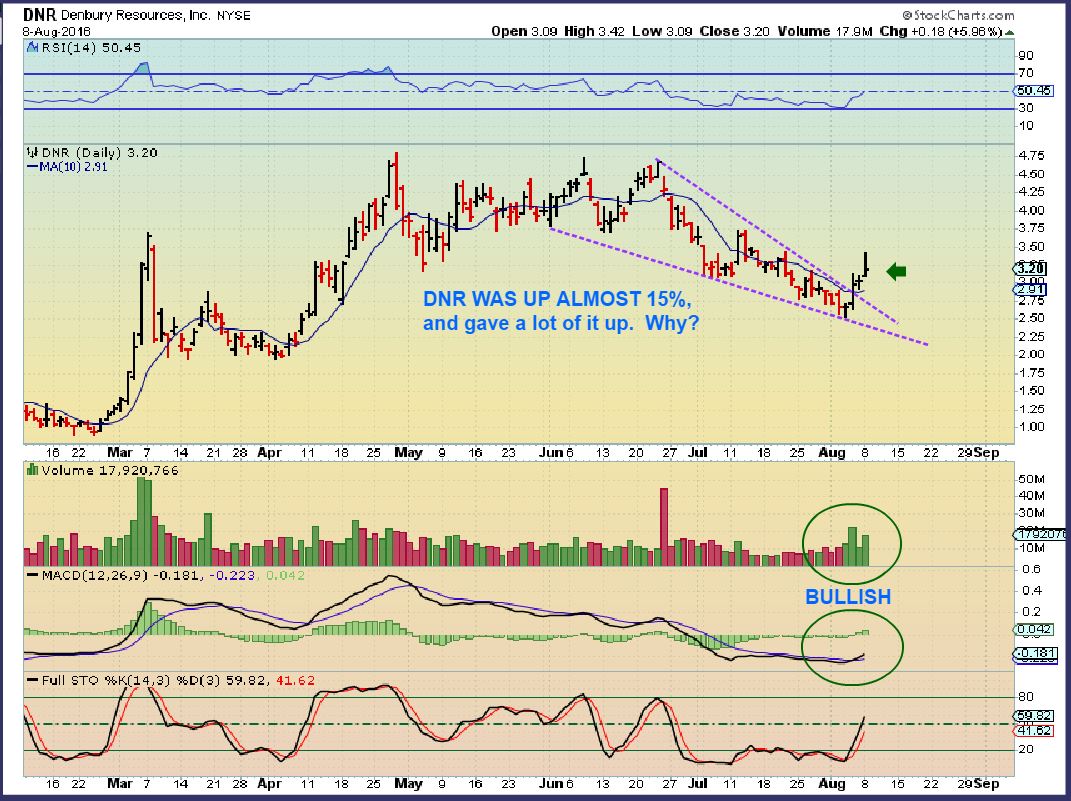
Some stocks ran up for a couple of days, and today ran up another 15% , but then reversed lower into the close. What about these? Any idea why? Is that a buying opportunity or should you be nervous? AREX OAS, & DNR surged to mention a few and then gave up their day gains. Why? Is this bad?
.
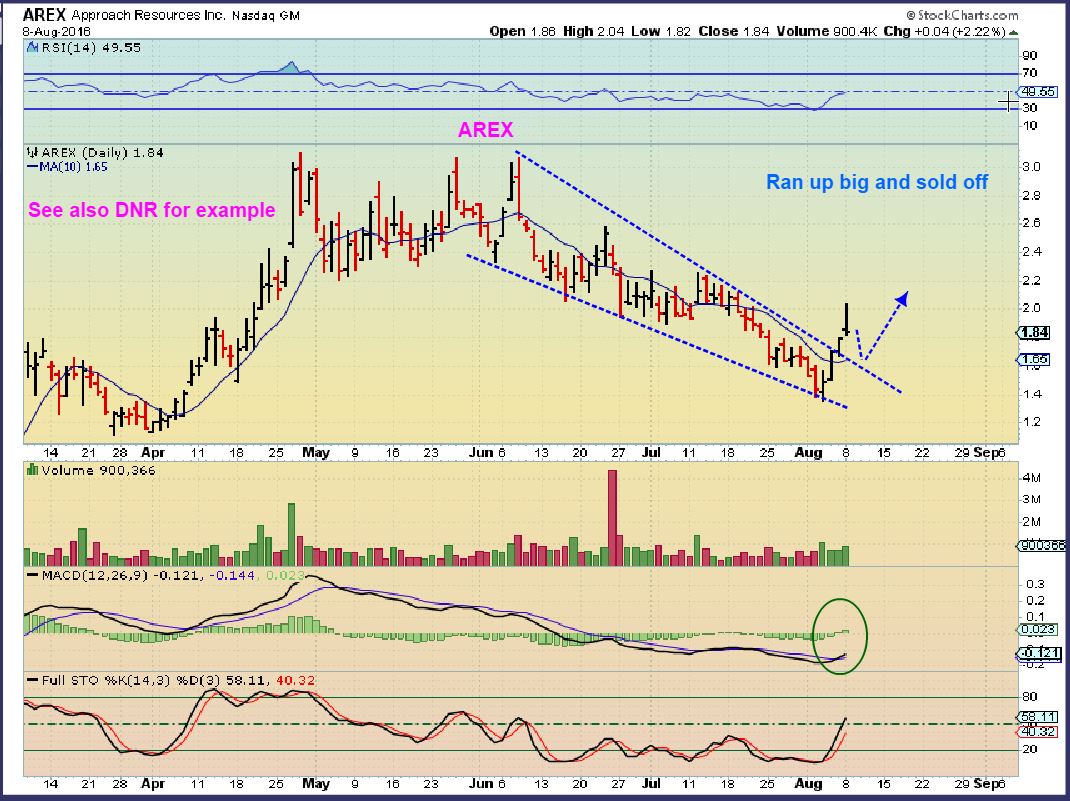
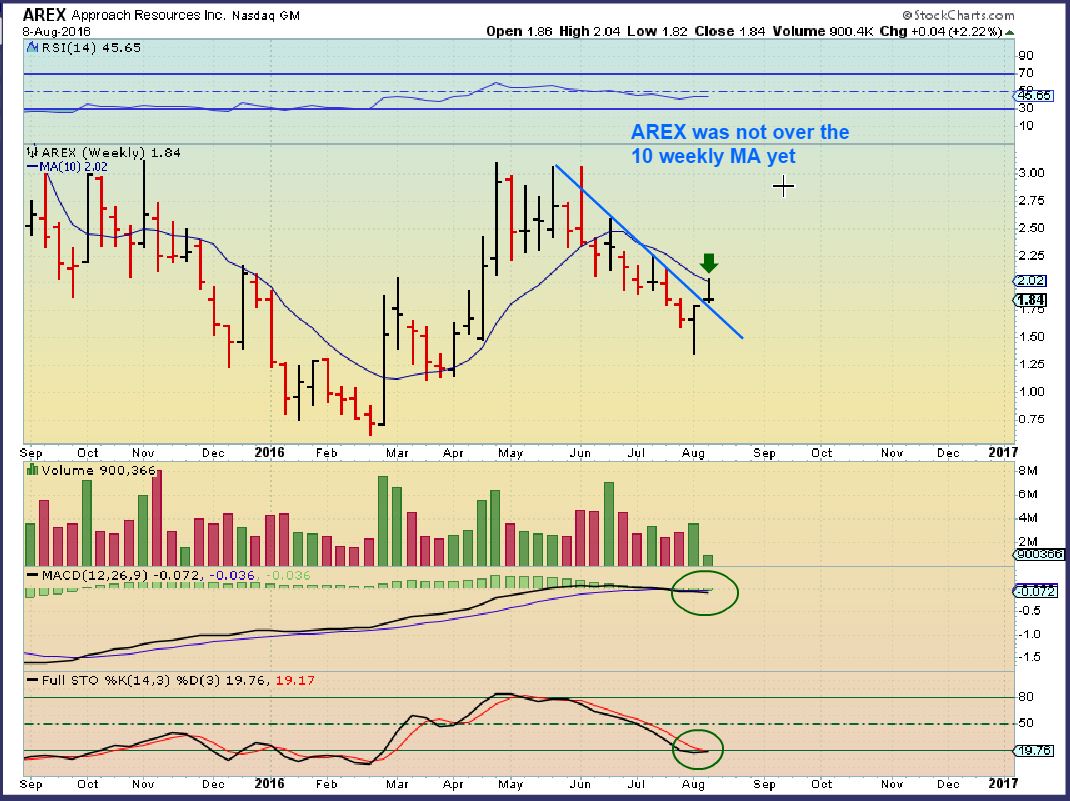
AREX – Reversal by the end of the day. “Oil was Green, why is AREX dropping? Is this bad?” I will answer in a moment.
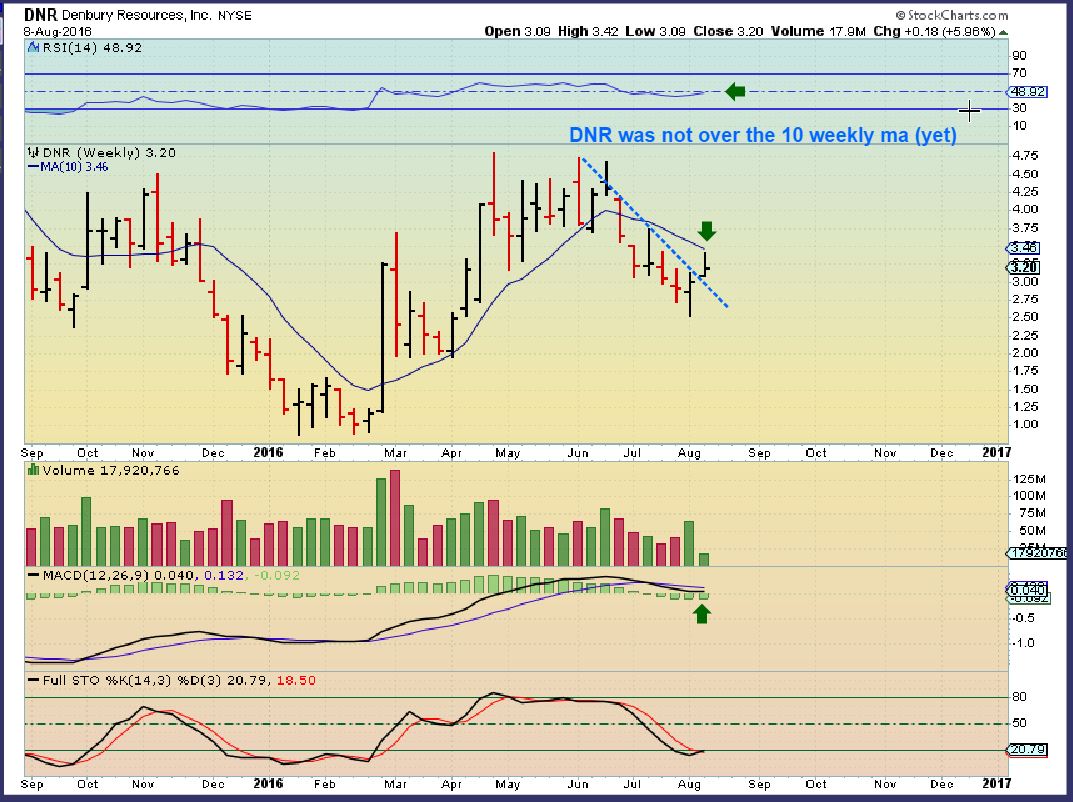
DNR – ” Why are these reversing?” ” Is this bad news?” “Oil was up, why did this drop? OAS did this too.”
 .
.
Lets take a big picture look at AREX and DNR –
.
AREX WKLY – Oh it didn’t even clear the 10 weekly MA yet. I believe it will, but this is often resistance if it didn’t act as support. It may even break back above it by the end of this week, we do not know. It remains a bullish break out from the downtrend so far.
DNR WKLY – SAME STORY AS AREX and these 2 are not the only ones. Resistance after a run of $2.50 to $3.50.
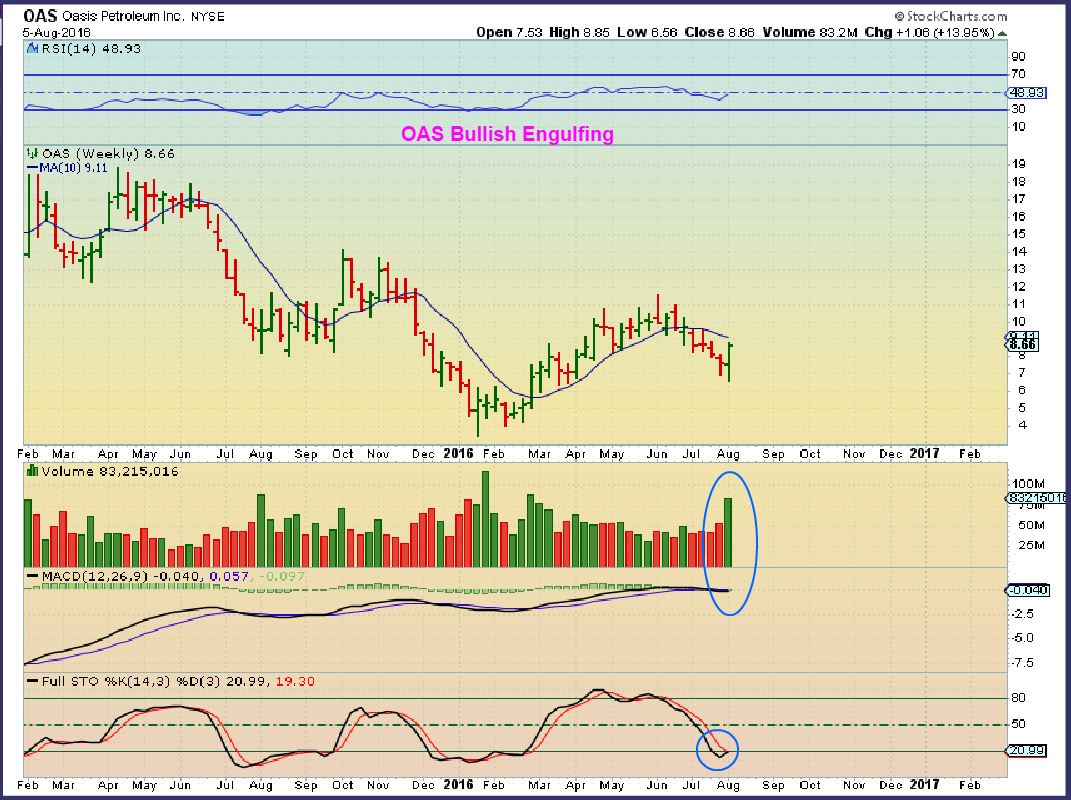
I even mentioned this in my weekend report with this chart. OAS ran up to $9.55 Monday and pulled back to $8.90.
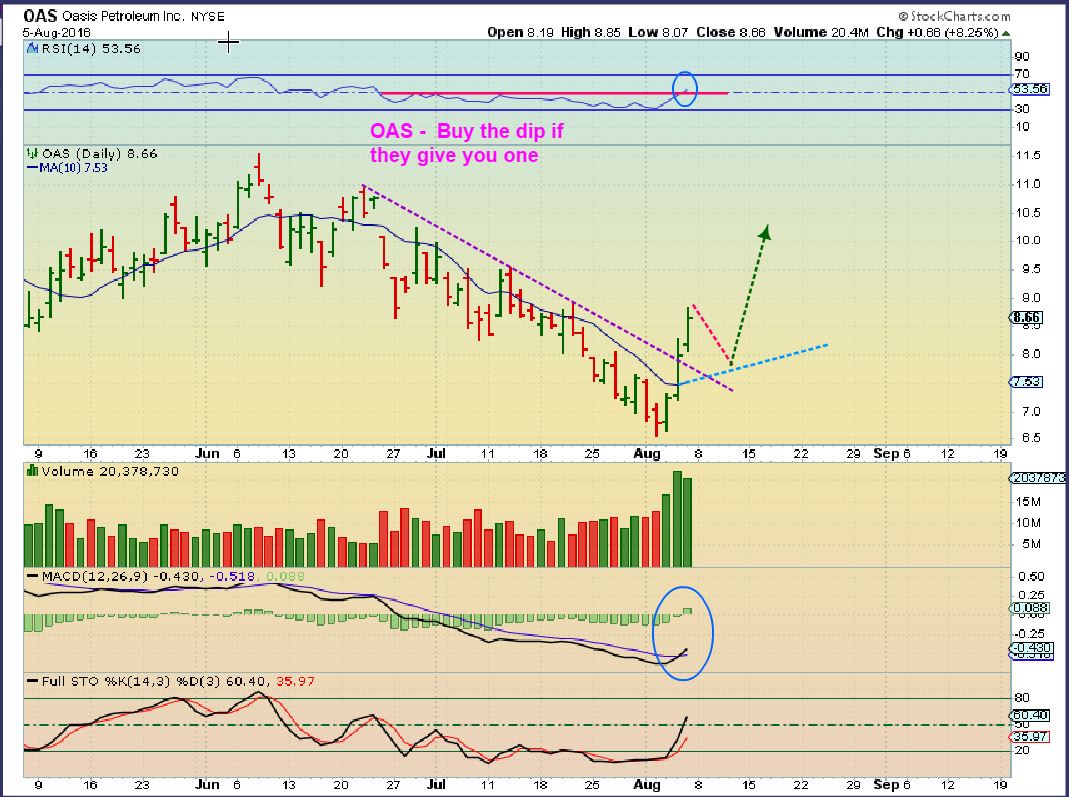
So if your energy stocks sell off soon, get a bigger picture view. You may want to add on the dip. If you dont have any positions, you also could add on the dip for a starter position. Nothing has changed since the weekend report ( or the Thursday and Friday reports, except that Oil has taken the steps forward to become even more bullish). I continue to like Precious Metals, but they were showing signs of a bit of weakness, mentioned Thursday night. Sideways consolidation can correct the problem and we have been seeing that. Oil and Shippers also still look good, I will be focused a bit more on these areas going forward most likely.
.
~ALEX
.
I had been wanting to explain my thoughts on NAK last week, since I know that some have entered that trade with me. I drew 4 charts to share last week, but Weakness in precious Metals and strength in Oil,Energy, and shippers kept me from posting them. I will do that here.
.
NAK continued to rocket on Monday. Giraffe neck at this point, but there is a gap below that may fill, since this is rather extended.
.
I drew up these charts last Wednesday night. These were my thoughts on Nak, and they continue to be so.
.
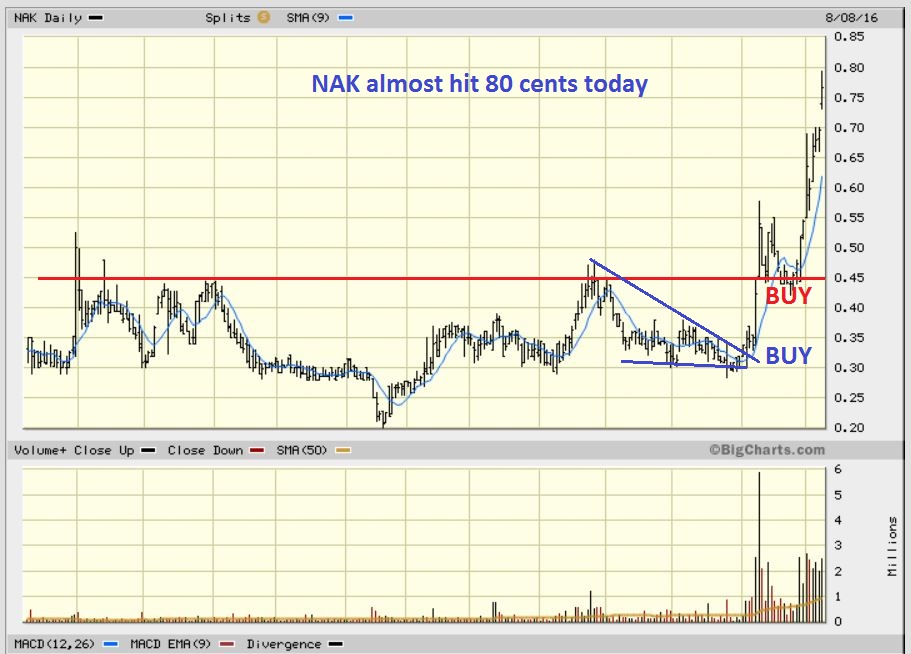
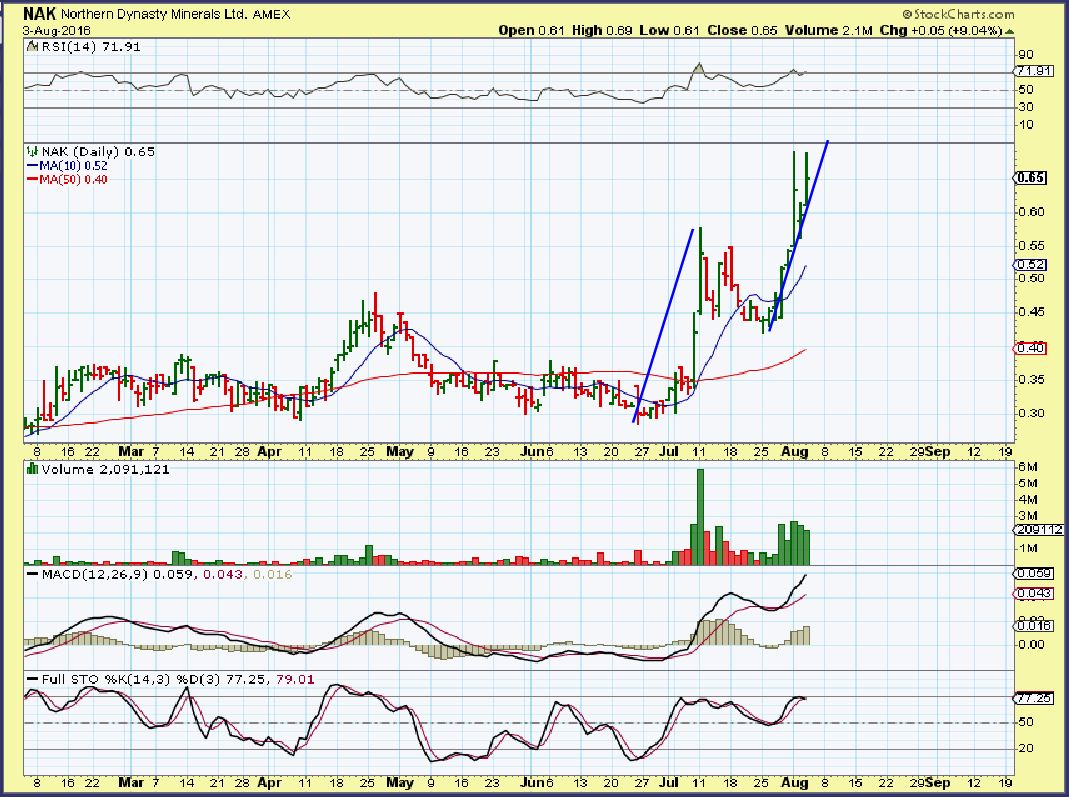
NAK 1 – At 65 cents, the expected a-b=c-d could’ve been finishing, but also they do have a tendency to extend.
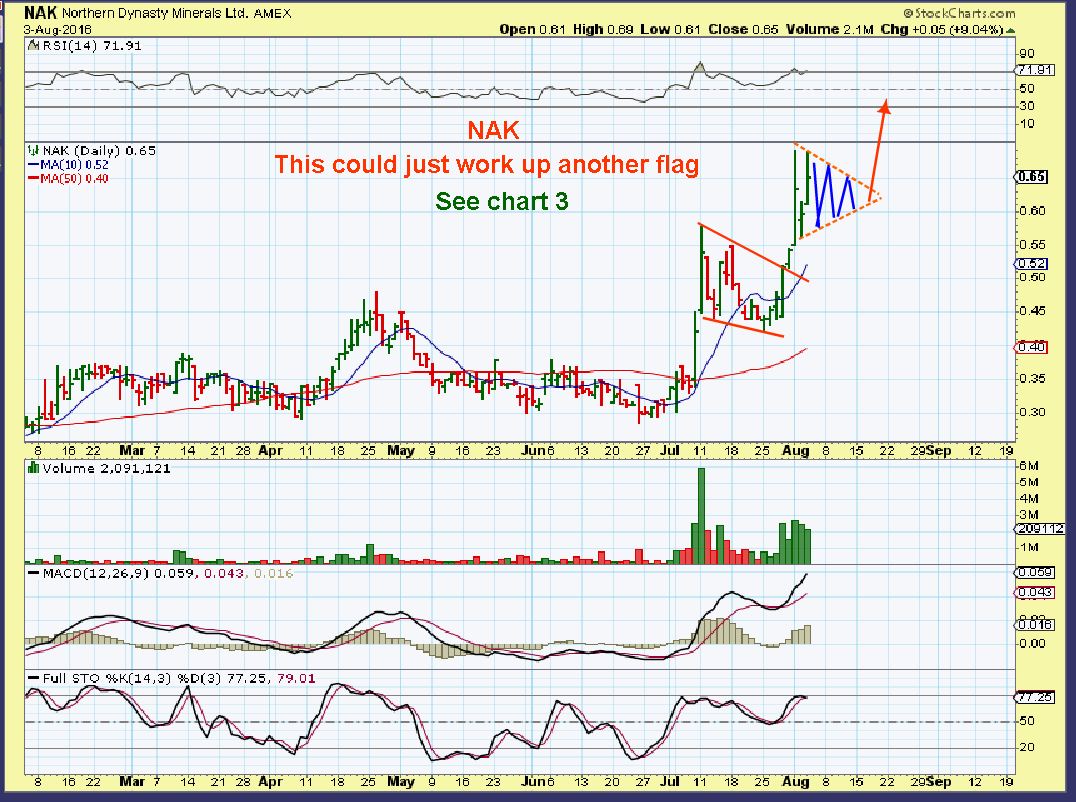
NAK 2 – I wanted to point out that it might just bull flag and consolidate, so I was not going to sell it. TRX did this at $0.90 – $1.00 and then ran to $1.44, so I held on.
NAK #3 – I wanted to point out that NAK WKLY remains quite bullish. It shows NAK working through resistance, so it could get volatile and that is also why I thought that we may see a bull flag.
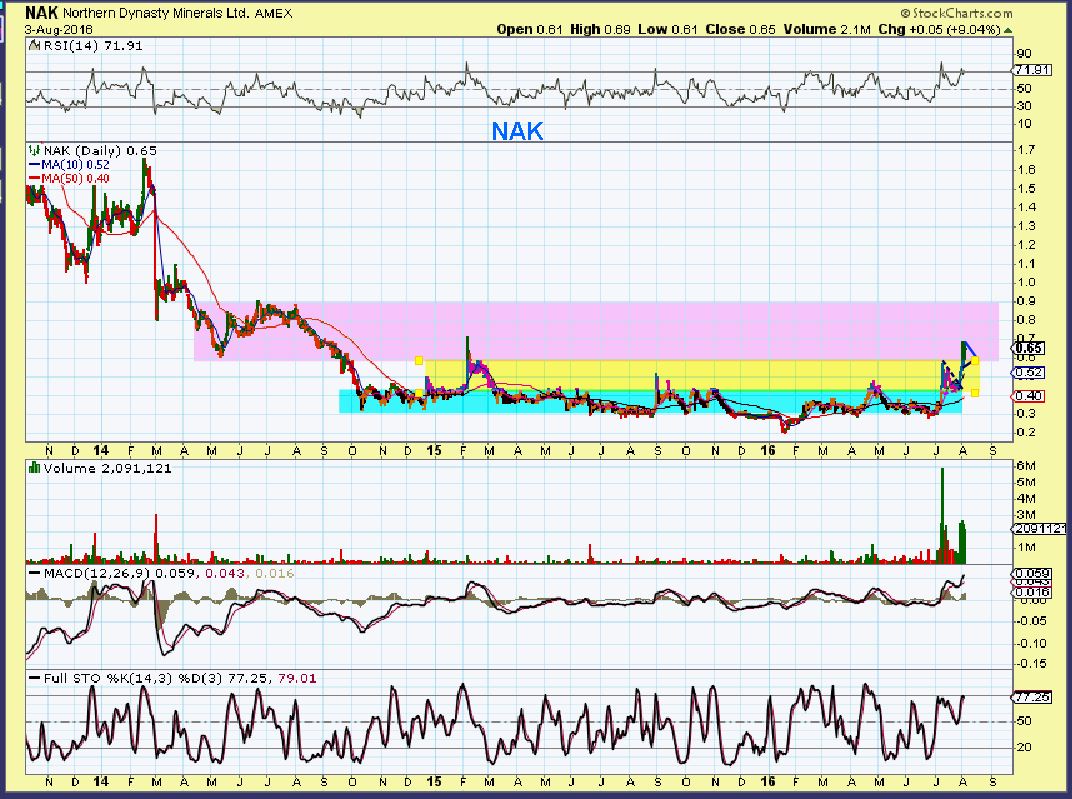
NAK #4 – So after today, we seem to have moved into the yellow resistance area, but re-read what I wrote in the first chart after todays stretch to almost 80 cents. The gap below Monday could get filled.
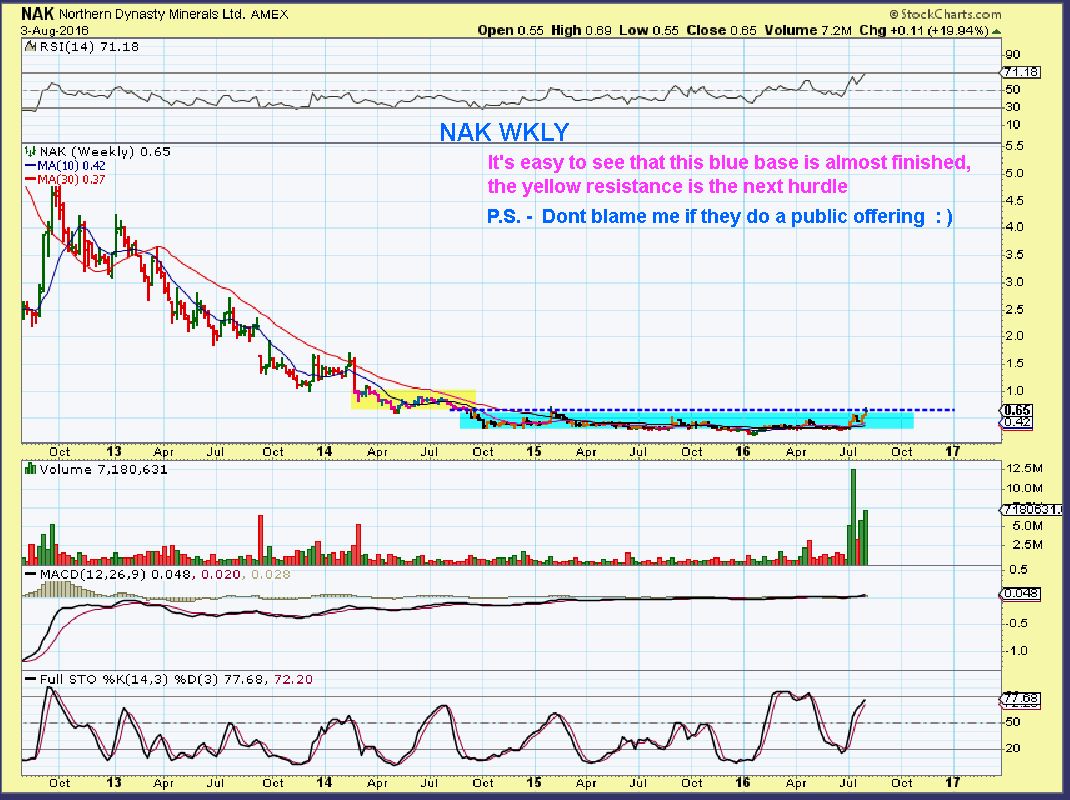
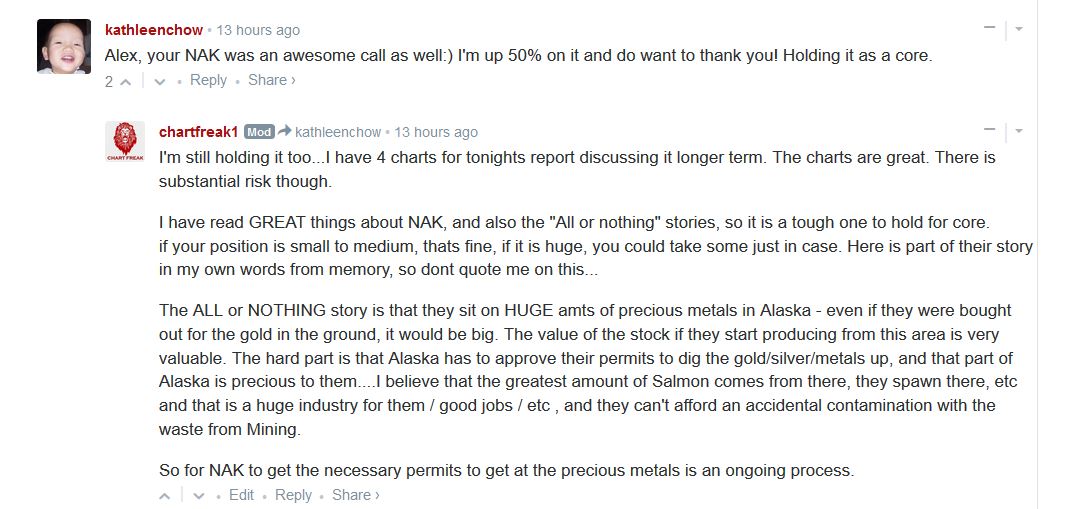
So the story of NAK is almost an ‘all or nothing’ story. The potential is big, their property and what it holds for precious metals is of the outstanding sort, but there is risk that they will not get permits to mine their property yet.
.
I wrote this in the comments Monday morning. Click to enlarge.


hi alex with your midnight oil.
You had a great chart on weekend report about your observation that we’re in a third DC. I remember when you called the second. Thanks.. That was a reminder…
If you look back to your perceptive historical homework of 2000’s bull you’ll notice that IC’s were longer, usually right translated, with common 4 DC’s embedded. This is striking diference to IC’s in the bear. where DC’s may have been a bit longer, but with usually only 3 in an IC.
The explorers are certainly not afraid of this consolidating POG. And the producers are Flush after having trimmed way back for sub $1000 POG.
Thanks for all.
Hey Beek, Burning the midnight il indeed. I tried to release that report around 1 am. my time, because I had a few things to do early this morning and today.
And yes, I have observed the differences in Bull and Bear markets too. I remember mentioning it in the past when discussing the move out of the 2008 lows. ICLs are difficult to even see coming out of those lows. Consolidations hold up better at times, but in the bear mkt, they collapse pretty hard into the DCL & ICL
Thx
Ok so much better explained…thanks.. Let this 3rd and 4th DC grow into another well deserved and remarkable IC. 🙂 Da bull can thus be more forgiving with longer term (cycle) opportunity.
Well, they already did the public offering, right? I’ve a medium sized position as I took some off the table today, so I’m ok with buying it back if/when it pulls back or bull-flags.
May 26, 2016
Northern Dynasty Announces Offerings of up to $15.0 Million
May 26, 2016, Vancouver, BC – Northern Dynasty Minerals Ltd. (TSX: NDM; NYSE MKT: NAK) (“Northern Dynasty” or the “Company”) announces that it has filed prospectus supplements dated May 26, 2016 with the securities commissions in British Columbia, Alberta and Ontario, and in the United States with the U.S. Securities and Exchange Commission (the “SEC”) in connection with an offering of units (each, a “Unit”) of the Company (the “Offering”). The Canadian prospectus supplement has been filed pursuant to the Company’s base shelf prospectus dated March 7, 2016. The U.S. prospectus supplement has been filed pursuant to the Company’s U.S. base shelf prospectus filed pursuant to its registration statement on Form F-3, which was declared effective by the SEC on March 30, 2016.
The Offering will be conducted by Global Securities Corporation (the “Lead Agent”) and Industrial Alliance Securities Inc. (together with the Lead Agent, the “Agents”) and will consist of 31,111,111 Units at a price of $0.45 per Unit (the “Issue Price”), with each Unit consisting of one common share (a “Share”) and one common share purchase warrant (a “Warrant”). Each Warrant will be exercisable into one common share (a “Warrant Share”) at an exercise price of $0.65 per Warrant Share for a period of five (5) years from the closing of the Offering (the “Closing”), which is expected to be on or about June 10, 2016. The Agents will market the Offering on a commercially reasonable efforts basis (i) publicly in the provinces of British Columbia, Alberta and Ontario; and (ii) in the United States only to “Qualified Institutional Buyers” (as defined in Rule 144A of the U.S. Securities Act of 1933, as amended).
2 comments: SXE that you mentioned last week has been lagging but started to move yesterday afternoon. Might be a good one to watch for follow through. Shippers: I have a position in DHT and added SB after reviewing your analysis. Appreciate your future thoughts on this sector. Some very long bases in the shippers.
Yes, I was watching for SXE to break & close above the 10 & 20 sma on the daily as a good step in the right direction.
The weekly on DHT looks promising, but it may take a little time
UsSteel(X) public offering……
OPEC calls for an unscheduled meeting
http://money.cnn.com/2016/08/08/investing/opec-special-meeting-oil-prices/index.html
I had heard earlier in the weekend that OPEC was possibly discussing reducing oil output. Just before the winter, I would think that that would boost Oil prices (Which our charts have already pointed out).
Was reading about that last night, CNBC attributed yesterday’s rally to that.
SB has reported already on July 28 and did a senior debt issue on Aug 3 – so that is behind us
ooo is 3 of 3 finally starting today in GDX?
would appear that Avi Gilburt, off of 321gold has exactly that reading (but wont post chart here!)
really? :o) awesome… tx
What’s the larger count? Is that 3 of 3 before (1) of 4, all part of Primary I? Yeah, was hoping we’d poke to 1 more new high but am starting to think about when to scale back. I’m fairly heavy still in miners, but not leveraged.
here check the entry yourself at 321.
under the heading…
08/04/2016 Another Potential Third Wave Set Up In The Making Avi Gilburt
you have to go to the ”—> lots more here click” to find it
Thanks, I love Avi’s work but don’t necessarily follow constantly.
so I just looked that up, that’s an older report from Aug 4th , so it isnt exactly what he thinks, right?
Maria is saying 3 of 3 starting today…. that report shows July starting 3, and that matches my dcl call at the end of July, if I’m reading it correctly.
bit lost in those charts tbh.
the low in july.. would that not be big 2, then up to 1of3 from there…then down to 2of3 a couple of days ago.. and now we are on 3of3??
edit ,, scrub that.. i’ll look again. big 2 was in june
edit2 ,, yes you are correct… 1of3of3 started at july low.. presumably this would now be 3of3of3 then?
Oh yes – That is what I meant too . That 3 started in July I was missing the 3 of 3 part
fyi… i ALSO can count it this way…. can this be correct?
Chris? KennyGreenEyes? anyone else feel free to chime in… I’m just a novice…;)
https://www.tradingview.com/x/DPMFjsZb/
well unless we start seeing some serious momentum surge with a 3of3 soon, i’d say that interpretation is as good as, if not better than the Avi one
lets go now… give it a pushhhh .. 😉
Why do you say finally starting today, it would have been at the dcl in July, right?
like this…. just a GUESS.. i quickly drew in for you…
https://www.tradingview.com/x/vBDFCw6g/
yeah thats the one!
I missed your 3 of 3 part, SOG just brought it to my attention.
I just got back and was skimming all of the comments quickly trying to get caught up. I was thinking you were saying 3 started today. It starts with a dcl. You can ignore my comment below this one 🙂
think we were each half right 🙂
it reads (i think)..
1of3 started at may low
3of3 started at july low
3of3of3 started a couple of days ago
LOL 3 of 3 of 3
I call that Ignore the wiggles : )
M has labelled ’em in orange…
1 (of3of3)
2 (of3of3)
they are week-long waves.. not that wiggly!
Perspective. GDX 1 ( of 3 0f 3) to GDX 2 ( of 3 of 3) was about a tad over 1 point, right?
Roughly GDX $31.50 to GDX $30.20 . The back test of a break out.
Everything from the DCL to the peak is mostly wiggles for traders here.
In a Bull market you can say that everything from the ICL to the Intermediate Cycle peak is just wiggles if you catch the lows and ride them too, because people tend to over trade when they get nervous and lose their positions on upward surprise.
If my readers email me and want to know why GDX has dropped a point & 1/2 – should they sell, is this bad? I just tell them that it is just wiggles within a daily cycle. Do not over trade or you will lose your positions. 🙂 GDX could gap open a point the next day.
To a day trader, yeah, that 1 or 2 points in GDX may have been something, but here, most ignore that drop.
yeah fair enough.. for TRADING…
but Alex, man.. we’re talking ELLIOTT WAVE charts here.. lol
And day traders for sure! 😉
What I know is I am seeing higher highs And higher lows!!
thats so boring Ken.. when you could be spending your time looking out for 1of3of3of3
LOL !!!!
Or on the lake ignoring the wiggles with confidence : )
Ohh mannnn really cf? As if i dont yearn to be out there enuff!
Soo.. im just going to have to improvise….. 😉
Alot of truth in that statement. LOL 🙂
orrr.. better yet … on the lake wiggl … oh nevermind.. 😉
Initial poor reaction to RIC earnings late yesterday may have created a buying opportunity!! Up 60 cents from morning low and has room to go back to 52-week high. Pretty extended for a core, but maybe a 2-3 week trade.
So any ideas why oil is up and many oil companies are down? Just wondering if anyone has any thoughts….
Alex is LPI on your hot list?
Yes, I believe I mentioned it in the comments a few times.
It has tripled and didnt pull back 50%. I like it. Earnings were released already too
Thanks, I thought so – was just a little lazy to scroll back through the reports.
I also did a 139 mill offering in July – so that is out of our way too
I dont know if I did a chart, but you can see it breaking out of the recent downtrend, I like that and all the other things that we just mentioned : )
LPI hasn’t shot up as much as some of the others so good choice here for not chasing.
VIX at 11.17 just a heads up or should I say heads down. 😉
Any thoughts on if it would take oil stocks down with a change in character?
I do NOT see the chart correlation between OIL and the SPX. I think that is what you are asking?
I am trading Oil on its own chart basis……OPEC is the wild card though.
I will say this: CB”s Need Inflation what better way to get it than with Crude increasing in value?
Yes, I heard that on Bloomberg earlier and thought that that is probably a ‘tell’
Check out PLGTF on a 3 yr weekly. Anyone see that as pretty?
It looks like it wants to break out today or soon, but also pushing against resistance.
i know I asked you this question before – PLGTF does not come up on my chart service. Is this Pilotgold?
It is Pilot Gold.
Try it here
http://stockcharts.com/h-sc/ui
Or try this : )
Refresh
.
An observation
Looks good to me ROB
I see it! We aren’t really pumping higher here anymore though, actual gold has really lost momentum at this point. Individual miners doing there thing (I posted 3 with new highs earlier). So don’t really see options as much of a, we’ll, option here and staying really light any potential 3x ‘ers.
Good drill results for GSV, resulting in a large gap, now up 28%!
SAND, BTE, EXK all new 52 week highs.
SA and good Ole MUXie lagging a bit this week!
AXU & EXK, I own both
Read the transcript of Q2 conference call…I really like Mc Ewen’s leadership and goals. Smart guy and loves the biz he is in.
Same, MUX a long email hold candidate for me.
long email hold?
wassat then?
Sheesh. That was weird even for auto-correct. I don’t know what I’d do without you guys to fix my grammar for me!
.. jus trollin’ ya Cas 🙂
lol… email hold?.I got the idea anyway!
Hi Alex-
Nat gas looks like a big fail now, huh?
It’s visited this same support level 5 times since June 20. Hopefully it finds support here again.
It bounced so promisingly two weeks ago : (
hi Ann ( cute puppy )
It’s not really a big fail in my eyes, but it is getting late in the timing to just keep trucking higher.
I attached a chart of it POSSIBLY dropping into its next ICL. That would be a backtest of the 200sma. This is JUST A GUESS at this point, but the timing is getting long, since it bottomed in March and we are now in August.
.
‘Refresh to see the chart
.
If the recent lows around $2.50 hold, it still may try to run higher another time.
.
Or …they shook out riders at the 50sma in May , they may be doing it one more time here today.
It finally shook me out : )
Great question, I had the same one. I was hoping late Jul was a potential ICL but clearly not as we keep pulling back. Especially since we actually had a gas withdrawal last week on the national has numbers, which is crazy rare for summer.
Alex,
You’ve got mail 🙂
Got it, thx
what do you think of xop? can it get to 36.50? looks like oil bottomed thanks
I’m leaving for the day – Have a good day all.
GSV great new extension of discoveries…I think GSV goes much higher over time!
So I can get up to speed on the a-b-c’s and 1-2-3’s I am reading the Frost Prechter Elliot Wave book. I find it is a really helpful fix for my insomnia. Is this the best book for the purpose or are there others?
For folks that own BAA and were wondering about earnings release (copy/pasted):
Wall Street awaits Banro Corporation (USA) (NYSEMKT:BAA) to release
earnings on August, 10. The stock decreased 0.76% or $0.003 on August 8,
hitting $0.39. About 520,665 shares traded hands. Banro Corporation
(USA) (NYSEMKT:BAA) has risen 85.71% since January 4, 2016 and is
uptrending.
Most likely started a wave 2 correction in OIL today so i hope ya know what to do at the bottom of this wave 2…..assuming you believe that early Aug. was an ICL.
where would you see wave 2 ending roughly?
Oh How I wish I knew… 😉 Here is what I will be watching for:
1) Gap Fill
2) 50% Fib level
3) 62% Fib level
4) 4 hour over sold Stoch.
5) A phone call from OPEC….JK 🙂
Stop below USO at 9.23
orrr.. i also can count it this way… ?? (blue impulse … Red – ABC and 1,2 …etc. new wave)
https://www.tradingview.com/x/1ainZhnL/
The ‘B’ might be OK, the Wave 5 down would wreck some of my positions!
More of a Cycle trade for me………………
9.23 USO = ICL.
Ahhh nice.. sumday I’ll join that cycle club & hav sum fun 🙂
*Notice i changed for u…
Meow
Looking good Tonto !!! 😉
Bearish Engulfing Candle Also Today……..
Dislike!! Dislike! Inventories could cause sharp break either way tomorrow!
Exactly Cason….I have already a position but I am hoping to add tomorrow or Thursday.
If Oil breaks down……
On what Ken? If it is USO I don’t think that would qualify as bearish engulfing.
I don’t have IAG. Worth starting a position here? Thoughts? Really worked for SAND but not for Great Dissapointment Silver. 50/50 chance with a reasonably tight stop? Or maybe spend it all on energy?
Alex showed this one last week. Hasn’t broken out yet, 50-day directly below for support. Hope this shows up ok, on mobile.
Cason, you might want to have a look here before you jump into this one – http://www.morningstar.com/stocks/xnys/lpi/quote.html
Barf! Clearly not a long-term hold candidate!!!
Alex, All, are you bullish or bearish on this chart? refresh
API crude builds 2.1M but gas draw is -3.9M. Refineries switching to winter blend shortly (seriously, it’s August) which could bloatake inventories in a few more weeks.
http://www.economiccalendar.com/20
16/08/09/api-weekly-crude-oil-stocks-build-unexpectedly-by-2-1-million-barrels-as-wti-crude-dips/
Is this link supposed to take me to crude oil ?
The full link did not appear to copy correctly as I just tried it. Oops. The link in black text will. It’s a market news/commentary but contains full contents of tonight’s API oil release. Sorry for any confusion.
See you guys tomorrow!! Happy Trading!
OK, Thx