
Not Much Has Changed Here
Monday didn’t bring a whole lot of change since the weekend report, but there are few interesting things to discuss.
.
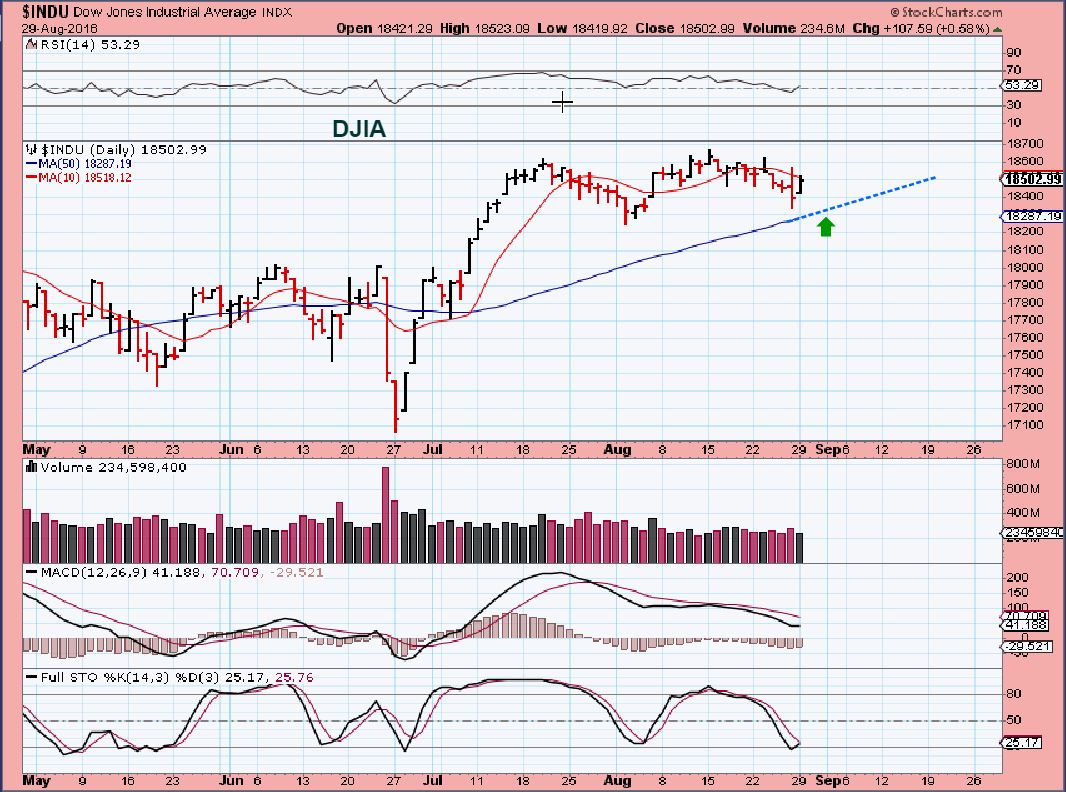
DJIA – The general markets continue the chop, and as they become oversold, the 50sma continues to rise under price as possible support.
I am a little busy this week during the day, so I am releasing this report Monday evening and heading to bed. That means that I do not have time to proof read. Please excuse any typos that you find. Thx. 🙂 There are a couple of trade ideas at the end of the report for active traders.
.
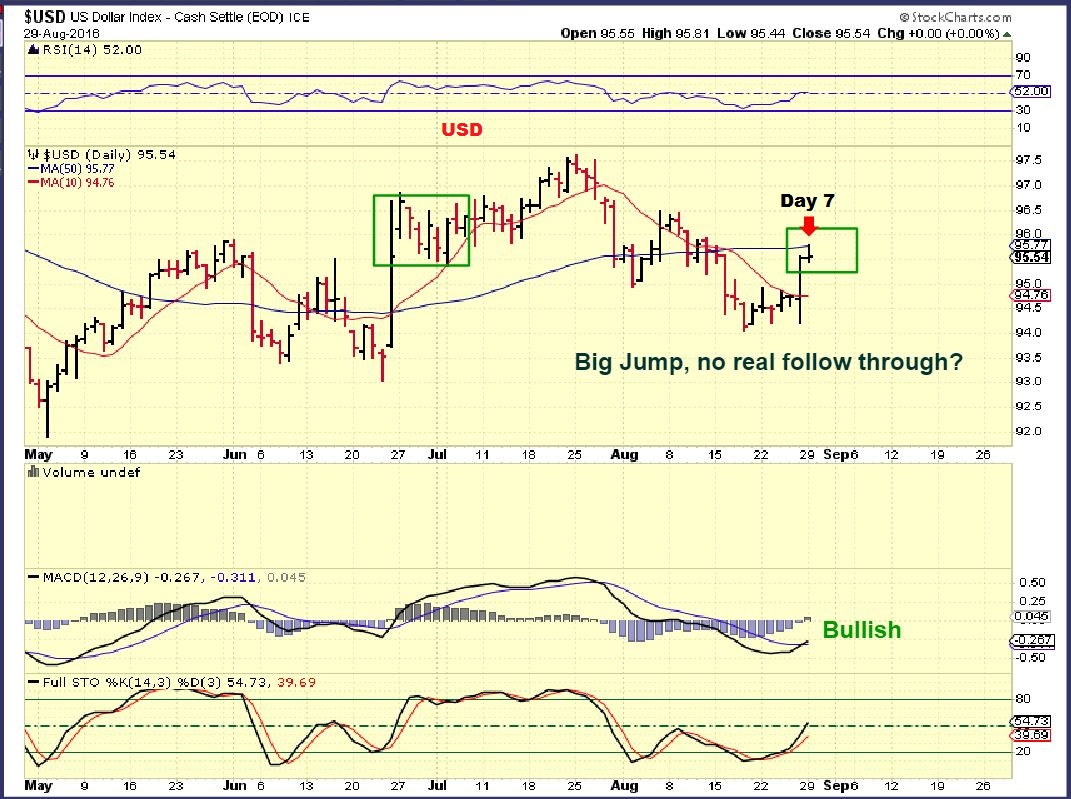
USD – I showed how the BIG POP with Brexit did not have staring follow through. The BOXES represent possible resistance at the 50 & 200sma.
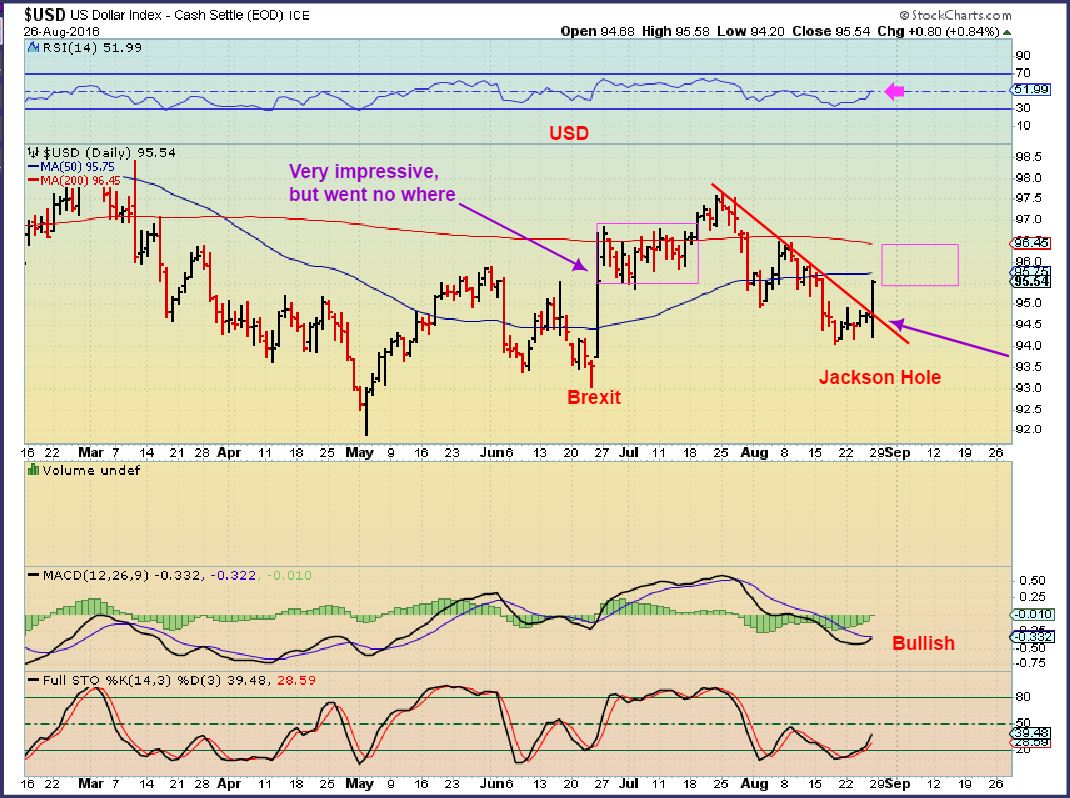
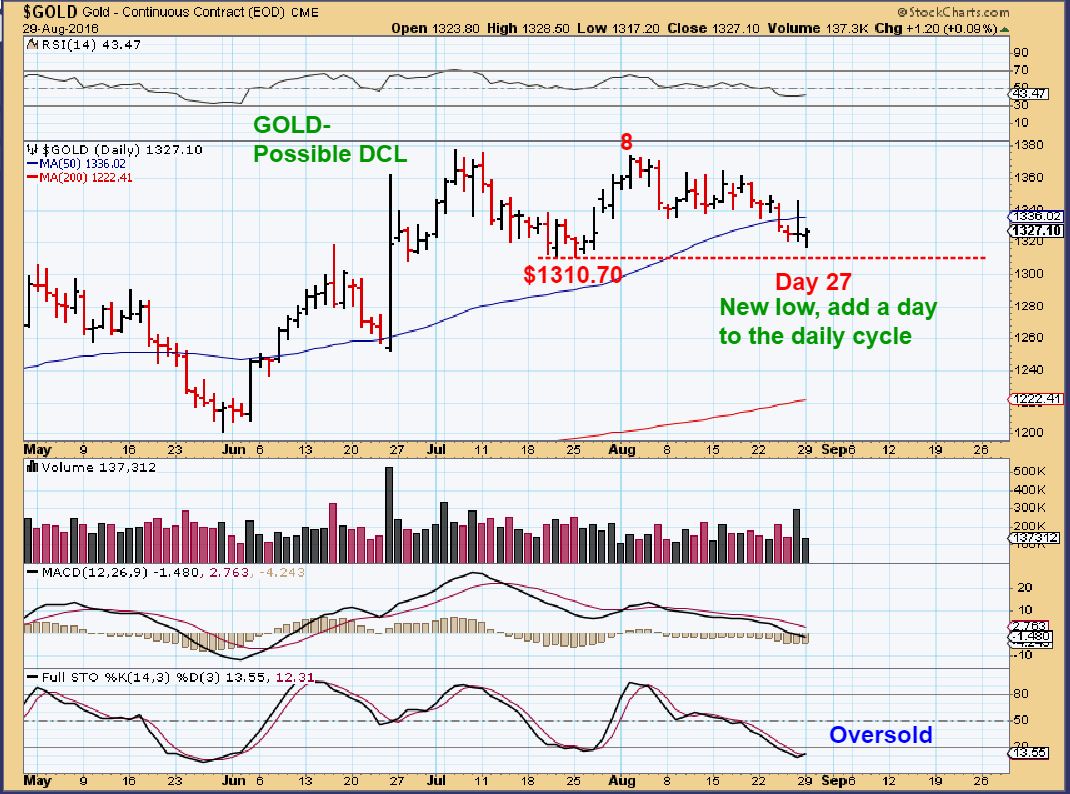
USD – For now, the USD was held back. Gold is due for a DCL.
WTIC – Oil was down over $1.mid day. Some commentators are sweating out Oils dip. It remains bullish to me and a drop to the $5.61 area wouldn’t change anything for me. Oils daily cycles last a LONG time.
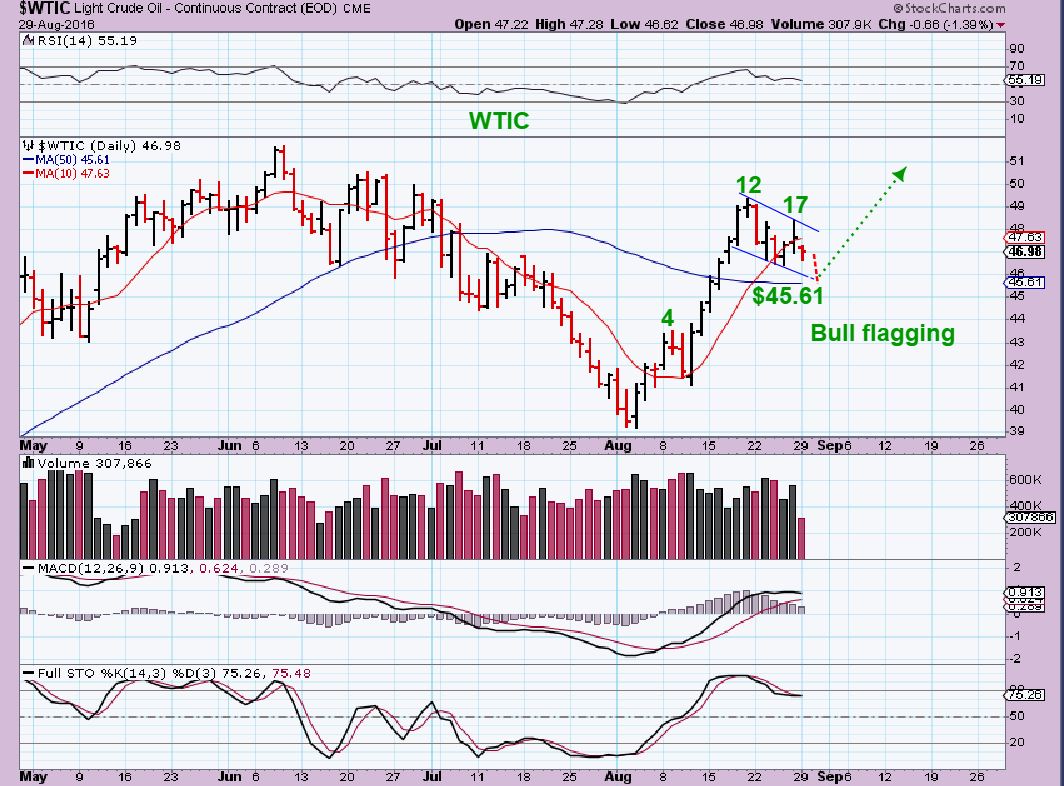
OIL was own, but XLE, OIH, XOP were green. Can this fall to the 50sma? yes, but this might be all we get. This is NOT a big dip….

NATGAS –

.
GOLD – No big sell off below $1310.70 yet. That remains a positive for now. With a new low, we’ve reached day 27. I’d like to see a break above the 50sma and a move above day 8. Time will tell.
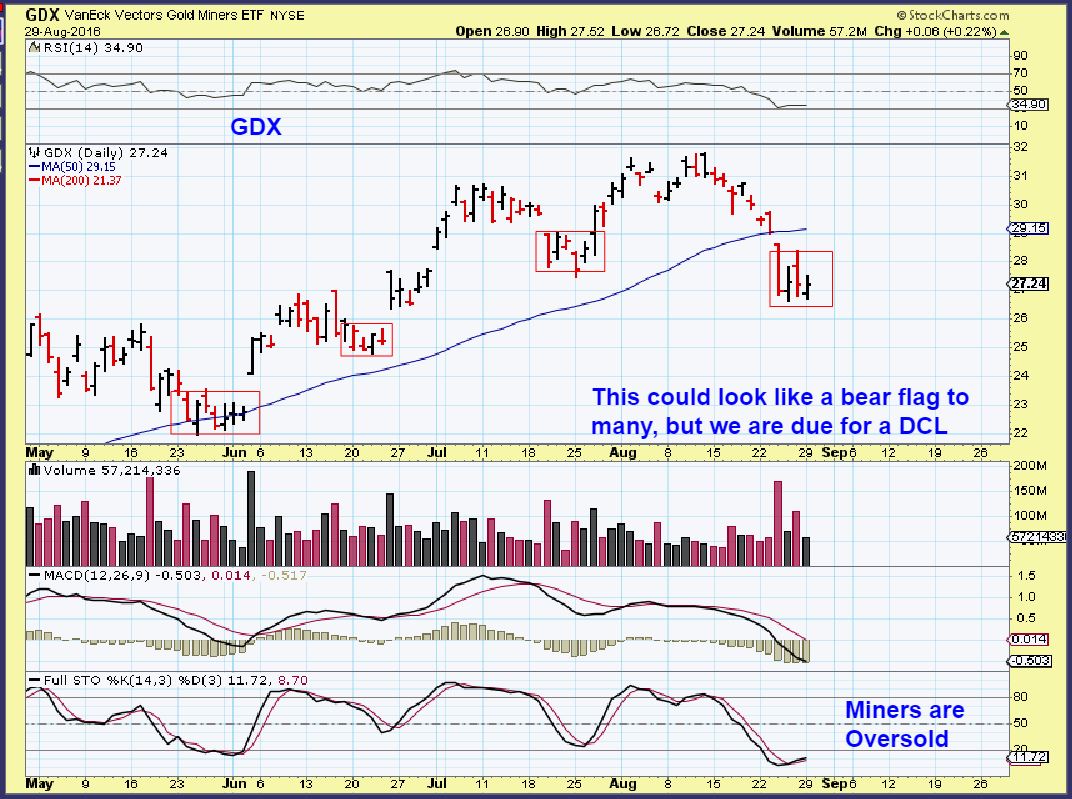
GDX – Day 2? Or day 25? Miners are oversold.
Not much has changed since the weekend report. A few Energy stocks broke out and I am still expecting higher prices in Precious Metals and Miners, but how much of a bounce / run remains to be seen? GOLD has not broken dcl lows, Miners did. Gold trumps Miners in my opinion, so we don’t want to see GOLD below $1310.70. Some Energy stocks are acting so well, that I love the charts ( See RICE, CWEI, ERF, WPX, and others mentioned here. OAS and CHK are holding up above the 50sma. Energy looks good). We’ll see if Tuesday gives us any stronger clue about Gold & Miners in the short term, and will there be any more break outs in Energy. See below. Enjoy!
.
~ALEX
.
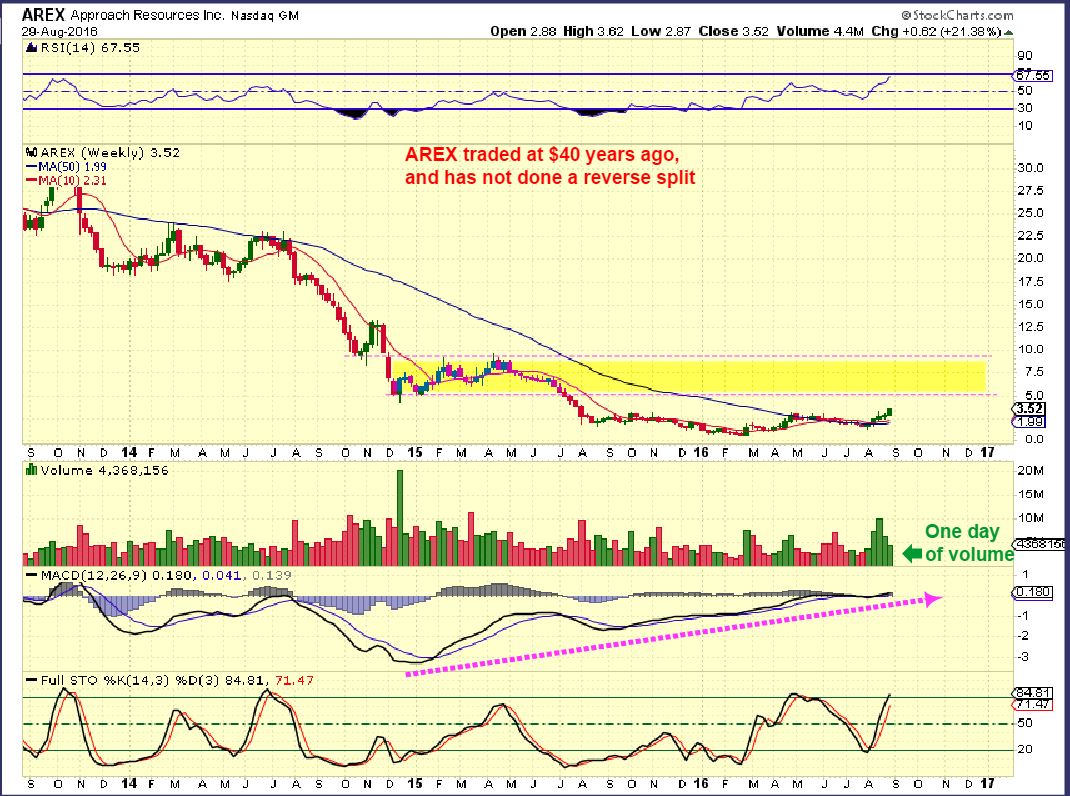
AREX – I liked this break out and began accumulating it. Buy the dip I wrote that in my reports. It dipped to $1.70.
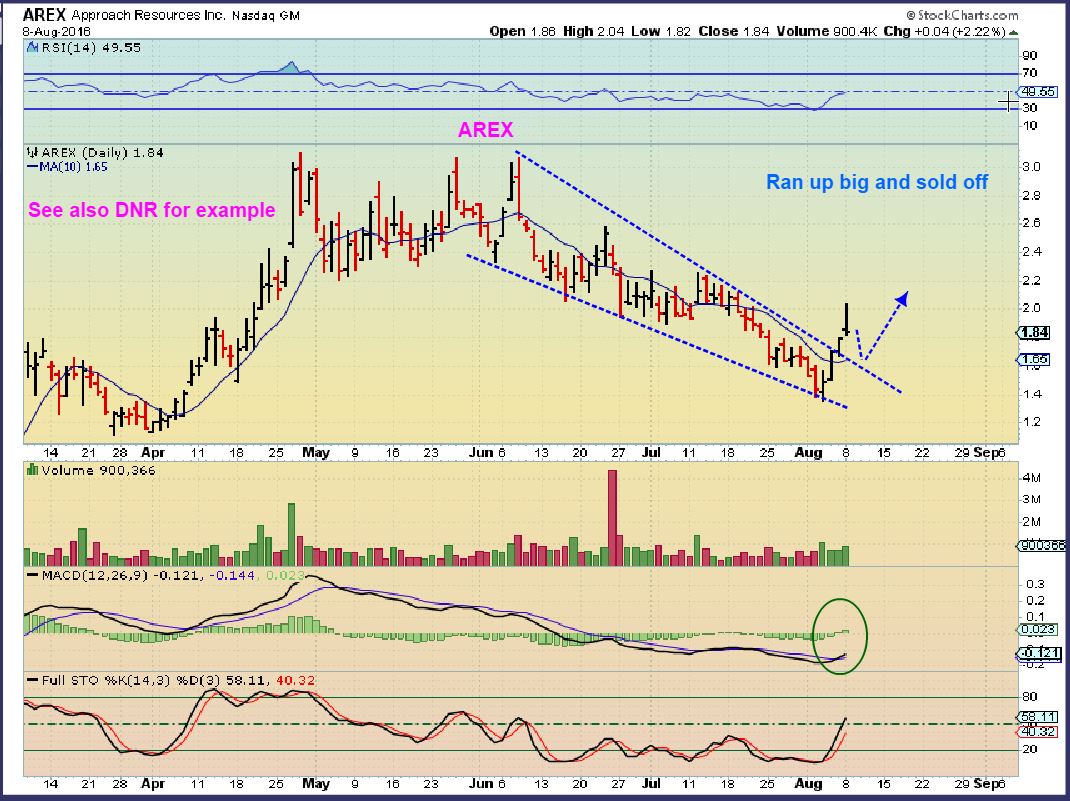
Friday saw AREX up 80% from that dip. I mentioned Friday that I wanted to see MORE VOLUME if it was going to attempt a break out.
Thank You AREX – BOOM! Pops like this can run & run, or drop the next day, so this MIGHT back test the break out. I will show you why I say that it can drop & back test too later in the report. Over time they usually end up higher like we saw with TRX, THM, XRA, etc. in miners.

Anyone taking that trade can lock in 100% gains today, but I am holding a good portion of mine for the rest of this intermediate cycle. IF I was in front of the screen today, I would have added too. Todays volume alone is close to entire weekly volumes from past weeks. Short cover and buying could push this to $5 in my opinion.
SO I recently mentioned what look to be solid charts that hardly pull back with oils pull backs. RICE, REI, CWEI, ERF , ECA, MRO, etc are good looking charts and proper pullbacks. They look to be the buy & hold type and there are more. Right now I am also looking at stocks like AREX, that are good trade set ups and they can become profitable trades in short periods of time. Let me post a few more ideas that I already mentioned and show how they look with Oils pull back. I have a “Gut Feel” and nothing more about these next 3 stocks. They have a look that grab my attention ( Others do too, but these 3 for now).
.
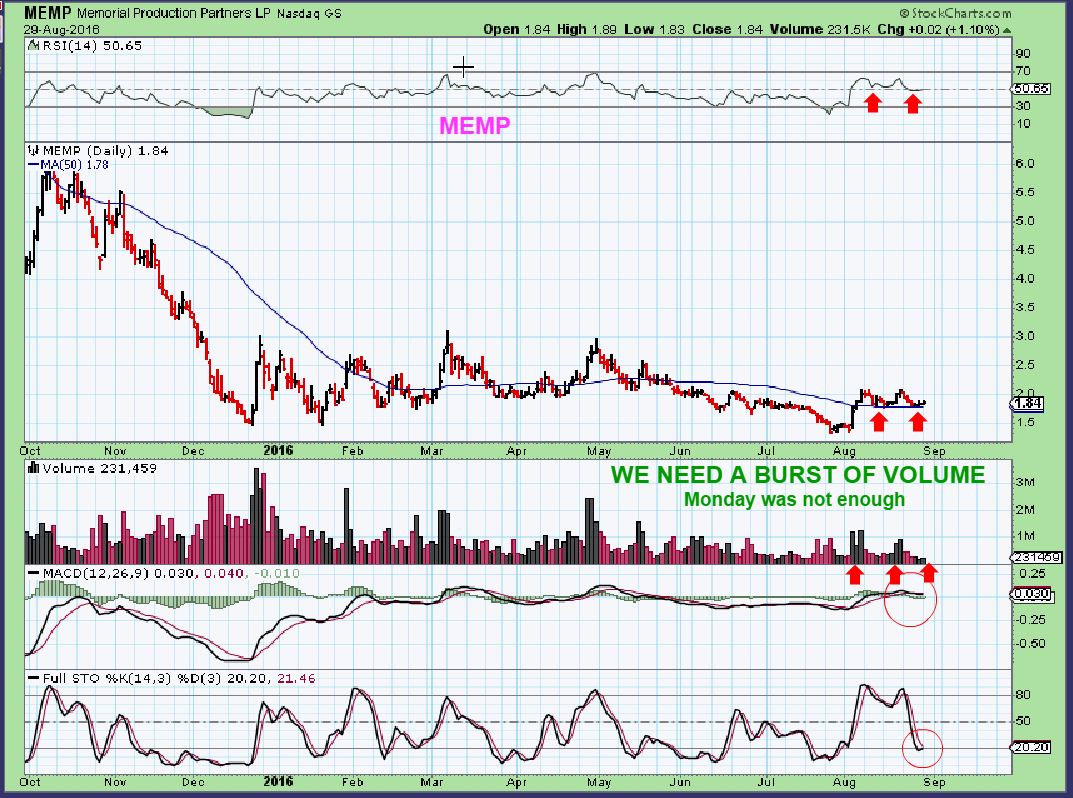
MEMP – This was MEMP s weekly chart that I posted in early AUG, I saw a double bottom with divergence and very oversold. It Popped that week.
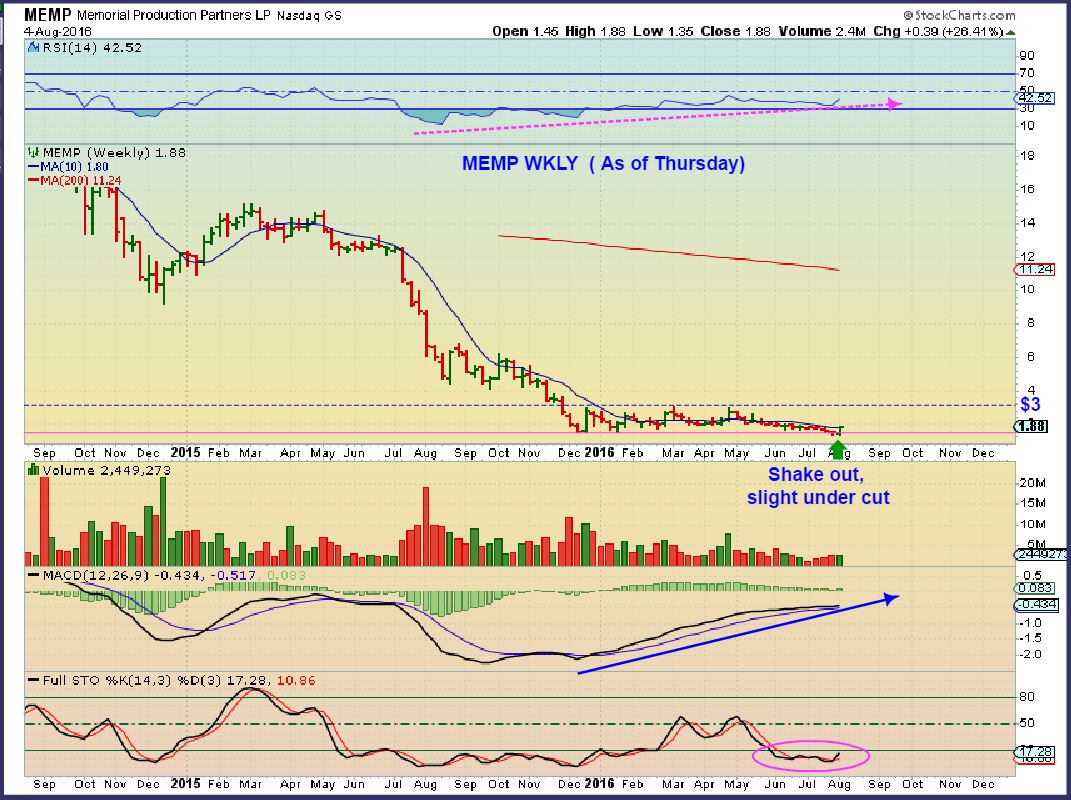
MEMP – MEMP is holding support. It has gone sideways, but this set up (So far) is quite promising if we get some volume from short covering or buyers. This coil can act as a spring. I am keeping an eye on it, it is a “Gut Feel”. It is a low risk buy right here, but MUST be sold if it breaks down.
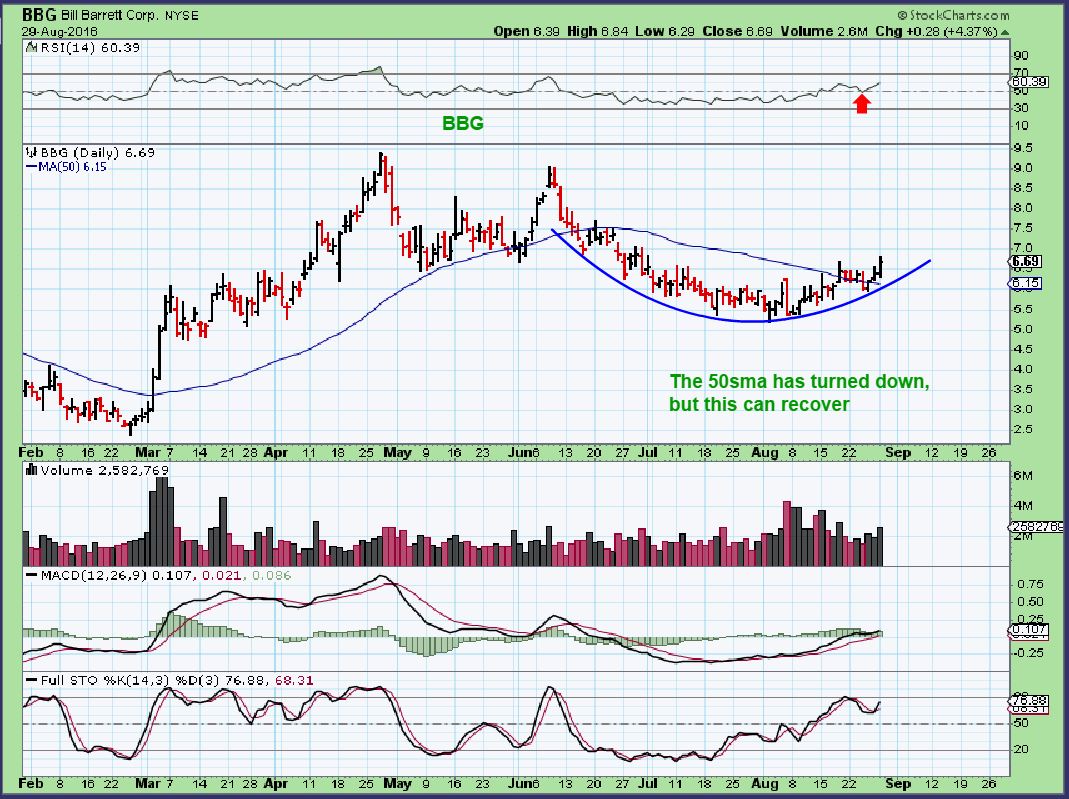
BBG – Last week this was a low risk buy at $6 that I put in a report. Notice that the RED LINE held price down in the rounding bottom, but now acted as support and price took out the 50sma.
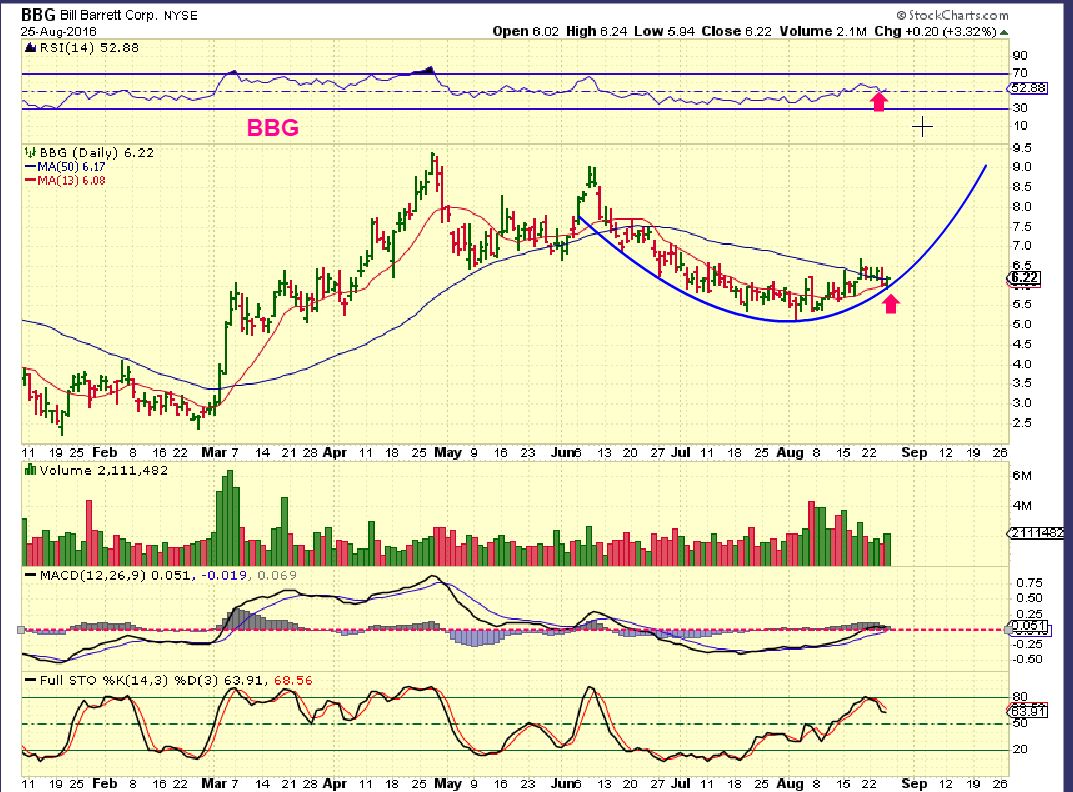
BBG – 2 days later it is following through. It could just run, but even if it dips back down, this would be a low risk entry above the 50sma . I also think that this is a low risk entry, but there could be a little down side to the 50sma. STOP below that.
CPST – I bought this over a week ago and posted this chart of it breaking out in the comments section real time. It also has a bullish pattern.
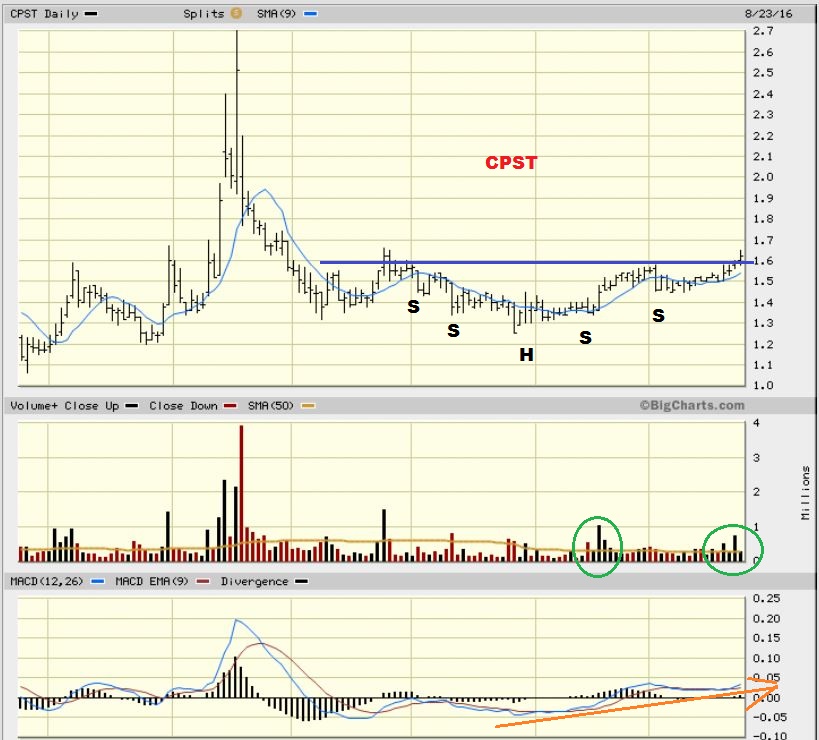
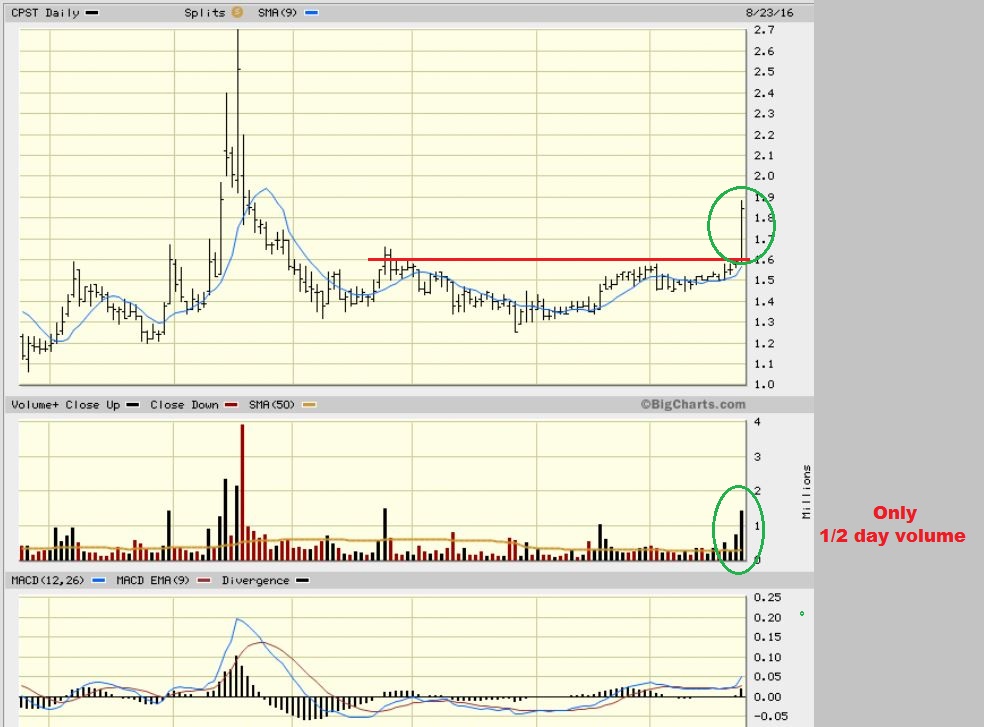
BY Mid day, the volume really swelled up so I held on. It was similar to AREX, so note what happened next…
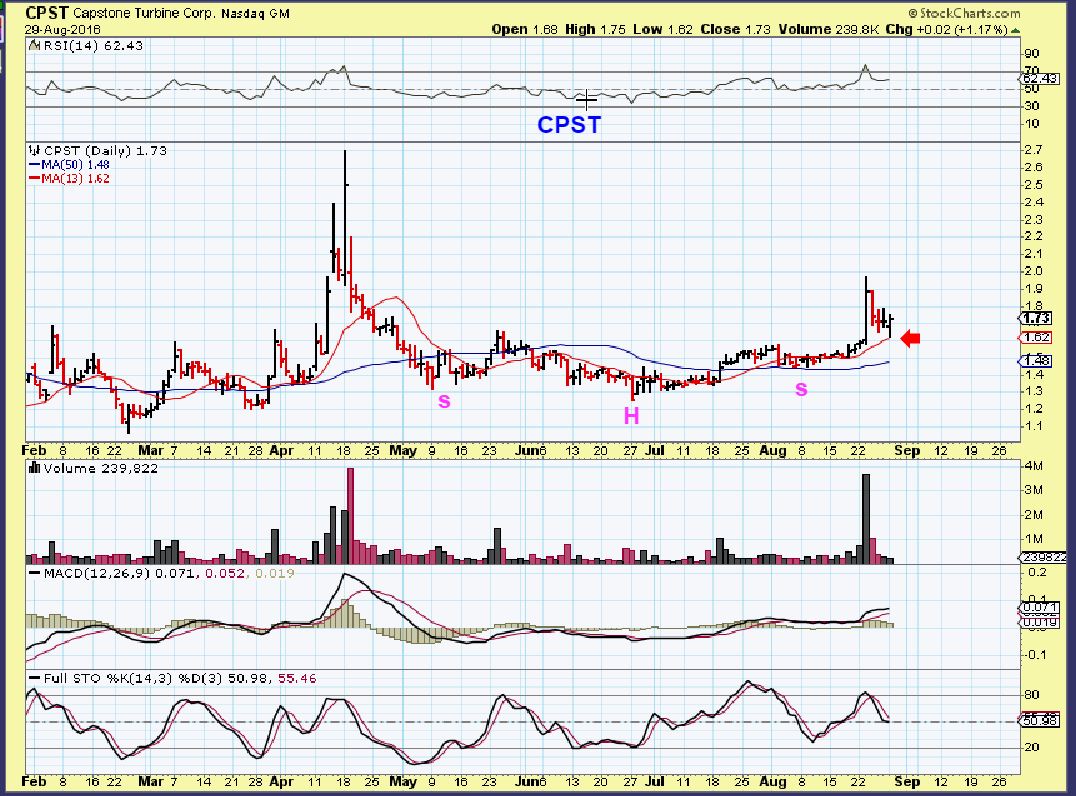
CPST – CPST dropped the next day, but at this point it is still a bullish set up and it tagged the 13 sma and put in a good reversal. This is why I said that AREX may or may not dip down tomorrow. This is another one that I have a ‘GUT FEEL’ in the longer term, if they dont run into problems financially. Since this can drop to the 50sma, it is not as much of a ‘low risk’ entry right here, but if it starts to pop with volume, it may be a good buy for traders to scalp as it takes off.


Thanks Alex! Weekly chart on FELP looks pretty good, eh? I’m gonna buy some! Any new thoughts on OAS and CHK? Or are they part of the “etc.” under the AREX chart? Also, do you just like the AREX chart because it sounds like your name? That’s how to pick good stocks sometimes, though, I know…
FELP looks good, but some days has hardly any trading volume.
No new thoughts on OAS and CHK…. I mentioned them in the last paragraph before adding my name. They haven’t changed since then, still holding up above the 50sma – LOL.
Look up a 4 yr wkly chart of BORT – You should’ve known.
G-Nite!
“BORT does not exist.” Thanks a lot! Now I enter an existential crisis.
OTC
.
refresh
Now we’re talkin.
Alex, I’m already holding ERF as a core. Do you see AREX and CPST as good core holdings as well? Thanks:)
I would look into fundamentals when choosing a core energy position. Some that continue to have high debt and high interest on their debt could eventually suffer a bit more, while others are taking care of debt and paking payments and taking action to reduce debt as time goes on.
I haven’t started a core position purposely for myself. If I own a stock from $4 and it’s at $11, I may not sell it and accidentally it will end up as a core position. Then again, I’ve been told that PACD fundamentals are really good & that that should be a good company to own, but it did a reverse split and is at lows right now, breaking down. I dont use just fundamentals as a #1 guide anyway. Past experience in Miners has shown me the same thing… often the best performers are always not the best fundamentally sound miners.
The charts of CWEI, REI, ERF, ECA, RICE, etc show that they were unaffected by OILs bigger sell off into an ICL, so starting a core a while ago and honoring stops for those positions is reasonable.
In the long run, it is a personal choice for you with your own due diligence.
Please recall that in the report, the 4 listed today I said I have a “Gut Feeling” about their technical look. Not good fundamentals. : – )
LOVE the pic and the title. LOL! Here’s an “original” 😉 https://uploads.disquscdn.com/images/1401d1ea25940f78c1a66016646901d73c16a5689a3870f55f25862373d6781c.jpg
what is going on with IPI?
Solid break from the consolidation with huge volume. I dont see news, but look at POT, MOS, AGU, CGA – Ag stocks
CF any other sector breaking out?
I’m just seeing individual stocks in various sectors
Bloomberg reports AGU POT merger as early as next week
only up 18% – lousy move : )
CCI report rallying the dollar and killing the morning rise in commodities,, see if it’s just a knee her reaction,
There goes last two days low in oil, $46.62 ,I would have expected the strong CCI report to rally the stock market as wellbut not happening,
I’m watching $46.40 area
My target is in the report
Aw, right $45.61! Makes sense. Tag of the lower trend line of the bull flag. I was going for the triple bottom on the hourly……..dipped lower but looks to be consolidating!
I would rather Oil just take off from here, I’m ready, but it is possible to dip lower and I wouldn’t want people to be nervous about adding on a dip to $45.61 – It may end up being the lows for now. : )
I just added on that big dip of AREX. My cost basis is much lower and the weekly chart is really good looking for me.
If I didnt already have a position with a low cost basis, I am not sure if I would buy this break out or not. Maybe if I could keep my eyes on it most of the time.
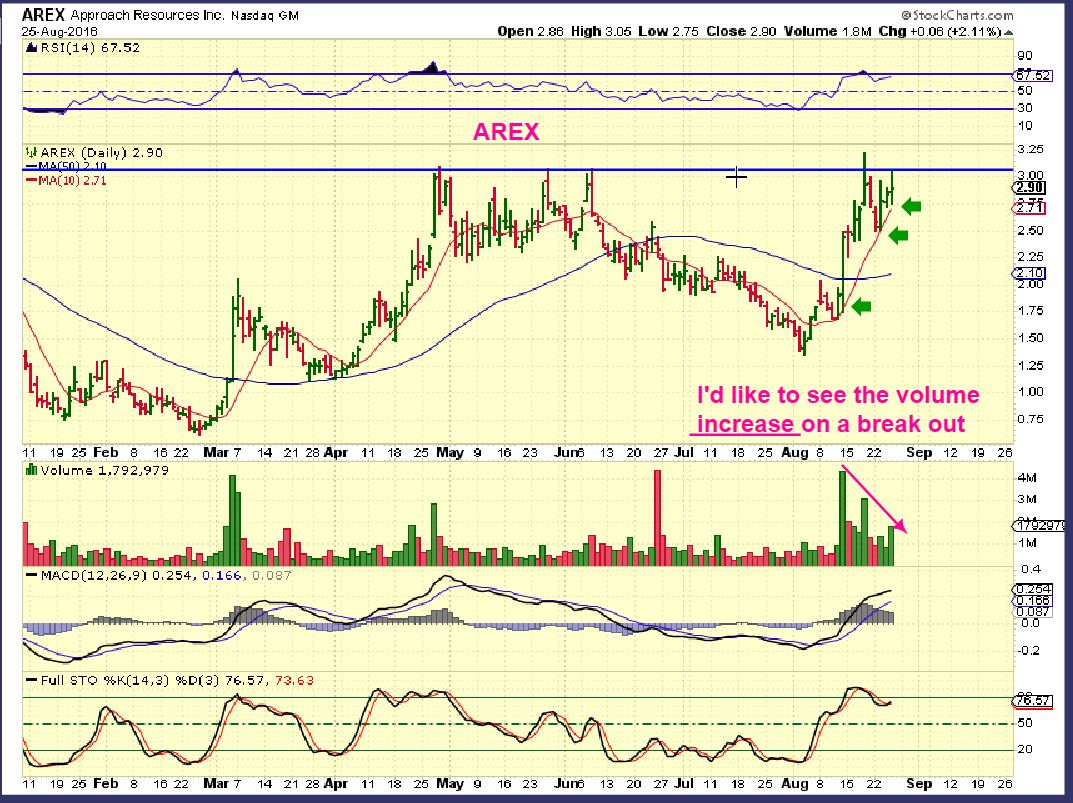
AREX – I do see a 1-2-3-4-5 possibly complete on a 2 month daily. Could pull back to $3 ( 10 sma), but doesn’t have to .
🙂 tx boobie
Ur welcome Ma Wee Yah
Edit: Didn’t see the pic until after I refreshed.
Oh, MY! #HB
I really like the daily chart of TK, and really like the weekly chart too.
BCEI – I see that as a break out and it looks to be dropping in for a back test ( not sure)
PQ interesting too.
refresh- if it keeps dropping, it could be a false break out ( or premature break out)
.
I think BCEI is something of a relief rally on the back of news that it had paid interest on some senior notes. Based on the reaction I’m guessing there may have been an element of doubt about that!! 🙂
Or short cover that faded
Very possible Alex. It would certainly make sense there were shorts in place if there was doubt over the interest payment and now they’re covering!
GOLD- New low today on day 28, but still holding above $1310.70
SO FAR
Will this be an ICL or a DCL when it turns?
Timing wise, it should just be a dcl
What about miners? very deep sell off? ICL?
Alex- how long can/do these cycles last typically before a dcl? from your note, day 28 seems on the long side.
Sorry MM – I missed this question because when I walk away and come back, I cant tell where the newer questions are.
They were running 28- 33 on average for a while there, and even stretching to 34, 35 .
It should be any day now, but it needs to reverse higher and it’s best to wait for a break above the 10sma.
I personally may use the 8 sma this time, because price is dropping away at an accelerated pace.
alex- I must say these mining stocks look awful to me..all I see are bear flags all over.
We are not at a dcl yet, they wont look better until the swing is confirmed in and they start moving higher
Alex
Do you see any divergences…. I want to jump into AG with some leverage any day now.
thx
I see some slight divergences in some Miners, but that’s not enough to risk going leveraged in my opinion.
Believe it or not, I really like what NAK is doing here. Kind of early to be guessing, but Hrly, 30 minute, even daily ( Gap filled and reversal)…it looks kind of good
I hope I can get out of the red, I bought it when you mentioned it almost 2 weeks ago and it has not been kind to me!
Well, it gave those gains up pretty fast : )
Should we be adding to miners here or are targets now lower?
it is best to wait for a confirmed swing low . It wont allow you to catch the bottom, but it takes the pain out of wondering when the did will stop.
Energy is a buy on the dips , in my opinion.
I did buy MEMP from the report, because the low risk set up has support right below it.
I can see GDX retracing down to $24.33. That would be 38.2% of the entire run up since the beginning of the year. 38.2% is a very magnetic FIBO, once a correction starts its almost always hits. Didn’t think it possible a month ago. You are right Alex, we are due for a bottom soon.
“Didn’t think a correction was possible” ? lol
There is always corrections !!!! Very healthy in a new trend…..
The depth of the correction is what you need to focus on…….
Ken, you laugh a lot! Reminds me of a line from Goodfellas. Im focusing on 38.2% and the 200sma.
Your certainly good for a laugh or two Bill……
Your one of my indicators I use to Fade. 🙂
Ouch
I hope your laughing with me? I don’t proof read too much. When I said correction, I meant one giving back so much of the gains since January. Of course I expect the ones we had in May and July. I managed to avoid most of all this pain in miners. Sold NUGT at $178. Got back in at $138 and out at $135. Now in cash waiting for the turn, if when it comes.
GDX… an impulse kenny!
didnt even make it back to the 50sma
possibly the 3rd wave of an A.
now we are in the 5th of the A?
Yes I agree SOG.
am still in TGD.. hopefully catch the top of the B to sell off.
certainly dont want to ride down the C wave
Hell no. .46 was my original entry, was betting I’d get a 2nd chance at the one!
You are paraphrasing, I didn’t actually say “that”!
This was that “blood in the streets” feeling that you were looking at
Take a look at JNUG : )
Yup, I’d say. Looks like the 200sma is the only thing in the way.
And basically cut in half in 2 weeks ( Thats 3x, but still- thats blood in the streets).
damn… so much $ to be made..
*or lost i suppose 😡
You two need to define “blood in the streets” …. not even close imo …. normal and healthy correction.
Maybe Maybe Maybe last December was but not now after this run since Jan ??
But it’s been so tame, that’s why the blood analogy. Back in the winter we couldn’t get a 3% pullback just to get a day entry. Now we’re crashing the lower BB for a week. Mentally, that’s jolting and a change from what we had seen in the bull. He challenge is to pull back and objectively look at the charts. Which you can’t do if your losing money (which is why I got out and now am just waiting).
If this is the DCL drop, what’s the ICL gonna look like? :O
But remember, every $$ down is another one that we can ride back up! It’s almost money time!
Gold:
Wave 2 Correction Almost at TL support. If Gold breaks that support there will most likely be a stop run then a reversal off that stop run low ….. That low will be my “line in the sand” where I will Reduce exposure to the Metals if it breaks. FWIW …….
I cannot believe how close we come to the $1310.70 & still haven’t just dropped down and taken it out.
shh
Plenty of juice !!!! 😉
It may hold at Support but…..if it doesn’t ya gotta have a plan.
I have a feeling it will break that support which will be the “c” wave down in the wave 2 correction……then add.
I see your battery is ready for some fast trading : )
If you look back on a chart and look at the dips into a dcl, they can get steep and they do cause fear and change bullish sentiment. That is what they do, and then the rally unfolds, but trying to catch the falling knife can be painful, even though the rally may get your money back. Day by day by day red starts to bother some people.
We are close though.
I didnt mention ALJ in my report, because it had already popped on Monday, but thats a nice looking chart too.
It sold off and recovered today. I was hoping that AREX would do exactly what ALJ did.
ALEX- I do believe this is prob an ICL at this point..HUI is down 27 percent from peak.. that is not normal DCL in my opin.
You do remember my report discussing choppiness and historically how choppy they were? The dcls look like ICLs.
refresh
If you believe that the first week in June was the last IC then Gold now on Week 13 in the current IC, avg. IC is around 22 weeks. So I agree this current correct is a DC. Alex any thoughts ?
I do, and I look at that chart that I posted above and I see some pretty deeeep drops in just DCL’s. I see some times when price ran up and came almost all the way back down
( look at Jan lows to March lows to April lows, That cant be 3 icls in a row-
then SEPT to NOV 2009, then Nov to Dec )
I see it……although:
This current DC would be the fourth in this current IC so……concerning in any way?
Confusing a bit, but not so concerning. Gold usually drives the move.
hmm.. it would be so much easier on a whiteboard…
Alex.. where, apart from the ICL youve labelled… are the DCLs/ICLs on that chart?
ICL’s back then were pretty steadily coming in every 7 or 7 months. Count 6 from the Oct lows and 7 from there. DCL’s are usually ROUGHLY a month apart, some shallow , some deep. Miners overreact
and that is not a gold chart, it is Miners, so the moves may be a tad exaggerated.
k .. thx
I made a mistake as I think it’s 21 not 27 which is inline with your chart. I just don’t see why we still can’t have an early ICL but either way moving down like this in very short order is making me wonder if we need a washout period and this was a massive bull trap. I am def very concerned about the health of PM market. Energy had a similar rally early last year before a pounding and I wonder if Precious metals gonna follow same script.
That 2009 HUI really makes you rethink the buy n’ hold stuff
It’s hard because the lastime few DCLs all this year have been light. This one is just like old times. Looking at wave discussion above, this would be DCL. Unfortunately I was early and stopped out today
GDX – Nice GAP fill today.
Is it going to fill that lower gap tomorrow, or will that be saved for the ICL?
just from a glance, it appears that the A wave aint done.
wave 5 (of the A) yet to complete?
Did u see laras aug 29 gold count? I just saw it…her main count has gold in primary 3 .. (yay) it is still working on completing intermediate wave 2.. ABC zigzag ..
Do u have a chart or a link? Assume the thought is we are in C of 2 of P3? The top ellioticians I flow thinking we are in C of IV of P1
I was worried about posting the link & breaking chartfreak rules… but i suppose since it is free on YouTube…
https://youtu.be/-W8WCdnW4kU
Chot-freeek gonna’ get ‘cha now!!
Yay!
Lol… he has to catch me first….
You too fast, Momma!
U know it…;-)
Meow
Thx Maria. It’s a chart from another paid site so would not want to post unfort but I will see if I can recreate tomm but either way it supposes the end of pullback soon with a big move to follow.
Ohhh ok.. nevermind. I have that as one count on gdx too.. actually posted it -i think?
Well that’s intense! However was several minutes in before I realized that she was saying “hourly” chart — her accent made it sound like “alley” chart and I thought WTF is she talking about?
Could u show me that chart count please…tx
Wouldn’t that put us at an ICL? Start of a major 3 is an ICL
thats really weird Muhrrhoea…
havent been subscribed for nearly 3 yrs…but then you mention Lara, and the day after, i get 4 emails appearing from her in my inbox.
B-C of Major 2 would line up with CFs DCL then ICL theory. Weak bounce that we sell. We get below 24/25 and would be hard not to start buying like crazy.
f5
Guess what Gold just did ? : – )
Well….it stopped falling…? Not sure if that’s the answer you are looking for….a somewhat non technical one…:)
Broke the 1310.70
Shakeout
Maybe, but it took out that 1310.70 in the process, but it doesnt show up in stockcharts
Shows up in live 24hr chart. Went right back above immediately in AH trading. Hmmm…
ADP # in 2 hours…
pipe dream please….
It broke that 1310.70
Try something
This works Alex.
Geurt,, Unless you have permission from Alex, you should stop posting these reports and charts on other sites please, the paying subs here would appreciate it,
Alex, my I Believe button is all out of juice. I have to play “show me” from now on. Elsewise, keeping the powder I have dry. Stopped out of NUGT – which sucks b/c I should have cashed big last Friday and wasn’t fast enough. Energy continues to slowly fade for me, not adding without confirmation which has we just cannot get right now.
Also, Jobs Friday this week. I won’t be trading gold and miners again this week ahead of it. The last 3 months have essentially been Bullshit made up numbers. I’m not trading a coin flip. If I want those odds, I’ll go to Vegas.