
The Big Drop
Sometimes what looks and feels like a big drop turns out to just be a small dip in the action. I think that we are seeing that in Gold and Miners now. We’ll discuss that after a brief market review.
.
SPX – I’ve been expecting a small dip here, possibly back testing the break out after a measured move finishes. That may or may not happen. A sideways consolidation can also act as pause before continuing higher.
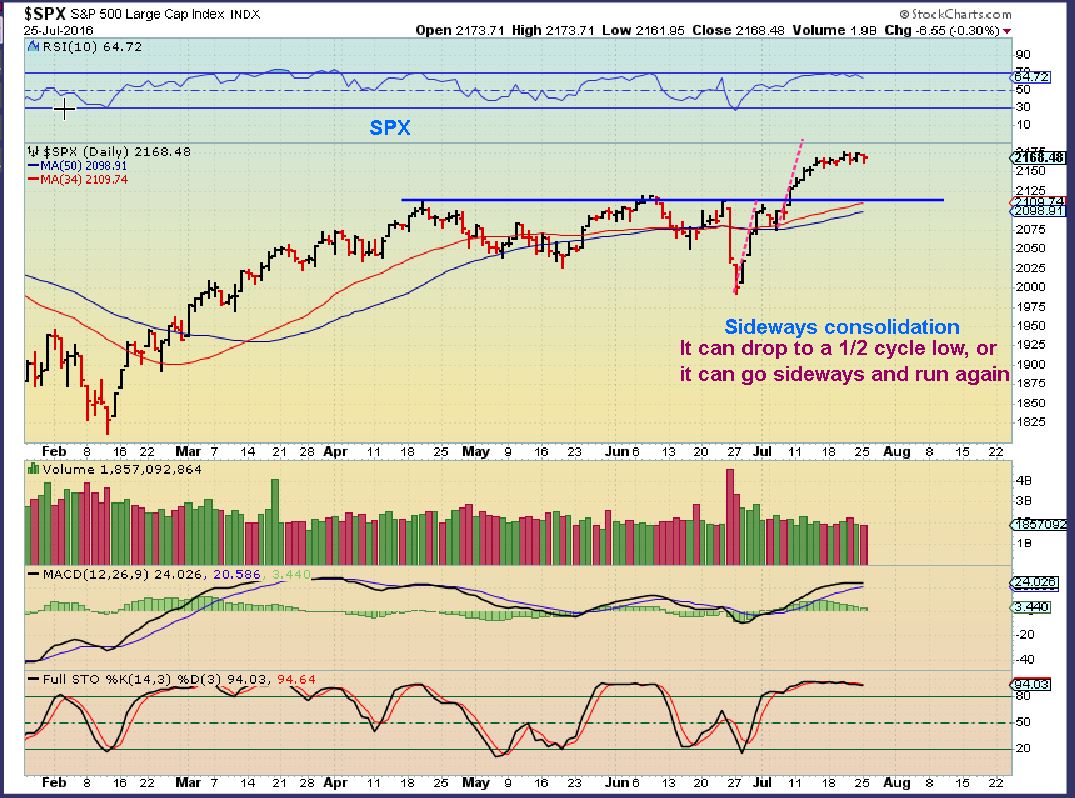
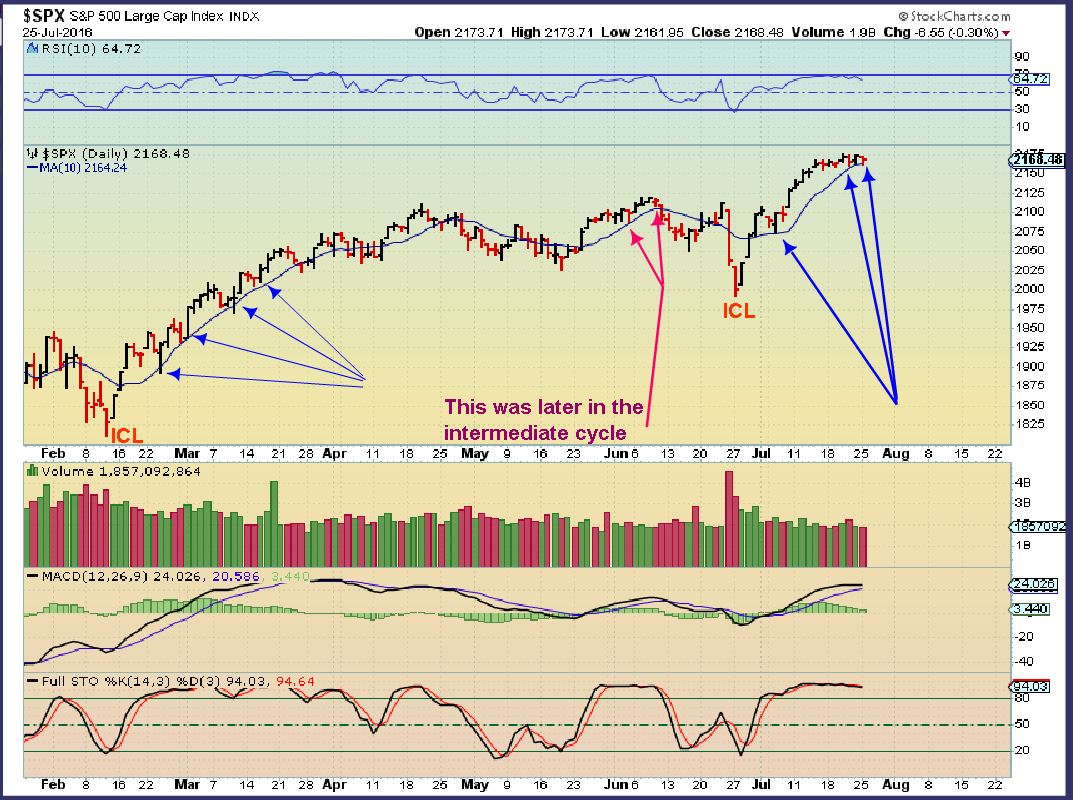
SPX – Holding the 10sma is bullish in a run out of the ICL. Temporarily breaking below it and recovering is fine too, I’m just pointing out the recent strength here.
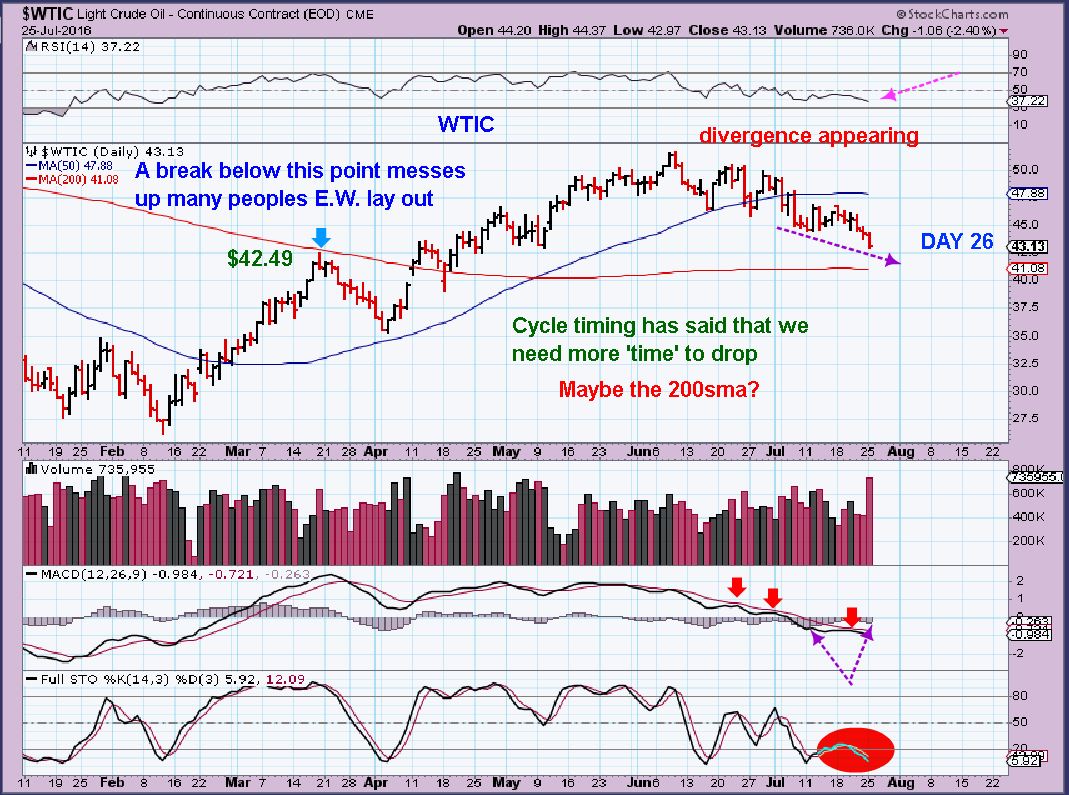
WTIC – Day 26 is closer to the proper timing for a low in Oil, and it looks like it may try to tag the 200sma. Breaking below $42.49 messes with E.W. count. AREN’T WE GLAD THAT WE HAVE BEEN PATIENT even though OIL had a few reversals along the way 2 weeks ago? I now see the beginning of possible divergence and that could point to a low coming up.
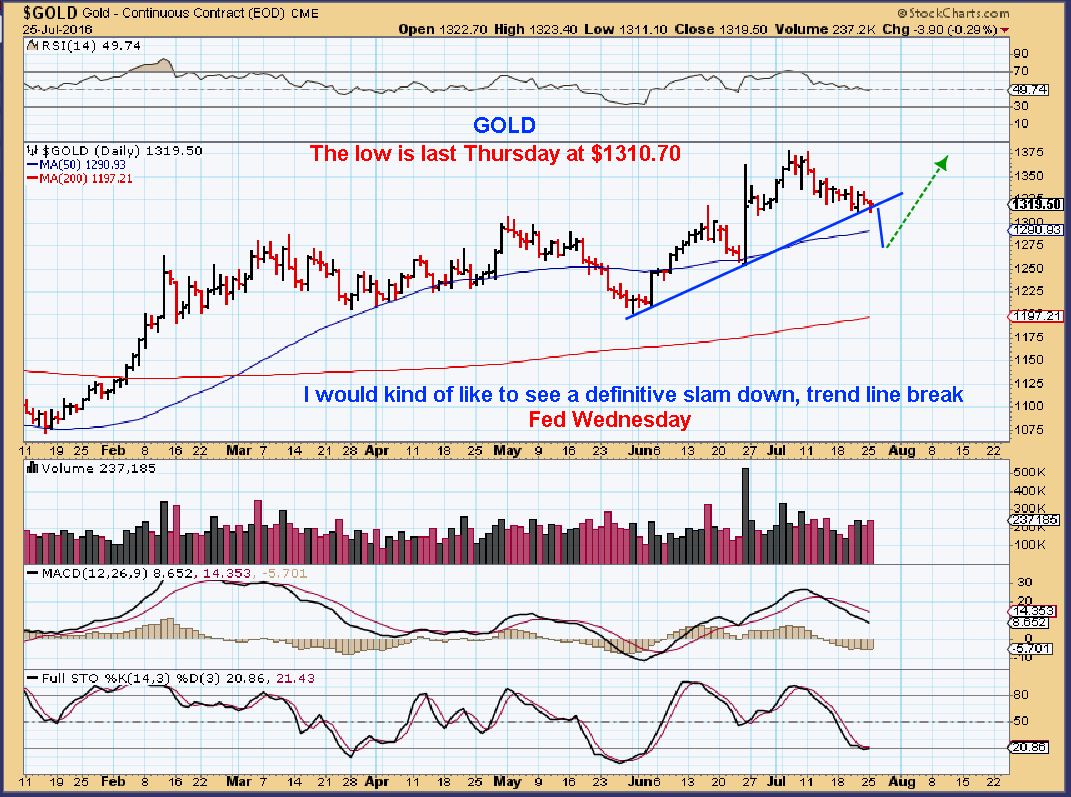
GOLD – We have a Fed Week upon us. I wouldn’t mind a quick slam to shake out weak hands, but it is not necessary. Let this visual prepare you for what may be the worst case scenario, but if ‘EVERYONE’ is waiting to buy after the Fed Mtg, it wouldn’t surprise me if Gold just took off higher, right? We’ll see. The low is last Thursday at this point. If gold took off higher from here, we’d be on day 3 Tuesday.
.
GDX #1 – Read the chart follow the red lines. Just a reminder that a reversal doesn’t always mean the selling is done. Follow through is key. We had a reversal last Thursday, but went lower Monday.
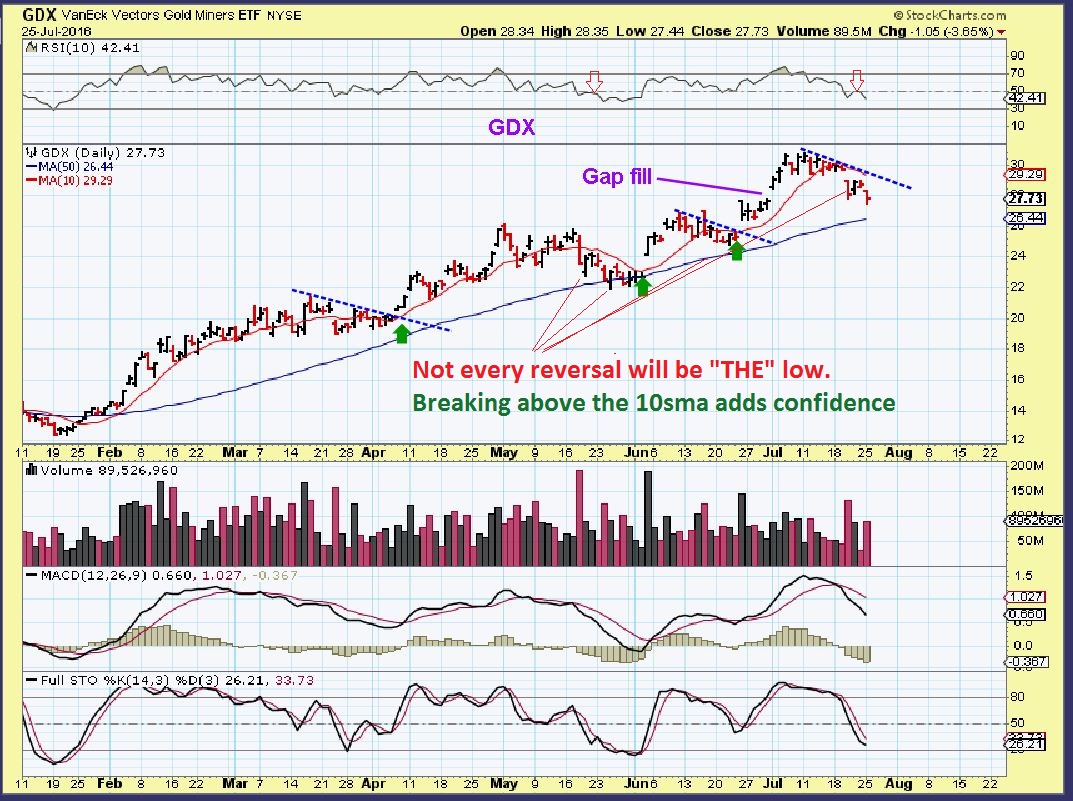
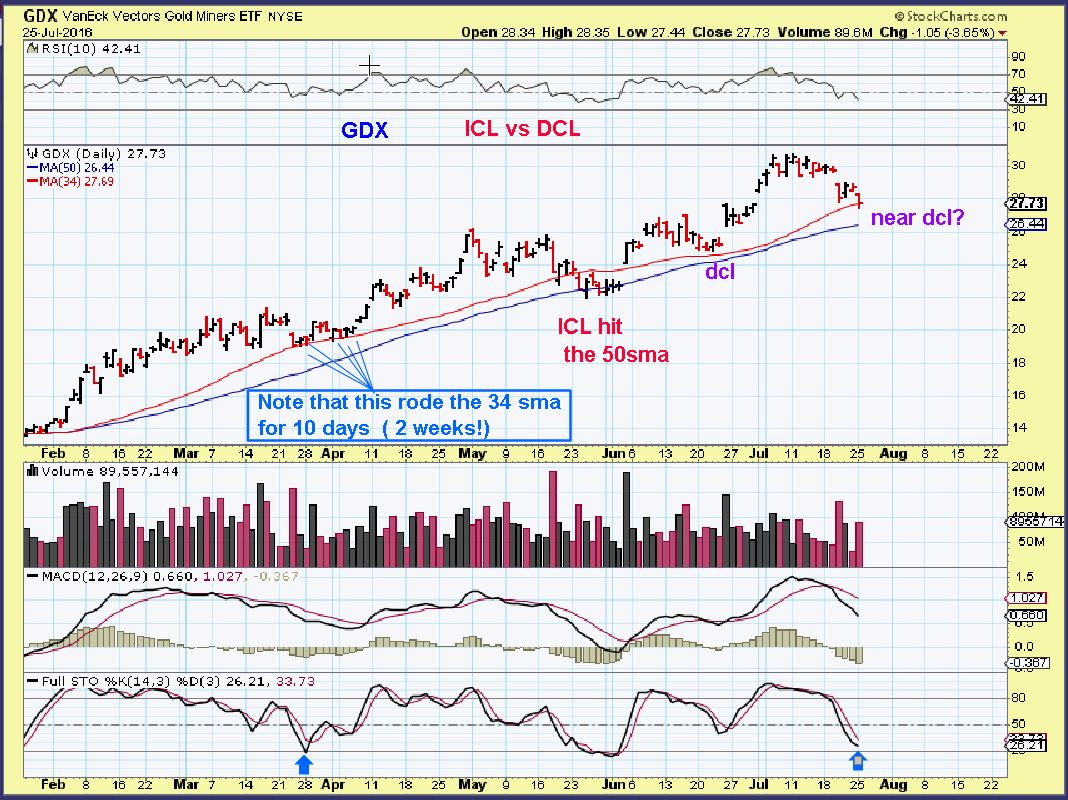
GDX #2 – I just happen to notice tonight that the prior dips landed on the 34 sma, the ICL went to the 50sma. So are we there, right before the Fed Wednesday? Time will tell, but maybe the 34 sma holds price. Read the blue wording on the chart. We could even go sideways for a bit here before running higher.
.
So not much has really happened since the Weekend report, I just wanted to add a few thoughts to compliment any trading on Tuesday. Since Tuesday is the day before the Fed Meeting & Fed Decision, I guess that anything could happen on Tuesday. The big day is likely still on Wednesday after 2 p.m. and Thursday. At this point, the set ups look like bullish ‘buy the dips’ opportunities, but some are more conservative and may want to wait for a swing low and a dcl for less draw down risk. That is fine for differing trading styles and risk/ reward levels. Happy trading 🙂
.


hey chartfreak.. cute fishy 😉
fyi “today” (and you know i say this seriously as it does jump on me freakylike) I have crude with 41.87 as wave 1 top… though I have seen this shown as an ABC correction and not an impulse wave up…. so, who only knows
Ken, chris, sog, etc .. any thoughts on this count.. no pussyfootn as usual …just spill it 😉
https://www.tradingview.com/x/CFOIid8T/
Are you suing ‘closing price’ only?
I notice that my Oil chart has a wick above that day for $42.49. I believe it is proper to use the high of the day for March 21.
You can see where in my OIL chart, Price tagged the 200sma with an intraday spike. Your chart doesn’t show the spike., as though it is only using closing price?
Actually, it’s a red candle, so your closing price is lower. It may have to do with contract rolling over.
Let me check something else.
I see the spike here too
.
refresh
.
not sure if you noticed, but this chart has a bottom for crude in January, where the other 2 charts above have a bottom in February
This is Brent crude. The other charts are West Texas Intermediate! Two different types of oil and two very differnt prices.
at least some one is awake : )
Just to ‘muddy the waters’ a little more, two pricing sources I use have spike highs on 22 March of $41.90 and a closing pirce of $41.13 and that is supposedly for WTI ‘spot’ prices.
so weird .. i use TradingView… that may be why?? that candle shows: O: 41.57 H: 41.87 C:41.17
not sure if it matters that much – really — one guy I listened to quite a bit from EW international – said that the commodities aren’t “exact” – they are higher volatility and can violate the ‘strict’ rules..
who knows.. but if it breaks big — then it’s back to the drawing board & this wave is probably a corrective abc type pattern…
ps. I’m not a big EW lover …in fact I’ve tried to give up study a few times, but those who shall remain nameless (cough Ken cough) stronghanded, i mean strongly encouraged me to continue my study) ;o)
I am just super intrigued by the social psychology of the price movements and i like it for the ‘birds-eye-view’ it provides me… mostly…..
Is 261% usually the top of wave 5? As you depict it……….#HB
do the math
meow
and yet you often show Wave 3 top as 1.618% from the start of wave 1. That’s not the same as pictured above.
ck out fib tool in TV .. it automagically calculates the fibs ….
labu knockn on that 38… u watchn?
watchn for this possibly… https://new.tradingview.com/x/RQWZBwPt/
LABU, yes still on track.
So I went to my MArch reports to find out what the peak was for Oil then.
.
Refresh for 2 charts – It appears that it was over $42
.
perspicacious poppy…
ur the best superman….. ;o)
: )
Alex, been holding CWEI since 29.50. Great chart. Even with oil down it keeps moving up. Looks like above 40 coming.
I haven’t watched CWEI in a while, indeed a nice chart through all this down side in OIL. I noticed I have $36.76 as the possible high. Keep it in mind.
It just went over $40
Woo Hoo ( Nope, I no longer own it)
I meant to post that here….It went over $40 today : )
Wow! Good job!
Alex
not sure to understand what you mean by this
Breaking below $42.49 messes with E.W. count
are you saying that the top of wave 1 was 42.49 and we’re now in wave 4 –
according to EW wave 4 can not come into wave 1 – except in an ending diagonal ?
is that the reason why you mentioned this?
fyi
thanx
Thanks – Maria covered that better than I could have
i just clipped from web… and actually.. idk why it says wave 5 must exceed wave 3?? that’s not right.. hmm.. wave 3 must be the longest …. that’s confusing gif… I will look for a better one.
I think it means in height, not length Maria
However, I feel like I have seen truncated 5’s just come up shy of 3.
Unless it’s a ‘truncated 5th’!! 🙂
I said that
Sorry. I must have misunderstood as a truncated 5th can be lower in height as well as length than the 3rd wave. But gave up with EW as an aid in forecasting a long time ago. I manage to make my mistakes in other ways now!! 🙂
lol, I have several tools that’ mess with me’ too
I do use E.W. as a rough outline and guide at times, but forecasting and projecting with it has been constantly tweaking it and trying to keep up with it as it morphs along the way, and too time consuming.
As a progressive outline , it works best for me.
All part of the never ending ‘learning curve’!! In my case I sometimes think my curve has actually morphed into a circle and I’ve been around it more than once now. At least it feels that way sometimes!! Lol
How often does EW work?
I’m often told not to bother, is it not very retrospective? Anybody find it useful as a predictive tool?
Never looked into it much as a result, It it not it “fits” after the fact but not much use real time?
Just curious, shoot me down if im way off….
Alex, from your above report, it looks like you have us getting ready to start the 3rd DC? How long of a run do you anticipate? Tough to call, I know.
We will likely see higher highs with divergence
Hanging around 1319 for GOLD. Not sure if that’s bad or good? The longer it goes sideways the more chance we are at the bottom. There is always the chance we dump to 1280 real quick. Miners holding up real good Today, NUGT, TGD up 5% with Gold same as Yesterday.
Seeing a few miners, including the recently hammered GSS getting a bid this morning with gold essentially flat. Oil continues to tumble. Govt numbers for oil out tomorrow at 1030, 3 1/2 hours before Fed Statement. Maybe 1 of the 2 will put some fire into crude? I’m still short 2/3 of position but tightening stop constantly.
I address this to Cason, and everyone here with any information,…. How does one “short”? How do you “hedge”? The S and P and even our metals can’t go up forever! Besides selling out…what can you do? Alex suggested I ask the group. Seems like a good day for a discussion.
Not sure I understand your question! But the obvious short/hedge for miners would be DUST. The short for SP500 would be SPDN or SPXS. I’ve used DUST before but not the others. Check the site below for more ETF’s.
http://etfdb.com/type/sector/materials/gold-miners/
Can you just short a particular stock?
Yes, of course, but that requires buying options! I don’t do that so someone else will have to chime in. With Puts and Calls (options) you buy the right to buy a stock at a particular price. They are time sensitive and can expire worthless. You buy a “Call” if you think the stock will go higher, you buy a “Put” if you think it will go lower. That’s how I understand it.
Yep. That’s the idea. And you have to sell them before they expire …or else, you MAY be selected to honor the position you took….by actually executing the option.
HI! I have shorted individual stocks before – it depends on whether your broker has shares in the brokerage that they can borrow so that you can short them. I normally use ETFs, but was short GM for quite awhile this year.
Most individual stocks can be just shorted yes, but it requires you to have a margin account with your broker, since you are essentially “borrowing” the stock from them to sell short. I wouldn’t advise selling short as a hedge, using covered calls on stocks you own and believe are due for a correction, or put options are a much better hedging strategy. But you can get burned in any setting so just bevan are and stay on top of the trade.
Covered calls, as I recall, were a better choice. I will have to go back and study that and “puts”. The costs of both added up as I recall from years ago. My trades are free, so I should probably just learn to sell and take profits.
This explains it pretty well, watch this video.
https://www.youtube.com/watch?v=Z1LctxzEREE
Excecllent! Thanks
Nancy, I don’t trade these. Here is another tutorial. I learned a little myself. A “PUT” is an option, and SHORTING is something different.
https://www.youtube.com/watch?v=zNVgDHCqSVA
Just noticed this one…have to leave but will watch as soon as I get back. Thanks for posting it.
arent u mr. helper today…
a brand new HB gif for u….
*oops i wouldnt attach.. must be to large…
Thanks #HB
Thanks…good reminder of the basics.
Nancy, when you asked me, I’m pretty sure that you said, ” I dont trade options, I tried that before and it wasn’t good”
If that is correct, others can help you with inverse ETFs too. all with cautionary notes that shorting can be tricky, especially in a bull market.
SMALL hedges in a bull. : )
I hear you, my fearless leader!
I’m Mostly speaking from experience, I guess thats the best way to learn, right?
I hedged too heavily once ( Bought DUST) expecting a drop of Miners into a DCL. The move went sideways and when Miners just popped & ran and I would have made good gains, instead I made nothing at first.
The hedge ( Dust) was deep red while my miners were running higher (deep green), and my account was slightly red as Miners took off higher.
A good specific example…learned the hard way…thanks for sharing.
….
hahahaha – I know that feeling – good one
If your in miners Nancy the “easy way” is via DUST (inverse of NUGT), but I don’t recommend anything but a very small position personally. If you get it wrong it will rip your face off….
Edit:
Or what bill said……
LOLOL! A good description of what I experienced with options! So, I may be facing the same if I venture into DUST! It is not seeming very enticing. My face is getting wrinkles, but I still prefer it ON! LOL.
I always got told never short a bull market, did i listen?
Erm, nope…………………
Hi Nancy, sorry that I can’t write back during the day from work (it’s a technical issue with my browser, not just that I don’t usually have time). So, I rarely out and out short a specific stock, it’s usual an inverse commodity or sector ETF. And I only take a ‘short’ versus a ‘hedge’ when I have a really strong feeling something is going down. So, what I select also happens to do with what is in my portfolio. Recently, it was clear to me that oil was going down so I was happy to purchase (long) SCO which is 2x short oil ETF. Another play would be a put option. There is a time aspect to that as Bill explains below, BUT it costs less capital. Then there is covered calls and married puts.
For example, I have 500 shares of GDX BUT I think we’re dropping into a DCL so we might go down a bit but I don’t want to sell everything b/c I’m not playing the ICL. So, I buy 5 PUTs at or near the money. Since each put is equal to 100 shares, I’m covered. When GDX goes down $3, my puts rise by $3 so it’s even. Alex calls the DCL, I sell the puts for a profits and watch GDX recover. For example, $28 GDX puts closed today at $1.05 for Aug monthly expiration. So, for $525 I can hedge 500 shares or $14,250 worth of GDX. That’s a 27:1 ratio. With DUST I could buy 1/3 of my GDX, it would cost just under $5000. Still 10x the options. BUT, the options have time premium that melts off. So, in a consolidation you write the options, meaning you receive the money and now the time goes in YOUR favor b/c you are the seller. So, you write a covered call.
Also, with buying options, it can only go to $0 – you could never lose more than $525 (plus commission) in my fictional example above. With DUST you could theoretically lose all capital, but that’s not actually going to happen as you’d stop out and Alex would steer you clear with his updates. With writing (selling) the option, theoretical the losses are infinite. If you sell a GDX call (you are short in this case) and it goes up $5/share, then you sold the call for $100 but it costs you $500 to buy it back. That’s negative 500%. WOWZERS. That’s why the broker wants a ‘covered’ call – your shares are the collateral in case the trade goes against you. You lose the shares but keep the time premium and move on to the next trade.
Ok, this was long. Like Chris or Peter long. Hope some of it made sense – check out a few terms when you get a chance- time vs. intrinsic premium, married puts, and covered calls. GL!!!
FCX has fallen off a cliff! Trying to read the earnings report which apparently is bad!
I may be wrong on these, but what I could find [without going directly to each individual company website] …these are some earnings set for tomorrow 27th: CDE GG HBM KGC NGD These are for the 28th: VALE EGO CLF AUY
TGD on 8-4
Marketwatch has gold at 1329….kitco at 1319….? which one is correct,anyone know?
1320
One might have a slight lag in time ( delayed price)
CLF acting like a champ so far!
And X
many of the steel stocks are holding up rather well.
STLD, ZEUS, AKS, but especially X
Rode it up in April the all the way back down, almost ditched it.
True story: Was ready to sell at the may bottom, hit the wrong button after a few drinks, bought more and doubled my position by mistake. It reversed almost that second! Happy days! x Who said this trading lark was hard? Still holding……..
I seriously was reading that, and I did laugh out Loud literally
Really glad it went in your favor, were you drinking vodka and a red ‘BULL’?
Well i’m in Thailand, the Red BULL is damn strong over here I tell ya ;).
Never made a mistake that made money before……well not in the market at least………..
And at what time of the day …..??????
That’s my problem, on “busy days” i’m 11 hours in front of NY so any decisions near the close are sometimes “impaired” shall we say 😉
What a happy “accident”!
Last time I heard that was the birth of our first child!
Onfire with the jokes today!
ba boom tish!
Hmm…that sounds familiar…
Hilarious!!
Just Hit a 52 week high if im not mistaken.
Looking at the weekly here, it looks like its going to hit some resistance from back at the start of 2015? Is that how it works?
Yay!
Double yay 😉
Dumped half just now, Leaving the rest in my core. Need the change for some dry power in a few days 🙂
$TEAM REDBULL$.
and stepping up to show the way – the USD starts a decline. It’s absolutely amazing, the inverse relationship that the USD has to commodities – almost hilarious all the explanations why gold and oil do this and that. At the end of the day, the USD goes up – commodities go down; Dollar down – commodities up.
That’s what I always thought, but the last few months they went up holding hands almost.
Daz beat me to it. I was JUST going to say….that is not the way that it has been latley. Gold was up, the USD was up. etc
true but brexit, caused a false surge in gold that masked its true trend and since brexit gold could not hold as the USD strengthened,
Pre Brexit the dollar and gold ran together. The last 2 weeks of Feb Gold nd the USD ran together.
It happens 🙂
and running thru the meadow together…. like little school children…
*citation from CF.com
Harvesting profits on the VIX, will possibly reenter after the Fed tomorrow.
Gold chart? I’m thinking the blue trend line (refresh) is tooo steep to hold. I bet we get a flash beat down before we move higher. Thoughts? I would think a touch of the green trend line would be more natural. That would be gold $1280
I was just about to say something similar. One more big push down should do it. Buckle up!
Makes sense, but my NUGT would be pissed if that happens!
Commodities looking good here
FCX did a nice recovery so far,
AKS ready to break to new highs,
X , CLF, looking good.
VALE slow & steady since June
FCX recovered well! Enjoying FCX CLF VALE. All core, but I may sell a few shares.
Vale is breaking out….:)
AG up almost 5% buying the dip worked 🙂
I have to confess that I keep a core of the individual stocks that I have picked out of your recommendations and bought for that initial “pop” — anyone else still in SID? It’s another poster child for the buy and hold school of thought
Wow, I hadn’t even looked at SID s chart for a while. That has been a slow & steady gainer for weeks. Nice.
I have favorites … CLF, AG, CDE, TRX, BWEN (even though it’s down)
I gave up on SID too soon…but I wanted the $ for more metals so I sold for a small profit. Well done on white-knuckling it through.
Quite the volume pop on AUMN using a 1 day 5 minute chart.
VGZ just popped up too , but not on such big volume.
seems to be quite low volume on GLD and just noticed GDXJ has some selling pressure
Isn’t it nice to see GREEN again?! Even if it is just making a dent in the red in some cases.
Alex, are you adding to any miners today?
I sold TGD Today!
Bill what do you see in TGD?
Nothing Bad, just raising cash.
I’m still holding it.. It’s my lotto ticket!
Me too, in core as a lotto ticket, but I will sell some at some point to take some gains again.
No, But I added AXU yesterday
That is not a recommendation however.
as I look at it, it looks like it may just bounce tot he 10sma and then could drop down to the break out area
Adding on each dip (yesterday)!
CLF might just break $8 today…. Wow!
X and AKS broke out strongly too.
The Steel stocks have it going on – I hope they are just leading the way for GDX : )
A stock to look at that supplies these steel makers is SXCP. It has been climbing steadily and seems somewhat immune to our commodity fluctuations possibly because it is such a good dividend stock, too (yield16.32%). Be aware that earnings will be posted before the bell 7/28 but they have beaten consensus earning the last three quarters. It has upside potential too.
X has been in beast mode since the BREXIT shake-out. I took profits wayyy to early (again).
The high today so far is 8.04
Choo-choo!
Loving it. Still holding CLF, NUGT, EXK, and AUMN. Getting nervous that I have toooo much AUMN
then sell some…
meow
*or tighten up that stop… u do have stop …..?
No stops. I’m in front of the screen all day.I just hit the sell button if gold starts water falling. I want to give it a chance. I notice it does lag NUGT a bit. But I will keep that 8-4 earnings date in mind.
I thought you had to “work” during the day? 😉 I’m in front of screen but still miss big moves sometimes it I see them but don’t have time to really perform the due diligence I should before buying.
Fight your Fears 😉
http://www.moneyshow.com/articles.asp?aid=tradingidea-27125
I work during the day, but I have dual screens going, one of them usually has TradingView open. 😉
Great call on NUGT — but TGD crept back up after you let it go…
Yes, TGD was kind of up & down all day, and then closes up over 8%, catching up to VGZ which was up 12% at one point, and similar gains to NUGT.
JNUG was a champ.
and NRP – This one wont stop.
NRP? This isn’t even on my radar.. When was this on your “list” …
I’ve mentioned it a few times. It flies, but it had a reverse split a while ago
Ya, in hindsight it was a bad move. I wanted some cash to buy more NUGT on a dip. NUGT didn’t dip and TGD took off. It was still a very good day.
Crystal, you holding CLF thru earnings?
http://finance.yahoo.com/news/cliffs-natural-clf-q2-earnings-140002644.html
I might take some off the table, depending on if $8 acts more as resistance than support tomorrow. thanks for the heads up!
How’s this for suck. I allowed myself to stop out of CLF during BREXIT panic. Then later used that money to buy…gulp…GPL. AHHHH……
(I spend more time reveling in the lost than rejoicing with the win, a personal weakness of mine).
AUMN not participating in this rally? Telling me something is up? Earnings on 8-4?
yeah, I’m doing way better with majors and mid-majors right now then these little guys. I guess all the giraffes are tired!
We had a good move today and last Thurs in GDX but gold itself didn’t move much. I think once we get the metal to rally back up to it last highs these little guys might raise their heads again!
Thank you NUGT and CLF
Nice trade on Nugy. I plan to add on next down day as long as yesterday low isn’t broken.
GLD is sitting right at the top of the June 24 gap. What’s it going to do?
VGZ up 11%
Wish I had put money in BREW! Do you think it’s too late?
F.Y.I to TGD holders. Earnings release AUG 12 th , I’ve been hearing different dates.
http://www.marketwatch.com/story/timmins-gold-to-release-second-quarter-2016-financial-results-and-conference-call-2016-07-25?siteid=bigcharts&dist=bigcharts
And this release showed increased Gold production by 13% over the same quarter last yr.
http://www.marketwatch.com/story/timmins-gold-reports-production-of-25863-gold-ounces-for-the-second-quarter-of-2016-2016-07-13?siteid=bigcharts&dist=bigcharts
Vale earnings in the morning I think. Can anyone confirm?
7-28 before market open
Ah ok, im on the 27th already.Makes sense. Thanks
I have July 28
Vale looks good today too.
gettn spunky…
Alex, I read this post late, still I have a question. I have to ask you regarding this TGD post about earnings on 8/12, Wouldn’t a delay of earnings indicate bad news? In my mind that makes sense because if earnings were good, it seems, they would want to get them out. What do you think?
Wow, was that an earnings shake out on FCX this morning? Huge Reversal.
What a move…. Low of $11.25 to $12.84 later in the day.
GGB and X running nicely. Anybody know what has caused the big jump today?
Alex, I am getting the feeling that GDX is in a new DC. No confirmations just yet but this strength does not usually happen before the low, but AFTER the low has been put in. I could be wrong though.
Well… I’m not saying your wrong, and the low could be in, but…
Didn’t GDX do this very same thing 3 days ago, and with even more volume?
Very true. Are you waiting for your proprietary indicators to buzz? P.S. Never take trading advice from me. 🙂
LOL – I’m just waiting for your proprietary chart to buzz ( You know the one) and maybe a break of the overhead trend line & 10sma,
HOWEVER – I am pretty loaded up with Miners anyways
Ha. oh yeah, a trend line break ,and a break of the 10sma….errr…uhhh..easy peasy.
2nd time is a charm!!
TCK (Teck Resources) barely flinched during this daily cycle. Impressive.
NRP impresses me too
Alex, GSS has a bad looking candle and HUGE volume, but this is occurring at the bottom of a big drop. Is it a continuation pattern or is it a reversal pattern (going higher from here)?
Could be a back test and reversal, but I dont usually step in front of a drop like that until it proves itself a little more. It could be a slam down and then short cover.
Sure! Our beach is lovely with few people. We go over for an hour or 2 most nights after dinner…temp is always cooler with a gentle breeze…the beach is only about a 5 minute drive away.
..
Ok who grabbed NUGT and MUX with me yesterday? 🙂