
Trading Gold
What has been the best game in town the past few weeks? Trading Gold Miners has really been explosive. Look at charts of VGZ, MUX, ASM, CDE, AG, FSM, and more and you’ll see solid gains in these once hated Miners. I want to discuss trading these miners further, since we have been killing it in some of these. Lets go to the charts…
.
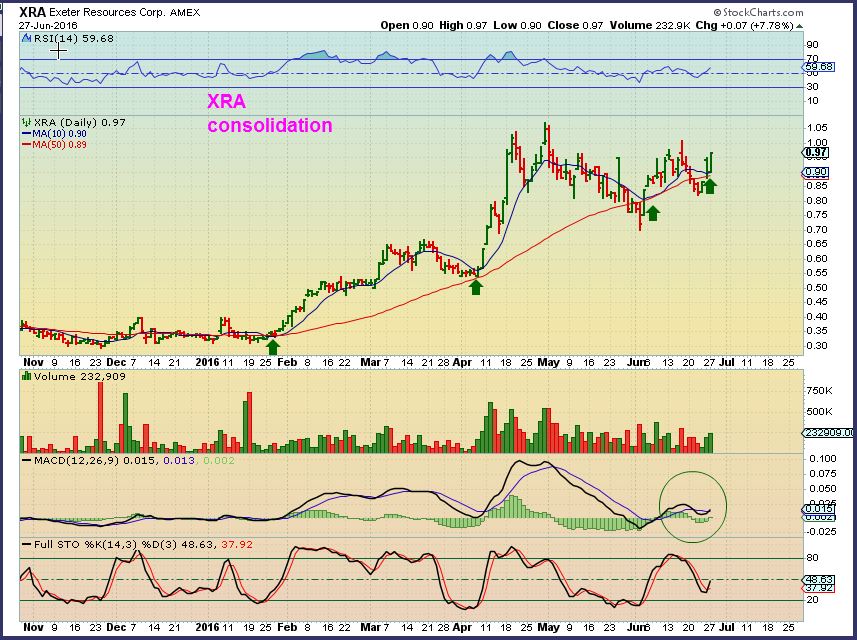
XRA – On June 27th, I mentioned that this is an explosive set up, and showed a few reasons why. I was buying .
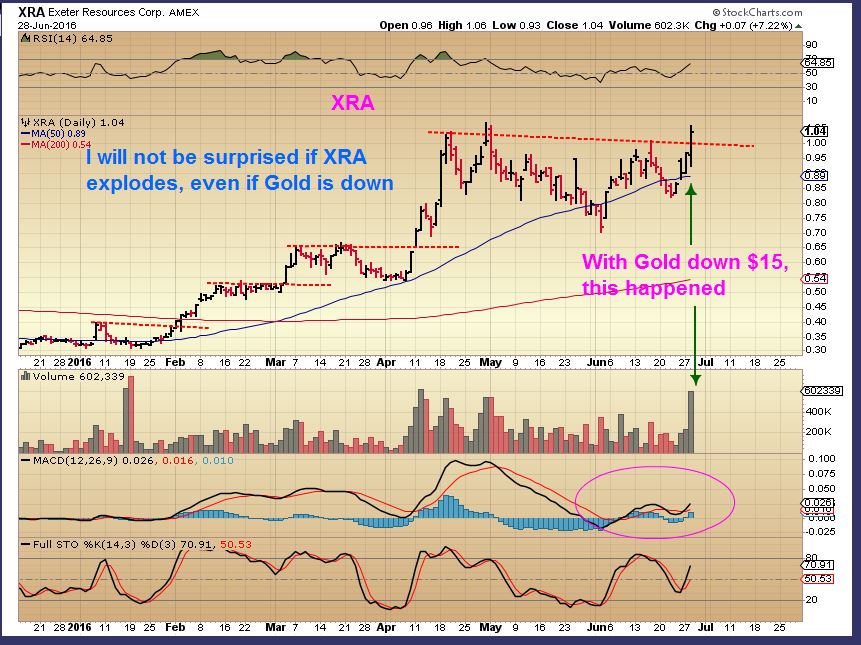
I then posted this on the 28th. With Gold down $15, XRA powered higher. Last chance to get in?
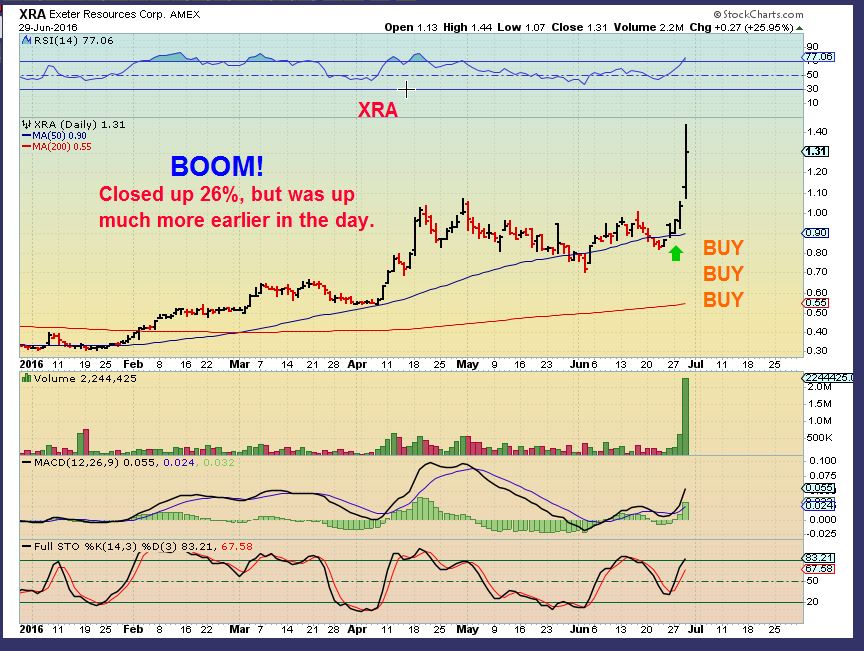
And then Wednesday- BOOM! – just like the VGZ and MUX trades, this exploded higher. Up 26% at the close.
.
I was asked ” Did you sell the pop?”, this is what I’m looking at…
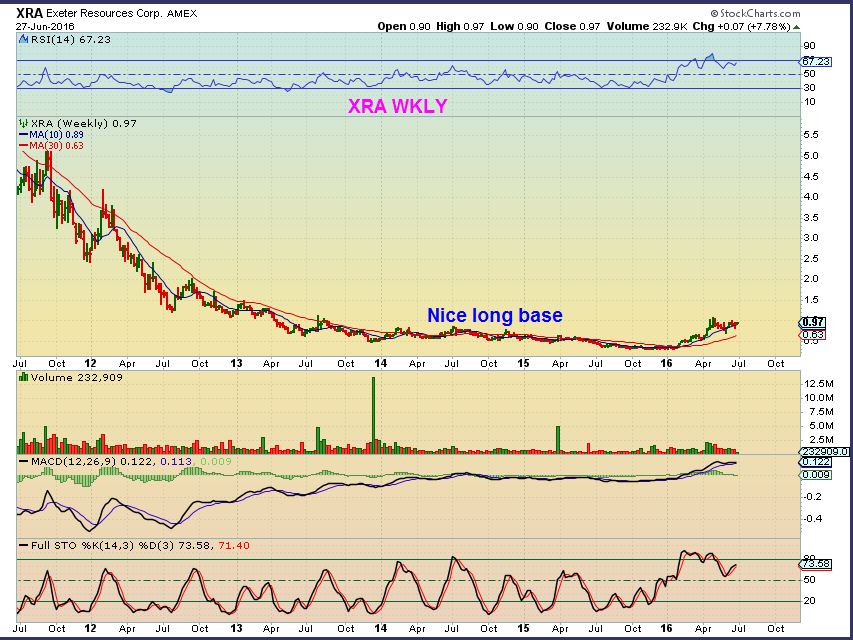
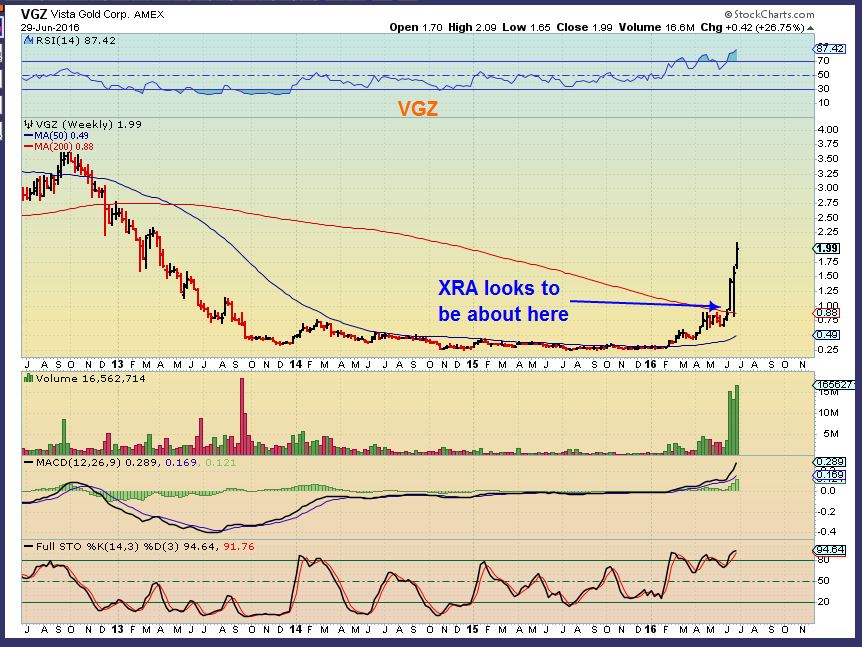
I pointed out this explosive base too when I recommended it. XRA is at $1.30 with yesterdays pop. Look at $1.30 on this chart, I do NOT believe that this move is done.
VGZ – Notice how VGZ exploded. Compare the 2 charts. These moves are very difficult to do price projection ‘sell point’, because of the way they extend beyond normal parameters. This may want to move even higher, in the same fashion that it dropped into that base. Swiftly.
.
More on Miners after a quick market review
.
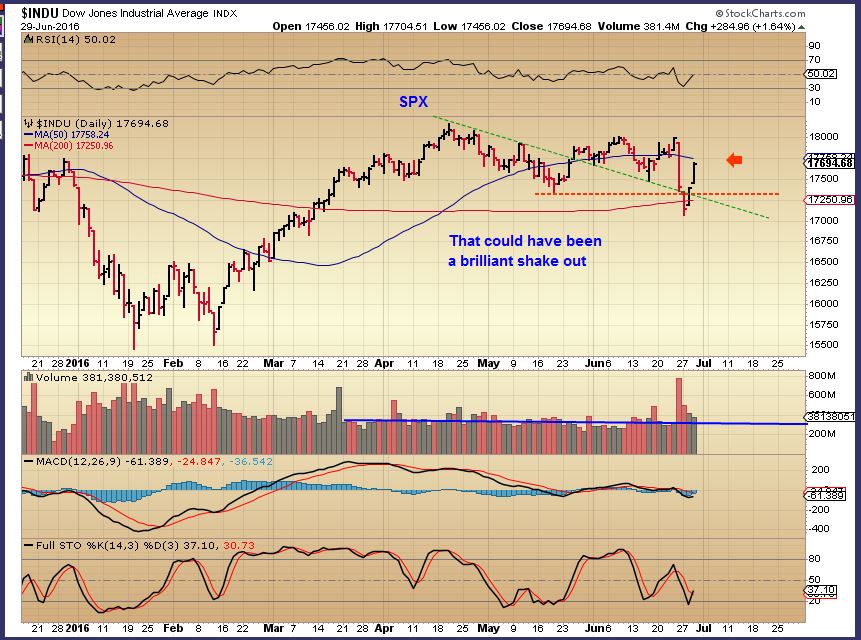
DJIA – (Sorry, I grabbed the DOW and wrote SPX) This move is actually looking pretty bullish. I was expecting a bear flag, lighter volume each day. This looks like a shake out and then a quick move off of the lows, and it is still oversold. Now we have the 50sma to take note of.
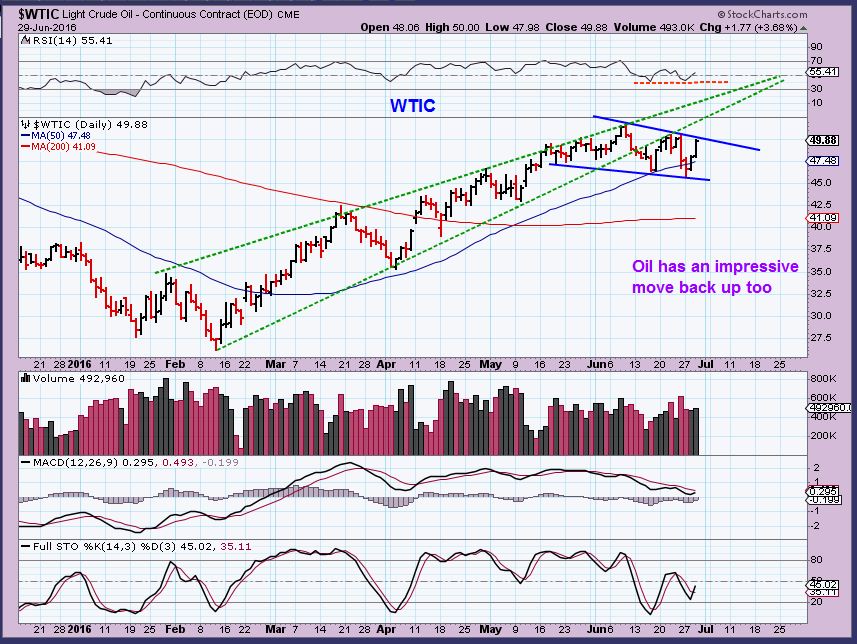
WTIC – Oil is right at a critical recovery or possible temporary fail point. Can Oil get back over $50 ( especially $50.54), or will it roll over here?
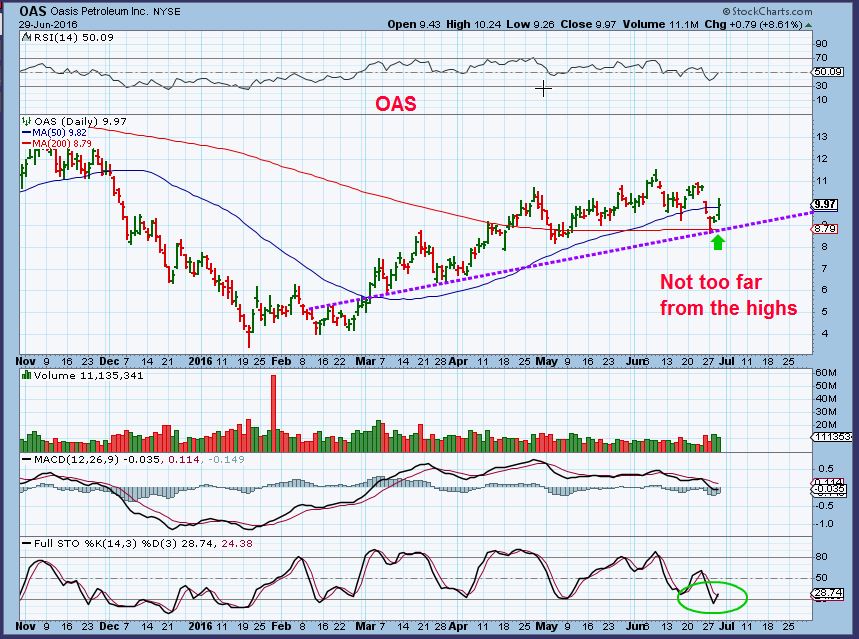
I have seen many energy stocks move higher, but not in the same explosive way that they have in the past. Some look better than others at this point. This is OAS for example. It tagged the 200sma and turned higher , so this remains healthy so far. It is still oversold and seems to have simply consolidated recent gains for the past few months. Time will tell.
GOLD SILVER & MINERS
I’ve been focused on Miners for 3 or 4 weeks more than anything else. I call it the best game in town, because if you know what to look for, you can tack on massive gains in a short period of time. It is best not to go “All in” and try to overdo it. I just take a position, and I have even added once the set up proves to be following through. Lets examine the precious metals and a few trades.
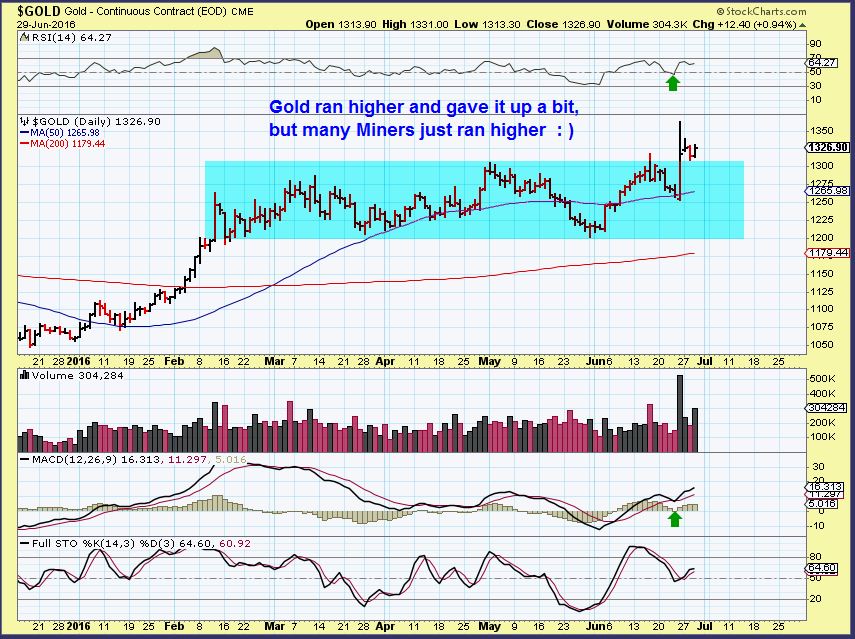
GOLD – Back test and consolidating that POP.
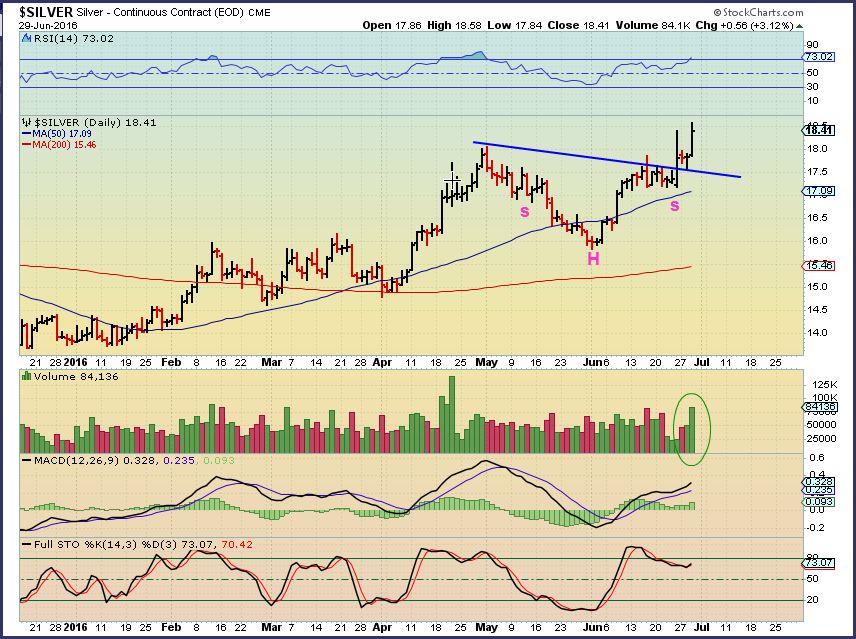
SILVER – Breaking out and a possible inverse H&S
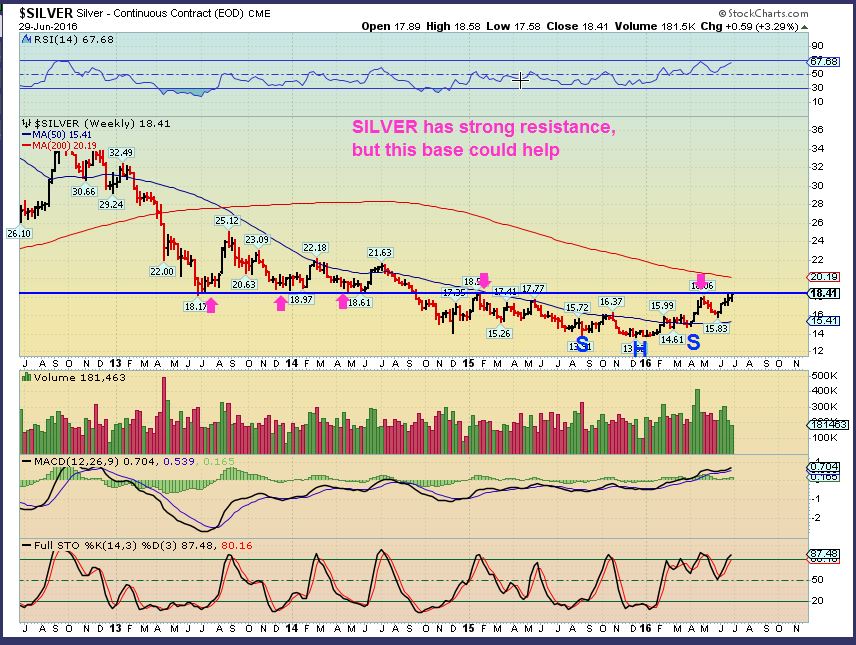
SILVER WEEKLY – At a strong resistance point (Magenta arrows) , but also possibly breaking out from this base with great upside potential.
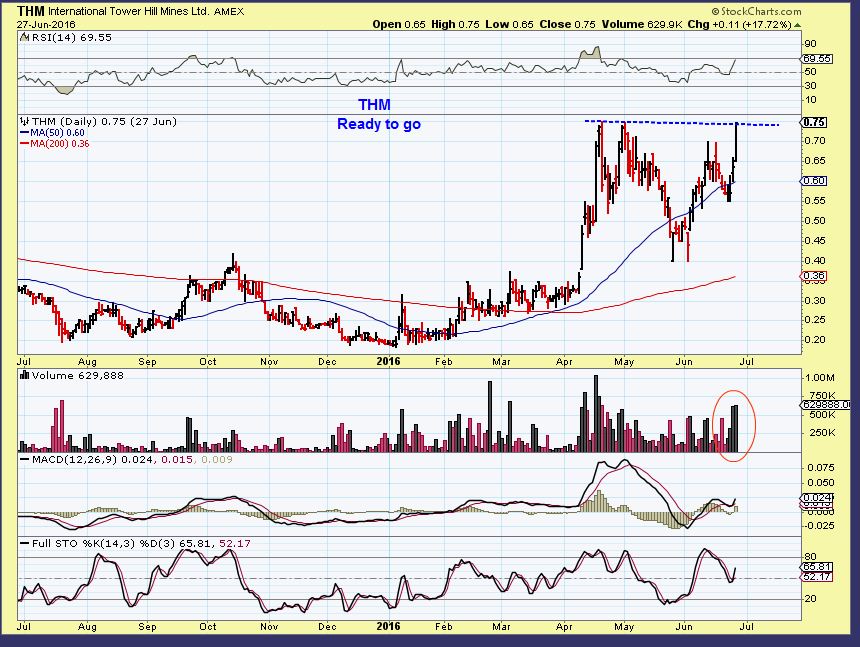
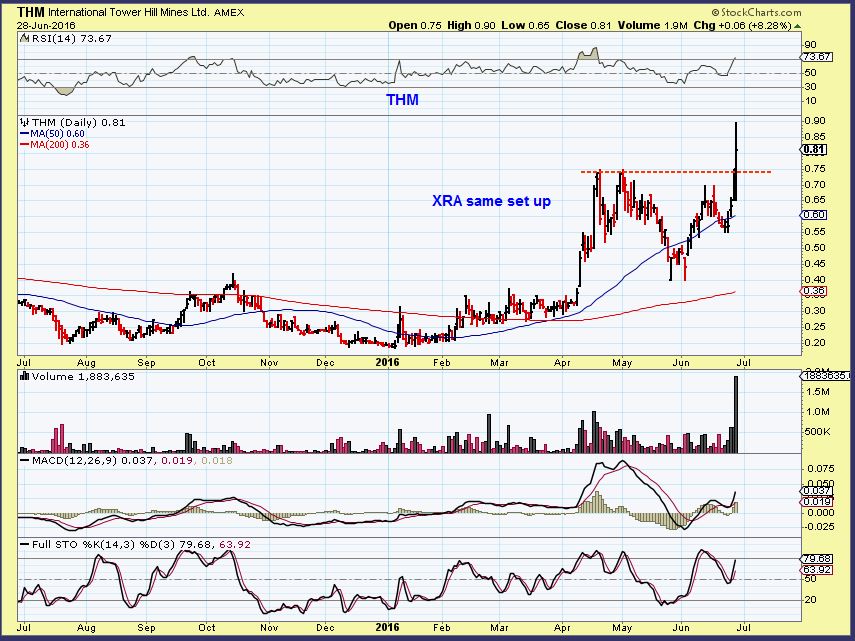
THM – This base was pointed out 3 days ago as an explosive one.
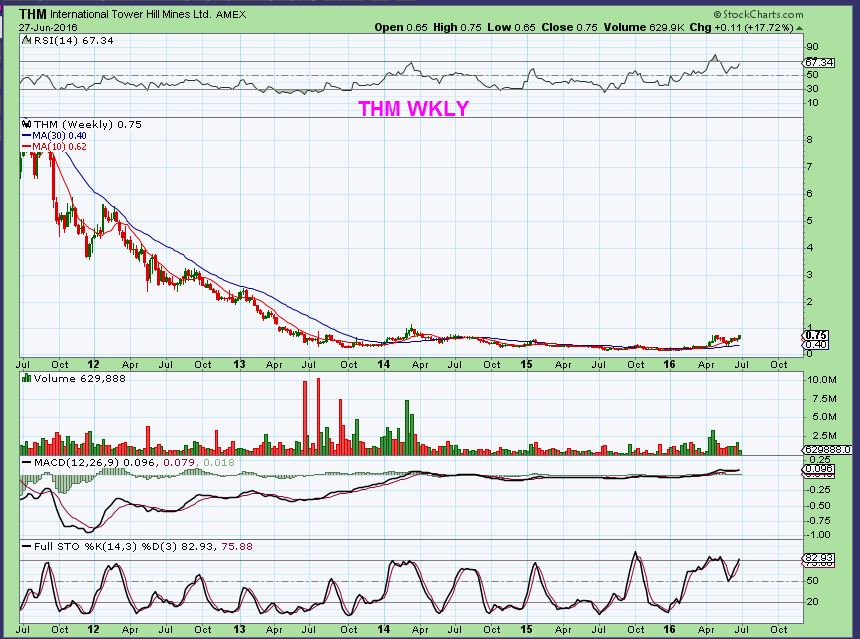
June 27th – I pointed out that this was ready to go. It has all the characteristics of one of those strong runs higher.
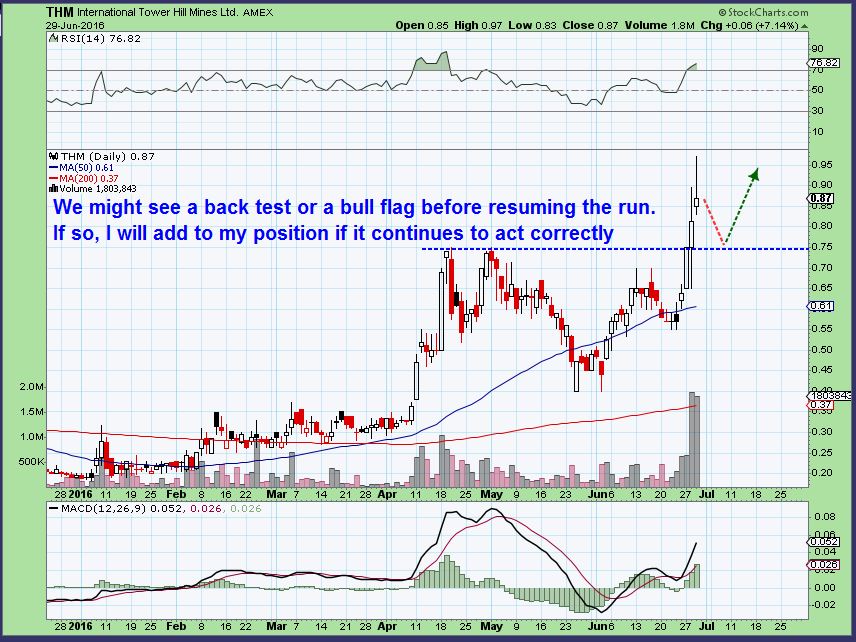
THM Popped and gave it up a bit, it actually hit the first price projection. I can picture a bull flag forming and then another move higher, or just a continuation to the next $1.18 target.
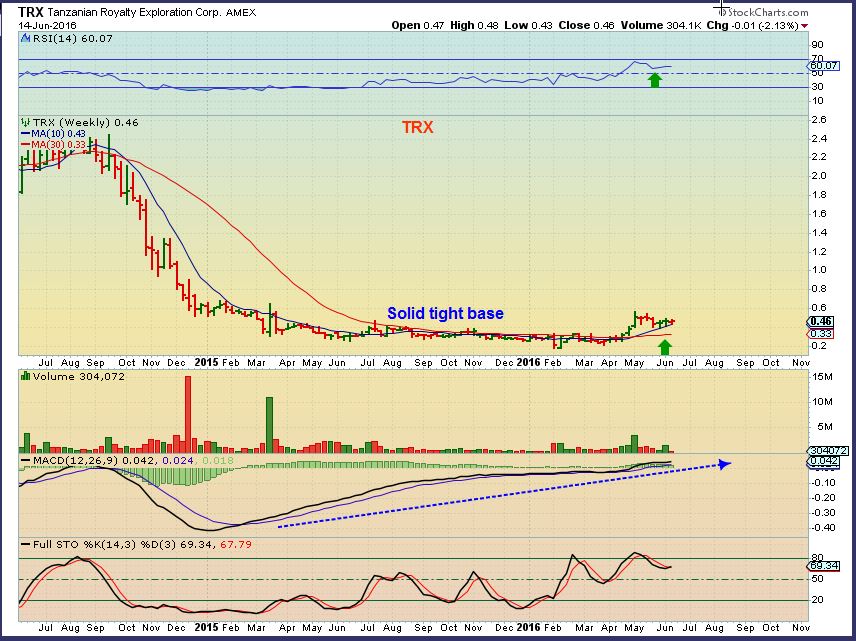
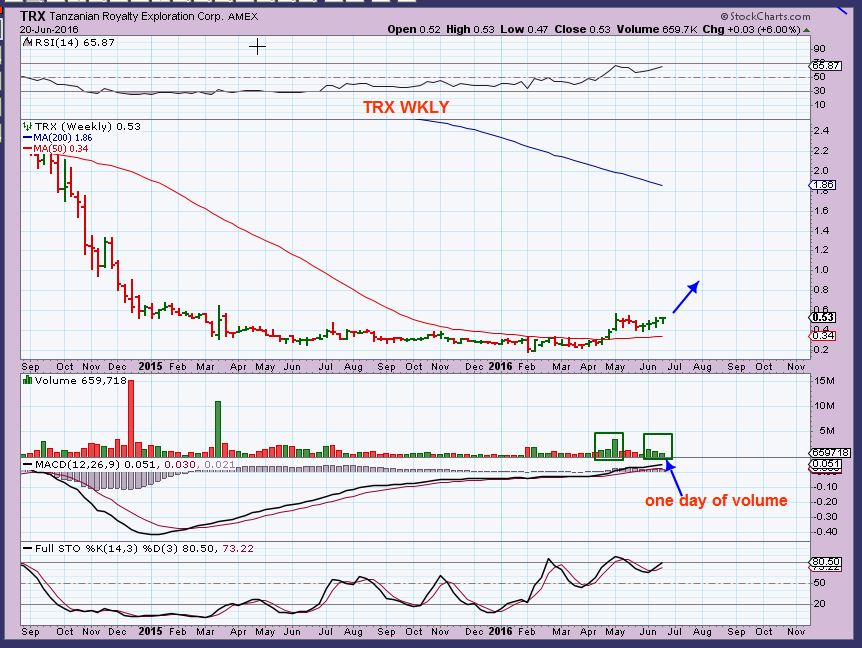
TRX – I have been pointing out this one so that traders could get in early, and I have been following their story since March. They had some trouble at their Mines, but seemed to resolve the problem. They recently had to shut down some production due to this problem, but during this process, they made improvements to the operations and claim that production restart in this area will now produce faster / better results. On June 16th they announced these improvements and stated that they are preparing to restart production in this area. When they do, I believed that investors would take note. I remember owning this at $6 simply because I liked the management team (Jim Sinclair).
June 14th, I pointed out this base and mentioned that I had started a position when I thought that the ICL was in place.
June 20th, I posted this chart, it was slowly moving higher to a break out point.
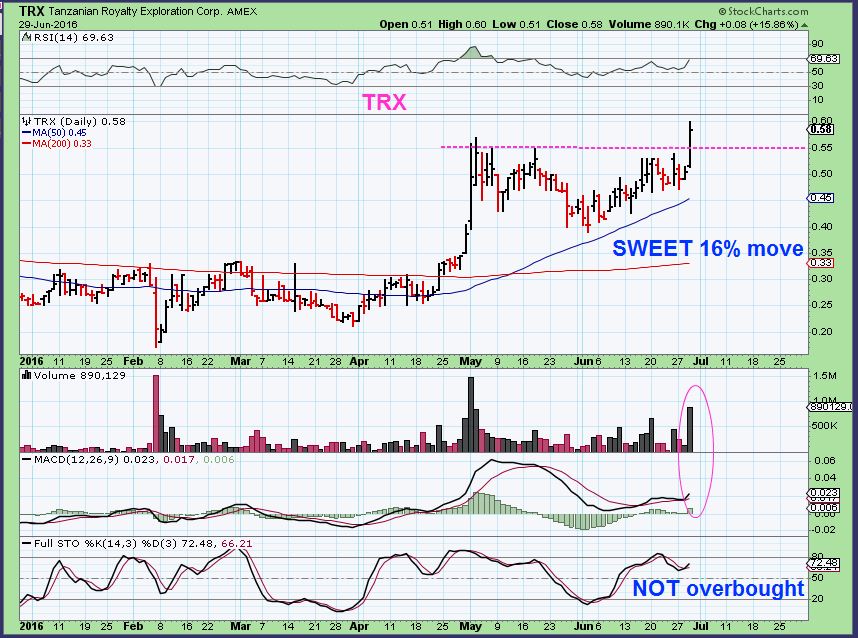
TRX June 29th- Yesterday TRX broke out. This will either explode today like the others, or it will quickly drop back and tag the magenta line area, maybe even intraday. This set up does look like it will drop back first, but we’ll see. I added to my position yesterday.
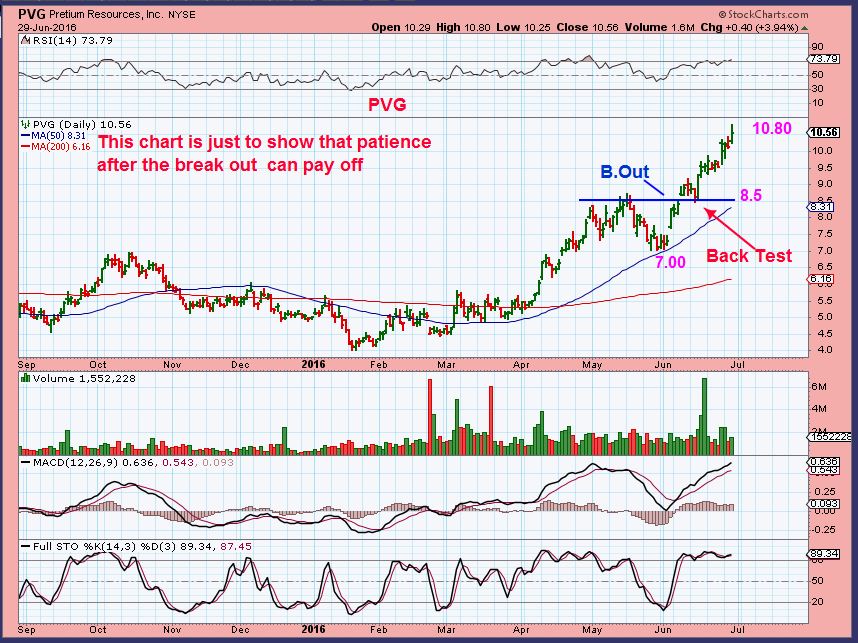
PVG as an example… I just wanted to point out the break out & back test process. In real time, some people think that when a stock breaks out and stalls, there must be something wrong. Look at PVGs break out. It immediately stopped & dropped and that was 5 days. When you buy itand own it for 5 days and it stalls and drops, it ‘feels’ like something is wrong, but this is normal and I often add to the position if the volume remains normal and the MACD looks like that 🙂 TRX is set up a tad more like this, but we’ll see.
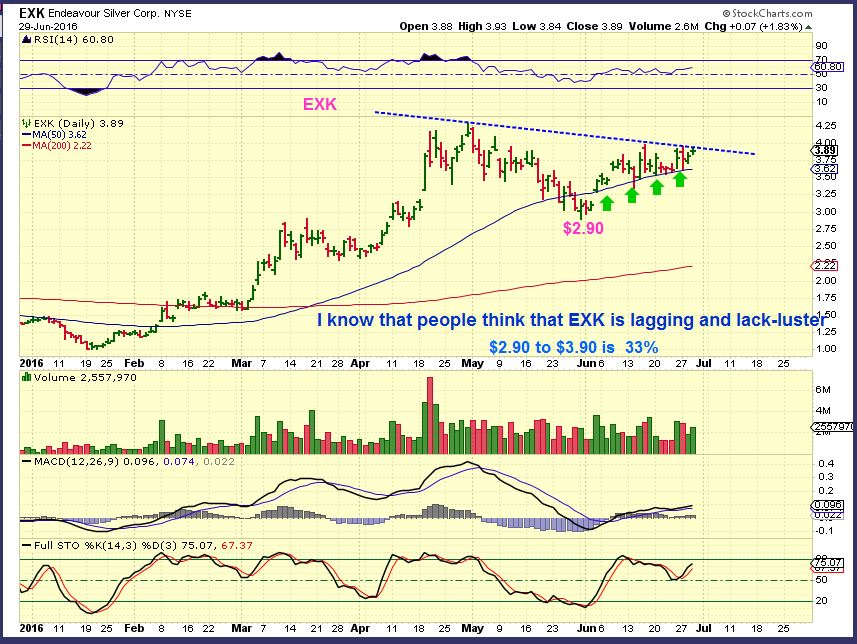
EXK – Many think that EXK is a lagger, but it just moved from $2.90 to $3.90 since the May 30 ICL. I think it may be building up steam for a nice run here from its last big run. EXK ran from $1.00 -$4.25! To me , it just needs to consolidate and then it will break out & run.
I WOULD BUY EXK & GPL RIGHT HERE. I OWN GPL AND I THINK IT IS JUST ABOUT TO START A NICE MOVE HIGHER.
.
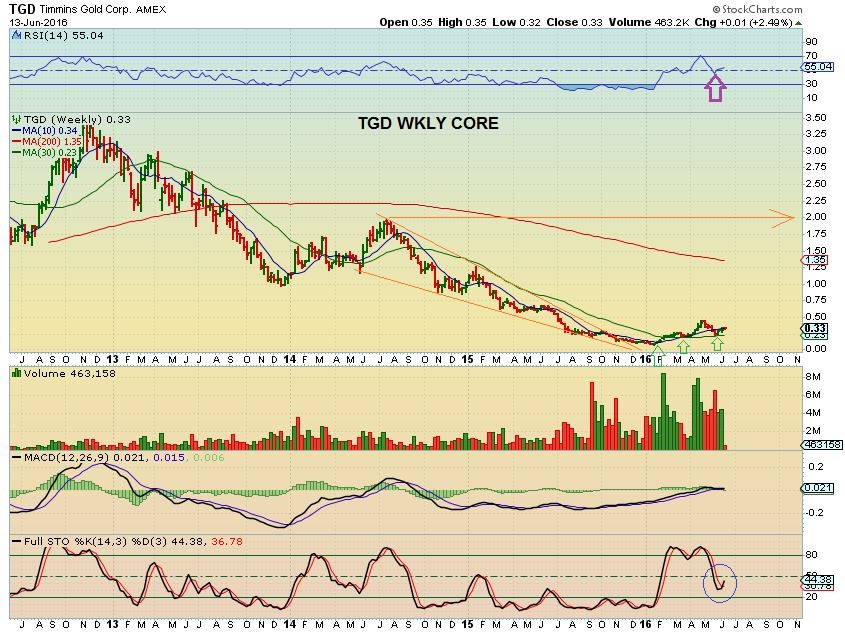
TGD – I also pointed out re-buying TGD again when it tagged the 200sma and successfully held. It remains bullish and is slowly making gains. Nothing phenomenal at this point, but slow and steady gains work too. $0.22 to $0.37 is the same gains as a $22 stock going to $37 %-Wise (Which , by the way, has been about 70% gains in 1 month. Not Bad).
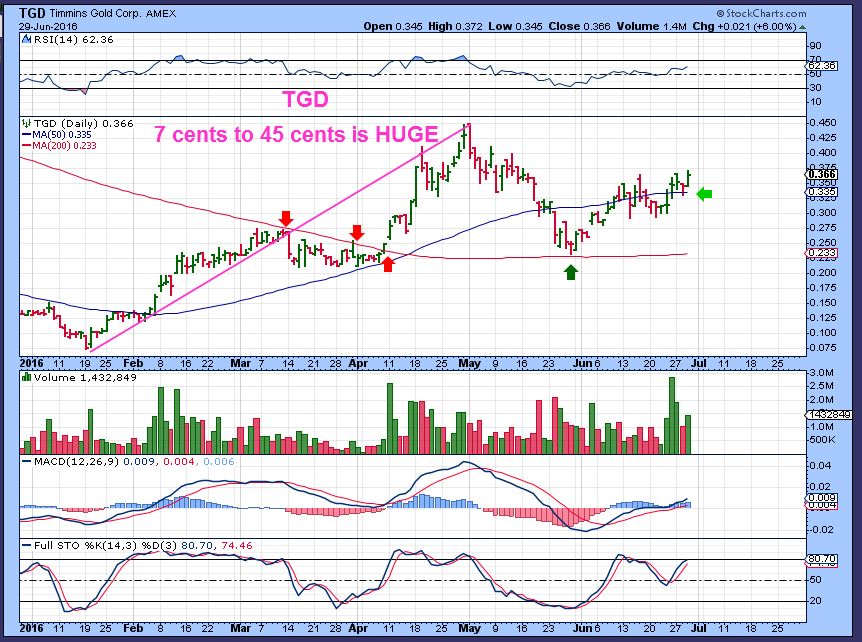
TGD – You may remember this chart of the base
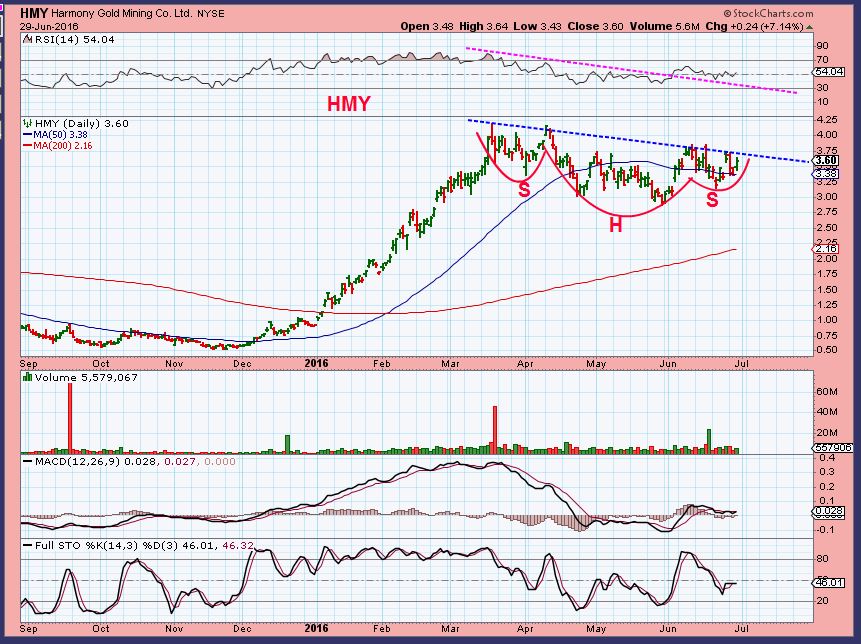
HMY – If you have been here for a while, then you remember how HMY, DRD, SBGL, etc were little rockets. They would not drop enough to allow me a comfortable ‘low risk’ entry all the way higher from Dec to March. After a 3-4 month consolidation, this chart looks very nice as a set up to continue higher.
.
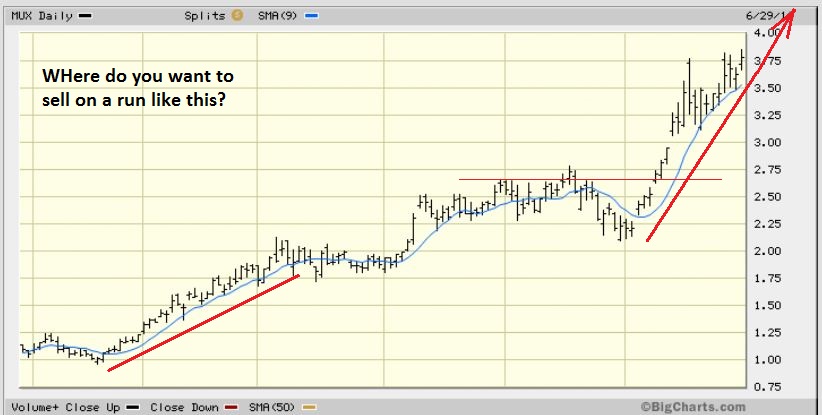
So those are some trade ideas. I will try to discuss ‘sell targets’ in the next report, but just look at VGZ, MUX, ASM, etc. They just kept running after I sold my first partial positions. Mux from $2.10 to $3.75 is great, but it just went sideways and now may keep going. Notice: It gets volatile, and yes there will be down days, but MUX just keeps trucking, even with gaps below.
Yes, they got volatile, but they haven’t collapsed yet, right? They just consolidate and may continue higher. These are explosive bases that are rare opportunities. You can sell partial positions to lock in some gains anytime you want, but BUY & HOLD is also a great way to make the good gains until the intermediate cycle tops. We just started out of an ICL 4 weeks ago, they run 5-6 months low to low lately. I’ll try to discuss basic sell points in the next report if I have time. There is SO MUCH going on in the markets these past few weeks, the reports take longer to write with so many ideas to share. 
Thanks for being here and enjoy your Thursday trading!
.
~ALEX


Hey Alex. I was looking at some news for IPI and potash and it looks like the trend for pricing (revenue) is down due to the global price/demand/supply with many of these companies reporting lower and not hitting expected targets. Is this an area to stay clear from and not go long?
Hi Moe,
Do you have a link to the article, I haven’t read it? The only problem that I have is that when I read articles, i often find that they are reporting on the past 6 months to a year, and the markets always look forward 6 months. I’m not saying that that is what we see here, but I have seen that happen SO MANY TIMES, that I am a contrarian. Some of my best trades ever are from a contrarian viewpoint at critical points. For example…
It was the same with Miners. When the lows were in in Jan 2016, I couldnt find a positive article out there. All I was reading was ” Miners will go bankrupt, unable to turn a profit with Gold under $1200″ and ” High debt in Mining companies will force then to shit down”. Everytime I posted “Buy points” for Miners, someone would send me an article about most junior Miners going bankrupt. Then BOOM, they double and triple the following months.
I mentioned in the comments section yesterday that I sold my IPI yesterday and put it in a mining stock that looks ready to go. It wasnt because I didnt like IPIs chart anymore, but I bought at 41 area, and I wanted to use the funds in a Miner that looked ready to pop.
I think the charts for IPI, POT, MOS, MON, etc all look like they are bottoming and bullish so far, I am keeping my eyes on them and was planning on re-entering IPI in the near future if it coninues to act as bullishly as it has.
I would say that if you are uncomfortable because of reading that article, you can always move on to something else ( something Not extended). I was using the 50sma as a guide with IPI, but I sold to use the money in another trade & still have cash on hand. So it”s up to you. I find the ‘timing’ of some articles to be suspect, but you never know , and I didnt read the article. I wouldn’t jump into XRA, VGZ, or an extended stock at ths point though. XRA for example could go either way. Being up 25% yesterday, it could either pop another 15% OR DROP 15% and still be normal, but it cant be considered a low risk entry here, unless someone was buying for the base & longer term buy & hold.
wow – quick response and much appreciated! Thanks Alex. Let me do more due diligence.
Moe, I have IPI too…please share any data you find. Thanks.
I was reading this article and then read the last quarter numbers for IPI. Not sure if this is specific or more generic for this commodity
http://marketrealist.com/2016/06/uralkalis-1q16-results-mean-potash-producers/?utm_source=yahoo&utm_medium=feed
You’ll find the quick, short answer below : )
Alex, Thanks for a super post (yet again)!! Can you describe more why you think TRX might re-test vs others? Is it because the RSI is reaching OB short-term or are there other things that bring you to this conclusion? THX!
Hey Deshy
Its kind of a gut feel, and I may be wrong.
The weekly chart has a solid line of resistance at this price level from Dec 2014 to April 2015 that it needs to work through. It may just Pop through, but often the POP works out with an Up day, and a small drop / back test, and then follow through.
Got it. Thx!
And it is just blowing through that resistance with strong volume now : )
I LOVE THIS WEEKLY CHART : )
lol! I do too…now! 🙂 Holding on for a while but will look to trim a bit and then ride the rest with minimal risk.
Alex, another great call on TRX! 14% Today
yes thx a bunch Alex!
Where is Crystal?! She had a happy accident yesterday!
Did her order for TRX fill? is that what you mean?
Yes….she bought it by accident….
Crystal • a day ago
So I read this mornings report and jotted down XRA and THM and then my uncaffeinated brain took the “T” and the “XR” and I put in a large order for TRX at .51 —- lol… (I realized my mistake, put in a stop loss and bought the other two) …
Of course I bought EXK up 0%
Thx Bill, I still own BTG down 4 cents – kind of a mix, but that TRX is really helping a lot
I used to own TRX. I might have to get back in. You have been killing it with your picks lately. Might be time to buy and hold. Seems to work out better than selling at first sign of trouble.
Yes, some of the ones that are breaking out strongly from these base ( Say VGZ & MUX) will probably never drop back down into those bases until the next Bull run in Gold is done. So if someone bought in near lower prices, they can hold that as core fairly safely.
I am thinking that some of these are also going to become buy out targets by bigger producers looking for more gold/ silver, before they get too expensive.
could AUY possibly be another set-up we should be looking at?
Yes, I like it. I dont think that it has the explosive potential, but it has good upside potential and looks ready to break out
I see a rising inverse H&S for the past 2 months above the 50sma
Alex, when you get a chance on your ‘no friday’ report wondering if you could say a couple of words on GSS. Patience is wearing thin..
ditto!
GSS , “say a couple of words”
* It looks Ok
* I dont know why its not blasting off yet
* Riding the 10 sma , so still healthy
* consolidation
Dear Alex,
i am holding WRN, GPL. Is there any chances this will join the rally?
I dont know if you bought WRN back in may when I recommended it or recently, but it has almost doubled since May.
It has been in a rally of its own, and is up 300% in 2016, and is currently at 2016 highs today, so……………. yes?
GPL I like the set up. It is working its way higher too.
Dear Alex,
WRN i bought around 0.50cent. I want to keep it ride for higher.
Yes, Good, it is doing a nice run higher .
I said that it almost doubled since may above, I’ll edit that, , but Its actually only over 50% . Looks good though.
Dear Alex,
WRN up 12% bought some time back you recommended as gold & copper miner.
Yes, very nice longer term base on that one too. I think it can do very well over time.
Is gold on day 22 or day 4 of the cycle?
I’ve been wondering that a bit myself. It seems like day 4 of a new one, but that would have been a very short first daily cycle. I’m thinking that if it holds above $1300 on what I show in todays Gold chart as a back test, and moves higher soon, that it would be a new daily cycle.
This +/- $50 bbl oil range is where oil got hung up for the first three months of 2015 on its way down, and then again around $45 August through October. I wonder if these sticky spots are still exerting influence and defining the path back up??
Could be, and for some reason, round numbers always seem to be where price gets traded around quite a bot.
like Gold 1200, and gold 1300- price bounces around there before taking off or breaking down.
Oil worked around the 40 for a bit too, breaking over and back testing.
Wow, quiet here today! Alex, what do you think of GORO?
Quiet without Thelma and Louise
Goro / EGO / IAG / AUY all look good and seem to be consolidating. If Gold moves to $1400 in another run higher, I think they’ll all move higher too.
…
*havent even read report yet..
*get ur own material .. (above) only I can use ” * “
Ahhhhh, Get YOUR own material
*You didnt invent it
* I’ve used it for years
* Get over your self
* LOL
* Hope you still own AUMN and TRX
* READ THE LINK
*Lurker
http://www.oxforddictionaries.com/words/bullet-points
*UrSoEasy
#I’ll bet cha think this song is about you
#youresovain was
He had one eye in the mirror …
#FACTS
akg lookn tastey.. no?
and yes i do still own those…
once in a BLUE moon ….. u do find some picks
*tho ive traded the lovely witchy woman for years….. (insert Eagles Clip)
ohhh mannnnnn… i want to adddd something…
#shit…
I think there is an inverse correlation between the number of posts on CF and the strength of the USD.
LOL – Thats funny 🙂
Yesterday when I went away for lunch and came back , then saw the number of posts ( huge) I figured it was a good day for traders.
the quiet trading days get quiet
interesting observation
On quiet market days I zoom zoom zooma zoom at work like a good summa cum laude Maria should…. so on hoppin market days… Maria can play in the sandbox at CFland.
#NaughtyMaria
Silver pushing higher, shouldn’t be long before blast off. AUMN building steam,
Aumn is doing well, what about my GPL and your EXK.
Thats a tad baffling
I get the feeling some people shift from stock to stock, Maybe sell XRA and buy AUMN. Tomorrow sell AUMN buy GPL and so on.
ditto and while I am watching the oil stocks they seem to take turns – slow movers like PPA move for a few days, the medium term like ECA have a turn, and then on some days – where I have not been able to crack the code – the high flyers like NADL take a moon shot – then it’s all done in reverse.
Alex could it be GGB’s turn soon?
The chart looks good and has held steady sideways. I like the chart, but I believe they are a South American based steel company. I dont know how that’ll go economically. I do like that chart
AUMN …. Did anyone see this 2 weeks ago?
When I read it, It seems very bullish, because it clears their debt. It also seems to show the confidence that Sentient has in AUMNs company prospects for buying that much stock in the company.
I also see how it could be viewed as good & bad. If Sentient started selling in bulk, they could drop the price.
Any input from anyone is welcome.
http://www.marketwatch.com/story/sentient-group-converts-remaining-debt-to-golden-minerals-shares-2016-06-13?siteid=bigcharts&dist=bigcharts
Didn’t see it before. Not sure when I bought AUMN. I have been in and out of it several times. Today is nice.
AUMN could be forming a HS pattern but that would require Silver to break down.
I see it, but When I see a H&S pattern that plays out, I usually see the MACD really weakening and starting to cross downward as the right shoulder forms. When I see H&S patterns that do not play out, they look more like AUMN, with a strong MACD at what would be the right shoulder.
SO I have been in it for a while watching that area, and I’m staying put for now . This looks like it could be the next one that rises up to former highs and then pops ( Wouldnt that be great : )
When I look at the other break outs it had, I could see this going another 17% tomorrow.
yup, its not overbought and just recovered that 50sma. That may lure in more buyers. I feel like EVERY GOLD BUG knows this one and trades it
I’ve been looking at the SIL chart with a magnifying glass – I was into this long before my CF days!
The base to base pattern is getting interesting.
Of course it is very subjective as to where the bases start and end, but here goes:
Ground Zero in January to March 18 there was a 72% uptrend.
followed by a tight base
April 7 to April 29 there was a 43% uptrend
followed by a sloppy base.
June 3 to today there has been a 27% uptrend
but there was a 12 day consolidation right in the middle
so really there was a 16% up, then a 12% up
So we have either had two or three bases depending how you look at it.
And diminishing gains with each successive uptrend
If the pattern has any predictive value, it could mean Silver is either near the end of its run or getting ready for another consolidation/base.
I’ve got my stops tight as I have been waiting a long time to harvest some profit from this one
Or silver stocks.
Silver stocks ran like they were on fire while Silver based out. Maybe silver stocks take a breather when Silver itself breaks out . Silver itself has remained inside of that base for a while.
What a beautiful chart SIL is, with those silver miners running. Very nice,
I see BATMAN 🙂
LOL, I see it now tooooo.
ohhh .. PURRRRRFECT ….
That was an awesome Fat pitch….
*I ripped the cover off …..
I read it earlier today but like you wasn’t sure quite what to make of it – good or bad? Seemed to be mostly good…?
I read it, sounds only good to me as a stockholder. Company has no debt. Someone comes in and essentially buys 4000000 shares. It didn’t sound like they created 4000000 shares causing a dilution
Wow – did anyone see ARP into the close?
And SGY – The power of a reverse stock split?
I am so glad I did not dump SGY…they had news today of some reshuffling commitments and other good news. I am about to see if ARP is also getting some reprieve in some news.
Found this on ARP: “The company had been dormant in the Eagle Ford in 2016 but earlier this week and despite the grim financial news, Atlas received three permits to drill wells on its “Tiro Unit” lease off County Road 140 just west of Christine.” But that end spike and volume looks like someone knows something more than some permits.
I kind of like what VALE and CLF did today
picked up svm at the close
svmlf….yes, I asked Alex about that the other day….another of my HUGE loss holdings! Go team!
If it takes a run here there is no overhead for more than 2 years back, so maybe it will get on the escalator.
I sure hope so….I have many floors up to recovery where I could step out. Knowing me, if it ever got there, I would think I should hold more to actually make the profit I thought I would have! Stubborn? Greedy? Optimist? Glutton for punishment?
You are optimistic, and if the Bull has returned you should be fine.
You must have nerves of steel holding on THAT long.
Another late bloomer that looks like it may be breaking out of a 5 month consolidation
I have this from years ago at a huge loss….I sure hope it goes back up to the top of your chart!!!
Hey Mark,
I have a reader here that has been accumulating that one and emailing me about it. It does look good and PPP used to be a good company .
If it breaks upward, I may take a position. I’ll put it in the next report too.
Thx
I wonder why PPP has been left out on the cold? I bought it as a laggar once and sold about breakeven or so when nothing happened. I had removed it from watch list. Might add back if,she breaks out.
That’s exactly my concern.
We just had the mother of all rallies in Miners, and this remains at the lows .
IF IT DOES BREAK OUT – Thats another story, I would approve, but I need to see a sign of strength first, or one could ride this base for as long as it takes .
By the way, I did get XRA and GPL and bought AUMN earlier in the week. All essentially starters, if we (ever) pull back I have more cash to deploy (especially if energy cooperates!!).
PPP has had several problems, which you can read about in the Q1 financial report: First, their production is lower in 2016 due to having to install safety equipment. It’s just now ramping back up; they have some sort of legal itax ssue with Mexico, so there’s that overhanging the story; they also inherited a deal with Silver Wheaton for offloading silver at $4+ per ounce for the fist 6M oz, then 50% of additional silver mined. They hit 6M this quarter; lastly, they just floated additional shares, then turned around and bought adjacent property to their main, San Dimas mine. With all this negative backdrop, it it breaks up, out, of this consolidation that should be an indication that the news is baked into the stock price
great report Dr. ChartFreak
Luv Luv Luv … the lesson section.. 🙂
Good, tonight’s ( or tomorrow morning) will be one big lesson 🙂
Yay :o)
Silver is absolutely en fuego!!
Sure hope that lights a fire under GPL and EXK! 🙂 🙂
Me too, I have both. Hasn’t even dipped enough for me to add, hope we get that chance sometime!!