
A Closer Look
So far this week is pretty much playing out as expected with the combination of the Fed testimony and the upcoming Brexit Vote, but a comment by Tess in the chat area had me wanting to take a closer look at Precious Metals. Things are still exactly as expected, but a slight variation in cycle count may be in order. Lets have a review of our markets first…
.
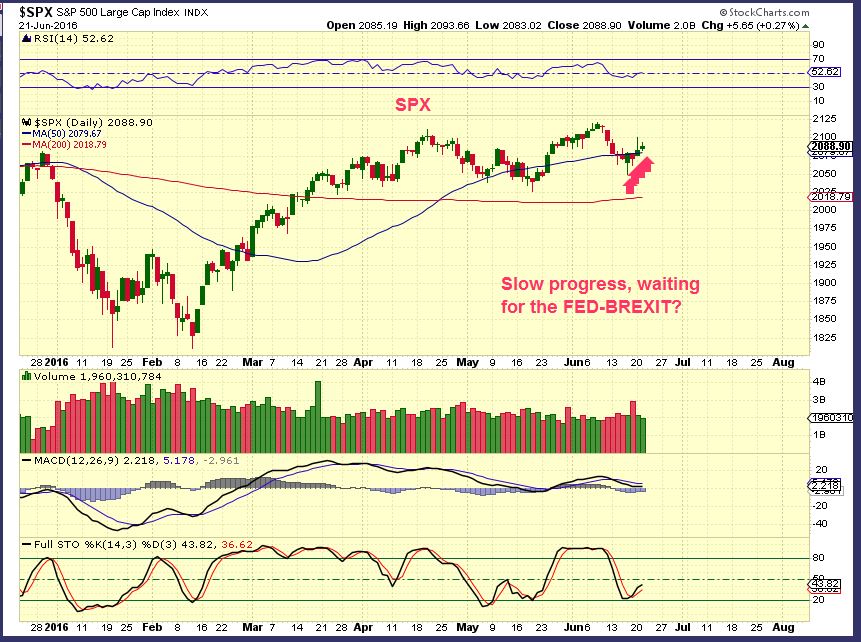
SPX– As expected so far
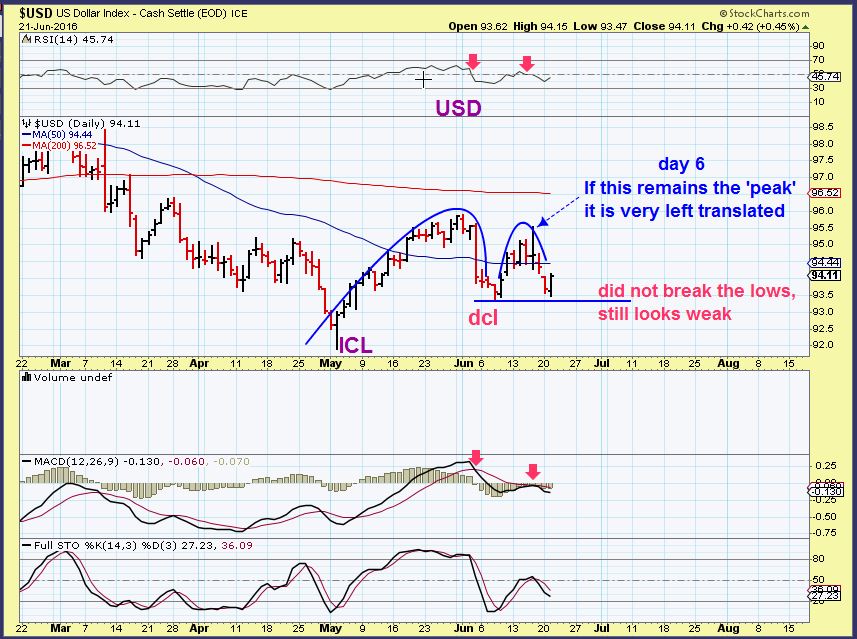
USD – We are seeing a fairly weak run out of the dcl, and it almost broke the lows today. If Day 6 remains the peak, this is going to roll over as left translated and will break down. If the dollar breaks down from here, it has a long way to go ( and Precious Metals should benefit).
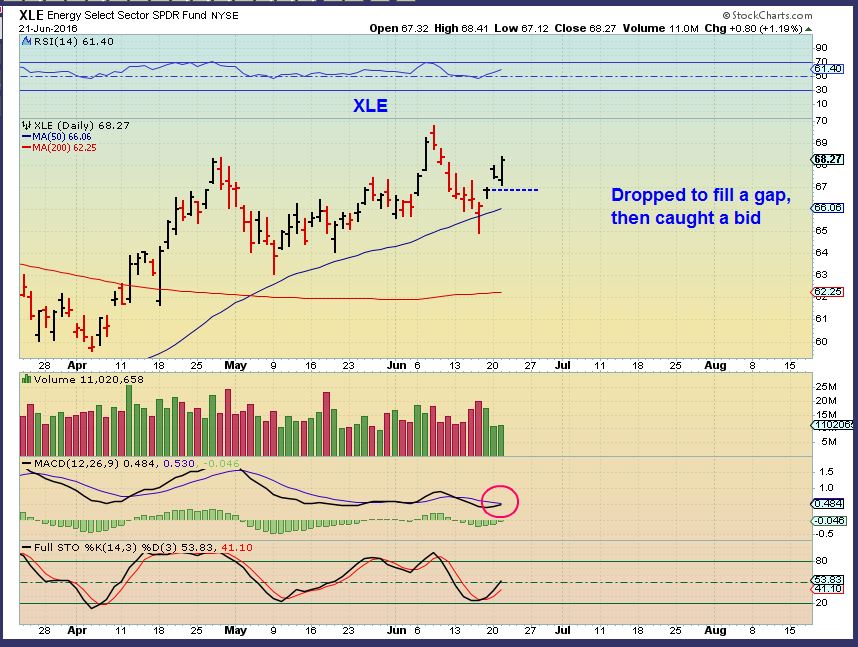
My view on Oil hasn’t changed since yesterday and the XLE filled a gap and then caught a bid. The XLE remains bullish.
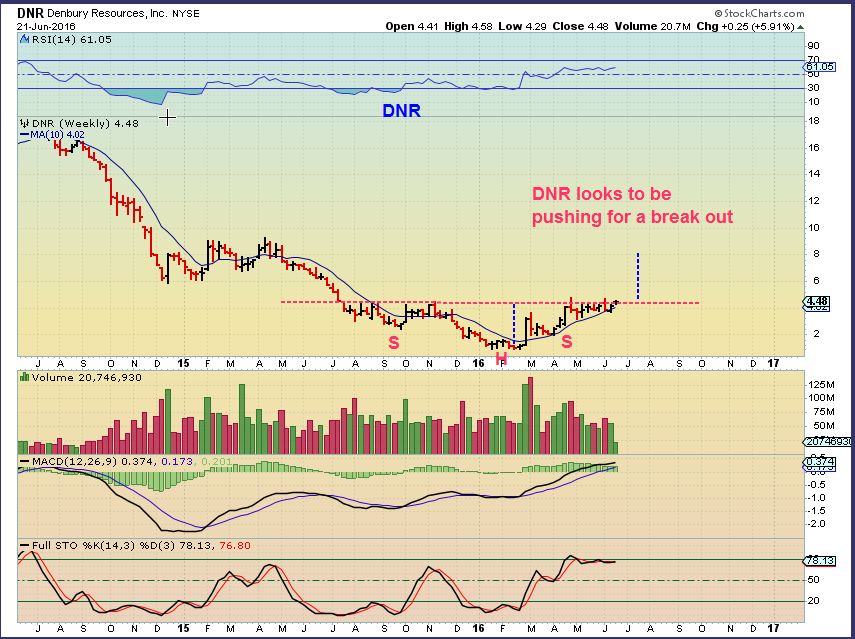
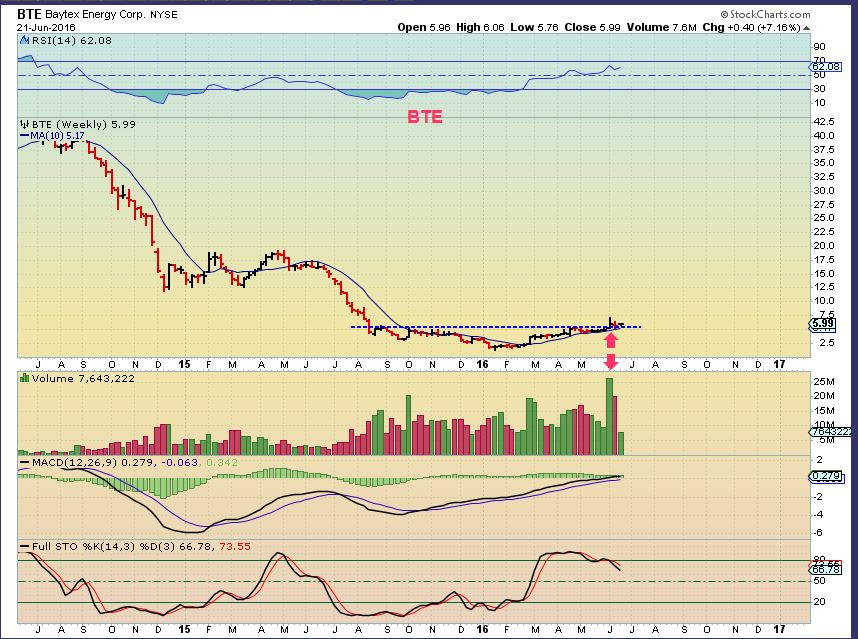
DNR and BTE are still good daily set ups, and as mentioned in prior reports, they look like they are breaking out of nice bases, so I thought that I would show 2 charts of their long term bases for the sake of the longer term investor.
.
I mentioned MRO in a report, and it now looks very very good. High volume and set up to break out. It is still a buy.
.
Now lets look at GOLD, GOLD, GOLD, GOLD, SILVER and the 2 GDX Charts 🙂
.
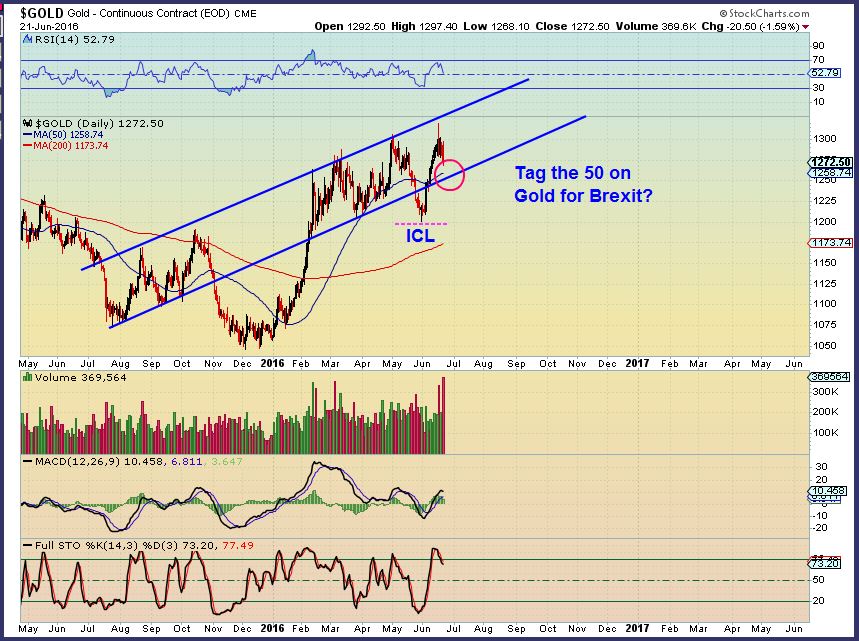
EDIT: Gold hit $1262 overnight, just above the 50sma.
.
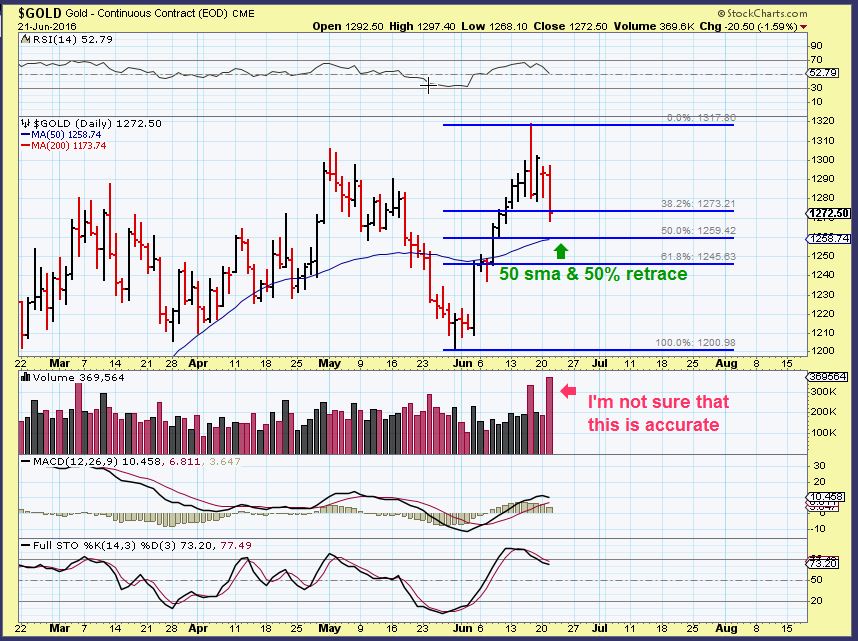
GOLD – I looked up Gold and that volume just doesn’t look correct, but I marked up the chart anyway. I wanted to show that a continuation of this dip that we are seeing is a 50% retrace at the 50sma.
GOLD – I checked the chart later and they corrected the volume. Again, a simple dip to the 50sma is possible, but with BREXITs vote ahead, I see many do not want to buy here or hold going into that vote. I hear talk of a test of the 200sma being in order, but Cycle count dictates that an ICL formed back in late May. THAT low cannot be taken out without serious implications.
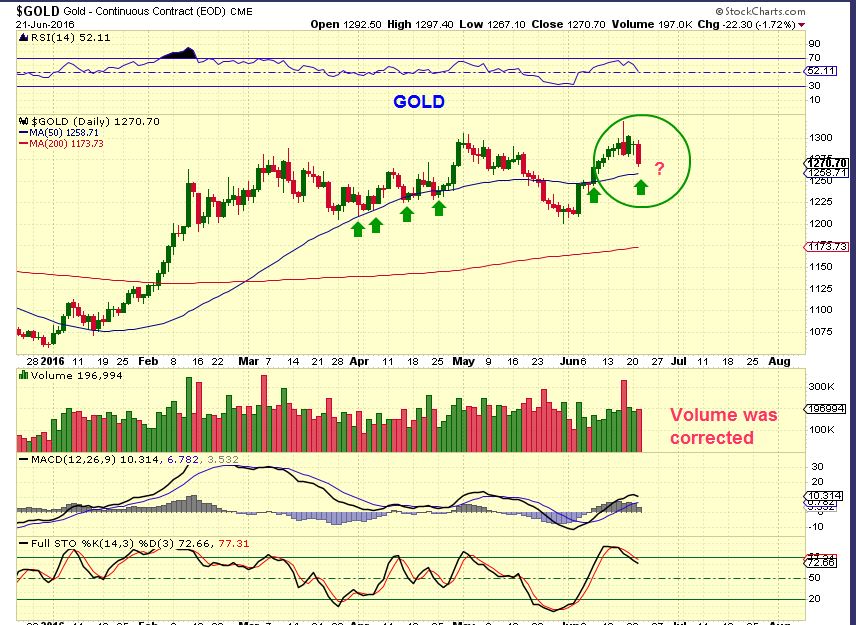
I was asked about GOLD testing the 200sma. Question: “Isn’t it normal T/A for the 200sma to be tested after it is broken?”. Answer : Yes. My thinking is…Does it have to happen right away? my answer, No.
.
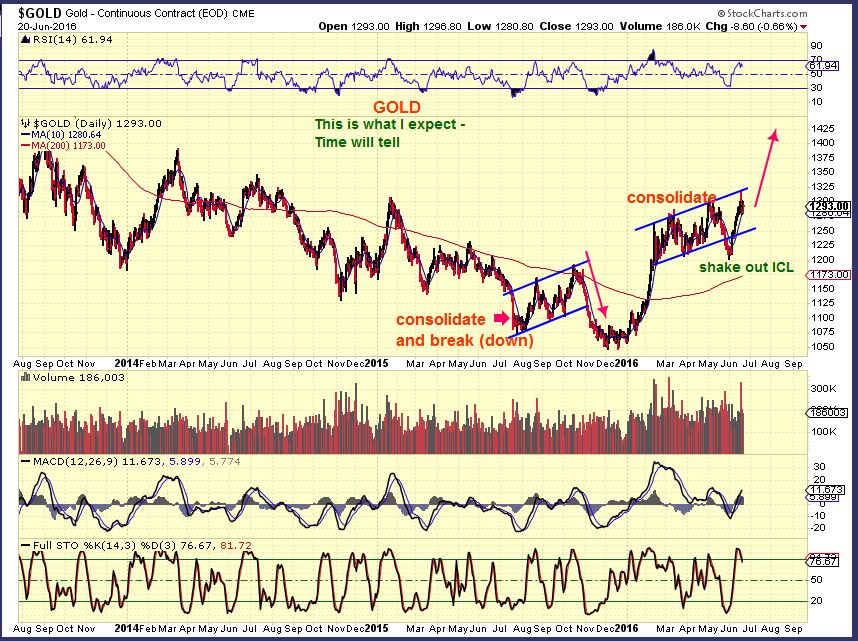
GOLD – My idea of how this could play out as I expect it to, and still ‘test’ that 200sma (later).
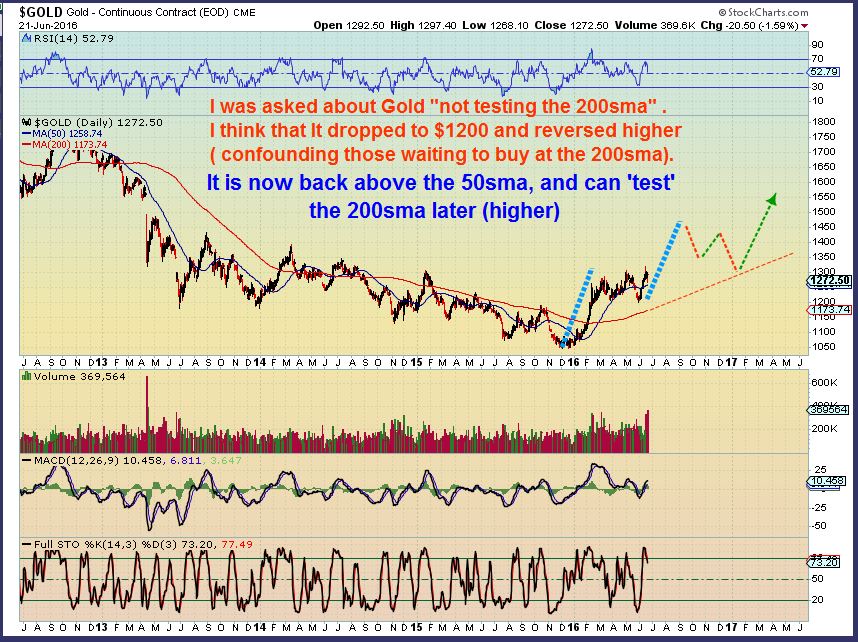
GOLD – At this time, this is how I see GOLD, with a tag of the 50sma (maybe even a break below as a shake out on Brexit slam down?) and then higher.
I showed this chart in my Monday report
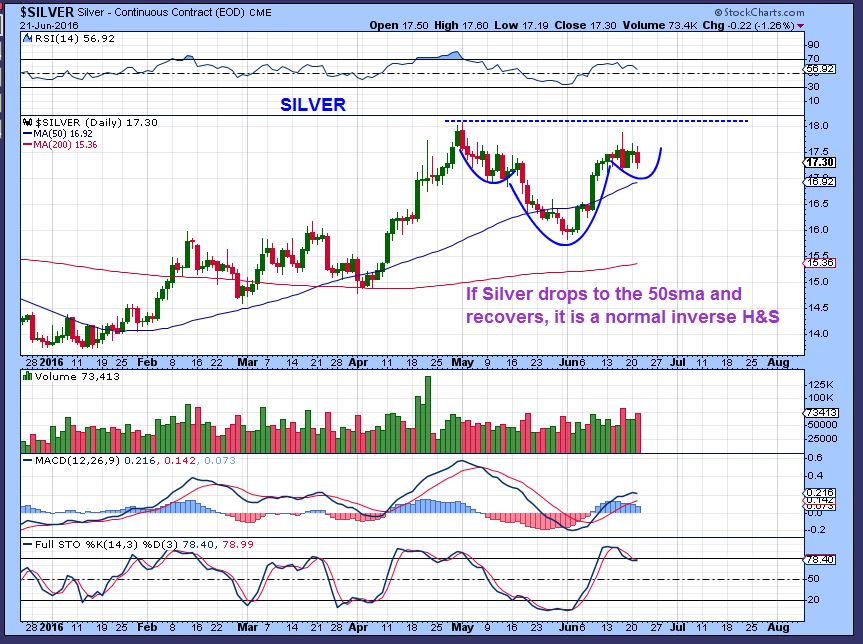
SILVER – Silver could be forming a normal bullish consolidation called an inverse H&S. A drop to the 50sma here is also normal.
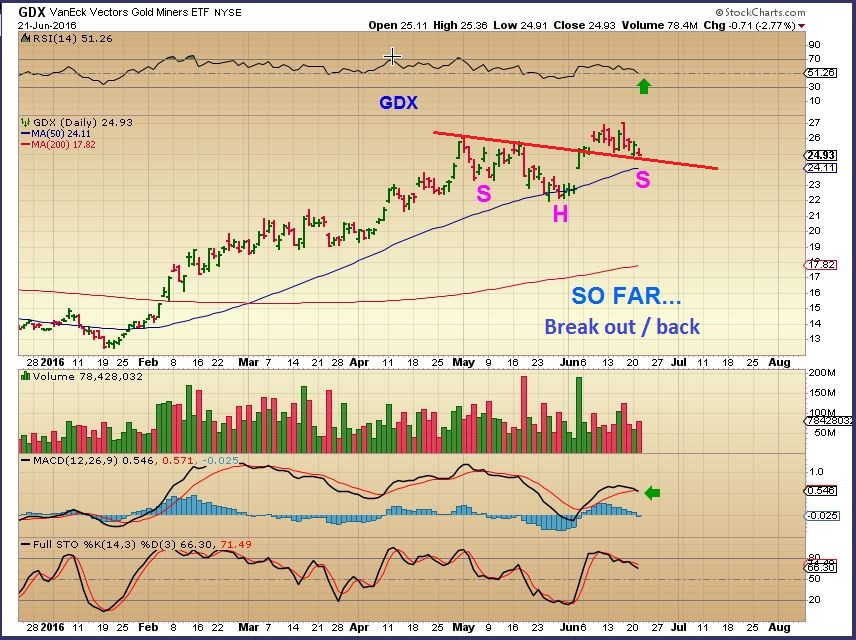
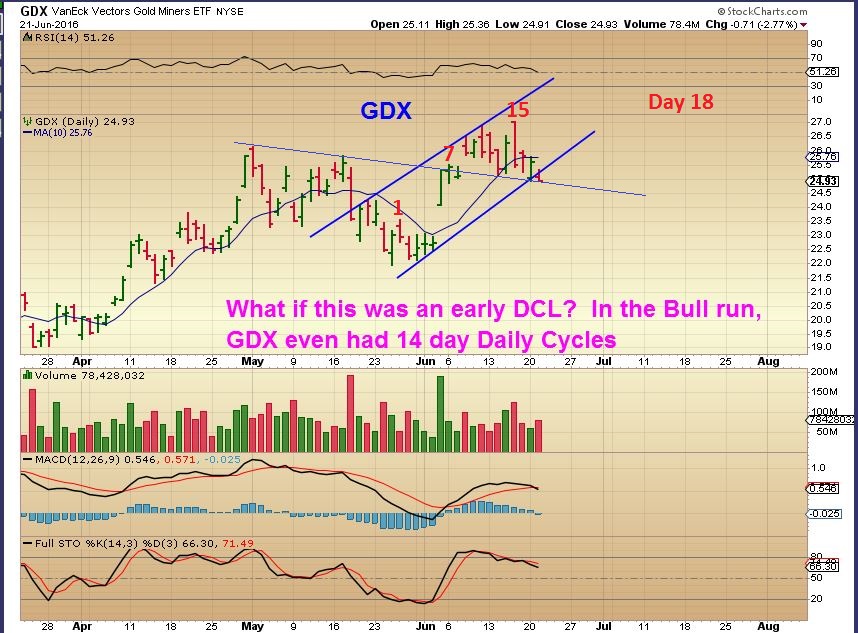
GDX – This is how I have been viewing the GDX. Again, a test of the 50 sma is normal , and I try to imagine a ‘shake out’ below the 50sma and filling that gap, but the lows of May should not be broken.
In the comments / chat section, TESS wrote ( and I commented) …
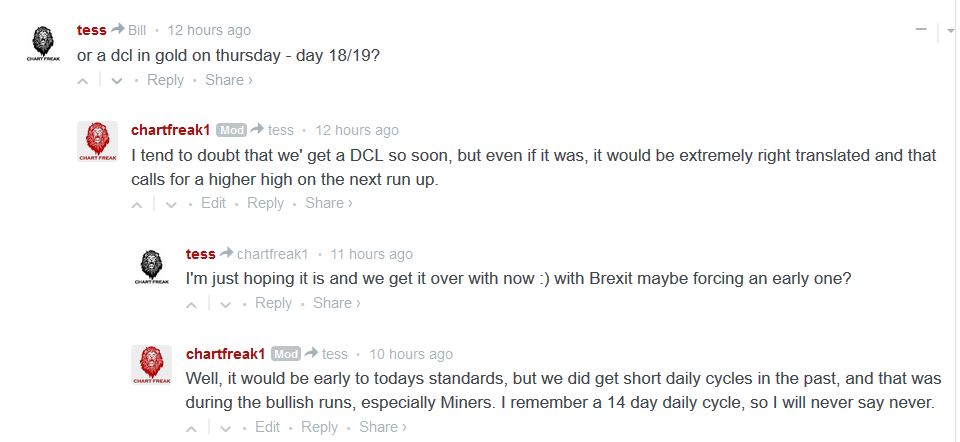
I do remember DCLs coming as early as day 14 on GDX after 2008, so I decided to look into that count a bit further.
.
GDX has broken below the 10sma, it has broken a trend line, and it could drop further Wed & Thursday. Conclusion: Yes, this could be falling into an early DCL, and then we rally higher. As I mentioned in that discussion with Tess, IF this was an early DCL that bottoms in this area, it is still an extremely right translated daily cycle. Those lead to a break out to new highs.
‘
So here we are on Wednesday of a rather tricky week, but so far things are playing out as expected. This is just one of those weeks that we basically have to wait until Friday to see how things really are going to play out. After the Brexit Vote, the markets will likely become less sideways and more directional. By using Technical Analysis and Cycle Analysis, we are trying to gain an edge, and I am bullish Energy and Precious Metals.
.
~ALEX


If LGCY ever gets going again we could see a 100% gain.. I’m looking at a bull flag with an AB=CD pattern to $4.50
https://www.tradingview.com/chart/LGCY/9TmwUlZk-LGCY/
Still holding. I’d love to see this happen.
Are you in this? I did well last time I traded it but it was a weak company as I recall, and not much volume.
Im in it! Did so well last time. I don’t like the FA, I was hoping to catch a quick pop. Might have to rethink my plan.
Yeah, LGCY shook me off already. But if we get another dip in CWEI, I’m going to add; order is already in!
LGCY down more today the the 3X leveraged energy ETF?
LABU touched below 27. can we initiate light position?
woo hoo… 😉
Agree Siva, LABU, XBI look ready to run. I like to see a ‘frying pan bottom’ process that X and CLF had before their most recent runs but the biotech ETFs don’t seem to work that way. It’s been quick bottoms then boom!, nice run. And it looks like we may have that setup again. Alex, any thoughts?
I just looked at the intraday chart, and you were right “Boom” on XBI & IBB
Not siure what caused that burst, but it was with strong volume
…the plane was coming in for a landing….. we shall see if it reaches it’s destination safely….
#stopsRourFriends
https://www.tradingview.com/x/h1tgRz1z/
You are seeing a 261% retracement from here?
well… IFFFF that’s a “1” – u see the ? … the full wave sequence is ‘generally’ 261%
my little 2? is getting ground into the dirt right now.. sooo.. could just be an extension coming …
orrrrr my count is off… which we all know THAT is a possibility… ;o)
#MariasBatcave
Does EVEP have the same pattern?
idkl… i would have to look later…but time is crunched 4me so dont hold ur breath ;o)
ps. is that u buying up that 1.94 area w/ all ur hemanSize Tx wealth this past 2 days in lgcy…
MEOW
Looks like a regulatory headline caused the buying flurry.
http://www.zerohedge.com/news/2016-06-22/biotechs-surge-favorable-medicare-decision
Well, well Alex…. Eine Gute Morgen.
It’s an encouragement to read your report Alex.
Thank-you very much, see which directions we go this week with the Britain.
check out the SDRL one minute chart – lots of action today – I like this way better than LGCY. There have been so many bk’s in the space and LGCY just keeps grinding lower.
LGCY is off my radar for now. It sure was awesome a few months ago but for now, just not interested.
I was going to take KGC off my watch list for bad behavior, but then thought different. So I am watching it as possibly a harbinger of when things will turn up again with gold.
What a difference from this morning until now. I am starting to see some green! 🙂
Rough day on oil – I don’t understand how the API and EIA data can be so far off from one another. I guess it’s alright if the EIA data was crappy, but why they would disagree by 5M barrels is beyond me. Makes it sounds like both sides close their eyes and just guess. And if they do that, why do all of us smart traders move millions of $$ every Wednesday on random gov’t and industry guesses? Anyway, I’m adding more energy on weakness! Gold/miners? Waiting for more data. I’m probably killing myself with commission but I’m slowly just added a little bit more on each pullback!
Alex, still like X and CLF here? I think CLF is consolidating and waiting for moving averages to catch up, but boy they are still really far down there, this could go on for awhile? Missed my add to X today by a penny. If we have any weakness tomorrow, I’m doubling down!
There’s nothing wrong with them chart-wise. Brexit can cause volatility though.
Still like them, too. I’m definitely more worried about headline/need risk than anything I see in charts. Focusing on energy the most currently.