
MAY 8 Weekend Report
We will discuss the Theme Picture later in the report, lets get right into our market review…
.
SPX – We are expecting and late for a DCL. The SPX tagged the 50sma and put in a small reversal candle. I believe that we are about to get a move higher.
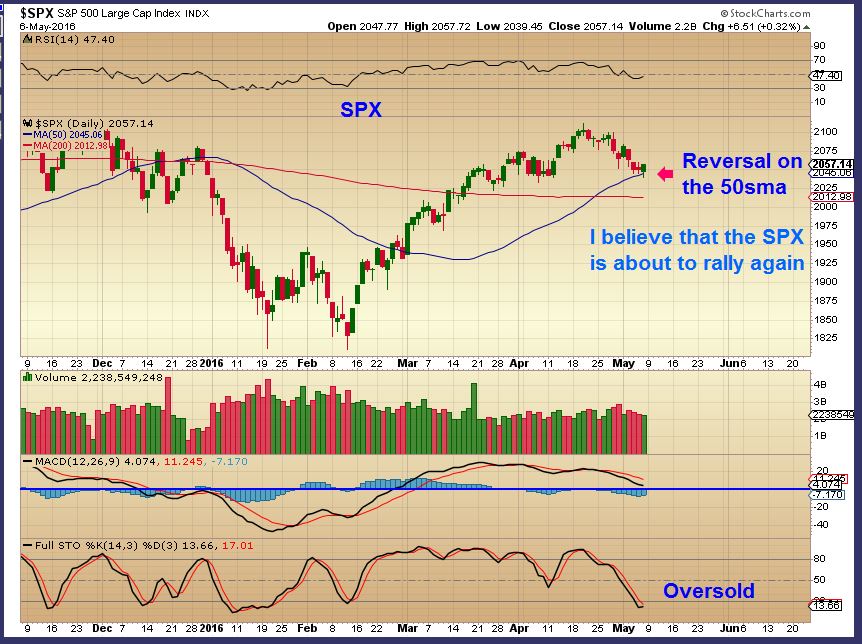
That calls for a look at the bigger picture…
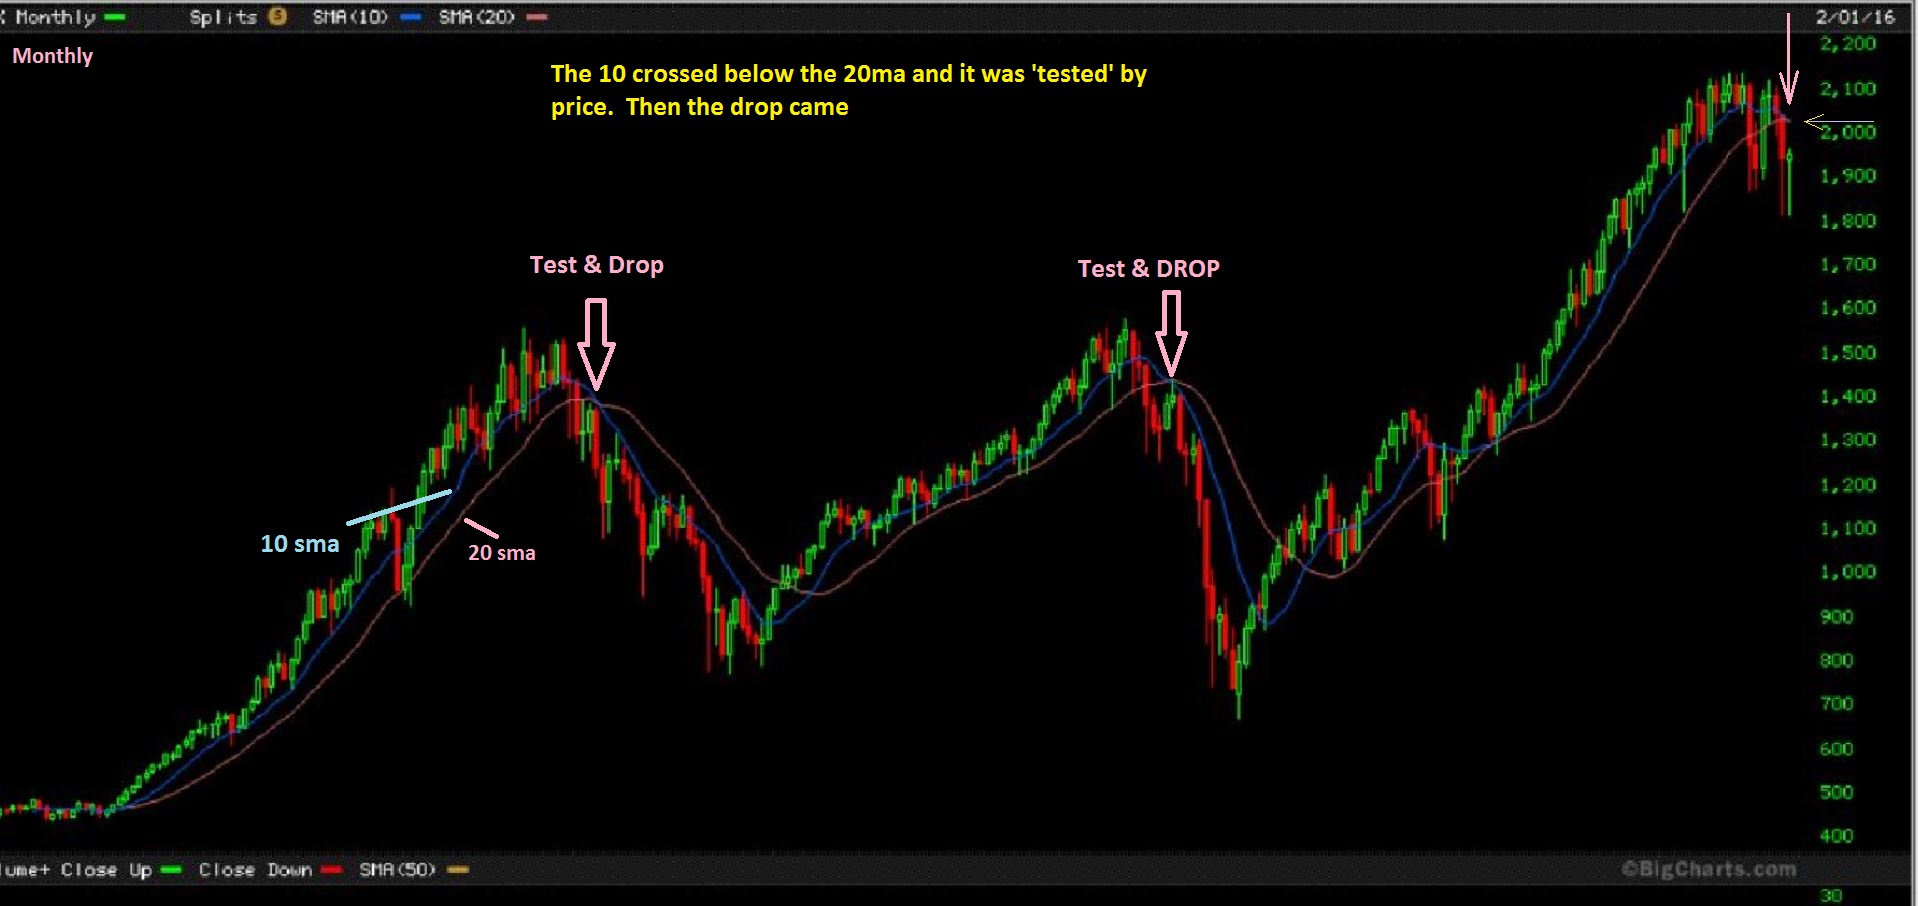
Using this MONTHLY CHART , I have pointed out several times what to look for in the big picture, especially if we are seeing the selling we saw early this year and thinking that we may be forming a top. This chart had shown our anticipated break down, now we needed to see if it could recover or just make a short-able bounce. Use the 10 or 13 MA and look for it to be rejected or recovered . Click to enlarge any chart.
The SPX MONTHLY – This shows that the markets have regained the 10 and 13 MA at this point. Since we are expecting a new 2nd daily cycle to start, we would look for a possible break out to new highs. ( A prolonged Sideways move through out the 2nd daily cycle here would seem bearish).
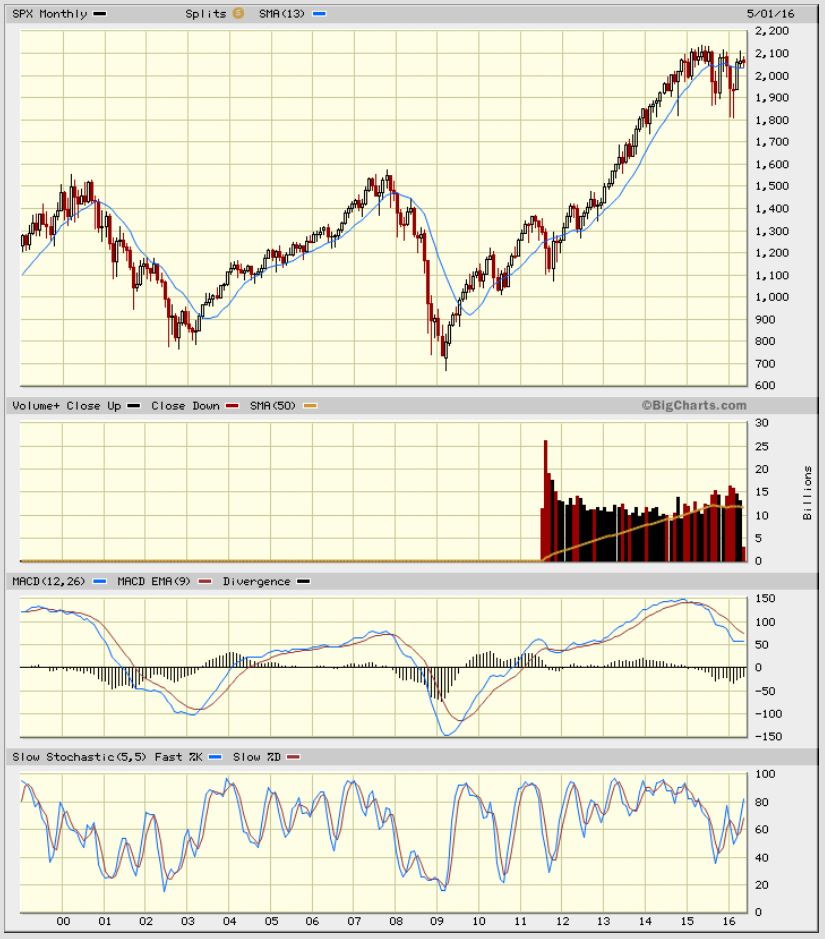
OTHER SECTORS of the markets are lagging, so there is not a strong indication that “everything is all bullish again”. The former highs for the general markets were made back in the Spring of last year, and some areas have a lot of work to do. Lets take a look.
.
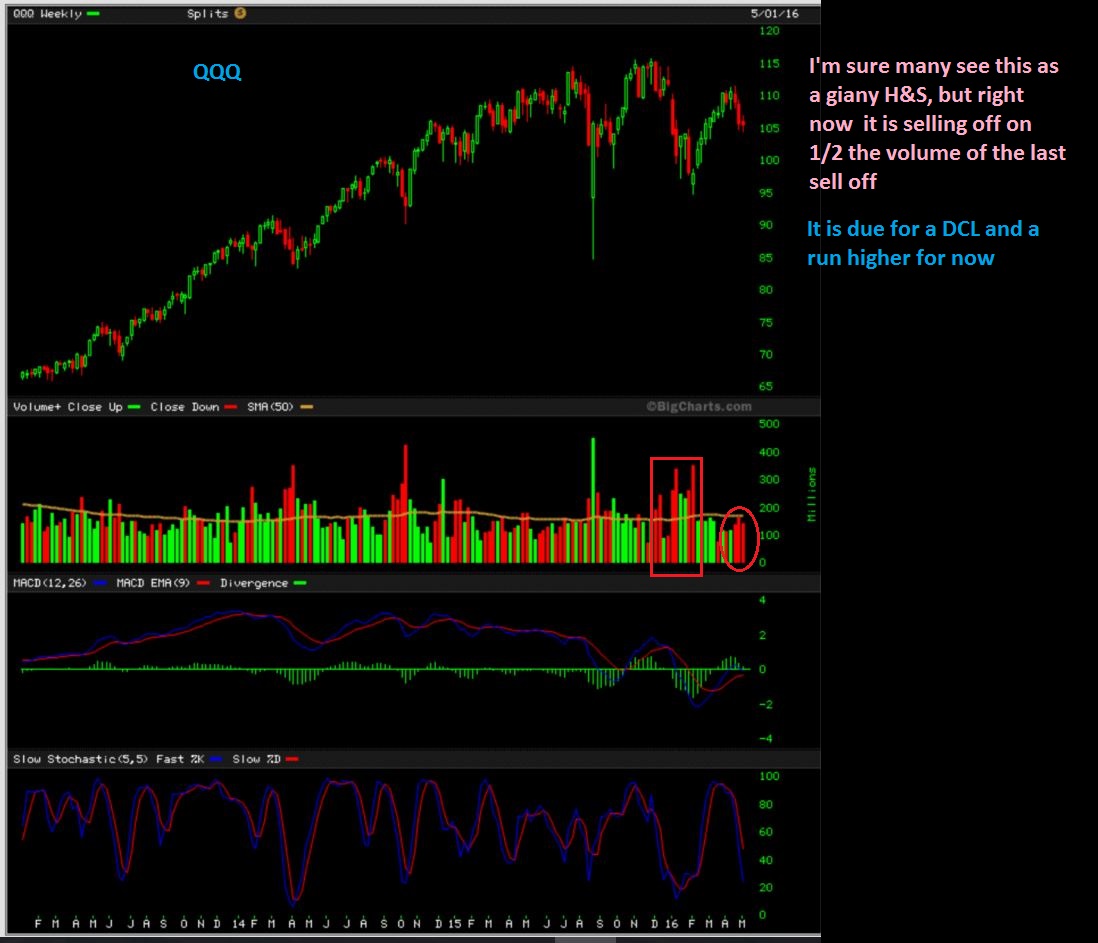
NASDAQ ( QQQ) – Also due for a bounce or rally here. So far it has been weaker, but the volume selling this time has also been lighter. We’ll see if it can put in a strong bounce or show continued weakness. Lets play ‘Spot the typo ‘ – I see a few on my charts today. Sorry about that.
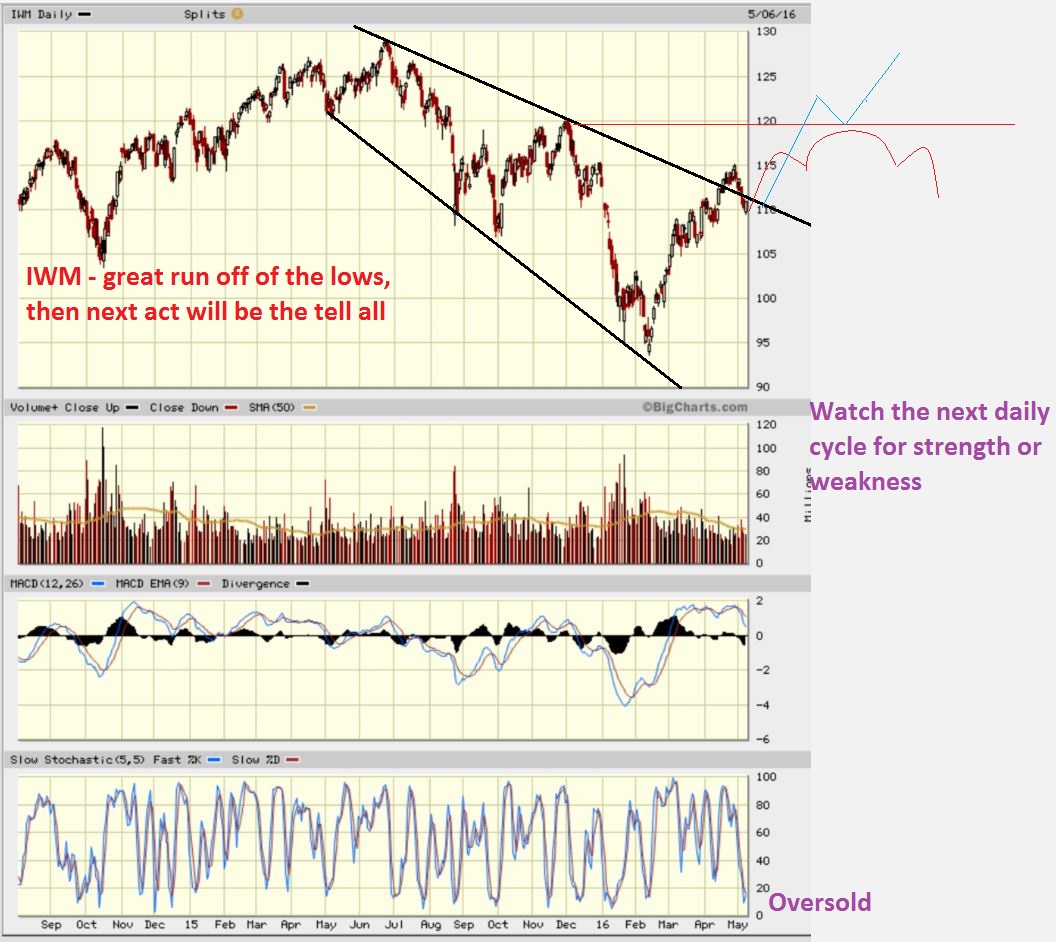
IWM –
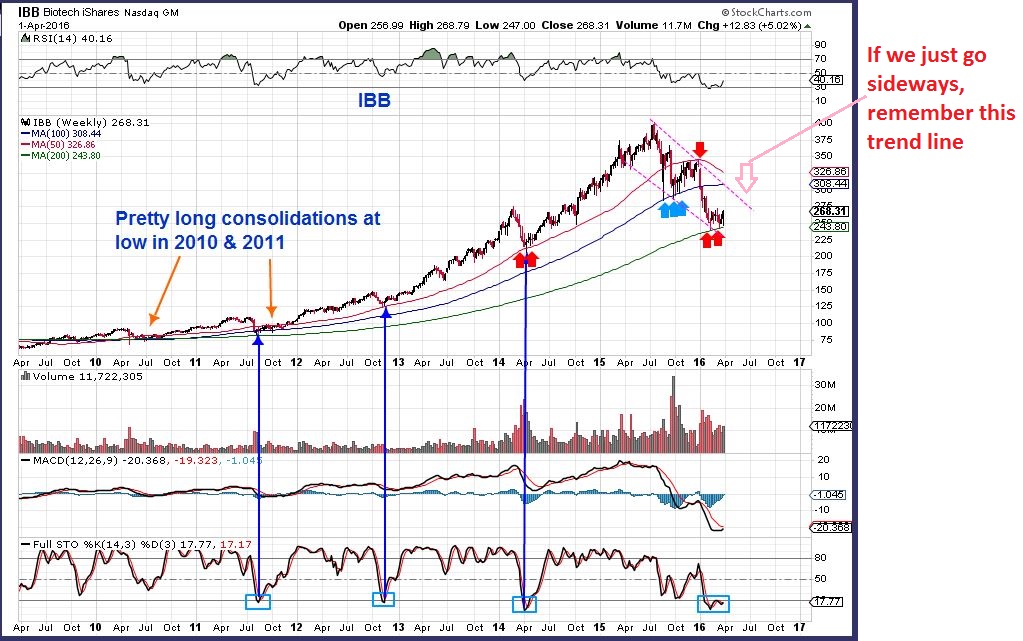
IBB – I Used this chart to point out what I think or though was a nice Big Picture bottom for the IBB. 2010 & 2011 had long consolidations. Notice the Pink CHANNEL . The IBB broke out from that base and looked promising too, but recently…
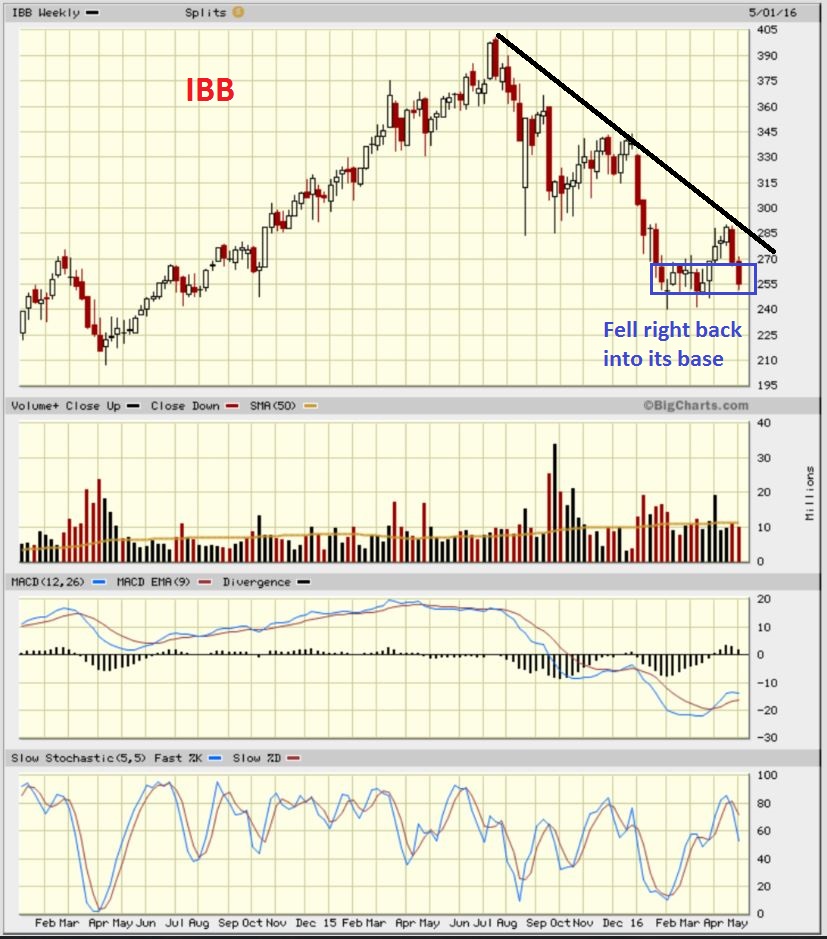
IBB – It’s a sideways move and at this point is taking on the look of a false break out from that base, and now it has returned to that base. I’m no longer interested in this trade until I see it prove to me that it is healthy. The MACD remains healthy.
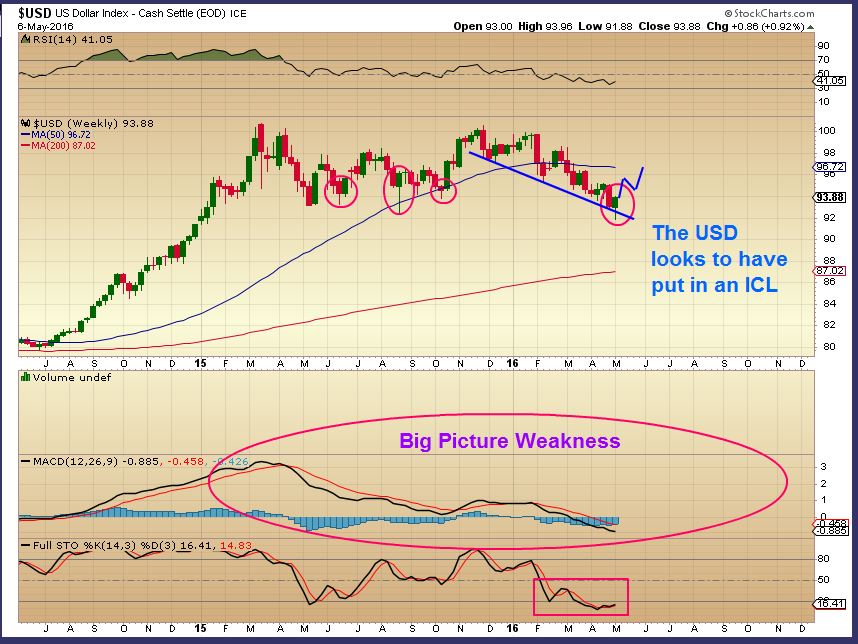
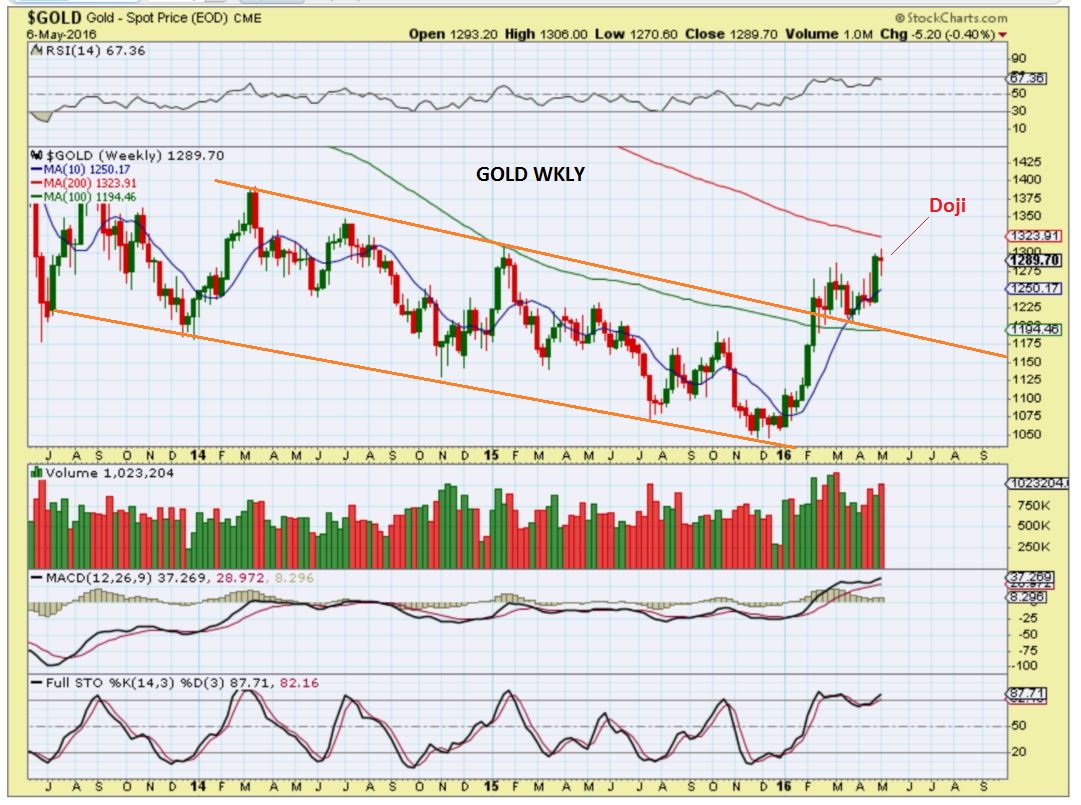
USD WKLY – In past reports I mentioned that we should expect a dollar bounce and that MIGHT help Precious Metals begin a decline. We see a Reversal candle in the Dollar. Note: Gold may F-I-N-A-L-L-Y have one on the weekly top too, we’ll see that later in the report.
.
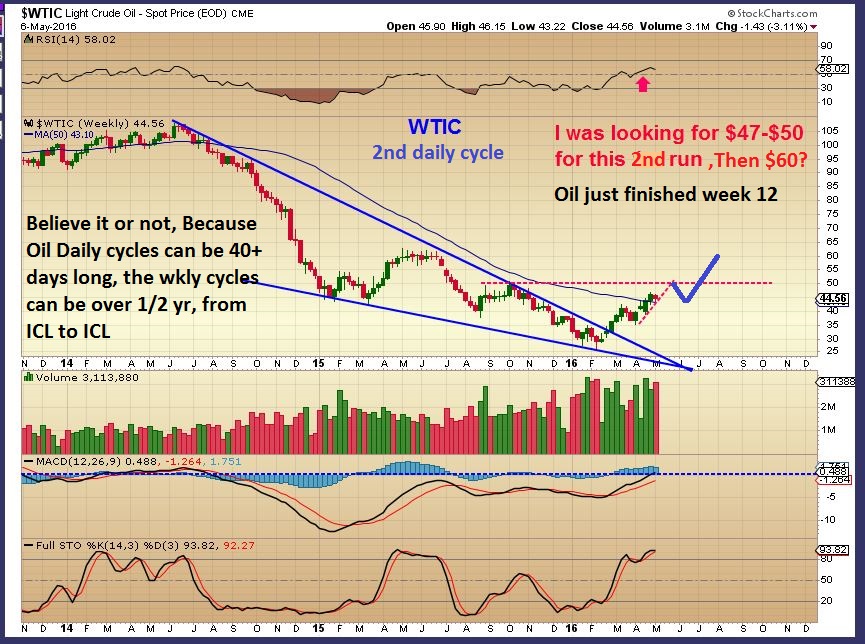
WTIC WKLY – Read the chart.
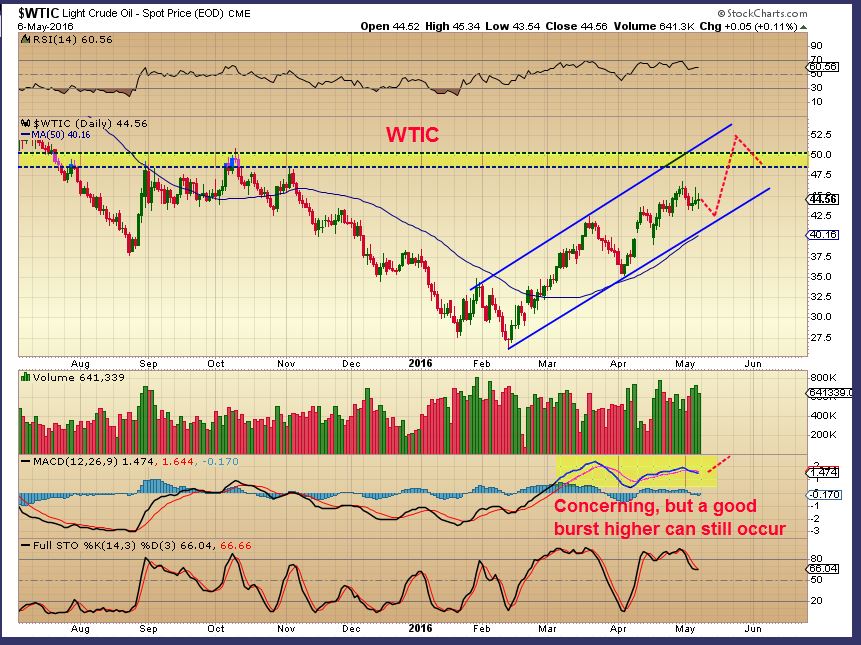
WTIC DAILY – Just an estimate.
.
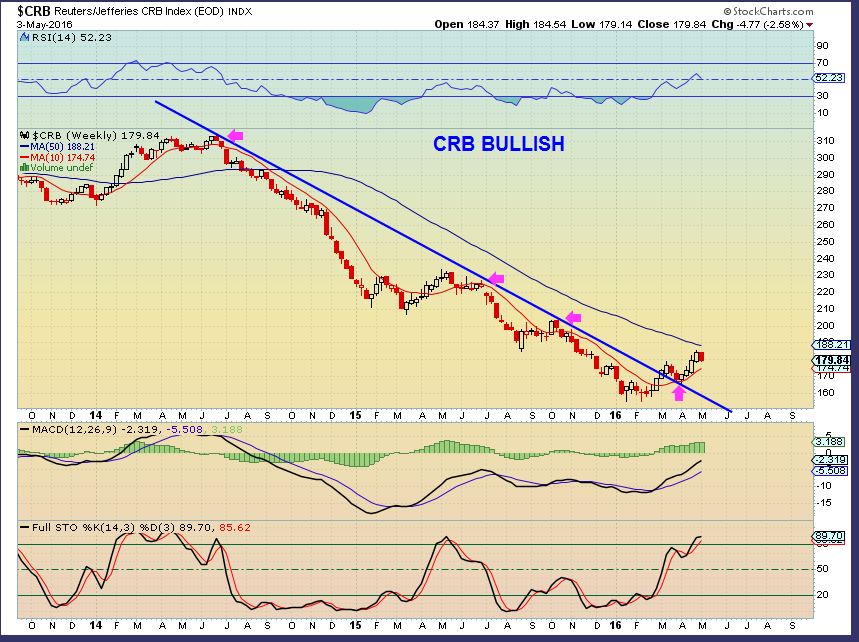
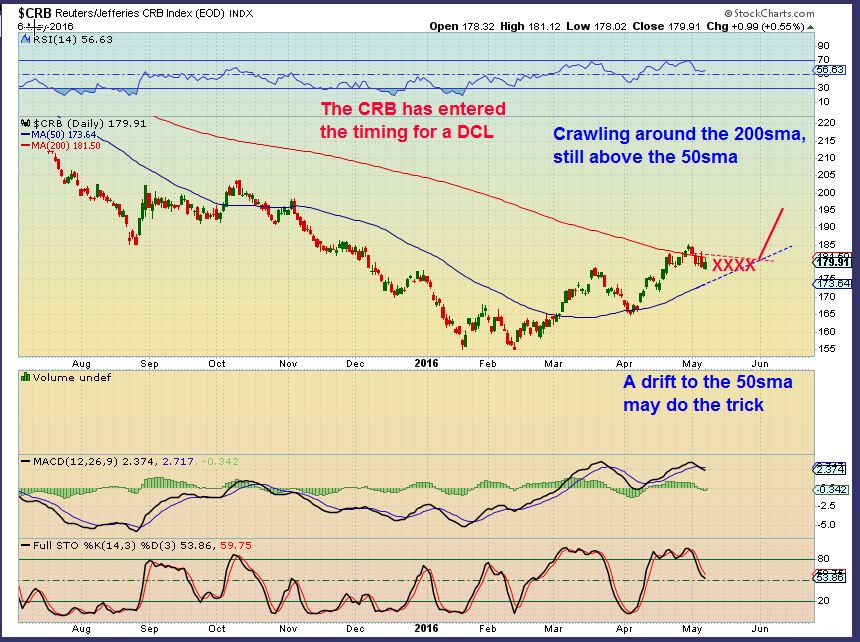
CRB WKLY May 3 –
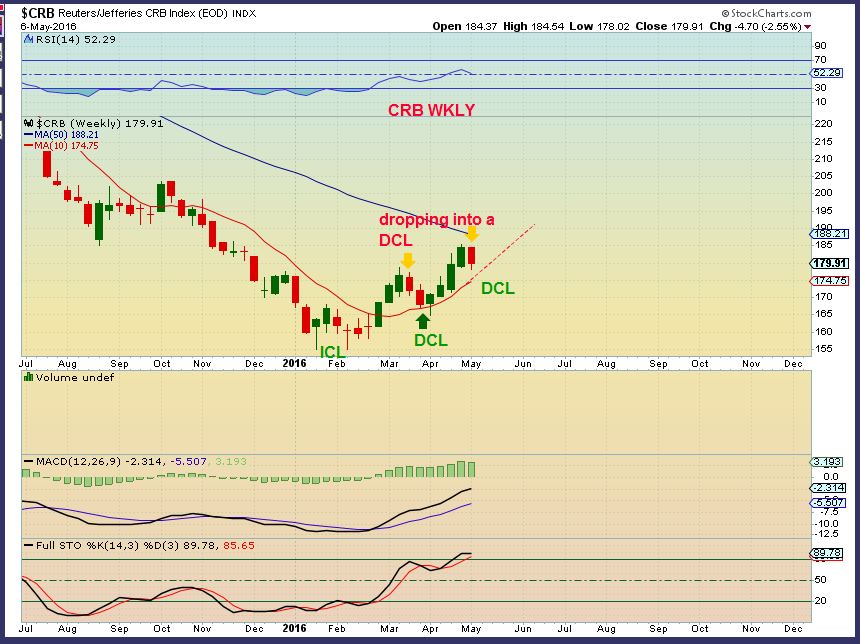
CRB WKLY MAY 6 – I want to see the 10 MA hold on a wkly closing basis to remain bullish. In April we broke it and regained it on a wkly close.
CRB DAILY – I showed this updated view in prior reports, and so far it is still holding up near the 200 sma.
.
GOLD & MINERS
.
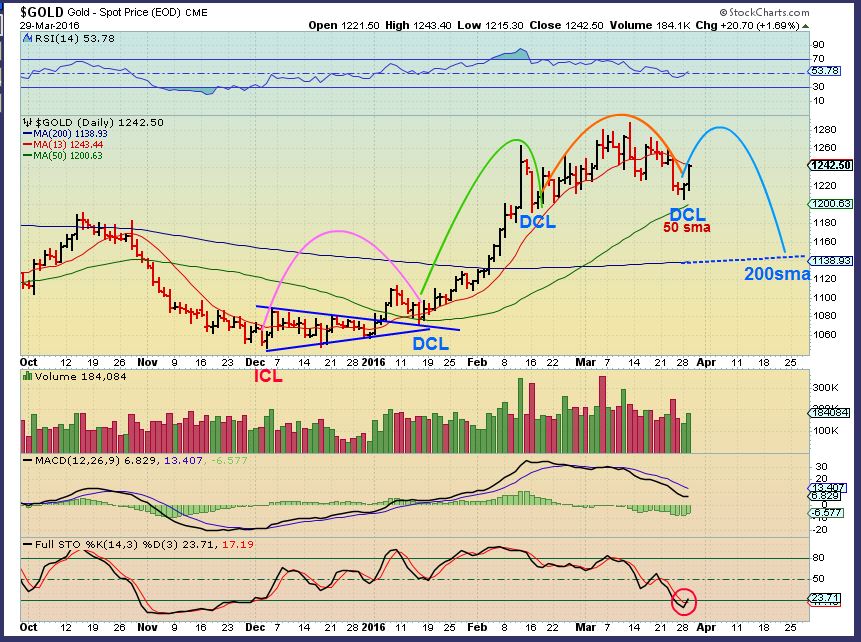
GOLD WKLY – As mentioned, the USD had a reversal Candle at the lows this week. This Doji may be a reversal candle for Gold if their movement remains inversely related.
.
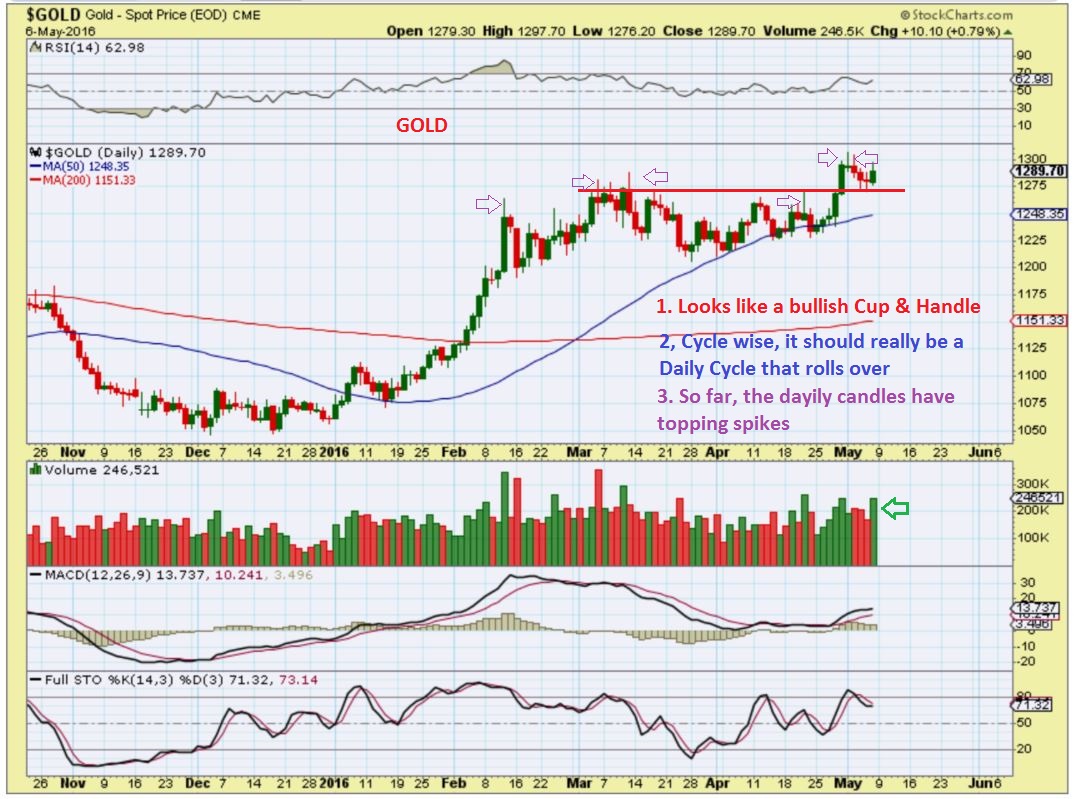
GOLD DAILY – I must say, however, this gold daily chart looks bullish. Next week will reveal if this is a real cup & handle after a consolidation or a false break out with the $USD about to rally. Read the chart. Typo #4 🙁
.
This is how GOLD came off the bottom in 2008. Like the Theme picture of the bouncing ball, in CYCLES, every bounce doesnt just get stronger and stronger. Usually the first 1 or 2, maybe 3 daily cycles can bounce to newer highs, and then they lose steam (buyers) and drop to an ICL. We are waiting for that now. From the ICL in 2008 , we saw 4 daily cycles, 3 bounced with higher highs, then the 4th rolled over. We want to be ready to buy if we see this kind of drop.
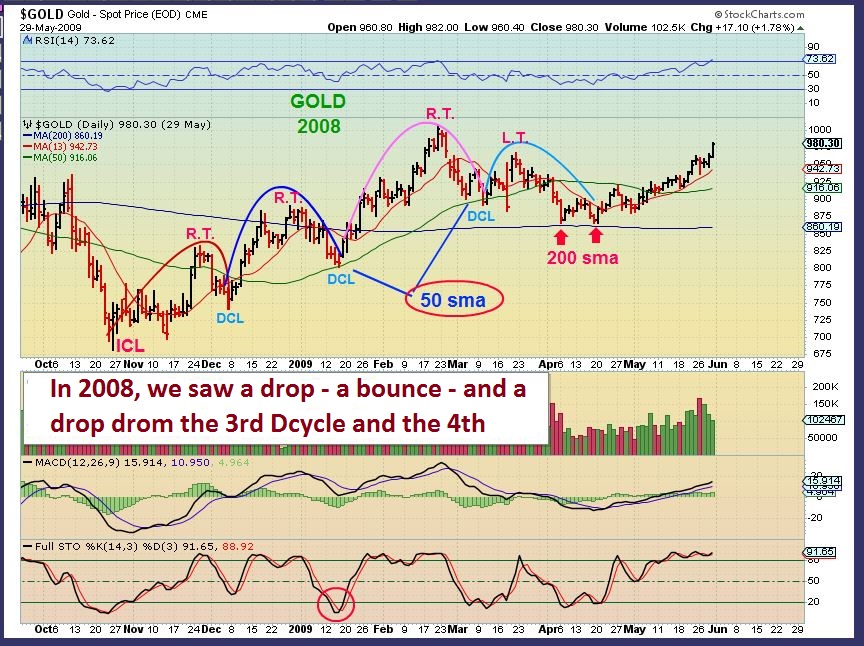
I actually drew the above chart and this one on March 29 for a report and didn’t post it . This was me expecting the pull back in the 4th daily cycle in 2016, just like we saw in 2008 above. Like the bouncing ball, I expected it to lose steam in April as shown, but it just made a higher high again. We have now added a 4th daily cycle that remained bullish. I still expect a drop and a 5th daily cycle should be it. I dont think I have EVER seen a ‘6 daily cycle’ Cycle. We usually have 3 or 4 daily cycles, maybe 5 in Gold.
.
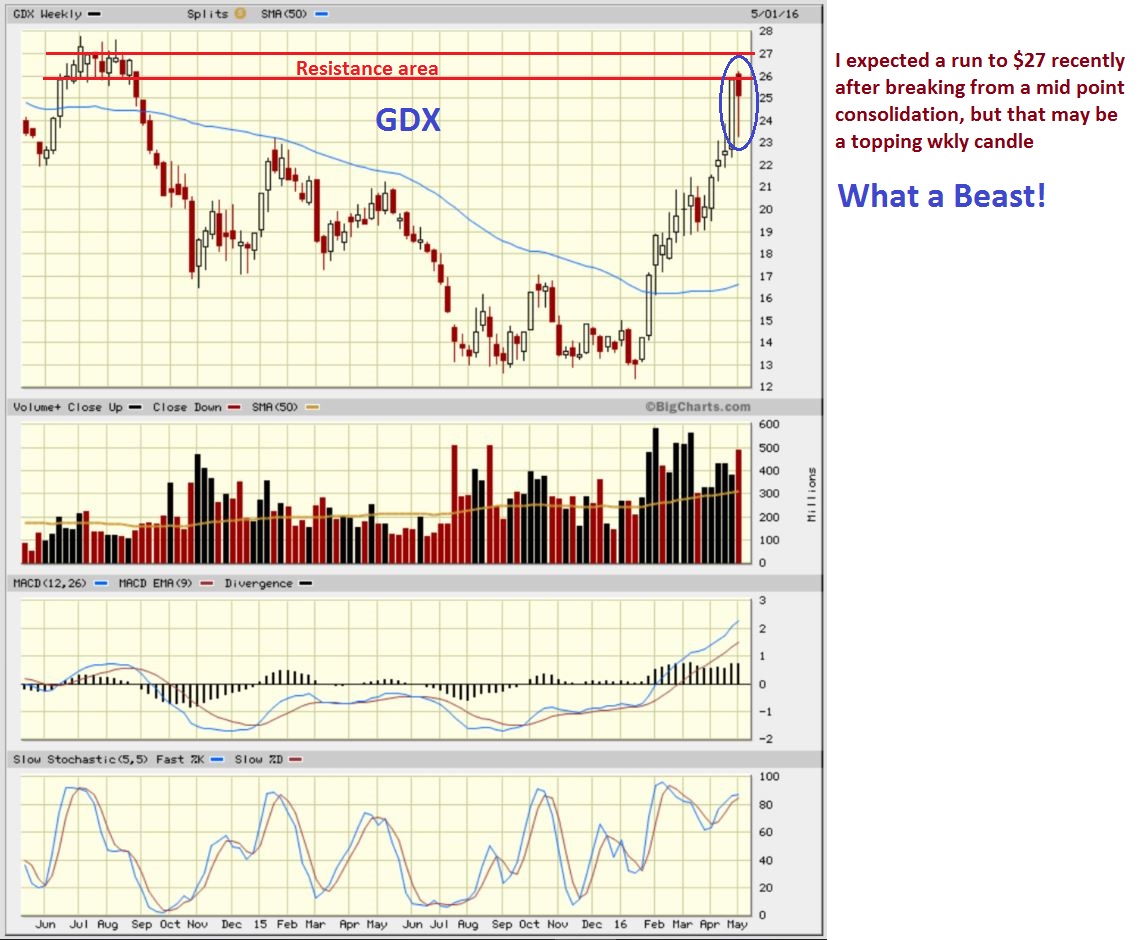
GDX – Read the chart.
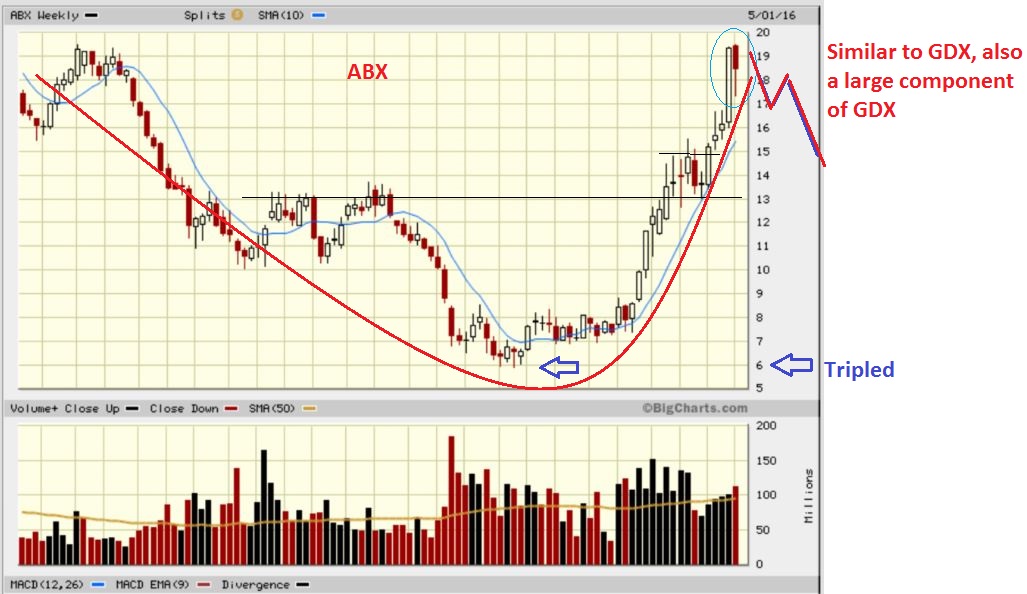
ABX – A major component of the GDX looks to be finishing up. A Pull back could form a handle.
.
Now I want to review some weekly CHARTS of some of the stocks that we may be holding. I want to point out what I am looking for and looking at. What I might be loving, what I might be hating about them. THEN…You can apply the same ideas to what you may be holding.
.
NFLX EXAMPLE: Left side of the chart – Big sell off maybe $40 to $8, then a base.
If it is recovering, You want your weekly runs higher to close over the 10 MA on a wkly basis. It’s not the end of the world if it doesnt, but many use this as a gauge of a real recovering stock, or a healthy stock in an uptrend VS a weak one. So I look for that at the start of these runs. IF You are over the 10 and 30 MA- That could be trending higher and viewed as BULLISH. Read this chart.
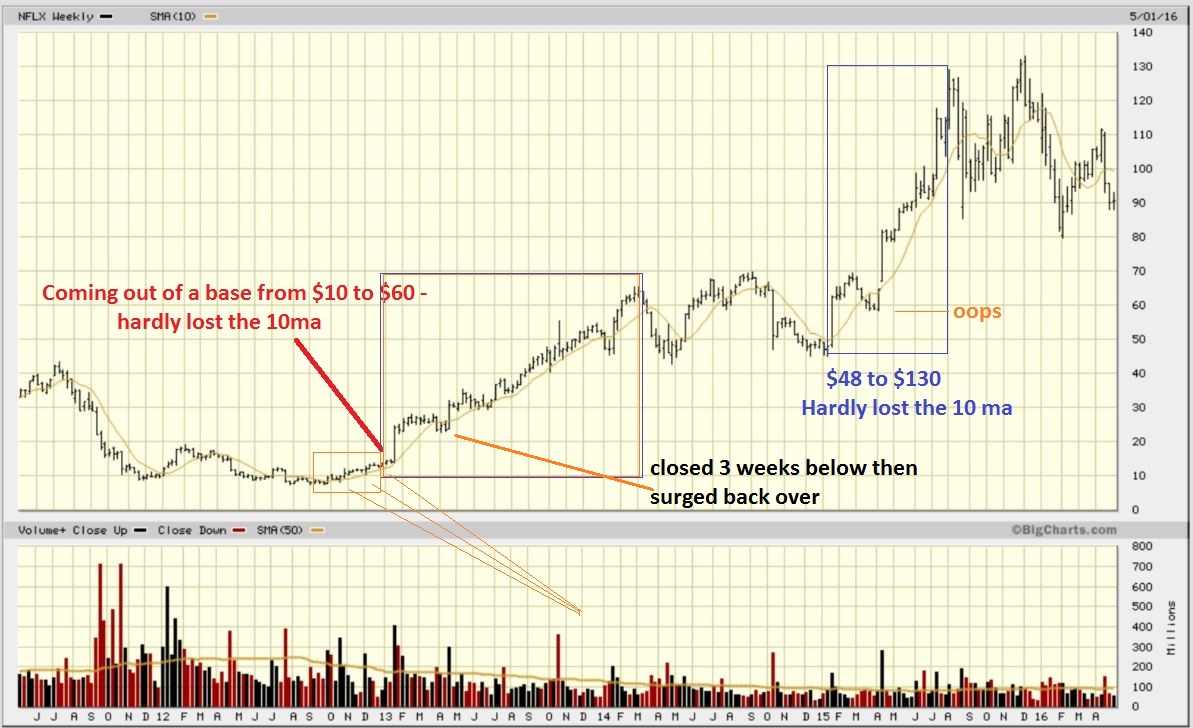
SO I want stocks moving out of a Base to move over the 10 (And eventually the 30 ) MA.
.
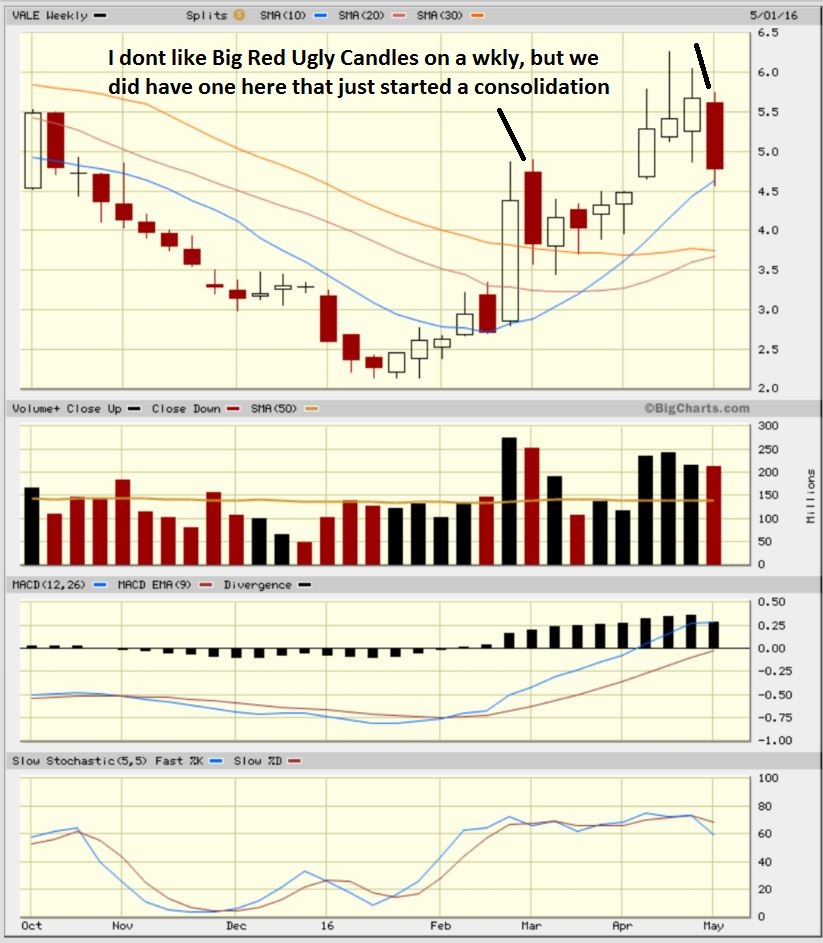
VALE WKLY – Still over the 10ma & above the 30ma, it is overall healthy. I do hate those big 1 week drops, but the one in March didnt last.
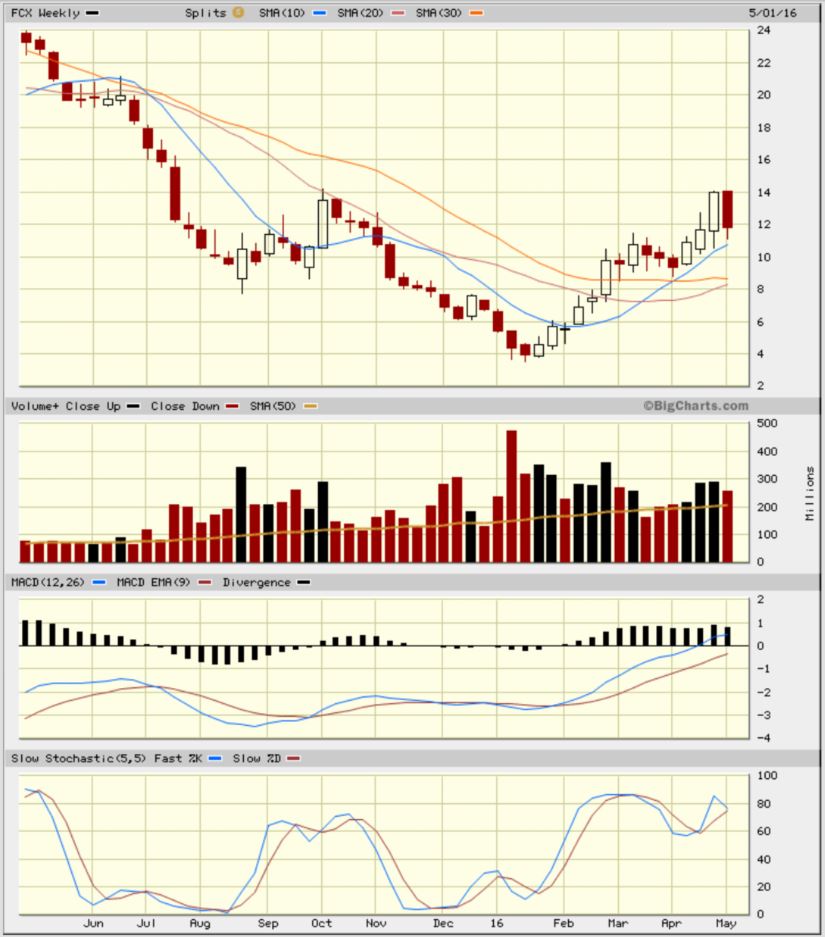
FCX – Still above the 10 MA & 30MA. Price has crawled along the 10 MA here for 4 weeks actually.
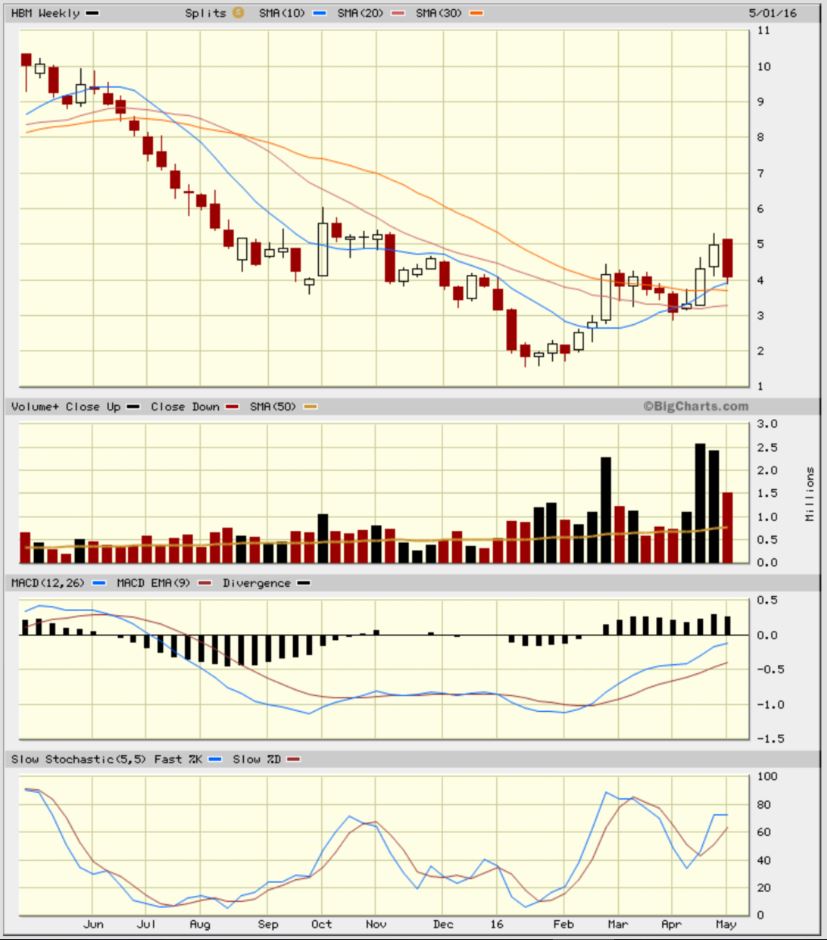
HBM WKLY – Big drop, holding the 10 & 30 ma so far. I like the volume character, hate the whip saw price action.
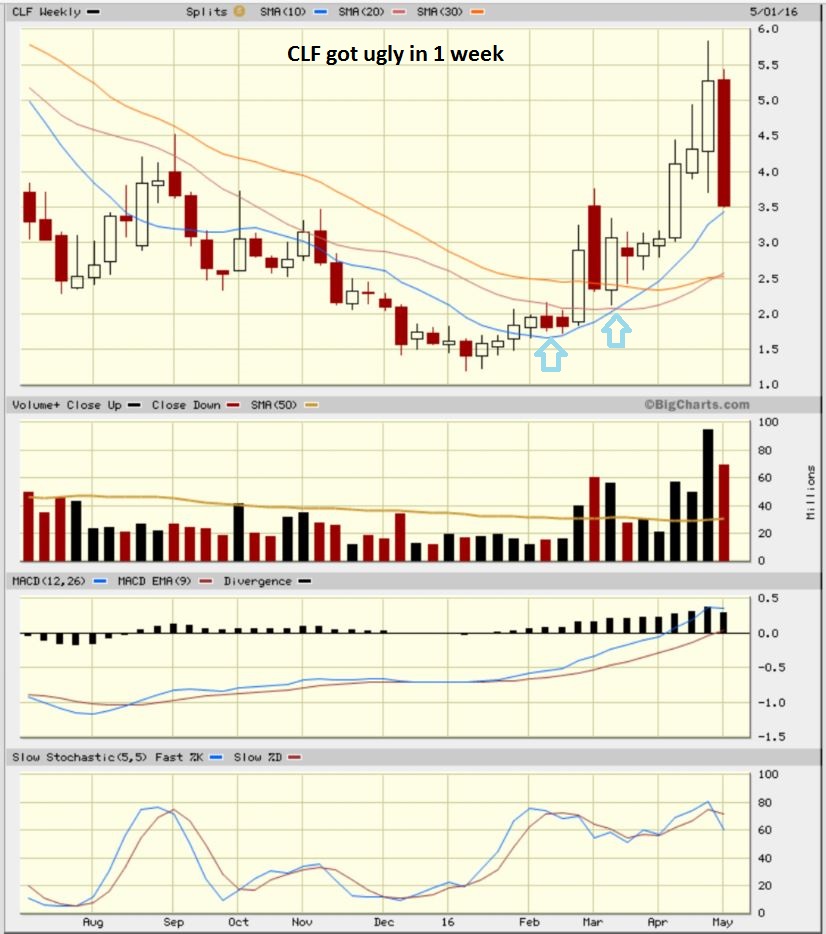
CLF WKLY – UGLY CANDLE, HUGE DROP. Still holding the 10ma, but I remain cautious here. Even if CLF remains above the 10 & 30, it may need to consolidate to regain strength.
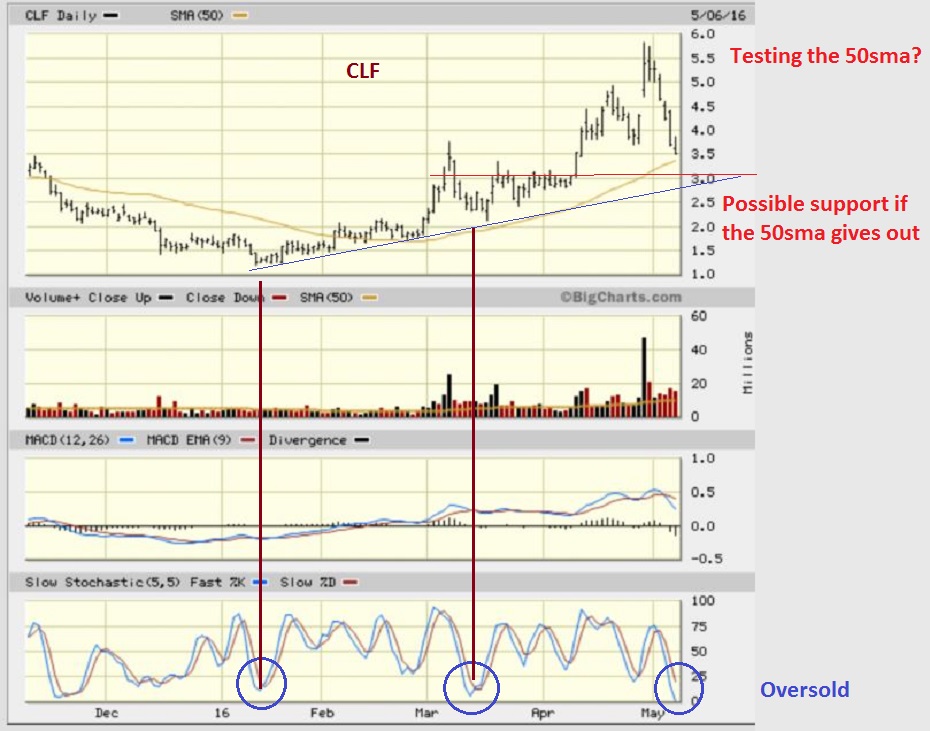
CLF DAILY – This doesn’t look as bad as he weekly, but support is further down if the 50sma doesnt hold. A quick drop and recovery would still close above the 10 MA Wkly.
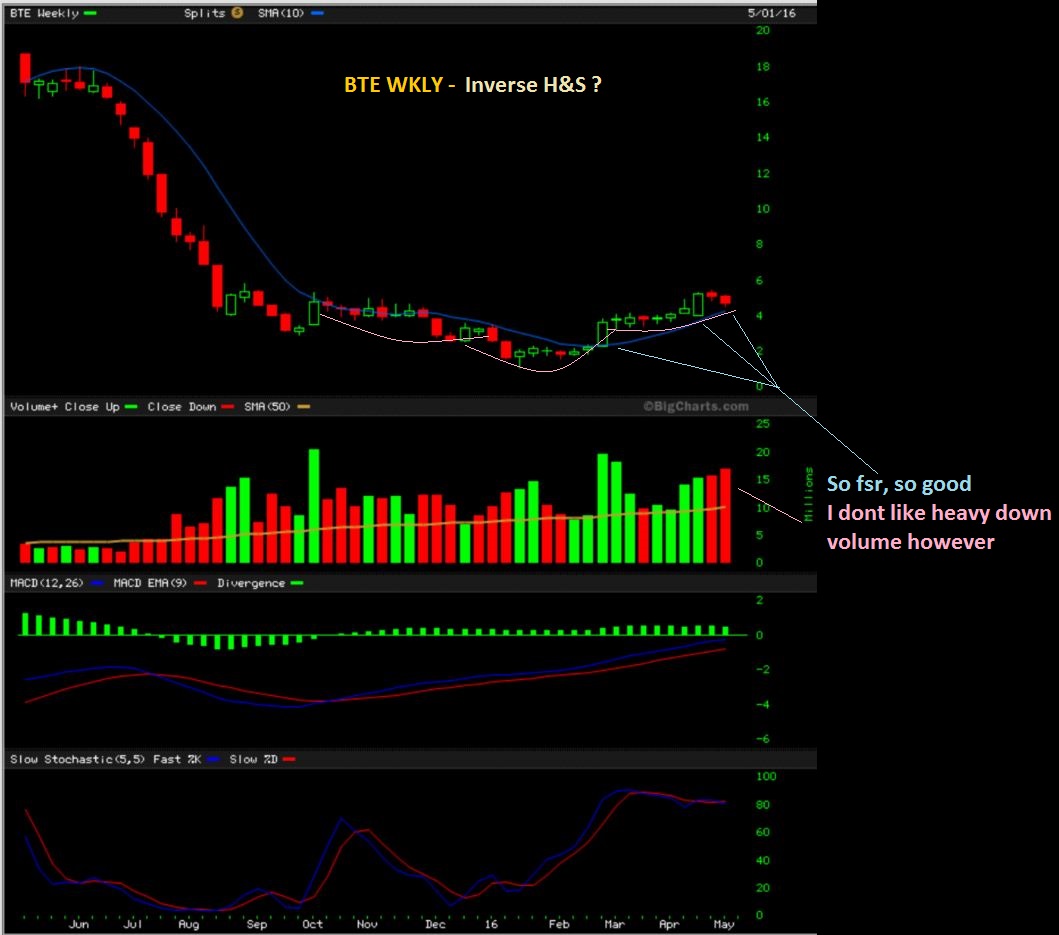
BTE WKLY – ( Another typo on the chart, I am hurrying too much ) 🙂
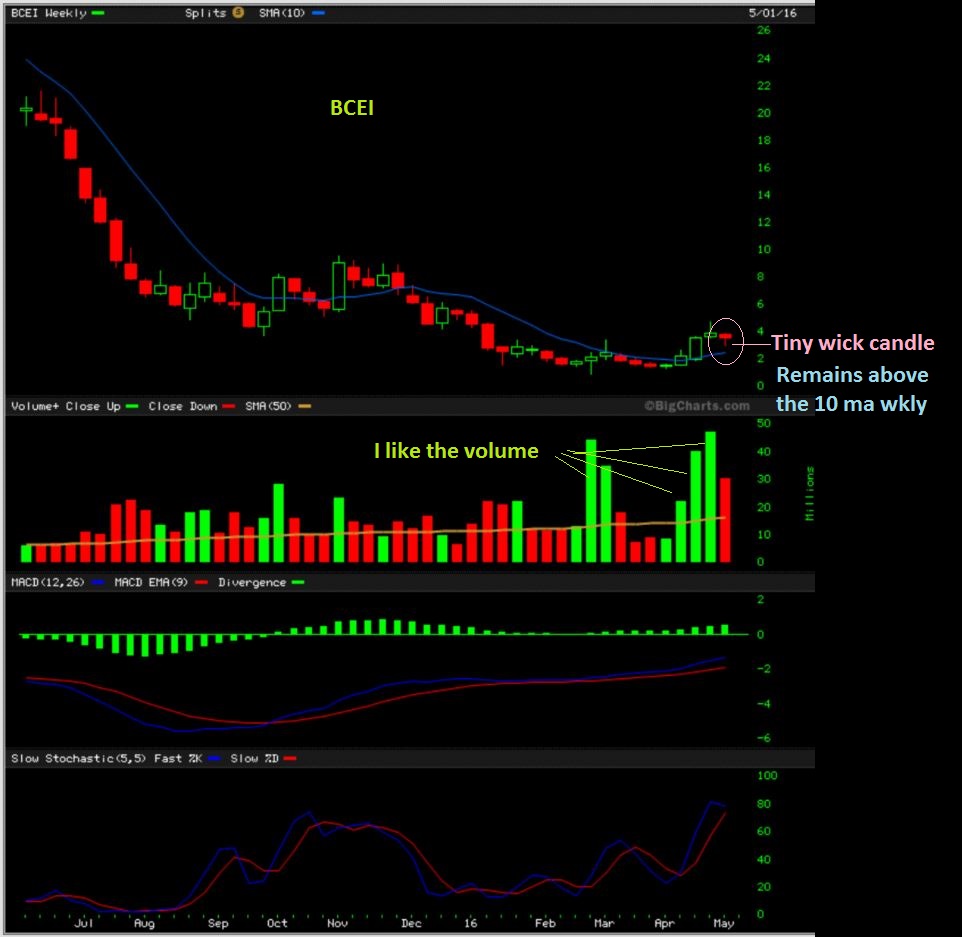
BCEI WKLY –
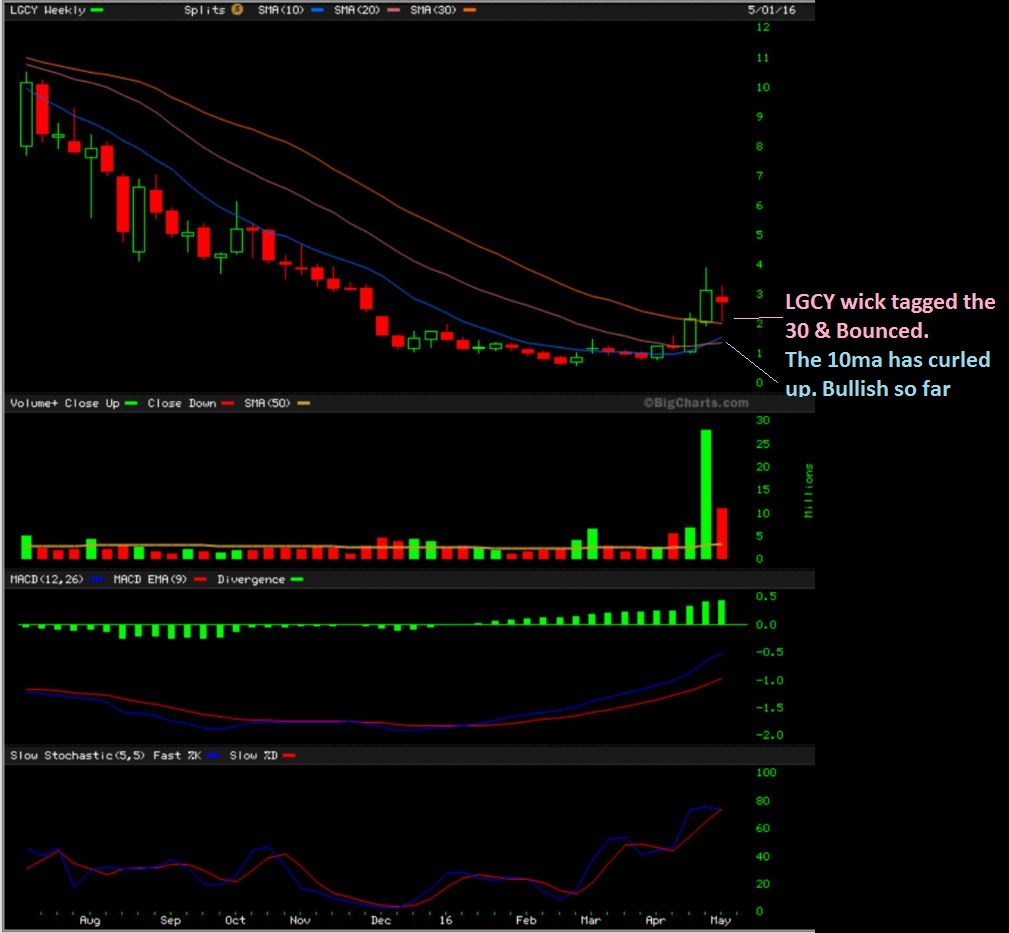
LGCY WKLY – Above the 10 & 30 MA . LGCY wick’d down and rebounded off of the 30MA. This can go sideways along the 30MA or just take off higher, but if it doesnt lose the 30 I consider it quite bullish over time. It is an excellent chart in many ways and I do still own it. More on this in a minute.
.
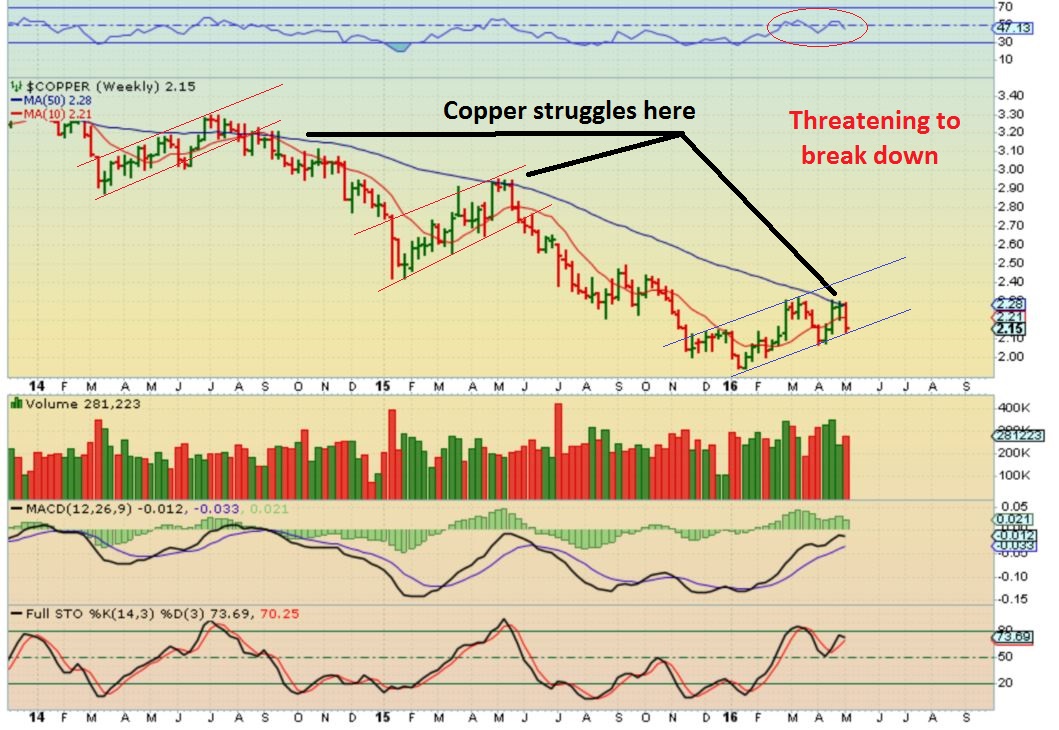
A WORD OF CAUTION : I mentioned a week or 2 ago that Copper was looking bullish. FCX, HBM, NCQ, TGB, etc are Copper stocks that I liked. It is now threatening a break down.
COPPER WKLY — The 50 weelky moving average is a trouble spot for Copper
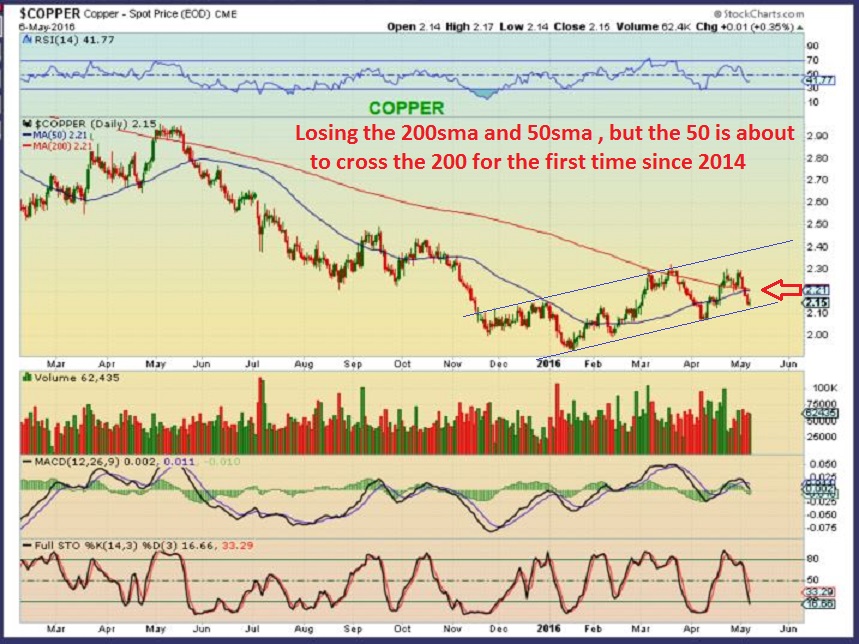
Copper daily – Negative divergence when it approached the March highs, and this did not correct itself. This looks too much like November to ignore, and it was oversold then too. Oversold means nothing if the channel gives way.
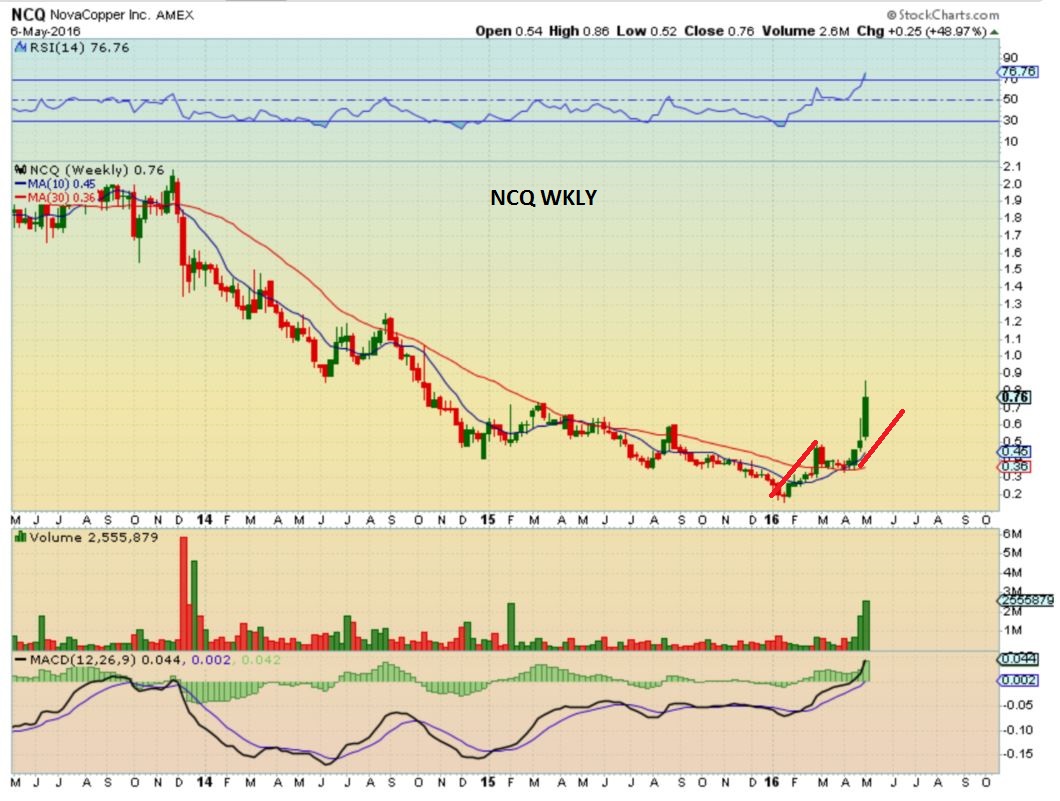
NOVA COPPER – Tell Nova Copper that Copper is looking risky. NCQ has ignored Coppers recent drop, running from $0.36 to $0.86 in the last 3 weeks. It’s up over 400% in 4 months.
LESSON:
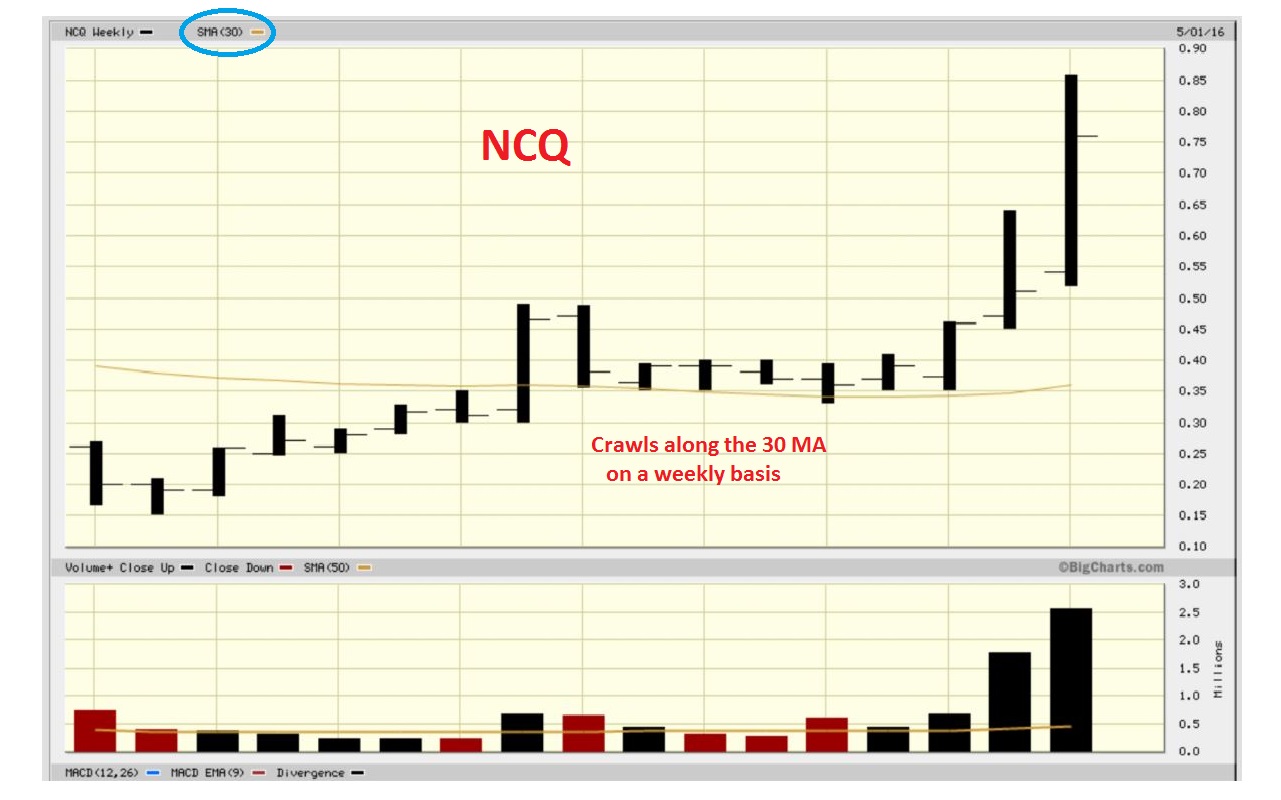
Look above at that NCQ chart above again, because it has done what LGCY is doing now. NCQ is a perfect example of a stock that moved above the 10ma and then burst above the 30ma in February. ( LGCY just did that). It then had 1 huge drop on the first week of March ( we see that now in some commodity stocks, so maybe it’s just a 1 week deal). NCQ then spent WEEKS , 4 or 5 weeks – over a Month going sideways on the 30 ma until the 10 ma caught up. LGCY just tagged the 30 ma too. THEN you got the next leg higher, which doubled NCQ again .
.
Oh, and if you see another stock doing this, please let me know 🙂
.
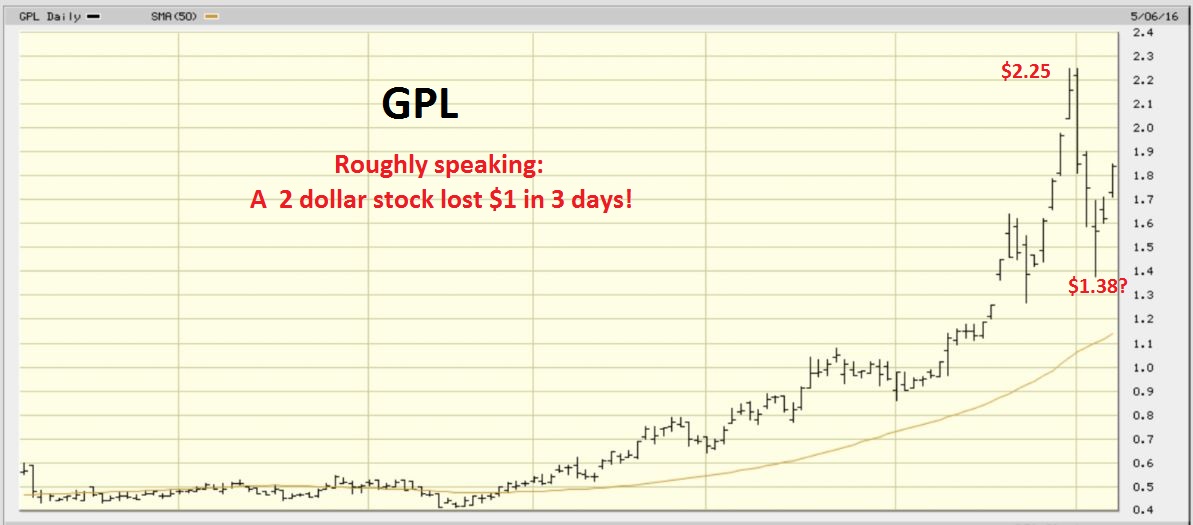
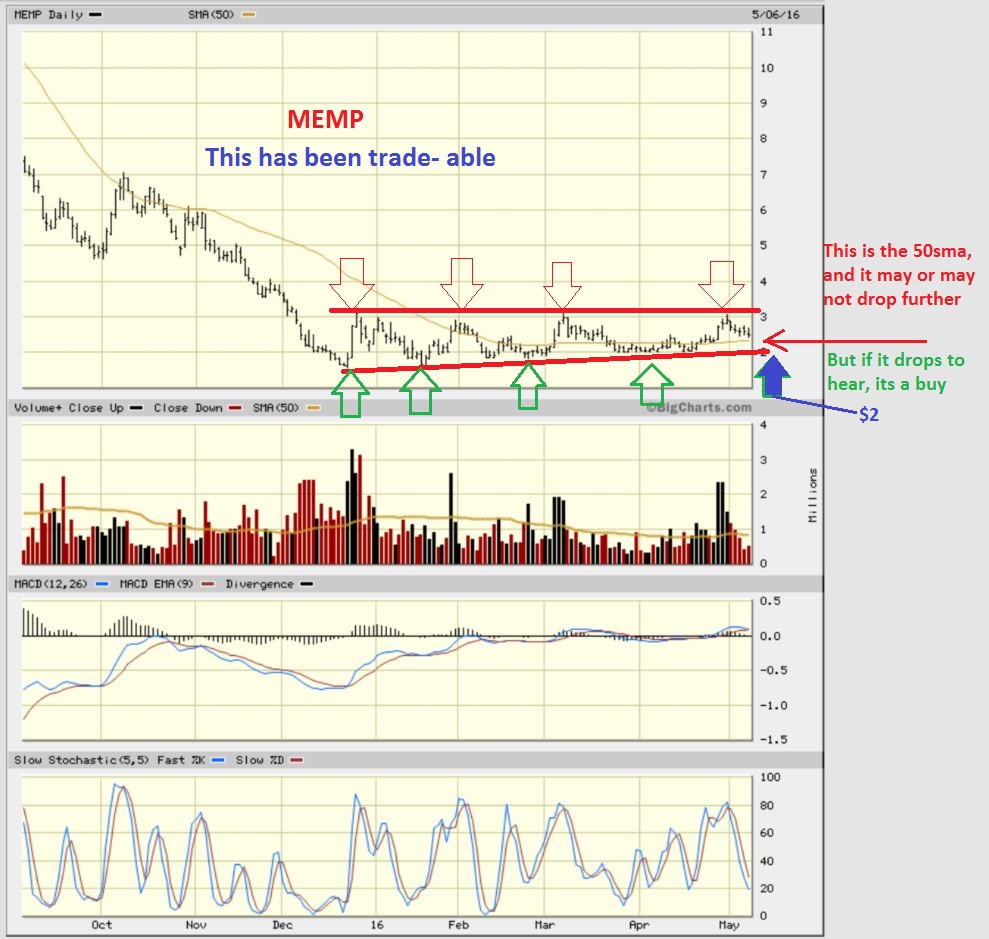
Thats the weekend report. The length of the first daily cycle in the SPX is ridiculously long and due for a bounce or rally in its 2nd daily cycle. We had a rough week in some of our commodity plays, the weekly charts helped a bit, but not if you bought near the highs. Some Energy Stocks should still be fine, based on the idea that OIL probably just put in a 1/2 cycle low and can get to $49-$50. They have sold off and some are in oversold areas too. ( RIG reversal on the 50sma, oversold. MEMP in a trading range, SDRL is almost on the 50sma and is oversold, etc) . Anyone with a core of Miners or trading some probably saw further gains too. I see that the $USD reversed and looks ready to move higher. Will that finally rain on Golds parade? We’ll see. Could that affect Commodities with further selling or sideways movement? I’ll be watching for that too, but the CRB is close to a DCL and many are almost oversold. I’ll looking for a possible bounce or continuation higher, but I need to see what next week brings in that sector. As the dollar rallies, it is best to stop trading Miners until we see how things play out. Did anyone see the move that GPL made in the last 5 days! Look at Mon – Wed last week (see below) . WOW! I feel a little better about CLF possibly bouncing after seeing that! 🙂
.
Lets see what this Monday and Tuesday have in store for our trading and trade set ups. Thanks for being here, have a great weekend!
.
~ALEX
.
GPL – This may be just a bounce now, and an A-B-C down with a dollar rally.
MEMP


Thanks for sending early CF! Happy Mother’s Day for all the CF trading moms!!!!!
Ur welcome Shermo ,
I’m going to be with Family all day Sunday, so my wife kindly sacrificed our time on Saturday for me to get it done early. She’s a good kid like that 🙂
You have a keeper! Take care of each other. I may start swing trading using the 30 minute on bull/bear mining etfs had been just holding the longs but cashed out. Getting choppy which is great for swing trading. I use macd coppock curve and 15 sma for 30 minute. Your daily updates are very helpful.
Great insight. Thanks for the work. Alex you work hard for your members. Thank you! Johnny & Brenda Hancock
Thanks Johnny ( And Brenda) – really glad to have you here. Enjoy your weekend!
$SPX $SPY
The S&P looks like a duck, literally.
I see patterns in everything. And I am obsessed with mathematical stuff. From the fibonacci number
sequence to the fractal geometry of nature. Let G be the fibonacci “golden mean”, 0.618.
Solve for 1 + x = 1 / x . x = G . Lol. 1.618 x 1.618 = 2.618 . Enough! Lol. The following charts
are MMA = Multiple Moving Avg. (weighted) “Ribbon” charts. This idea was developed by Daryl Guppy
of AUS, who to this day is very alive and well, and still kickin’ around the MMA idea. I use MMA’s
5,6,7, … 32,33,34,36,38, … 140,142,144. A bit of overkill, true, but ooh so colorful and breath-
taking. I need to rescript the module so as to get the thread color sequence correct. If done
right, they take on an a mindbending 3-D quality! During periods of market price fluctuations
best described as the gradual price volatility contraction cycle, these 80+ MA’s gradually collapse
into one another eventually becoming 1 “thick” but quite “dense” MA. Without exception what then
follows is a price volatility explosion. The idea of course is to be on the right side just before
a big bang. These 2 charts are the S&P from 2015 up to right now SUN afternoon in TX on May 08-2016.
One is a daily chart from last year and the other is fractal dimensionally related being a weekly
chart. I leave the rest up to each individual mind. But hey, I’m all in. S&P DOWN HUGE between now
and Dec 31-2016. How much? Who knows. But, at least this phase, is gonna be huge but probably over
quick. Lookin’ at those ribbon charts. Hey, if it looks like a duck, walks like a duck, and quacks
like a duck? You’ve got a duck. So whad-dah-yah-say! Let’s have some fun! And let’s make some money!
Lol. Happy trading. And as usual, I may be right, but then again, I may be wrong, and blow my account
sky high. { `_`} .
2nd pic.
Gold COT. WOW! But remember, we’re in a bull so the rules have changed…
Alex, basically, the take away I got is that there is a reasonable possibility for many of our commodity and energy stocks to rally up/bounce with the broad market, but that if we get another run, that’s the chance to sell until we see more evidence of something sustainable in the charts. Sound right? This was a lot of info, definitely going to have to give this another read tomorrow!
Hello Cason, My name is Johnny. Gold has me thinking both up and down. There is so much enthusiasm and reasons to believe it could continue to climb. Alex’s charting says it may take a breather and go south for a bit. Also, I believe oil may be all over the place tomorrow with the Saudi news. I do like the gold chart you posted, thanks. Its a pleasure to meet you and I’m sure we’ll be exchanging ideas. sincerely
Johnny
Hi, Johnny, welcome to ChartFreak. Just watch out for Maria’s post (and .gifs)! I expected gold to pull back long ago so I’m thoroughly confused on that one. Impatiently waiting for a real pull back to go long, been a long, painful wait. Ugh.
i wanna buy it here when it fills that gap at the open in 80mins. {`_` } .
the slight problem is that there is no real gold behind all this paper.
it’s all locked away in some vault in some bank i think somewhere in the middle of Beverly Hills. lmao. {-_- } .
Good to have you Johnny. CF is the best chartist I have seen. IMO I would not worry too much about the amount of physical gold…. futures contracts can be settled by either cash settlement or product delivery. That’s why the commercials are not worried. I have found it best to just follow the charts…lots of fictional stories out there…
.charts lead to real profits. stay in touch with what CF is showing us.
i was just joking lol. (i hope.)
omg GLD just filled 2 gaps with 1 gap. tricky lil sucka. lmao.
In a nutshell, that sounds about right , Cason. Some Commodities that took a big drop Friday were a little surprising to me ( CLF), so will they bounce and start a sideways consolidation like what we saw in March? Possibly.
Also , I expect the markets to move higher , since they are so late in their daily cycle, but I cant exactly say if MONDAY will give us that answer, because the markets could be putting in a low and need another day or two – for example the SPX bouncing off of the 50sma 1 or 2 more times – before a bounce comes.
Right, might not be immediate, understand that. I’m in a bit heavier than I probably should be here as I added last 2 weeks on pullbacks (w as a bit early!!) But major point was that a big bounce from here in energy/comodity space likely better to unload than to chase a next breakout due to overhead resistance, cycle timing, etc. I won’t miss a 2nd chance to exit.
“…Almost heaven, West Virginia. Blue Ridge Mountains, Shenandoah River…”
And, that is why it is “almost Heaven” because the Blue Ridge Mountains are in Virginia. The border of West Virginia and Virginia is formed by the Appalachians which are to the west of Blue Ridge chain with the Shenandoah Valley in between. So I agree almost heave with western Virginia being Heaven. But, the point is well taken.
was pickin’ j. Denver’s tune on me 6-string. “…miner’s lady, stranger to blue water…” lol.
Even better: Ain’t It Good To Be Back Home Again. Maybe too sentimental for most, but for me a real tear jerker. Wish I could play.
he was on top of the world when i was the class of 1977 and off to UTaustin. started in 1973. neil young, eagles, john Denver, james taylor. lectric so much easier. acoustic hurts lol pluss rsi risk. i played/play keys too.thing about an acoustic is you can “hug” it lmao.
Opening volume on the gap down below the 50sma had me sell CLF.
I can wait and see if it is done or is it is a shake out, but if it was a shake out, it worked on me. I can always re-enter if I see a recovery. I dont mind buying run higher at a higher price, I dont want to sell lower.
I see a mix for energy, some green some red, I see a sea of red on commodities, and many are losing support.
Possibly the pull back in Miners will finally give a low risk entry in some of those if it is a sustained pull back.
( oddly, I dont see news, but EGO acting a little strong today)
the fed, and the boj, and the ecb, and china may have a workin’ round robin routine for now. better than IF all 4 have problems and all at the same time currency wars, and neverending crisis in which the sun can never set on. brave new world. i wanna tesla! lol.
May buy a black of clf here at $2.87 for the bounce. I think it’s at least we’ll oversold. Underwater now on my first buy.
There is a support ridge around that $3 area, but I dont like the huge volume in the 1st hr.
It could get a bounce or stop at support, but I just wanted to get out and watch it from here.
I think it also landed on its up-trend line so far. I need to double check that though
Got stopped out $3.27 for a decent bounce. Took some of the pain away from my long term position in it,,lol
Got stopped out AA. Commodities not good today.
i wanna piece of nova caine i mean copper. lol.
CLNE – Gapped open, closed the gap, and moving back higher on strong volume.
Pros & Cons to clne, but that overhead resistance could be temporary if the buying picks up.
.
refresh
.
Alex, FCX and HBM are both in copper and miners. If the gold miners go lower, which we expect here, can we assume these commodity stocks will get beat down as well? Do they ever go in different directions?
i lost HBM at open today,… but does now seem to be stabilising just below the 50sma.
cant risk it doing the ‘jump off a CLF’ on me though
death, taxes, stops. {`_` } .
spring of 2014 march through June- FCX & HBM went up, GDX went down, but its rare
Thanks for the research. So most other times they went lower together. To be expected.
http://www.thestreet.com/story/13563421/1/jim-cramer-be-very-careful-on-freeport-mcmoran-other-miners.html?puc=yahoo&cm_ven=YAHOO
Alex- Like your bouncing ball graphics. Gives good feel for the Cycles.
Yes, that is how I picture it in my head and thats often how they play out. a couple of bounces higher, then they lose steam for a bigger drop, then start over again with a new ICL.
Of course , they bounce differently in bear markets ( Weaker) .
silent, whisper, all electric light-cycles lol. generated by natural gas. cheap. clean. homemade. natural. gas. (i can’t help it. i am now a producer. lol.)
refresh’.
I caught the falling knife again. Bought back in at 61.8% down.
Thanks ALEX !!!
Is this the time to buy some CLF Alex.
I would wait
THANKS MY DEAR.
So as always I will wait, and look in the next reports what you think this stock. Have a very good day.
Sometimes these Harmonic patterns can help. This looks like a completed Bullish Bat pattern on LABU. Could recover 50%.
https://www.tradingview.com/chart/LABU/uiAM4uYr-Bulli/
Alex, is that an Abandoned Baby on DUST 15 min chart?
Island bottom, pretty much the same idea. Exhaustion to the downside for now.
Just my opinion, now is not a time to freak out and sell some of these stocks. Wait for an oversold bounce to the 50 or possibly even the 20 sma to get out. If you’re holding long term, you may want to add small to positions since we do have mov av support on some of these still underneath. Thats what I am doing. The big move down already started, and for all we know, might even be close to done. But this move down by some like CLF are probably gonna take time to repair, so a sideways move after all this is likely. Again, IMHO, as they say….
Buying ERX here with stop below the 50 sma
Alex, BTE is nearing the 50 and 200 SMAs, would that be a reasonable stop, or would you sell now?? TIA
Hi Rob
If you look at a 3 month chart, there is a support ledge right across from the 200 sma & 50sma at $4.00, so my stop is there, but it also depends on where you got in, because if it gets down there and then breaks down, your losses would be much higher.
.
refresh
A week and a half ago I started lightening up my positions. It was when LGCY started selling off and all the other energy stocks were still green. I forget who It was who did the same thing, he sold everything. What good timing you had. I impatiently bough back many last week, including CLF. Have to get better at holding on the the gains.
was it not Kenny who said that the CRB had done its 5 waves, so he was out?
Yes, Ken started selling . I dont know if he sold everything, but he did say “I’m pretty sure that wave 5 is complete, and I’m lightening up here”. expecting a-b-c down
I bought back some too, at support levels, but CLF I bought back on a Gap open. THAT I should have known better.
I had a target of CRB 190 , so I was thinking we’d get another run higher. At least a double top , but I was thinking a new run before a rest / consolidation.
The Sell off in CLF has been almost straight down.
Hit me with a hammer next time. Really get my attention so I sell. I gave back Ks and Ks of profit in just 6 days!!
the jul SPY call/put ratio is 5-to-4? omg no way. at the money 10 week S&P put option for 4? omg. i was totally unaware of this. the fed has succeeded. the crowd fear is gone. geebus. i am out-out-out of everything. 100% cash.. like now. i am spooked.
hmm 2 relat wide no gaps weekly lower-lows lower-highs lower-closes off that top. what are the odd for week 3. omg 13 weeks oct low to jan 1. feb low +13 weeks. man. now the bet on a S&p down. i was not ready for this. i need quiet time. but. “…time, waits for no one…”.
oh lord, give me the courage to buy more oils today, the wisdom to ignore my shaking knees, and the strength to be greedy when others are fearful…..amen
LOL- I’m not buying anything, but looking at ERF over the 200sma, OAS pushing on the 200sma, SM dipping down, it’s tempting, but I really want to wait and see how this pull back shakes out.
XLE is actually right about on top of the 200sma today, Commodities have been downright ugly.
I just want to see if it’s a normal correction…looking for reversals
I added to both CLF and VALE. Really like where they are bouncing here in the weekly chart. Like also XLE, but through ERX. Overall though I’m not adding huge, keeping a lot of cash for when I feel a reversal is ready.
I bought CLNE. Was going to wait for a break out over resistance drawn on my chart earlier, but it pulled back to red today and I took a position / trade
I had CLNE friday, and was hoping to sell today at the gap fill near 3.50. Got sidetracked this a.m. and missed the opp to sell there so I just got out completely and will stick with ERX only for now.
and you guys did this on the strength of my prayer?????
CLF, VALE oversold based on daily BB, stoch, and RSI (5).
ERF looking healthy in a vast sea of red cr@p !
GREEN ENERGY PLAYS TODAY – some just turned green and have extremely light volume, so not impressive, just green.
ERF, TEX, OAS, Maybe CQP, AEIS, CPE, COG, KEG (Just went green, may change back), MNGA, BLDP, GEVO, PLUG, SZYM, CLNE,
whats your criteria for a reversal, Alex?
T/L breakouts on volume.. MA crossovers?
.. what should the apprentice C-Freaker be looking for ?
(too many Q, i know!)
There are many based on just taking a trade, and they are OK to take as long as you can cut losses very quickly if it doesn’t hold up. It’s a tight stop entry.
For example if CLF re-takes back 1/2 of todays candle, you can buy it with a stop below today. It doesn’t always work , but after a steep sell off day after day, recovering 1/2 of the last candle can be a trade-able reversal, like the selling may be exhausted.
“…wontcha look down upon me Jesus, and help me make a stand. if You could see me through just one more day…”
….I’ve seen fire and I’ve seen rain…
And the humility to sell the next top instead of being greedy for more
Throwin’ this out there as a possibility… CLF has moved about $3 dollars lower from the top. A 50% retrace of this move down would have a possible bounce to about $4.30, right around the 20 sma. MACD in the daily for some of these have the lines very far apart, so a hard bounce can bring these closer together. Only a possibility right now. CENX has broken trendline support and 50 sma, but a bounce can have it ride the broken trendline from underneath, before going lower again. I’m long CENX, CLF, VALE, HBM, and a couple others, but would definately look to rebalance if we get the oversold bounce I’m talking about. Completely out of individual energy and oil names, and staying with ERX for now.
The reversal candle on CLF puts CLF right where I sold it this a.m. 🙂 CRAZY
I would buy back on a move above the 50, and *hope* for that move to the 20. I’m holding mine still. Something about keeping my head while everyone else is losing theirs!!!
Hope, prayers, all I have left. I ran out of money.
I do like where it is finding support.
seems the 300eMA on the 4H is significant with some of these commodities
REFRESH!
For your charts tomorrow, the ticker on $BAS has been changed to $BLSHT. Just so you can find it.
Right, but it had no chance, there was no doubt that was a mid-day counter trend rally and it would close back on the lows.
IBB showing nice bounce today
Watching Vale here as well. 200ma and 50 retrenchment levels.
Its funny, looking at vale with the 50sma, looks bearish, the 200sma looks possibly just right 🙂
Looking at miners like EXK, AUY, and GDXJ…. looking like h&s patterns completing in the 1 hr chart. Target for GDXJ if h&s triggers would be near $30. EXK’s would be below 50 sma.
Making a lot of room in my portfolio to *hopefully* pick up miners lower in the next few days/weeks.
That’s why I need copper, energy not to move lockstep with miners. I need to sell those to get gold miners, would prefer to do that with profits, not losses.
Staying away for gold and silver miners…waiting hoping for a larger correction
Only problem is that there are A LOT of people waiting for the same thing. If we get 20-25% off the top, that’ll be close enough for me, especially in GDXJ and other juniors. If we get near the 50 sma will be perfect.
Things rarely work perfectly in getting in. Either the correction will be smaller, preventing people from getting in or it will be more severe scaring people out of their positions and scaring people from getting in.
Case in point Carl, CLF, VALE, CENX, etc…. it is easy to say I’ll buy when they go on sale, but when things go on sale they rarely ever look good!!!
CLF, CENX, and some of these that moved strong are finding weekly support right where they should, at major ma’s and horizontal support. Feeling good that we see a good bounce soon. What happens after that bounce is anyone’s guess, but I think we see consolidation sideways to lower before pushing higher again.
Are u seeing the volume in VALE??????
watching the USD index real close. Right now it is trending sideways – but nothing stays sideways for long and it will have an impact – one way or the other on these commodities.
ECA got pummeled last week from a small earnings miss, but is coming nicely off the bottom already today
SN just popped
SN has held up well through all this!
XLB should be near decent support, break here won’t good.
swing trading with 30 minute on labu and spx…CF mentioned we may bounce around at the 50 sma a day or two…30 minute may be going back down…will repurchase….we’ll see
KTOV…buying any dips…..one pill for osteo/high blood pressure…fixes both problems….long term buy 9-10 tgt
FCX very close to 50ma on the daily here. Not sure if it’ll hold or not, so lightened up some earlier in the day. Ditto HBM and CLF. ChartFreak, do you see anything positive about FCX and HBM? Went back and re-read the “Perspective” report to regain emotional compass:)
Hey Kathleen,
Yes, “Anything positive about FCX or HBM”… Yes, they have tripled in a few months.
Anything Bullish ? Not right now. I have had to lighten up today to be able to step back and take a look without “Hoping” too much.
These can bounce, or they can drop further, many were losing support that I had been watching ( Commodities I am talking about). so I lightened up on some of my earlier purchases
Thanks, CF. Guess I did the right thing then by lightening up this morning, but it still bites to see paper profits evaporate. You were right; it really is hard to hold a core!
Not something I’ll ever do in the commodity sector again. Just doesn’t work. On mobile but added uodated charts of VALE, CLF. Oversold on daily big time. Would I buy here because of that? Heck no. Last week and today was a confidence breaker. Sure, that is how I missed the GDX bottom but… I’m selling any bounce.
Oversold, outside lower BB, stoch, RSI (5). Daily.
Hello Kathleen, My name is Johnny ( my better half is Brenda) Hancock. We are new. I read your post. I am not sure if this applies, paper profits only evaporate if you cash out. They are still there potentially. That keeps my core positions positive. I am just trying to help and its a pleasure to meet you! I liked the info you posted last week on CLF. Thank you. Johnny
OAS reported quarterly earnings after the close. Reaction muted so far.
Nobody has mentioned EWZ, Brazil Etf. Commodities and stocks like VALE and PBR would benefit if this bounces higher in the next few days. Monster hammer candle from lower BB suppor today. For all the talk about the $US dollar, still making lower highs and lower lows, with all ma’s pointing south. I’m still favoring a good bounce coming soon. One more thing: a lot of us here know plenty about gold and manipulations of every market in the world by CBanks. This is only my opinion, but I’ve held it so since last year when the SPX was breaking. The one tool that everyone forgot about for the FED was the strong dollar. If the FED could *influence* (manipulate is an ugly word) the dollar lower, everything would probably react higher, and it has. They put to rest the deflation scare, and sacrifice the dollar uptrend, to have a rising market, better exports, corp profits, etc.. So far, this is exactly what they wanted, and they got it. So why would they let go now? There are some that believe the dollar is going to 120 in the US$ Index. I say the FED can not afford the dollar at 100, much less 120. This is only my opinion, but i do believe the reason why we’ve seen the strength in miners is because the smarterst money knows that this is the FEDs only way out. It has worked well in the past, and it’s just gonna repeat now. The money has been printed, and sat in banks waiting for the time. The time for the FED is already under way, and it has been since late last year. It is inflation time. If the dollar were by any chance to make it above 100 again, i think we see a MONSTER negative divergence in the monthly chart, and that will be goodbye to $USD. That is the A-HA moment….. my opinion only…..
Also remember it is an election year. After elections, this will get very interesting, very fast.
Im holding a few Brazilian stocks , long term timeframe and I think they are mostly all buys for that., GFA, GGB, will purchase VALE soon, when it hits my buy point and a few others. I think GFA sees around $1.03 and Ill load up more at that point. 5yrs from now, I hope to be gloating about it,,lol ,,GGB also,, may have more downside and debt is a huge risk at this point but im risking they’ll both be at least a $5 or more at some point in the next 3- 5 years. Brazil is in complete meltdown economically and politically and it will last awhile but eventually will recover and prosper, just a matter of timeframe. GFA is also a decent trading stock for traders I think
Thanks for bringing those up Miller!! Will look into GFA & GGB.
GFA
Below is the link to the real-time tracker of my portfolio balance. *Refresh*
HAHAHAHA,, Mine too Cason, But all the commodities look good longer term. I just keep looking at the monthly charts of those holdings of mine, and it all looks good.
LABU and JDST kept 1 account from imploding today. But the other one? Was pretty much pure Armageddon.
Thoughts on GTE anyone?
I still have HBM and am holding and trying to take a very long view.. Which is very painful in the short term. Pardon the crappy charting, but does this look better on a 2 yr and 5yr chart using the 13sma?
Missed my stop by 3 cents today. If we open green, I’m still in, otherwise I’ll end up taking the loss.
I don’t like the chart on HBM much here. Seems like more downside in store unless market and commodities rally out from here. Its a “Gappy” stock to begin with but the breakaway gap, closing near the lows of the day, (although volume was weak), doesn’t look good. Hope im wrong and it just screams higher tomorrow. Lower trendline plays out somewhere around $3.60
If we look OK in the morning, may drop stop for 30 min to allow a touch of 3.6 and not lose in a volatile recovery. But if we waterfall again, I’m out regardless.
Miller!!! Looked at those GFA & GGB charts and they look very nice long term! Like the base in GFA a lot, but liquidity is so-so to poor. GGB looks real good, could even be traded. I’ll be looking to get in on GGB. Looks to be making a falling wedge…
I agree on the volume in GFA, but I’m hoping it’s just sellers drying up and short sellers out and could be basing from here. It’s one of Brazil largest property builder/managers and if their economy comes back it should too. $1.90 seems to be decent support for ggb, I traded it from there to @ $2.20 last time, selling near the prior high.
Doing the same Mrs. C!!!
Yes, but that was still a brutal give-back.