
MAY 5 – Perspective And Emotions
Our perspective on certain things can affect our emotions. Isn’t it true that how we view things often changes the way we feel about them? Especially if there are two sides to a story? 🙂 Well it can be that way with trading too. We can look at a long term bullish chart and see it as ‘horrible’ if it is pulling back below our buy point. The faces in the Theme picture above could very well be the many faces of trading, so I am going to discuss perspective and emotions.
.
If I show you this stock and simply ask, ” Is this chart Bullish or Bearish?” How do you answer?
.
BULLISH, right? It has run up 300%, its in a channel of higher lows and higher highs, and has just pulled back from $14 to basically $11.50.
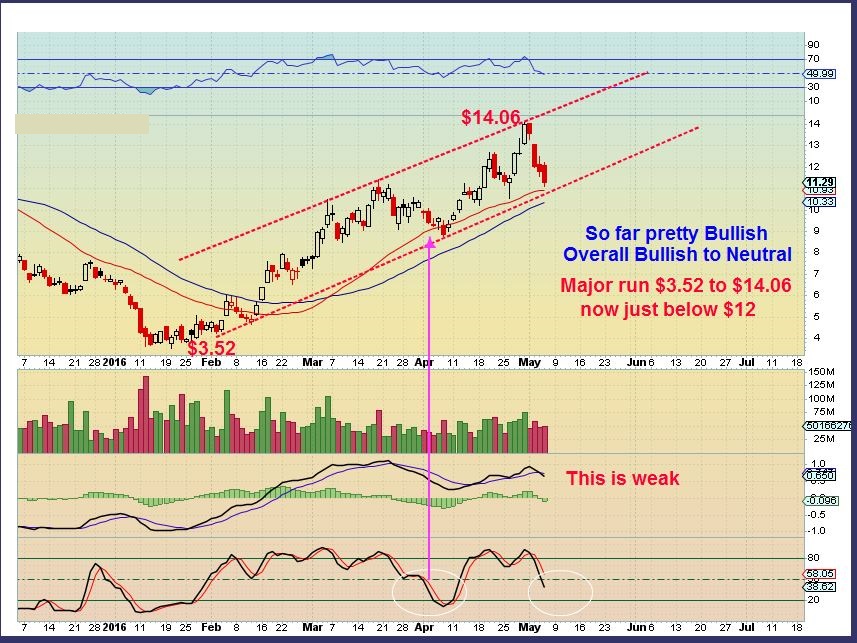
Perspective : I am being told that this is one dreadfully ugly chart. If you bought at $4, you may love it, but if you bought it at $12, $13, or even $14? It has been nothing but volatile.
.
So you see, it is a matter of perspective…
.
That chart above is FCX, and anyone who bought it in the past week may not be as happy as those that bought it lower. Lets zoom in. Please read the chart.

As a trader for almost 20 years, my goal has been not to allow trades to affect my emotions. It is important to the decision making process. I try to see things as they are in the Big Picture, and then adjust to be able to trade as things are in the short term. So I must say very humbly that if I am asked,
.
” What the heck is going on with FCX, I have never seen such an ugly chart, and it has never seen this kind of selling !”
Well, I go and take a look at the above chart of FCX, and I almost dont know how to answer. It isn’t a horrible chart, but short term, yes I do understand the pain of giving back gains from a 4 day sell off.
.
REVIEW-
.
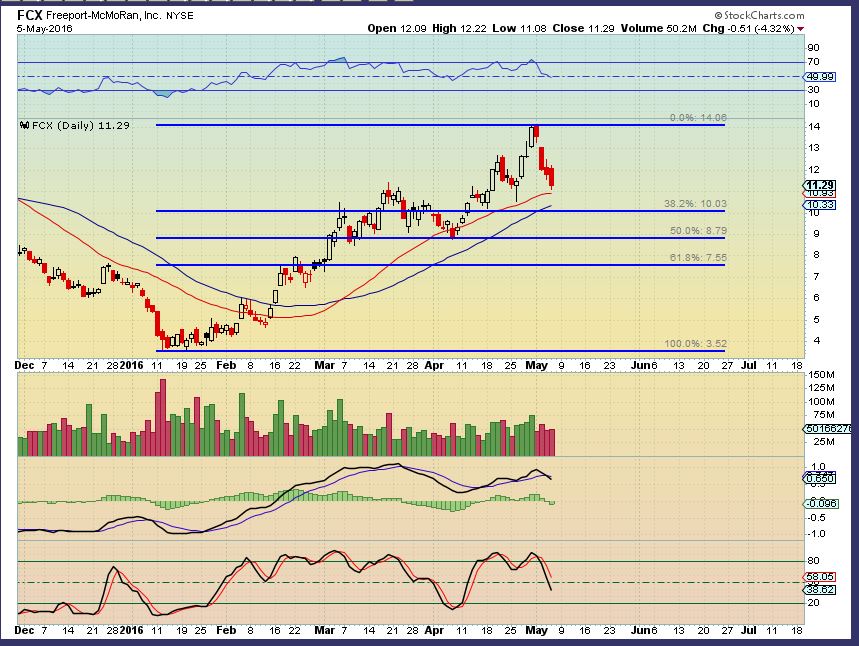
FCX-
In the chart below – It is hard for me not to see a Huge run higher of over 300% in 3 months, and a slight pull back, not even 38.2% yet. It is not oversold, so yes, it can drop more. Will it just drop to the 50sma and be fine? That is only a 38% drop to support. The 50sma should hold, but I cannot promise anything. If this drop is causing someone to lose sleep, maybe they became too heavily invested or they bought it at the top? Anything left of Thursdays Candle is a gain or break even. Lets get another perspective…
.
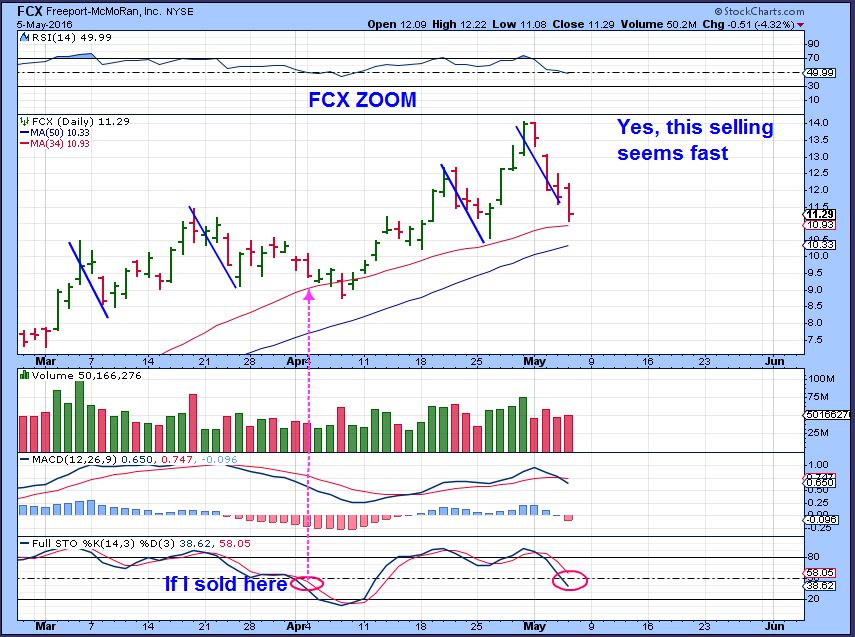
FCX– Ok, Now the perspective is a close up and this viewpoint shows the volatility. We only see “What is happening right now” and the last 4 days has been steep selling. Even so, most trades for FCX in the past 2 weeks are just break even or slightly under, unless one bought the break out and not the pullback. They may have bought the top.
It is not oversold, so I just wanted to show that last time it traded here on the stochastics ( Red circle and Magenta arrow) , it didnt drop a lot. It basically traded 3 days sideways and then ran higher.
.
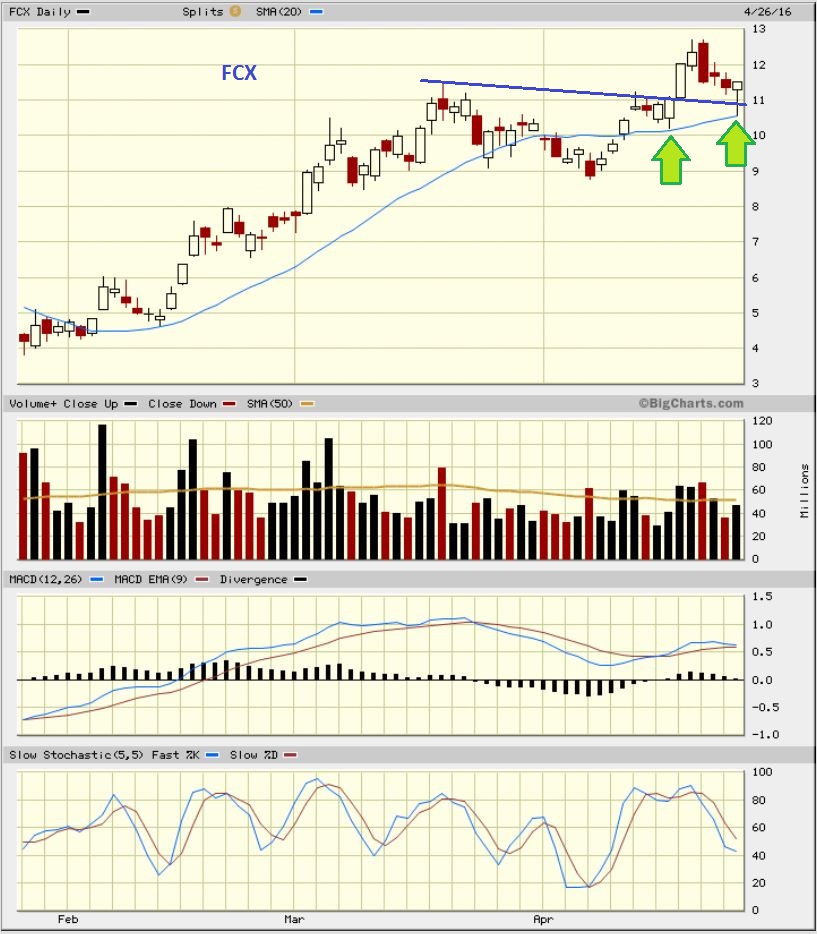
This was my chart to BUY FCX. It was a cup & handle type formation pulling back to $ 10.50 or near $11 with reversals . An entry here allows us to ride the dips. If we rode it to $14 and then get stopped out back down at $11 it stinks, but its not a huge emotional loss, we could even lock in some gains right now. So…
Why lose sleep over it? There is always another trade. If you are anxious or uncomfortable, just take small profits and wait and see what is happening. At least lighten up if you are heavy in a trade selling down .
There is nothing wrong with these charts longer term. Could they be weakening or consolidating sideways? Yes, and unfortunately that is what trading does at times.
.
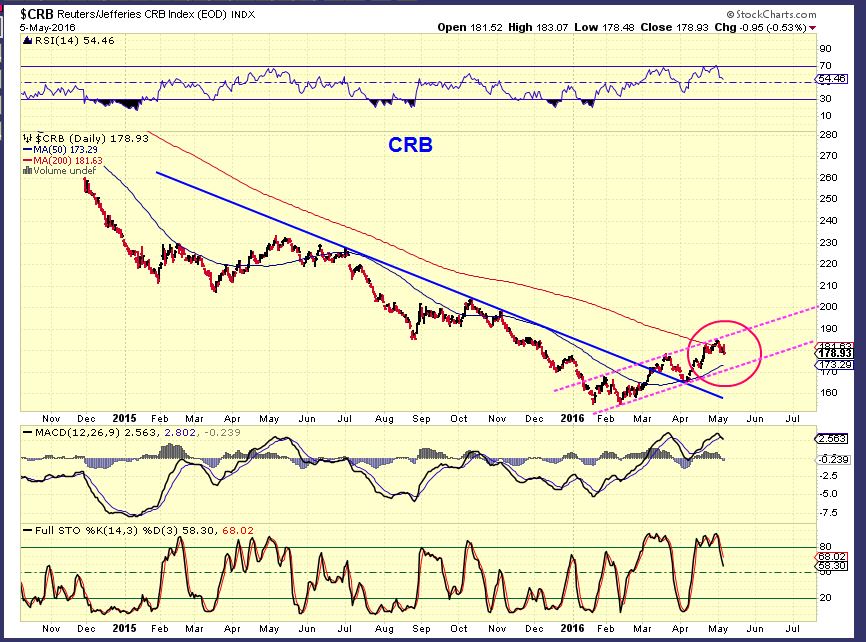
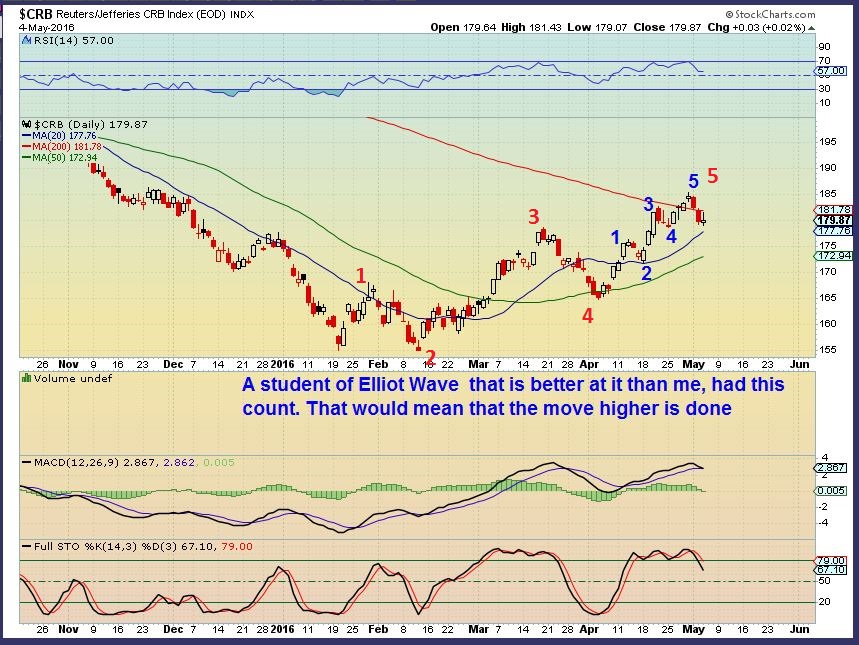
I look at the CRB. On April 26 I said that maybe it would struggle or wander along the 200sma and allow the 50sma to catch up. I thought that it might crawl under the 200sma as shown.
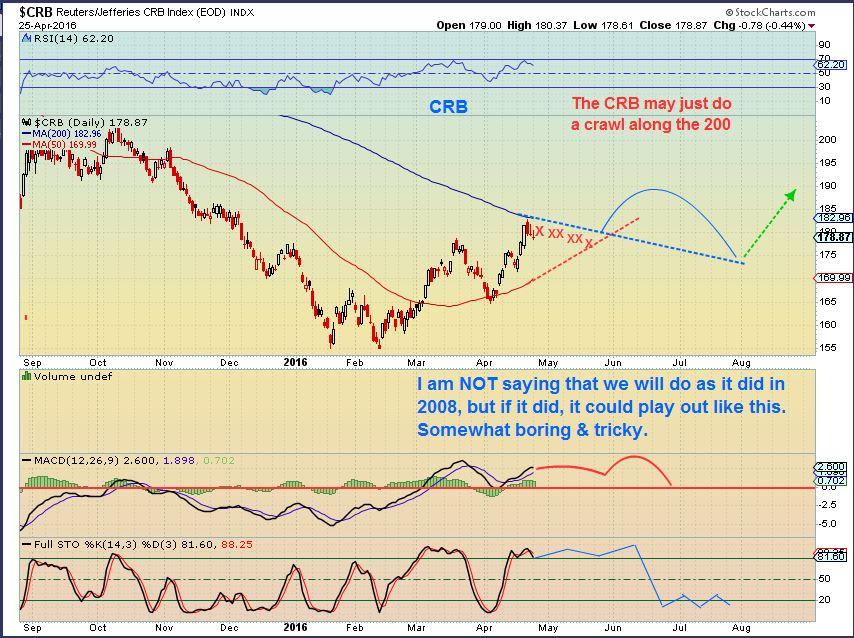
.
In May 2- Cycle counts are getting close to the time that we can get a DCL. Anywhere after 20 days or so.
Today I still see it trading around that 200sma on Day 22. It broke below the 200sma, but it hasn’t dropped like a rock. The CRB is affected by Oil too. The commodity stocks that we have traded are acting a bit more volatile.
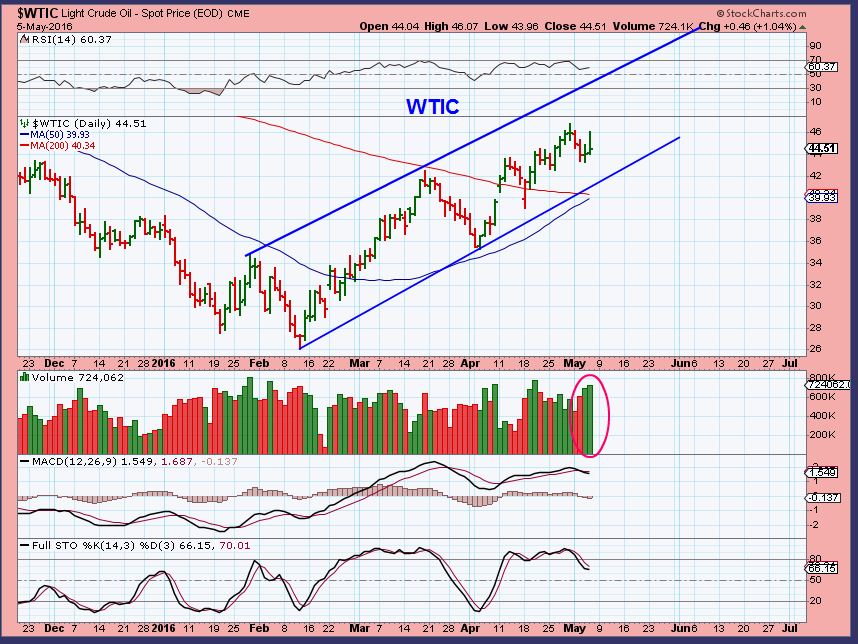
WTIC – I still like Oil, it is still near recent highs, but there is divergence in the MACD. I was looking at this as a dip into a 1/2 cycle dip, we need to see a push higher soon and then we’ll drop into a DCL.
.
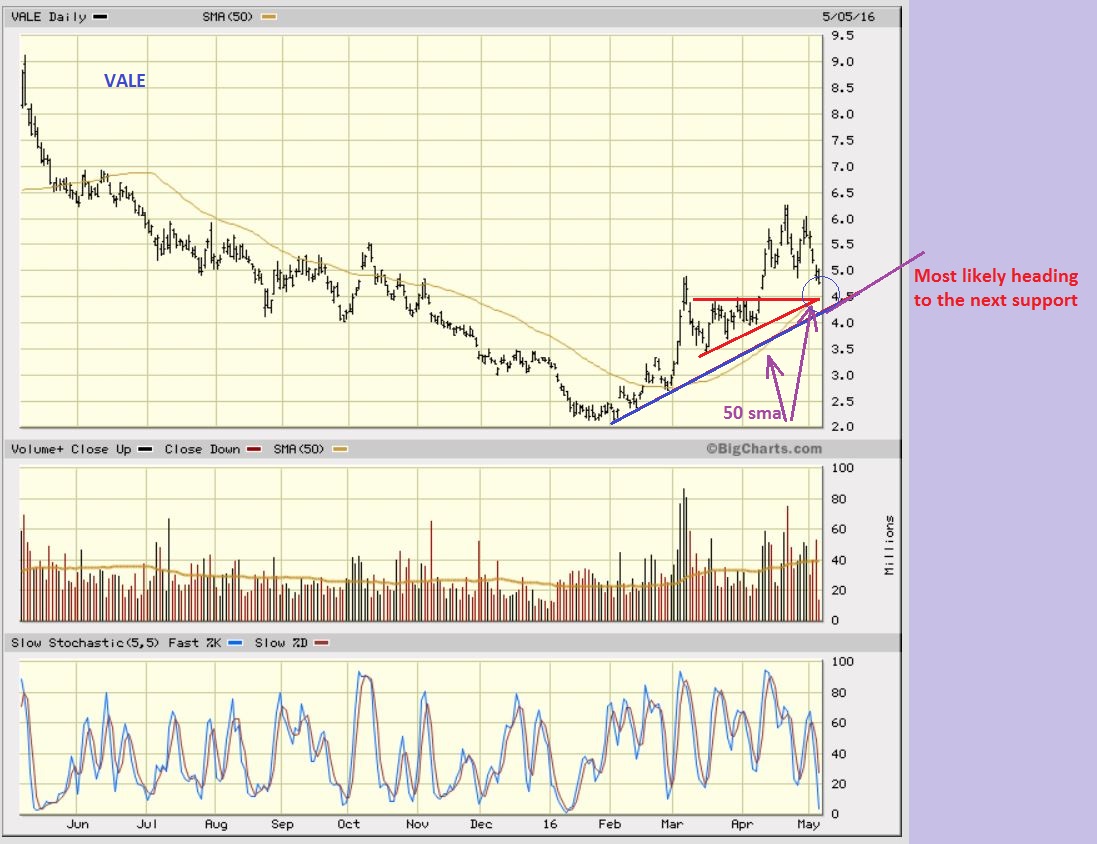
VALE – from Wednesday. Could hold here or drop to $4.50 at the stronger support, to the Magenta trend line. It wasnt oversold, so could drop further.
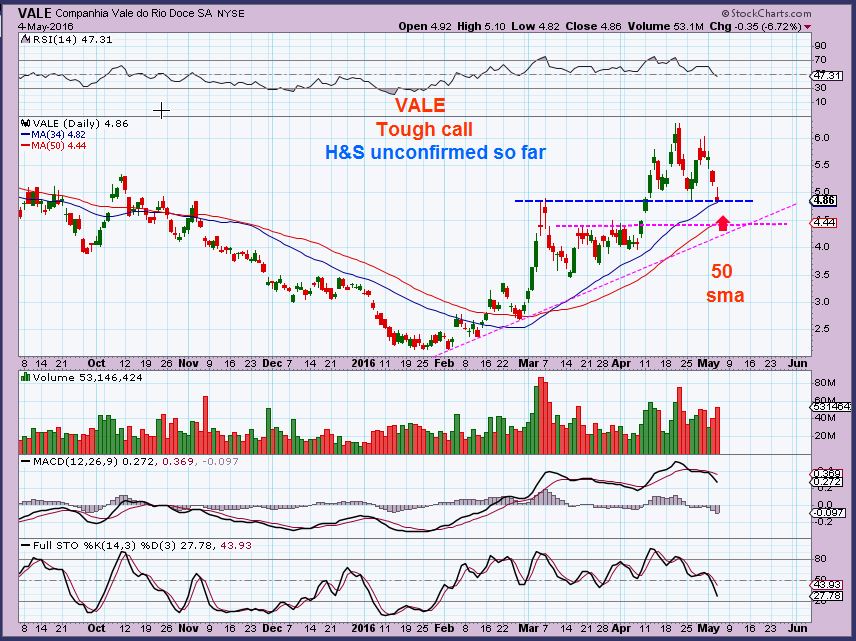
VALE – I posted this in the comments area and $4.50sih was a possible downside target too.
.
VALE – Vale dropped to the 50sma and a tend line. This would be the line in the sand for me. If it is going to stay healthy, I wouldn’t want to see it close below the 50sma or break down from here. This has been a tough ride if you didn’t lighten up after the last run.
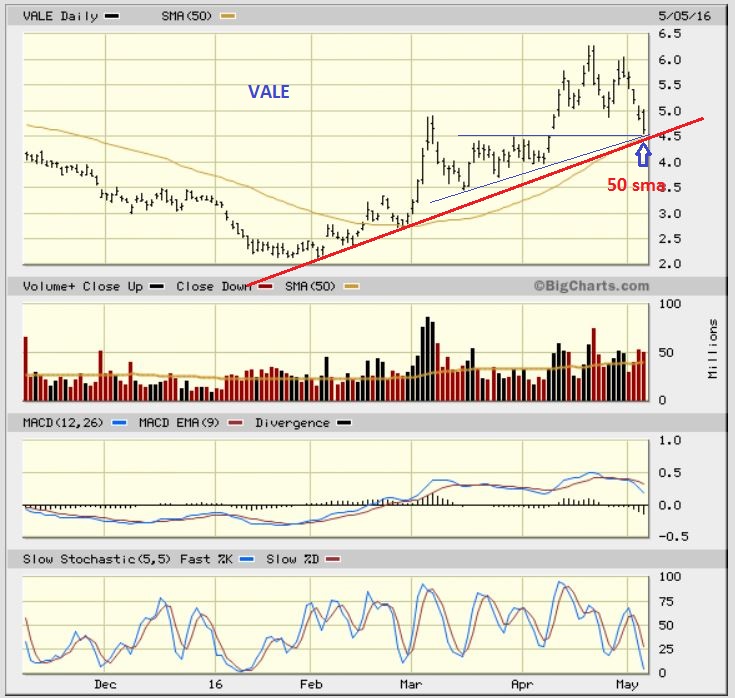
I DO NOT like loose sloppy swings like we see at this top. It is not a sign of accumulation, it is selling type action.
.
I repeatedly have said here that no matter how good things look, I buy heavy at the low risk lows, and I lighten up as it runs higher. I do this to lock in partial gains. Then I buy pull backs when they drop & we see a reversal. This time some of the pull backs and bounces have given up the gains, or in this case, the pull backs have not completed yet. The question is, will these set ups remain short term bullish? Longer term, I think they’ll be higher later, but next week? It’s tough to say.
.
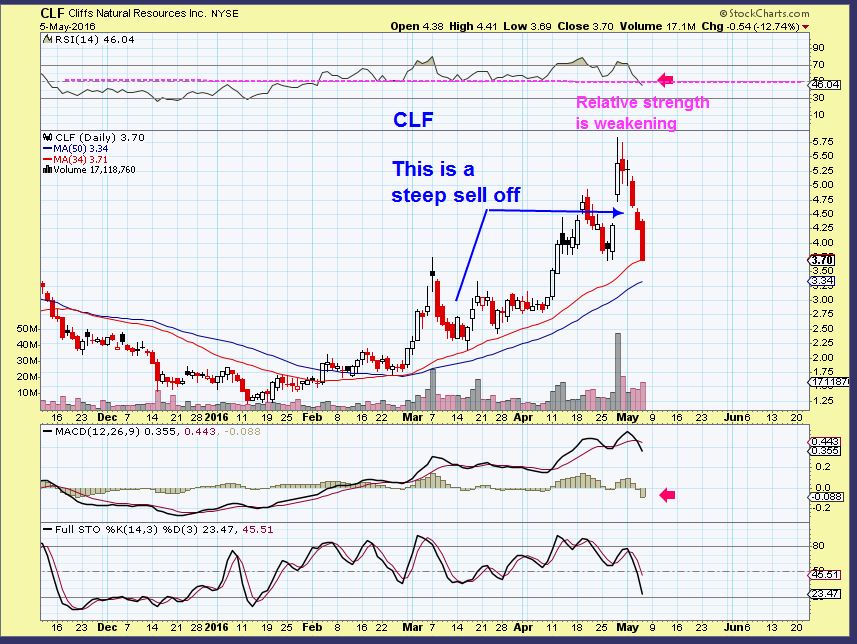
CLF – The selling has been steep from the top here too. We are exactly where CLF was before they released earnings last week. Straight up, straight down. I BROKE MY OWN RULE on CLF. I didnt buy the pull back into earnings, I added on that Gap up after earnings. I then rode it up and rode it all the way back down. A gap fill seemed normal, so I didn’t sell yet. That means that I got in just under $5 , and I am still in under $4. Where is my stop? This may be it, even though it looks ready to bounce as soon as I sell 🙂
.
I dont like this chart as much with the RSI dropping like that and it’s still not oversold. It can bounce from support like it did in March, but that may be a place to lighten up if it does. OVERALL – This can be a good chart, but that is long term perspective. Wide swings like this are not a sign of stability. You want tight price patterns like we saw in March. First it was loose, then tightened up. I’ll look for that in CLF in the future.
I actually intended to do a quick write up on LGCY & Gold today, but I will have to save that for another time. I got a lot of emails about selling in CLF, FCX, etc. and needed to address that. This report has been rather quickly thrown together, please overlook the unusual order of things discussed.
.
I still like Energy stocks and Oil is acting as expected so far. The CRB is hanging in there, but many Commodity stocks are getting sloppy with large swings. Some sold off more than I would have expected, even though the CRB is holding on, so are they leading the way lower? Are they just following the General Markets volatility as they try to gather some footing? Is the Dollar move affecting them short term? I will have to watch how they bounce and see if lightening up is prudent ( A light volume bounce is usually a lack of real buying interest).
We’ll see what Friday throws our way after the JOBS report, and then we’ll have a whole weekend to decipher whats going on and also to rest up . Have a great Friday and weekend!
.
~ALEX
.
Note: If a trade is not acting the way you expected when you entered it, and you are losing sleep or frustrated, it may be wise to just cut it loose and wait for the next Low Risk Set Up. Especially if you took a trade late, and jumped in after the low risk set up was in place.
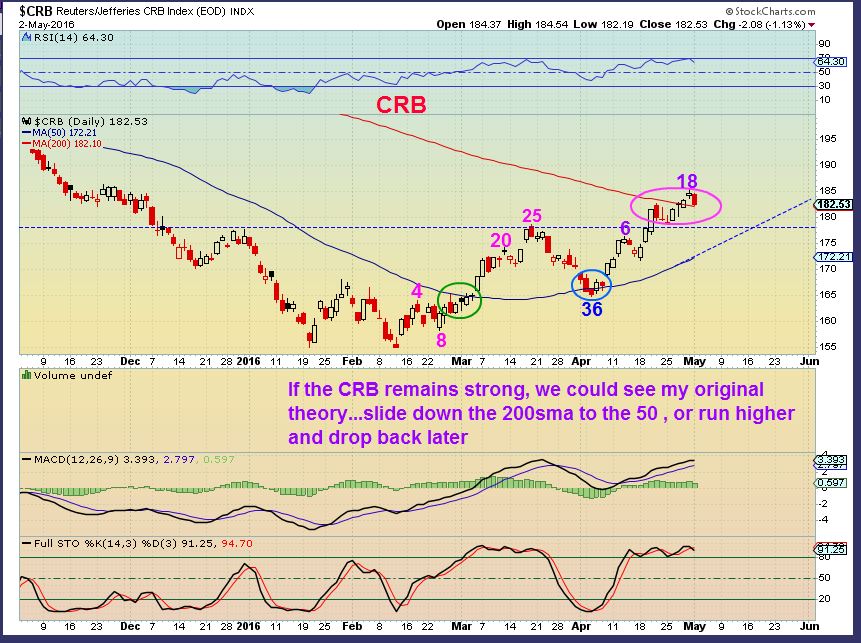
Yesterday I posted this chart of a possible E.W. count for the CRB. Another sharp reader emailed and pointed out that he believes that the ‘4’ should not, or cannot drop below the peak for ‘1’. I believe that that is true. Would that mean that we saw 1-2-as labeled and ‘3’ has not ended yet? I guess it is a possibility. I’m better at E.W after the fact. lol. It often just keeps morphing on me. 🙂
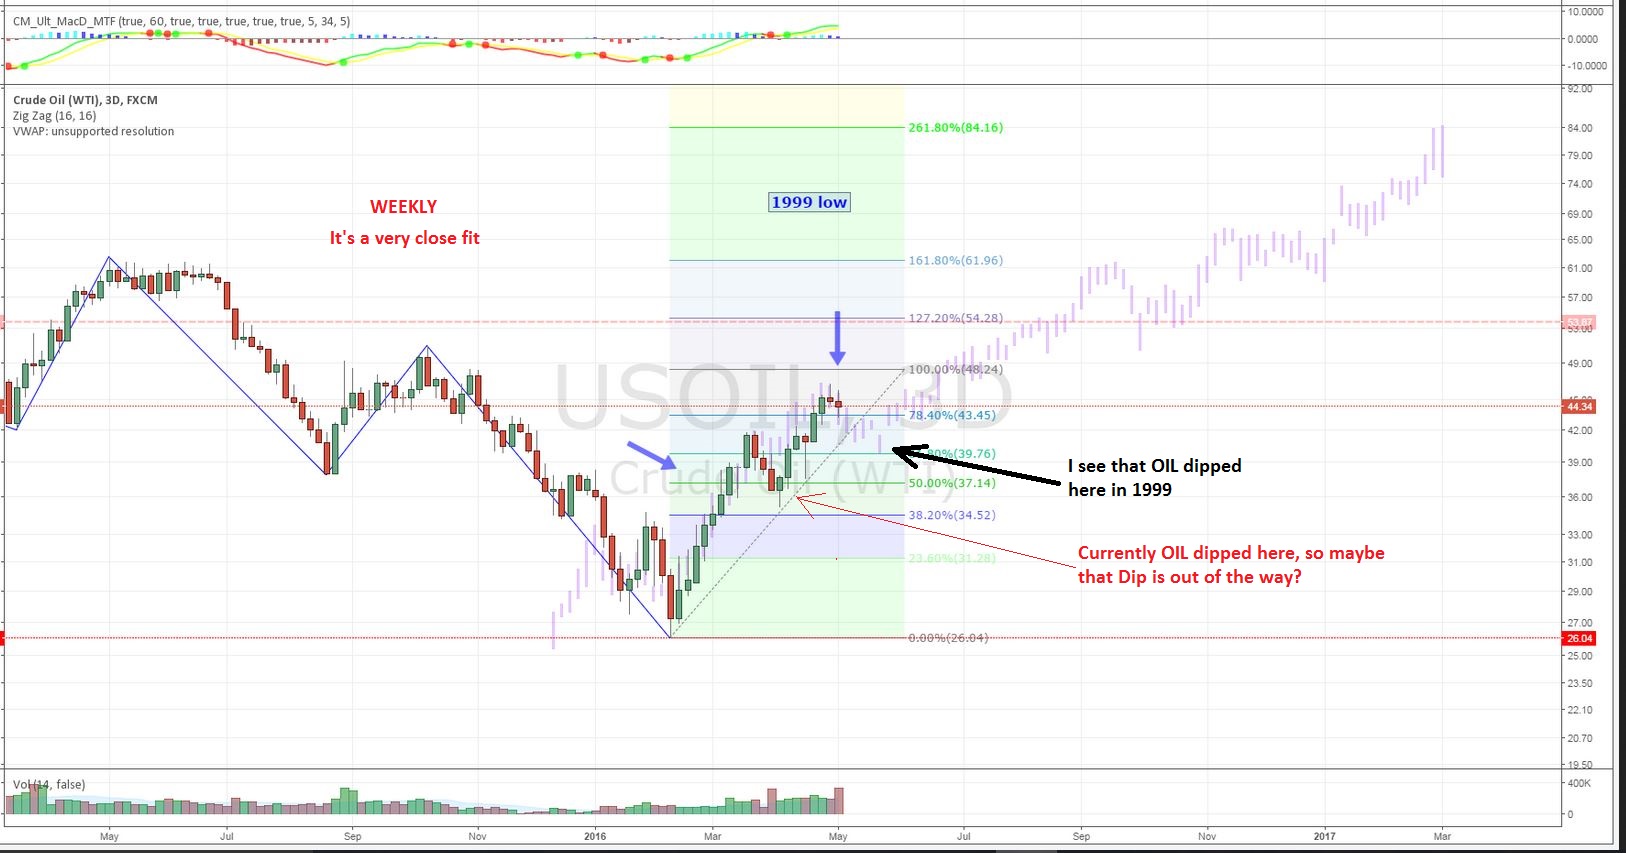
And another reader WHO SHALL REMAIN NAMELESS :), did a cool overlay of OIL 1999 recovery with our current OIL Rally.
OILWEEKLY – The 1999 rally out of lows is in the lighter purple candles, the current rally is in bold color candles. The fit is impressive. I added some writing about the timing of the dips, but my real point in posting this is to show that the longer term recovery for 1999 and 2008’s oil recovery was a V-Bottom that just moved higher. Lows were not revisited or tested. I feel that this time will be the same.


Emotions? Hmmm…Alex, clearly you have been reading the comments section 😛
LOL- The flaming dumpster was a good clue, but a full email box is an easy give away too.
It’s all good – we all deal with emotions in trading, but it is important not to allow them to cause our trading. Investing has to be a clear choice based on facts, not emotions. True, the markets dont always do what we expect and the added movement can affect our decision making.
At times, it is just best to clear the head and prepare for another trade if all one can think of is ” This is just horrible”.
The flaming dumpster made my night!!!! I couldn’t stop laughing!! Must have looked at that pic at least 10 times!! Alex, great report, as always!! I have found out in many years of studying this that emotions are our worst enemy. I’ve tried mastering that to not let emotions interfere, but when you do something as a speculator that you know you shouldn’t have, it’s tough to forgive yourself! Mistakes cost money. But I want to tell you something though, and hopefully others read this also, especially newer traders/speculators. I would love for you to be like other services, that have a track record, buy/exit points, etc…, so that all your subs could be on the same trades. BUT THIS WOULD BE WRONG!!! One of the great things about you and how you are doing things, is that your readers actually LEARN how to analyze a chart. You don’t give them fish for a day; you teach how to fish. If they leave your site, they will have become better traders anyway because of what you do. You are a very good teacher. You show incredible patience. I’m sorry for you that you have to read thru 150 comments of people going nuts over stocks going down, and maybe even interpret some as criticism. I think we can all say we have learned things while being here at CF. Although it would have been great for everybody to be in on the LGCY trade, it is impossible to get into every chart you put out there. Thats where homework comes into play. You analyze the ideas you gave, and if you like the chart, you buy it. If it breaks below a certain level, you’re out, ans that’s life. Some go up, some go down, and some go sideways, like BAS, and frustrate the heck out of you! But bottom line is, it is up to us to do our homework and put in the time to analyze these things on different timeframes. That’s where I failed last week. But this week isn’t over though. There’s still hope. Thank you again boss man for the great work you do!!!!! Thank you for your patience…
Thats nice, Thanks Peter. I know people are learning a lot here, and that is rewarding. And in the markets, EVERYONE learns the hard way many times. And I dont mind the emails, because I know exactly what people are feeling and concerned about, but todays report just highlights that …” If you take a trade, and it goes against you more than you thought it would ( Like my CLF just did), THAT is the time to make a decision and a game plan. Obviously, the original game plan changed, so make a new one that you can live with. Make a plan that allows you to sleep at night.”
If I get an email that says, ” I knew better but I went in heavy and I bought the top, and I havent slept in 2 days, because it has sold off for 2 weeks now . Should I…..? ”
I just say , “Sell it, you need to sleep and theres always another trade”. It’s not worth ‘hoping’ at 3 a.m.
I second that , Peter! Well said. One only learns by making his/her own decisions and what better way to remember and be married to them than to decide to put their money down on these decisions.
I missed the dumpster and went back to see it. Funny!
I have many flaming red positions I would love to throw in that dumpster! Including my FCX which I bought at the wrong time….as you pointed out in your report today….but that is a painful learning experience for me…so I agree with what Peter said below and thank you CF for your work, charts, insights, level head, encouragement and good humor.
Well Nancy, We are all still learning and students of the markets, thats for sure. Anything I write in my reports has usually been learned from experience. Trying to learn from past successes and failures is key. On top of that, the markets themselves can be tricky and throw curve balls in there..
I bought CLF at the wrong time, and so I am still learning a lesson that I already learned. When it gapped open at earnings I was thinking, “Oh good, the coast is clear.”
When it started to sell down, I thought, ” Probably just a gap fill, I’ll add to my position on a reversal.”
Wheres the reversal 🙂
Taking emotions out of the trading is probably impossible at times, but not allowing it to control our trading is important.
Alex, super, super, super!! I find these ‘trading mantra’ posts some of your best postings (…don’t leave out the charts though, they’re not bad either!) :-))
Thanks Deshy 🙂
I just hope something said helps someone.
Alex, VALE starting the day bouncing off the lower bollinger band and off the 50 SMA vicinity might be hinting at a short-term bottom. It’s early but I’m hopeful. And the dividend yield, assuming no cuts, is over 6%.
Yes, I see a few Commodities that gapped down and went green. Even HBM : )
A few Energy too, maybe we’ll have a good Friday after all? lol.
Vale came close but didn’t fill the gap at 4.50.
wow… ATW
nice volume & Just breaking out of that base too.
Looks like they released earnings last night.
will it now backtest that b/o ??
Hard to know, but the POP in CLF and LGCY didnt have follow through higher after earnings
its dropping now.. 10.79 may be a buy
thinking that explosive LGCY move may take more time to digest.
was 500% from the 0.8ish lows.
that 700% TPLM move in March is still correcting now, after 2months
Yeah….I sold mine 2 days ago at a slight loss…..was concerned how everything was falling…..so….yeah. I hope someone might still be holding it! :_
Full confession: sold it yesterday at 3:59 to minimize the drawdown in my acct, just in case of earnings dissapointment. :-/
BUT…. I did have ATW may 10 calls that are up almost 600% this morning, so I don’t feel like a total fool. 😉
BCEI – ( Earnings released already this week) .
My personal opinion – Great weekly chart with strong volume . Just put in a sweet reversal on todays daily chart after dropping $0.26 cents and filling a small gap from yesterday .
I added on that reversal.
MRO went as low as $11.78 missing my buy order by $0.10. Moving higher now, looks like I got too cute.
Alex, sorry for sounding dense, but that last chart on crude shows that in 1999, it continued dipping a bit more, so in your opinion, are we out of the woods yet or not? I’m kind of puzzled. Thanks:)
I dont think we should look at 1999 and imagine that it will follow it exactly, but it is following closely, as in , rather straight up out of the lows.
On the chart I mentioned that we just had a dip that 1999 really didnt, and 1999 has a dip that we may not have.
Using cycles, OIL doesn’t need to dip into a DCL for a week or tow really. I had a target of $49 -$50 shown in prior reports, then maybe a dip and a return to higher prices again,
Hope that helps
Does anyone have their entire account in the GREEN today?
I think my email overload & thus todays report called a ‘sentiment’ bottom 🙂
My entire account is Green. ( LGCY keeps flickering Red to green, , but well off todays lows).
I wish! But, it much greener than the last 3 days!
It’s early , but MDR looks good
OK, lets talk about “perspective” and “Emotions”.
Raise your hand if yesterday you hated the markets and wanted to sell everything, and today you are looking for something to buy.
yep 🙂
Ive been looking for buys the last two days. Problem Today same as Yesterday and the day before pump and dump.
In all honesty, havent even looked today… the close today is what i’m interested in.
Both hands up in the air!
gee whiz….I wish I had the guts to buy NUGT when it’s down…but it could make you or break you..
Looking…. but can’t have…too invested… and want to save a little for something spectacular.
Alex, do you have any explanations for the run up in prices each morning until about 10:30 then a sell off? Curious? Automated trading? Its noticeable in most of the commodity and energy stocks we are all trading.
Started position in AA….looks like it wants up but might be short covering…don’t know cause my crystal ball fell off desk and shattered. 🙂
did EPE have earnings yesterday?.. that had a rocket up its @$$
Alex, gonna post a couple of my charts as I have them saved. Curious that a lot of these stocks we are into are jumping to trendlines drawn in my charts, and stopping right there. Most are at least recovering at trendline support, which is great, but there’s a long time till 4 pm. So here you go… gimme a couple minutes…
Alcoa weekly… stochastics o/bought. Bouncing at support, rsi still >50.
AKS, Daily… bounce on the 50, being rejected so far at previous resistance. Trendline still holding.
CENX, same story..
Bullish engulfing candle on RIG, looks ready to rumble.
Good call Alex, you liked this Yesterday, nice run so far!
If its the whole sector RIG is in, SDRL, ORIG, AREX may be next. SDRL lagging. It performed well last run up.
HBM, anyone?
https://www.tradingview.com/chart/HBM/P5aDpOcW-HBM/
Good reminder Bill, chart looks like a trend reversal is in the works.
Already in. My stop is a bit loose, may tighten on Mon at 25 day. Thanks.
CLF, HBM, & RIG, all have this same look..
CLF could be starting the third leg of a three drive pattern. Two 61% pullbacks. Next stop $6.07
Fingers are crossed Bill!!
I will not fail to lock profits if given a 2nd chance to win!
The 3rd high usually exhausts the buying and can cause protracted selling. If this were to take place and someone had a longer term view, would still advise partial profits as available.
https://www.tradingview.com/chart/CLF/8xepmu5u-CLF/
I have them all. Poo.
Oh..I looked at your charts….maybe there is hope!
Barf!!!!
just got my own buy signal for BCEI
looks best placed of all my watch list
My ONLY green position for the week.
hmm… a reader…
… whomever could you be talking about…………….
I think that’s SOG, right?
..only after a rough night on the town ;b
clne finally popped …stalking that puppy 4evvvverrrr … crystal..was that you who also trades this one?
Wow, big time volume there.
I did. Got out with a profit but it was SSSSOOOO boring. SO of course, now it moves. LOL. Have a wonderful Mother’s day!
Perspective & emotions – Excellent theme for today’s report, Alex! I really needed this and will file it away for future use. Thanks for breaking down the thought process for me re: FCX and other stocks:)
Hey Alex – do you think gold is still going to fall into an ICL…or maybe it’s done what it’s going to do? I know it’s hard to know…but….it just keeps going up….?
It just keeps pissing me off. It completely defies all logic. I don’t understand why it just won’t go down. I own every other commodity and then fell all week but gold…
Alex.. i think we now understand the miners ‘melt-up’ you referred to.
the GDs seem relentless
Gold. Stop. Pissing. Me. Off.
‘..someday this war’s gonna end..’
i consider the orig cut “overnight with the French” an important part.”…And I walked on down the hall. And I came to a door. “Father?” “Yes son?” “I wanna kill you. Mother?…”
From my perch, I see a *possible* bounce coming in some of these stocks like AA, AKS, CENX, MRO,CLF, VALE, etc…, but…. I can not see how that bounce will hold given the action this week. There was zero bounce in these things. Can you see the difference in a weekly chart between stocks being bought/defended (GDXJ, for example), and stocks sold at the top and left free to fall (all the above mentioned)? I might be wrong ( I’m wrong very often!), but it seems to me a lot of these have a date with their 200 sma, or some other lower support level. MRO, AKS, both broke their weekly uptrend line, ending the week near or at the low for the week. I still hold MRO only because 50 sma is still holding. AKS is gone, as well as AA ( I feel more committed to CENX, both aluminum, and would hold and buy more at the 200, much lower than the close today. Sold out of my ATW calls because it is very oversold in the hourly, and still hold RIG and will buy into VLO when the signal triggers. Overall, if you are holding some stocks like CENX, CLF, VALE, HBM, etc…, be mentally ready to add lower, and hold for a while. IMHO, as they say. Enough of this geeky chart stuff!!!
Sounds like a sell then…
Alex, thank you as always big dog!!!!! My week in the market was brutal, but I’m still laying pool side enjoying life!!!! To all the mothers here in ChartFreak, HAPPY MOTHER’S DAY!!!!! Trading/speculating is a walk in the park compared to the job you all do as mothers!!! God bless you all!!! Hope you all are treated like queens & princesses… 😉 Have a great weekend!!!!!
how sweet you are.. :o) thank you peter…
*no fair taunting re: poolside … grrrrrrrrrrrrr ;o)
Thanks so much for the acknowledgment. You have a great weekend too.
How lucky are we to have this FL weather Nancy???? I don’t know where you are, but Miami today has been just about perfect!! Great weather for Mothers Day weekend celebration!! Hope you have fun!
Vero Beach. Yes, what a treat it has been for the last few days!
Happy Mother’s Day to all the Moms :o)
ChartFreak, here’s the reason why CLF’s been acting so poorly recently. News came out a/h today:
Casablanca Capital Issues Statement Regarding Sale of Equity Position in Cliffs Natural Resources
May 06, 2016 05:25 PM Eastern Daylight Time
NEW YORK–(BUSINESS WIRE)–Casablanca Capital LP today issued the following statement regarding the recent sale of its equity position in Cliffs Natural Resources Inc. (NYSE:CLF):
Due to the death of our former chairman and co-founder, Donald Drapkin, Casablanca Capital has decided to wind down its business. In connection with that wind down, we have exited our position in Cliffs Natural Resources Inc., held by funds or accounts managed by Casablanca, entirely.
About Casablanca Capital LP
Casablanca Capital is an activist investment manager based in New York, founded in 2010 by Donald G. Drapkin and Douglas Taylor.
Contacts
For Casablanca Capital LP:
Sard Verbinnen & Co
Matt Benson, 212-687-8080
Now that was NOT in the charts! Maybe a value investment to pick up their lost shares?
That’s what I’m thinking, Cason. I accumulated quite a bit 🙂
I hope Im wrong but it looks like CLF still may have some more downside from here. $3.15- $3 range maybe.
Let’s call Matt Benson on monday and ask him just how many more shares they have to “wind down”… that’ll give us an idea of where price might go…..
One of the gold stocks you mentioned that has a nice pattern is Mgh. Can you tell me why it has not been delisted when it has been under a dollar for a long time? It looks like it may be setting up to break out.
Hello Maria,
My name is Johnny. Brenda (better half) and I saw your overlay with 1999 crude. That was very cool. We saw your Randy Rhodes video too. Great guitarist. we just wanted to introduce ourselves and say thanks for the chart. Happy Mothers night! Johnny and Brenda
Well helllo there Johnny 🙂 and thank you very much for the kind words.. I have a ton of fun playing around with those overlays – it’s astonishing to me, actually. Human behavior intrigues me so……creatures of habit we are…. (said in my best yoda voice)
.. .. I also had a very special ‘proud and grateful’ mommy weekend ..thank you.. I’d totally take a redo.. lol
Have a great week trading….