
MAY 12 – Timing
After a brief market review, I want to point out something that seems to be telling me that now is the time to act. Lets begin…
.
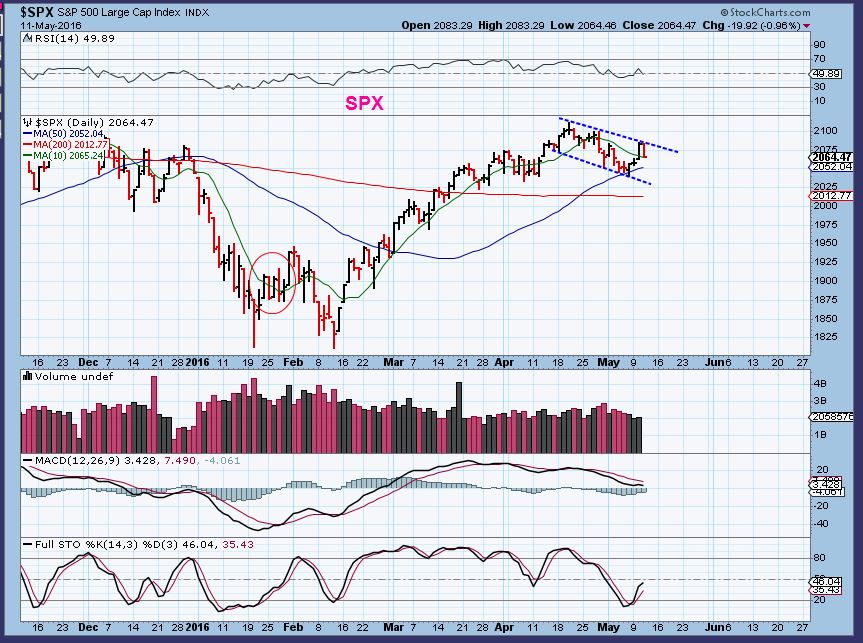
SPX – Price was rejected at the upper trend line, and it dropped down to the 10sma. The Red Circle shows that shortly after prior DCLs, price did the same thing. A drop below the dcl would not be healthy, the first daily cycle would be extending way too far and I would be suspicious.
.
From here I’m going straight to OIL, NATTY, and The CRB…
.
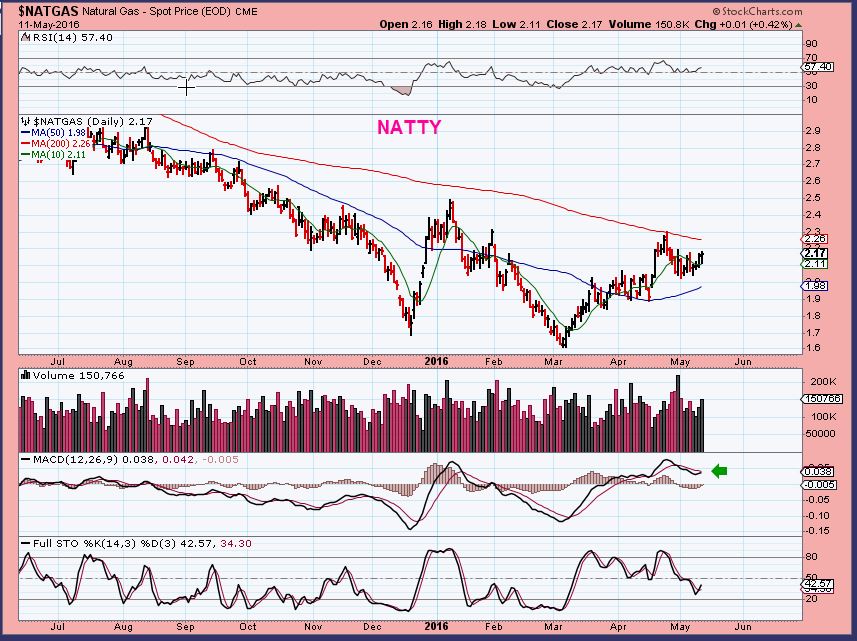
NATGAS – This still looks bullish , but as mentioned yesterday, difficult to trade, especially using UGAZ.
.
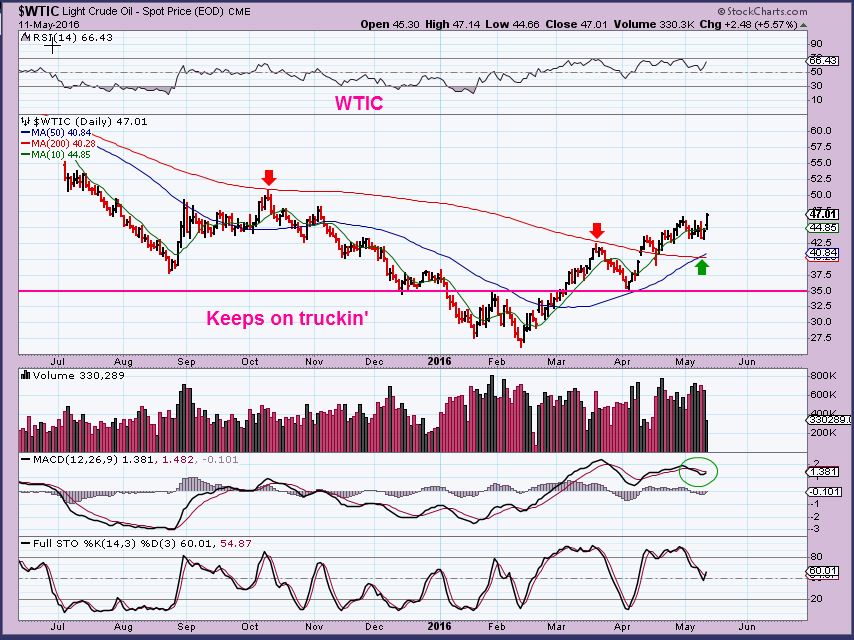
WTIC – Oil broke out of its sideways move. ‘Timing’ – I think the time to buy ( or keep holding) your energy stocks is now, because of the timing involved. I can picture Oil breaking through that $50 zone and doing 1 of 2 things. Either it then pauses and back tests and struggles at that area, or people recognize it as a break through back into the $50’s and buyers step in. I want to be in Energy if we get that move higher.
.
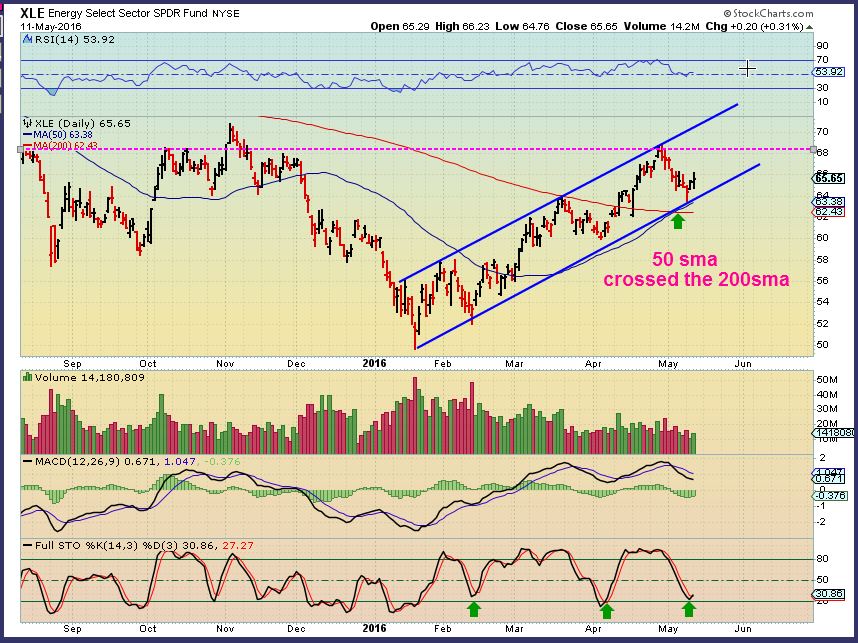
XLE – The XLE looks like it has room to run higher. I will discuss some energy stocks at the end of the report.
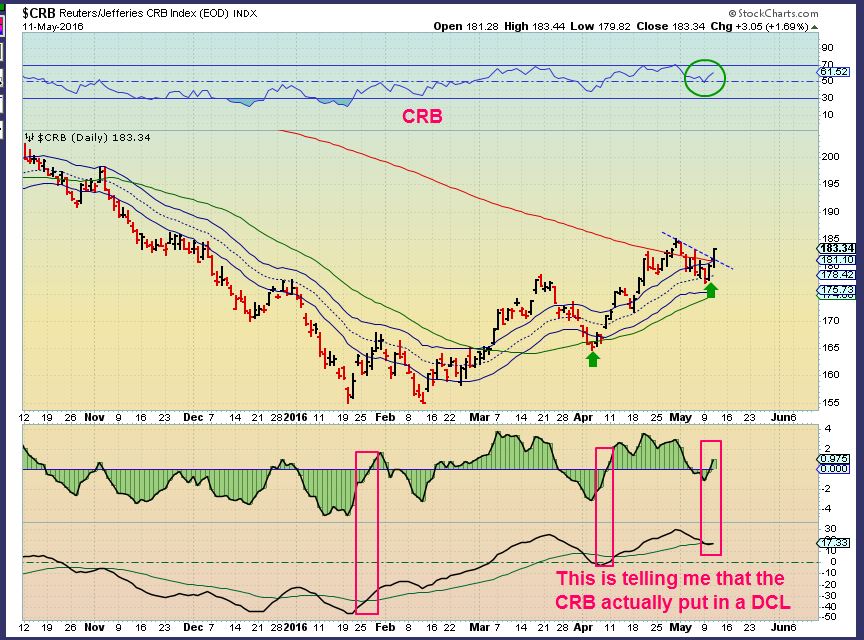
CRB – Look what the CRB did. This chart actually is telling me that the CRB has put in a DCL with that recent drop. Granted the CRB didnt drop nearly as fast or deep as many of the commodity stocks, but this is a good sign that those Commodity stocks could be ready to move higher again.
.
I still expect GOLD & MINERS to drop into a DCL soon, so I am not including them in the report. Yesterdays report covers that . In the comments section today, I was mentioning that I thought Energy Stocks were looking good, set up properly, etc. The same goes for some commodity stocks, but they dont all look the same at this point.
.
The title of this report is ‘TIMING’
.
Remember the Bouncing ball illustration? Each daily cycle bounces higher , but the first 2 daily cycles are usually the strong ones, the 3rd one may include the peak, and the 4th will be a lower high , lower low? A fourth daily cycle can really lose steam ( Tell that to GOLD and Miners, right?). Well, OIL, Energy, and Commodity stocks may rally again, but we want to get in early, because they may show signs of topping sooner. This time I want to be watching for that. A 3rd daily cycle is the time that I often try to choose stocks that have already proven themselves, not the laggers at lows. Als if earnings have been released and the reaction was favorable, this is helpful. Lets look at some stocks.
.
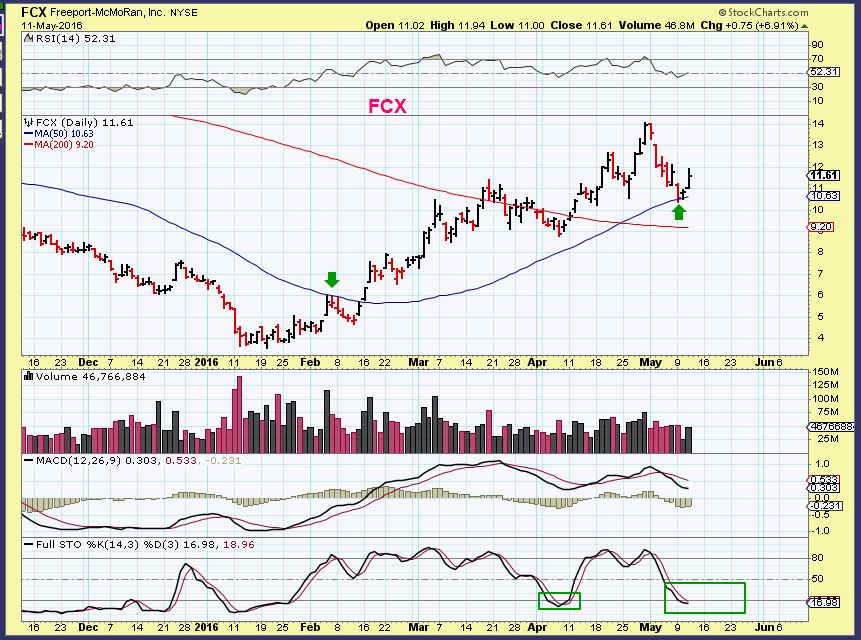
FCX – This is not an ugly chart, this is an established uptrend. Higher Lows and Higher Highs. It held at the 50sma, this could be bought ready to rally and could be bought with a stop below the 50sma.
.
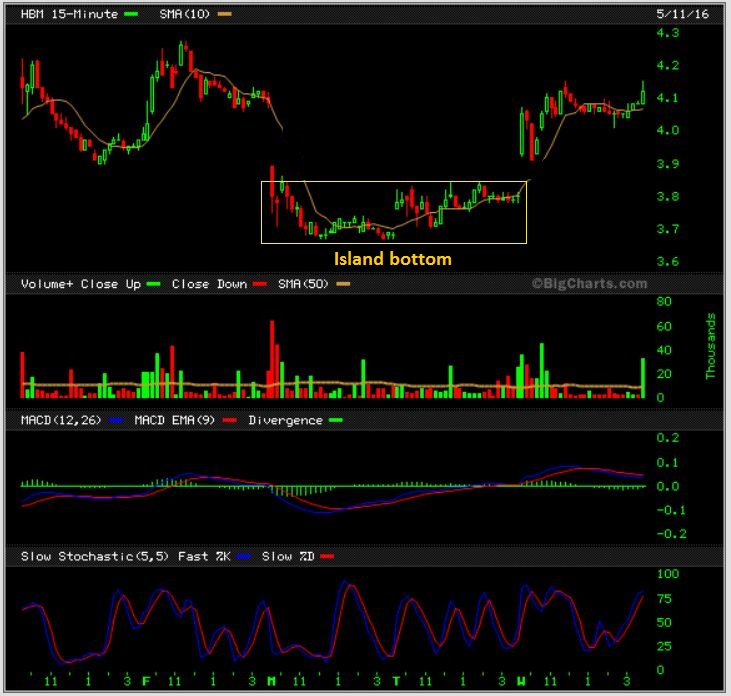
HBM – I still own this one and added today because of the Island Bottom that I mentioned at 10 a.m. An Island bottom is a buy and you can just get out if that gap fills. The gap did not fill, it continued higher.
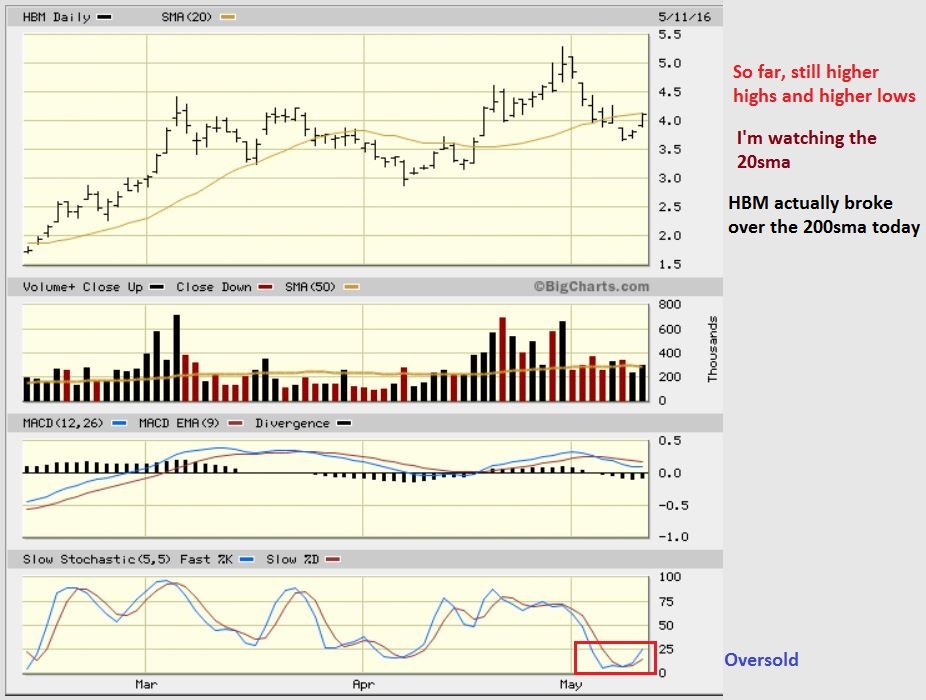
HBM DAILY – If that was a low, it should be able to break above the 20sma . That could be another area to add. HBM actually closed back above the 200sma (not shown) .
So for Commodity stocks , another move higher may be about to take place. The CRB broke above the 200sma, and my indicators are saying that was the low. All I can do is enter positions with stops in place and look for follow through.
ENERGY STOCKS – Oil is moving higher again, and it could run from here (At least to $50, possibly more). I have owned and held on to a portion of my BTE, BCEI, and LGCY stocks because I caught them low and these have acted well through out. Some Energy stocks have failed at earnings, others have done very well, so use that as a guide too. Lets look at a few ideas, to show you what you may want to look for if you are shopping for ENERGY STOCKS.
.
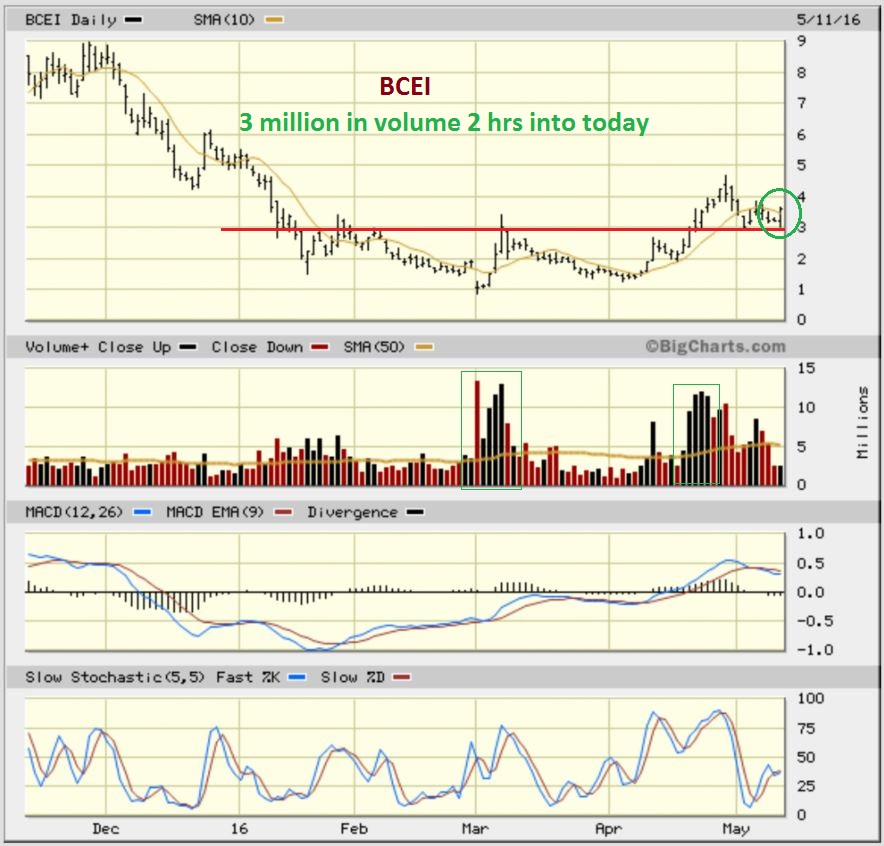
BCEI – I’ve mentioned this one several times due to the strong volume coming out of that base. This chart was captured Wednesday morning for the comments section. The pullback moved sideways along support and today a burst of volume started coming in…
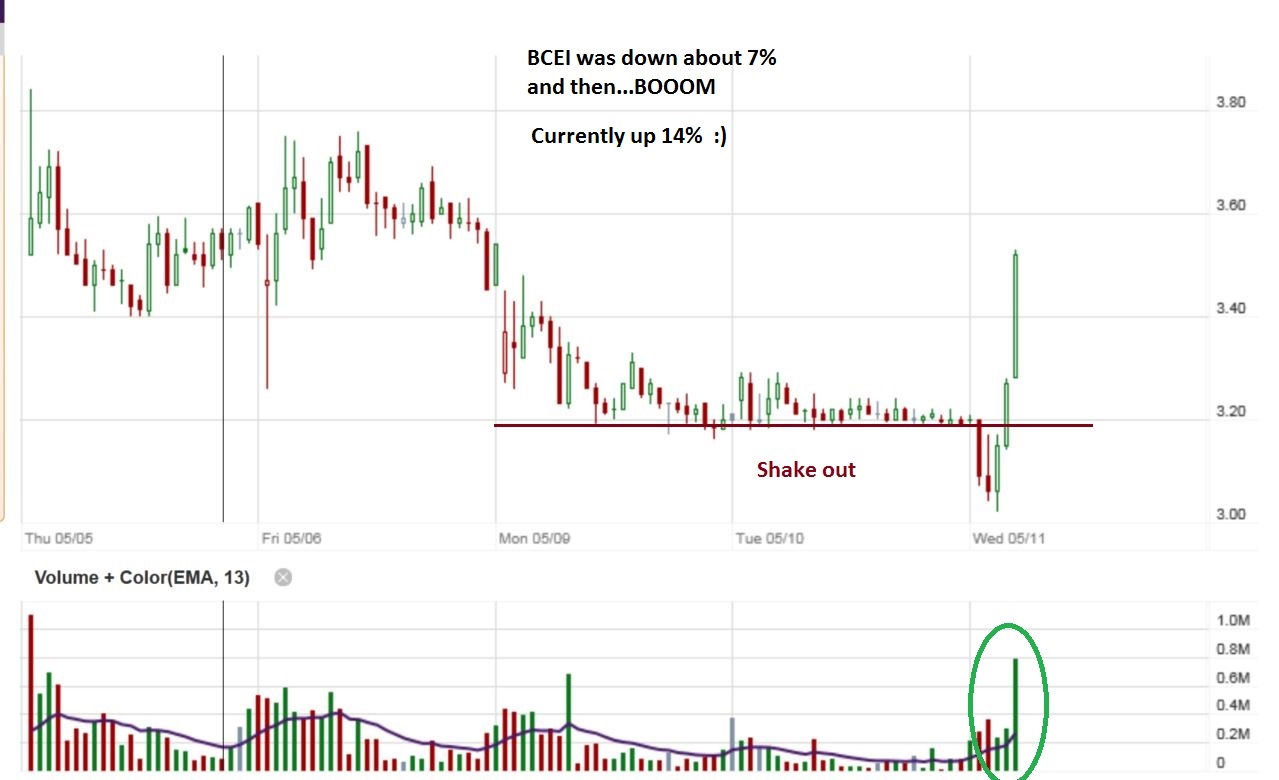
BCEI – I saw this shake out in real time Wednesday morning on the 15 minute chart and posted it in the comments too. I added to my position in the $3.20’s, my stop on that would be todays lows. Take a look at the chart above again. That reversal is also a buy in my opinion, because of the timing for OIL right now. The stop is still below Wednesdays price.
.
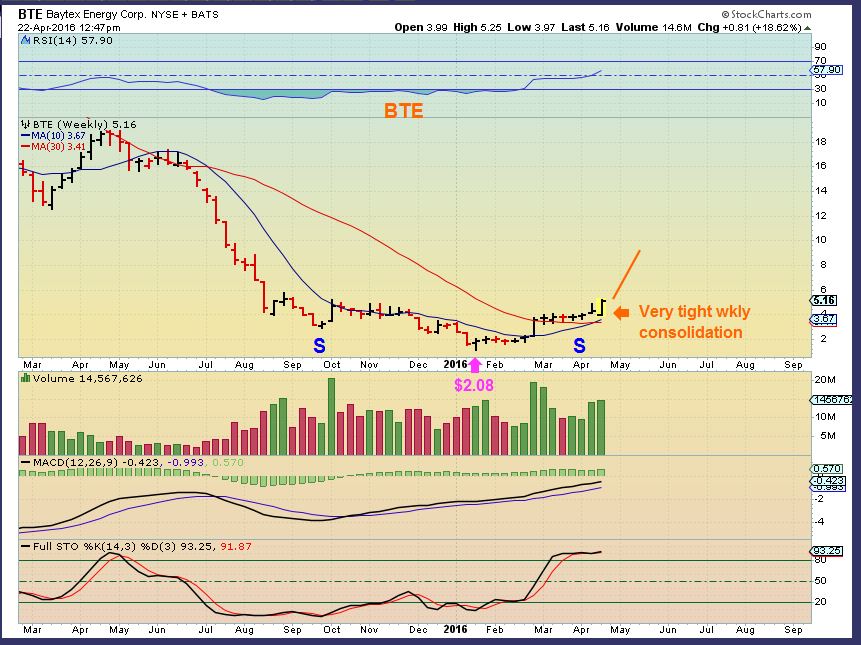
BTE – I have held onto my position in BTE , showing this weekly chart with nice upside potential if it can break out and run. I see minimal resistance on the left hand side of this chart. It pulled back and…
.
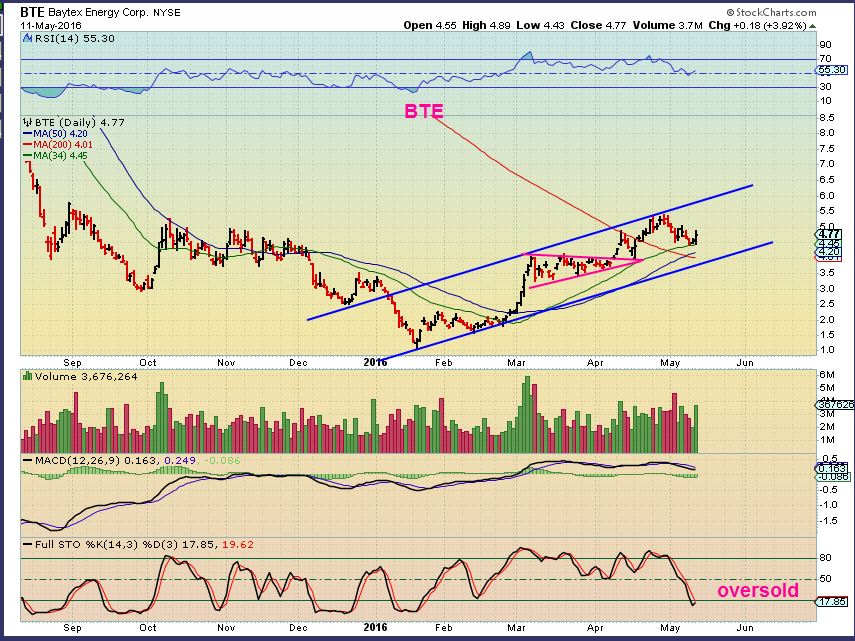
BTE – Today BTE reversed higher off of the 34 sma and volume looked good. It is oversold, but it basically has just dropped and moved sideways. I would ( And did add) buy BTE here with my stop for this purchase slightly below the 50sma.
.
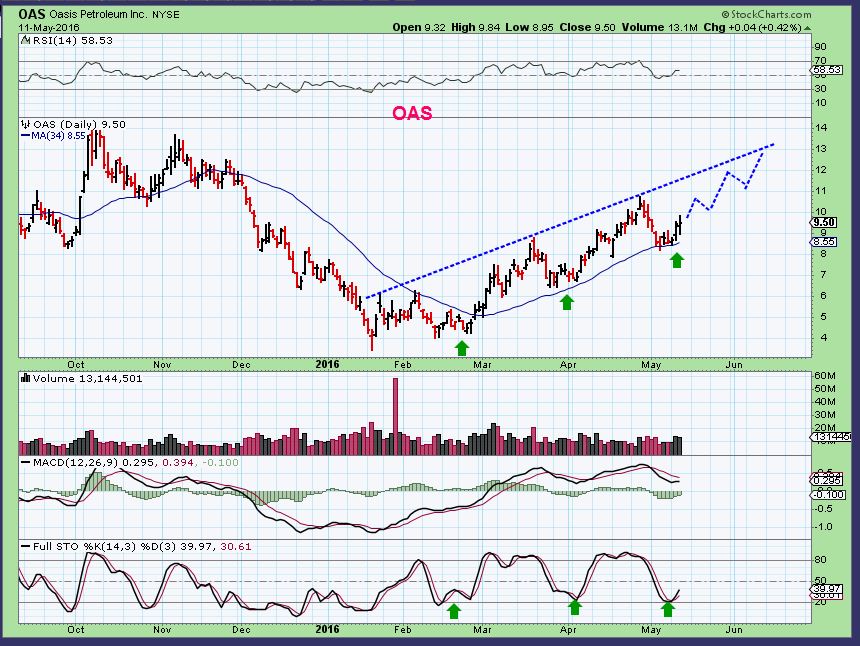
2 other stocks mentioned here quite a few times were WPX & OAS . I think that they both have acted well and their pull backs were somewhat mild .
.
OAS – OAS held the 34 sma for a few days and reversed higher Tuesday and Wednesday. Oversold, this could be ready to run and this would be a low risk entry.
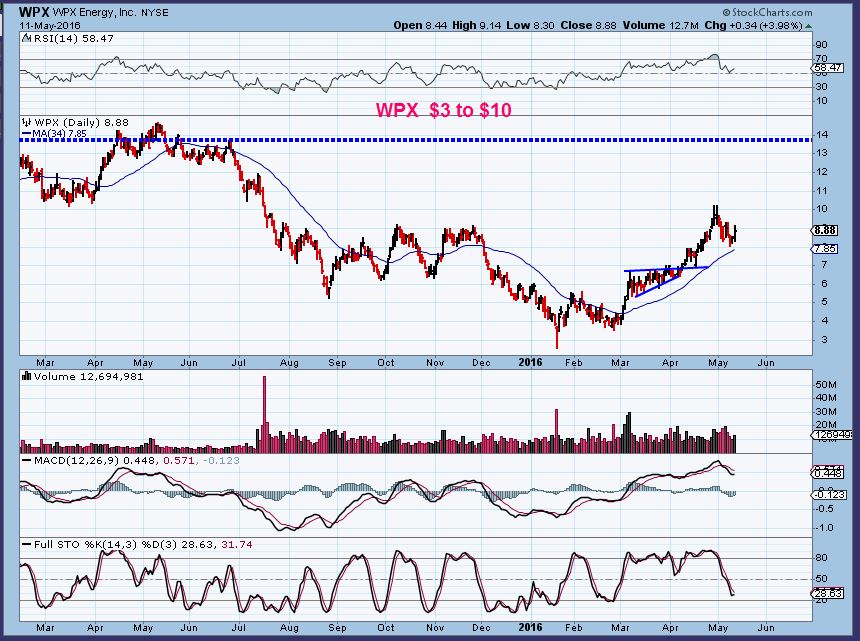
WPX – My first BUY recommendation was breaking above the trend line at $4.30 shown below. Did it act correctly or bullishly after that?
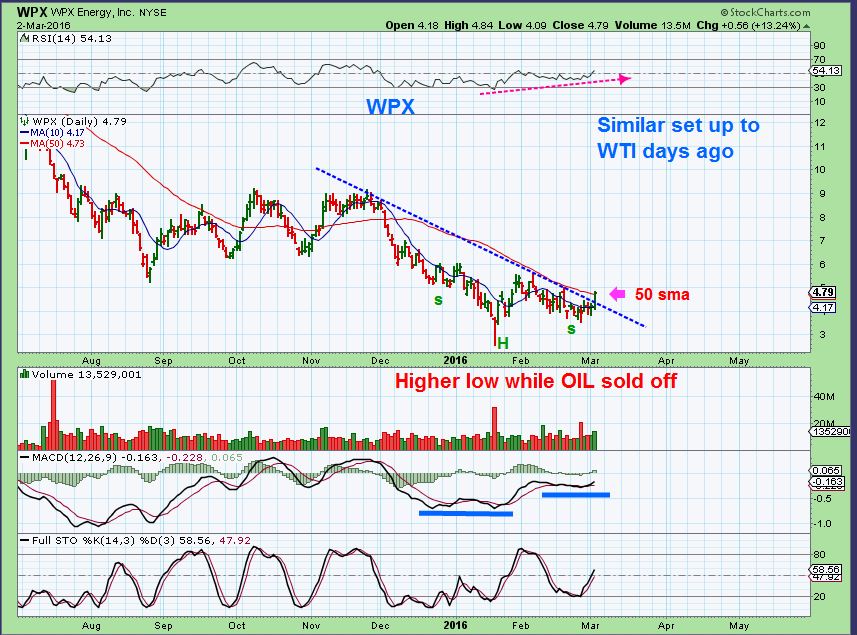
Yes , it ran up into a wedge consolidation and then it even continued higher. To me, that keeps showing follow through, so I would expect that if Energy is going to run higher, the WPX reversal Wednesday will hold and have follow through. This can run from $8 to $14
.
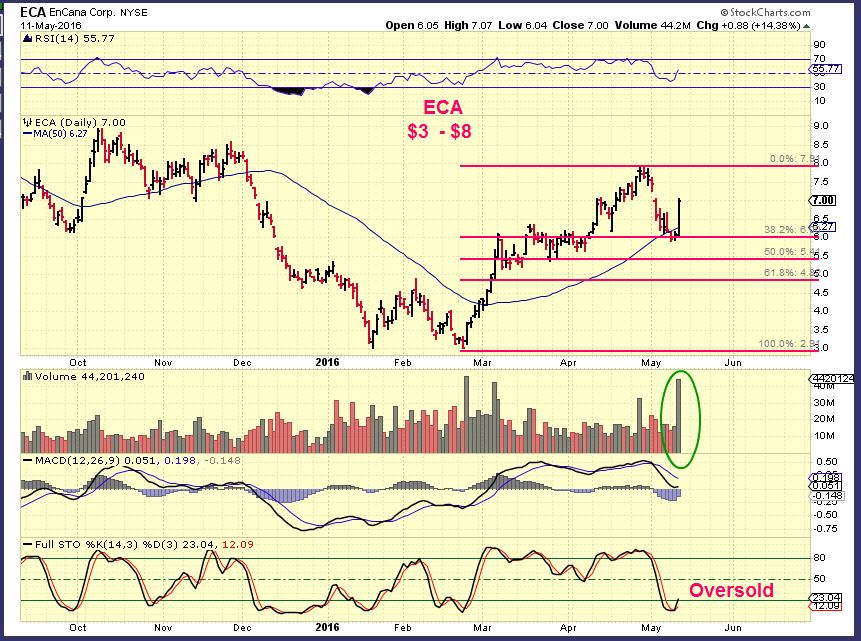
ECA – This stock ran from $3 to $8 and did a 38.2% retrace to the 50sma. Todays reversal was very strong and had strong volume. It is oversold and may just continue higher, but if it dropped Thursday, you may get a lower entry. It is hard to buy a stock that was already up 14% in 1 day.
.
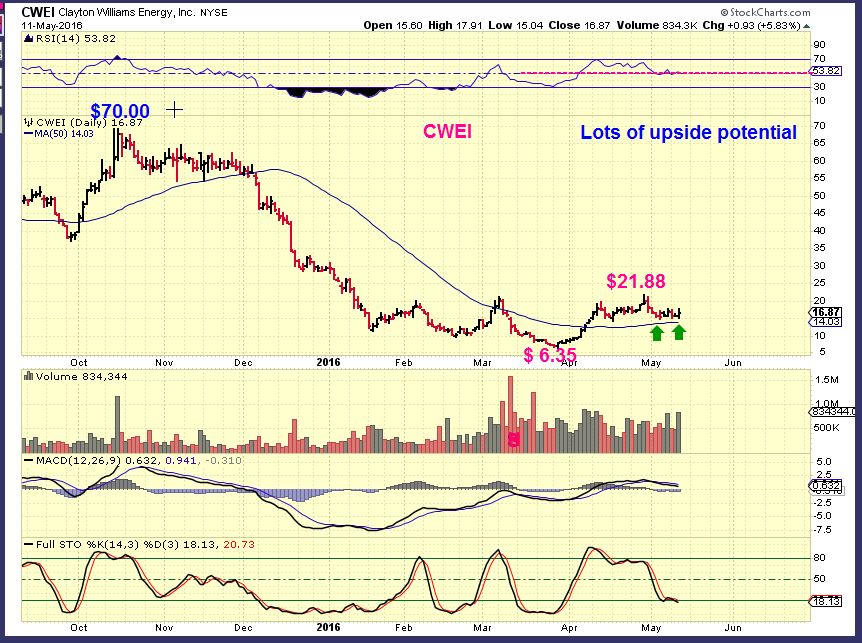
CWEI – I watched this run day after day as it crawled higher in April. I never got an entry in this one. It doesnt look like much, but when you look at the actual run, it was from $6+ to $21+! This sideways consolidation looks bullish to me, especially above the 50sma. Inverse H&S?
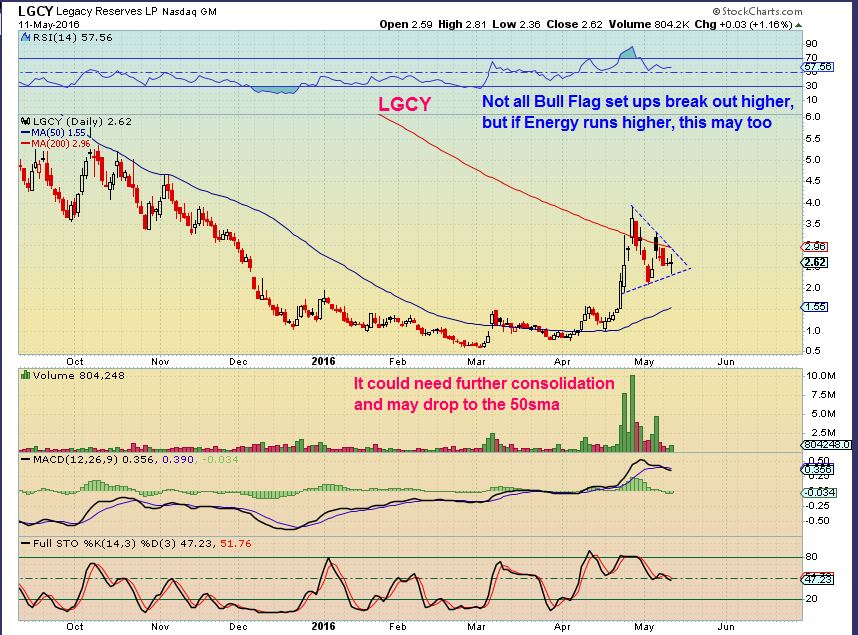
LGCY – Somewhat riskier, but I thought that I would point this out. This could be a bull flag. Some will buy a break out and place a stop at the apex of the flag. This does have the risk of still being extended, and possibly dropping to the 50sma instead of breaking out.
I also like DQ, SXE, and several others.
.
So that is where we stand today. The markets actually rolled over a bit Wednesday , yet Commodities and Energy stocks put in a reversal and stayed green. I think that the timing for OIL and the CRB to run higher is now. Even re-entering for a week or two may be enough to make some nice gains. I still expect Gold and Miners to roll over.
.
All we can do is see what Thursday and Friday have in store for us. Timing is important though. You dont want to wait a week or two and then jump in after you see a move higher has happened. That approach could have some buying too close to a peak on the run, if this is a 3rd daily cycle. Best wishes and as always , thanks for being here at Chartfreak!
.


Good stuff Alex. Was only gonna hold ERX in energy, but havebto admit that BCEI & BTE look very good. Will probably add one or both today.
BTE 1 hr candles… breaking out of wedge in premarket.
Ugly reversal so far in BTE
This was a nice chart. The trend line is sloping down and since this is a 60 minute chart, price may be dropping back down to test it. If it breaks back inside and closes inside, then I would think that it could drop to the lower trend line.
Alex, can you quickly give me your thoughts on Copper please? I bought a copper stock (cs.to) a wee bit higher then where it currently is. Copper looks sick. TIA
I sold. I’m sure it rockets higher from here. 🙂
Interesting tid-bit: TQQQ, which is Ultra Bull ETF, saw someone pony up 1.6 mill call option bet, that Nasdaq goes above previous highs by November. Major market rally possibly coming our way….
ktov / patent approved if anyone is following this one now likely to be looked for acquisition but trading it tgt 9-10
Alex, IPI congrats! You killed it. Wish I was on the ride.
Alex, All. LABU, just did a retest of the lower trend line. Low risk buy? Thoughts? https://www.tradingview.com/chart/LABU/uiAM4uYr-Bulli/
10:30 sell off! Again
Boo!! Not much of a DCL here, eh? As strong as Feb-Mar, I was with CF, I expected better. Could still get that next week, though.
Why?
Uh, the crappy price action. That was easy to answer.
When there is a little bit of weakness in the market like there is with oils this morning, it’s always interesting to watch when the few stocks I follow that have no overhead resistance manage to stay a little bit stronger – ie PXT.TO and VII.TO. These are not (at least so far) the high beta stocks like BCEI that could give you the big hail mary returns, just companies that have managed to figure out how to be profitable in this environment.
CWEI, OAS, AAV CPG , LNG, CNP, VOC, – Also remain green, although a sign of strength is missing from some.
Do you think the job report that came out has pushed the stocks down? Something seems to be getting to them…..? Hoping it’s just a knee jerk reaction and will recover….
some of yesterdays gaps being closed?
FCX HBM
I just saw that on FCX & HBM too , and holding right at the 50sma. . It looks good that way, but if it closes down here you get that engulfing or outside day. Not a great thing to see when expecting higher prices.
( NCQ looks like a bull flag).
Thanks for the heads up on the gap fills….maybe that is what is happening with some of them…that would be nice!
Marketwatch attributing this to Cleveland Fed Pres comments this morning. Voting member. Just put Jun rate hike back on the table. Seriously, people, doesn’t the Fed realize that when they do their dang randomly scheduled jawboning that regular, hard working folks like myself lose money!! Buttheads!
I know….if we only knew beforehand what was going to be announced…..it would be all rainbows over here at my house 🙂
That’s when I get mad. We know major events like mtgs and can cash out. But they have a minor player talk during a luncheon and start hitting on policy. That’s crap.
Just to close the loop on my fcx story, at the urging of a day trader I know, I took a quick profit on it yesterday at 11.57. My first day trade – lost my virginity and have a grin on my face at the same time.
Oh my…
Nasty reversal in oil, wiped out a lot of green today,,
Anyone else getting real nervous here?
Yes…..trying to decide if should sell before things go more red, or if it’s a great time to buy….? Sitting on PACD for a while now at loss and really want to dump it…but as soon as I do…..it’ll be good for anyone else holding it because I’m sure it will go up then! I got CLF this morning and it’s red now…..but wondering if now is a good time to get more…? OAS dipped down into red but now it’s showing green again…
Yes. Very nervous!! I’m already awesome at buying tops. Don’t want to sell the bottom either. But if we do go lower again, I want no part of it!!!
Yikes! Came back to the computer and….OUCH!
VALE, which had recovered the 50, is back below it. BTE, which was strong premarket, made a pretty ugly about-face. MACD readings in a lot of these has lines VERY far apart from each other. I still think we see a relief rally coming, but just don’t know if we see UUP at 50 sma first. Question for commodities is: relief rally, and more downside? Or relief rally, consolidation, and new leg higher?? It seems like we’re re-living late last year in miners all over again, but with CLF, VALE, CENX, etc…
And there’s no use in getting nervous. It is what it is. Hopefully you all are not overly invested, and still have $$$ to add or defend those positions. Investing truism: when your positions go up, you feel you didnt have enough in it; when you’re down, you feel you had too much. Remember you’re trying to win at a game that’s stacked against you!!
Nope. I’m nervous still.
A break below last week’s low on the S&P would worry me but a reversal today or tomorrow and a break above tues high would be a good sign.
Exactly Miller …I just posted a chart above.
What DOES have me feeling a little better is that big bet I wrote about further down. 1.6 mill bet that the market goes higher, LED by tech… pretty bullish. However, that might not mean squat to commodities though…..
USO, say hello to 300eMA resistance (4H chart.. yet another reacts to this eMA)
ECR holding up well, although seems oversold and tippy on the weekly
Oil seems to be trying to recover off the days lows but still well below the high, waiting to see where it closes, above yesterday’s close or high would be encouraging,
When you have this kind of environment, best thing you can do is go further out in time. Daily and weekly timeframes. The intraday moves will make you crazy. A lot of these stocks we’re following have a negative MACD cross in the daily, and a negative stoch in the weekly. This coming after negative divergences in just about all of them. They COULD pop higher, but probabilities say more weakness. But we could be seeing momentum divergences start to appear in the dailies. Not there yet though.
I just got in, so let me post this. DCL still valid in SPX and DJIA.
NAZ is rather ugly, stuck below both the 50and 200sma as resistance, but the lows also have not been taken out ( DCL )
.
refresh
.
Valid? Yes, absolutely. Fun? Hell no.
Alex, is IPI a buy here?
I had a partial sell at the open, and I was thinking of adding now , because the 50sma seems to be at $1.17.
You would at least have a possible support area to stop out of if needed.
Bill-
Refresh for a chart. This can drop further, and it also can bounce around down here for days, so it is a tough choice. It is near a possible support area.
.
MARKETS just turned Green, Oil turning green again , bounced right off of the 50sma.
Shake out? Are you having fun yet 🙂
Lets see how this thing closes
Alex, and the rest of CF’s, thought I’d throw this out there for perspective. The cleanest trendlines I can draw are on a weekly chart. Weeklies give you a great sense of perspective. So I’m holding CENX, VALE, CLF, HBM, and a couple of others that have been put through hell last couple of weeks, and trying to figure out where a relief rally might go, in case I want to rebalance and sell some, or move out altogether. Some have already broken their uptrend line, BUT… that then means a new downtrend has been established, along with its downtrend line. So I go back and look at these, and there they are: downtrend lines. The weekly downtrend line on these is much higher than where we are right now. Of course the line is heading downwards, so nobody knows at what price these stocks will tag those lines. But they suggest that a relief rally, or new leg higher, will take price to those lines, again, much higher than where we are today. Just in case anybody feels like throwin’ in the towel before 4 pm. We could get that rally within the next few days/weeks.
With that said, added to CENX, CLF, HBM, and started BTE. I’m starting to embrace red!!!! 😉
I’ve been thinking the same thing, that maybe I just need to embrace it and buy more….so I won’t regret it when it all goes back up….but so hard to pull the trigger at times like these – for me anyway. 🙂
Tough to pull the trigger right Tammie?? Thats a buy signal. Just don’t go too crazy. I’m doing it myself because I believe we get that bounce. But I am still sitting on 50% cash.
Ya, I won’t go crazy….:) I usually only have about 20%-30% at one time in stocks…..just too gun shy to have more in – of course I regret it when they go up nicely – then I wish I had 100% in……still licking my wounds over gold miners from the past few years so taking it slowly….
Embrace the Suck!
Because I think that we may be looking at a 3rd daily cycle here, it might not be as strong as the first couple of legs, so I tend to agree that the rally wont be to new highs. They often find new resistance. We could get a rally of sorts for 2 weeks ( 10 trading days = just a guess) and then temporary top & drop or move sideways to down.
IF we remain in a bull market, the 3rd daily cycle starts to re-set sentiment, people become less bullsih like in these comments sections and public blogs, they get frustrated that the gains arent as good as the first 2 runs higher. They even start to short them, and then they put in a new ICL and shorts are forced to cover , which then starts another upside strong run again.
I’ll have to put it in the weekend report, so that people understand the movements we could see better.
Alex, makes perfect sense. Certainly to anyone following you for awhile. The problem is that I needed to make different decisions 2-3 weeks ago. I got too tactical and too caught up. Looking now at maybe just playing defense.
what a day to buy oils if you have conviction the USD index will continue down (I do). I’m fully loaded, but do plan to remove myself from the gold miners party at the end of this wave in a few weeks or whenever it matures.
Here goes SDRL as we speak
Alex, do you have any thoughts on GTE? It hasn’t sold off today like some of the others ….
Tammie – have a look at the chart for PXT compared to GTE – they operate in the same space in Latin America – Columbia.
Some are some arent.
GTE is still above the 50sma and in an uptrend/.
ROB – I was away all morning and missed your question on Copper, sorry. I saw that you sold by the time I got back.
Copper looks rather weak at this point, the copper stocks may only put in a bounce .
its all good. thx
Here’s the copper chart. The only thing that I’ve seen that looks worse than this is my old friend CJES! Stoch is oversold and the RSI(14) is real darn close. If this does NOT recover, we can pretty much kiss FCX, CLF, HBM, etc. gains goodbye. I’d watch this closely. If we lose this, it’s back under $2.00
4-hour chart of HBM closing the gap like a pro! But this HAS to hold
*REFRESH*
Pull up CLF and VALE daily charts with the ACC/DISTR line and you can clearly see 3 surges to a new high and then heavy distribution. Alex, maybe these reset here, cleared the bills and can move up again. Thoughts?