It Happens
Have you ever been thrown off of a Bull? Maybe your stop was triggered only to see that stock turn and move higher. What can you do? We’ll discuss that after a quick market review.
.
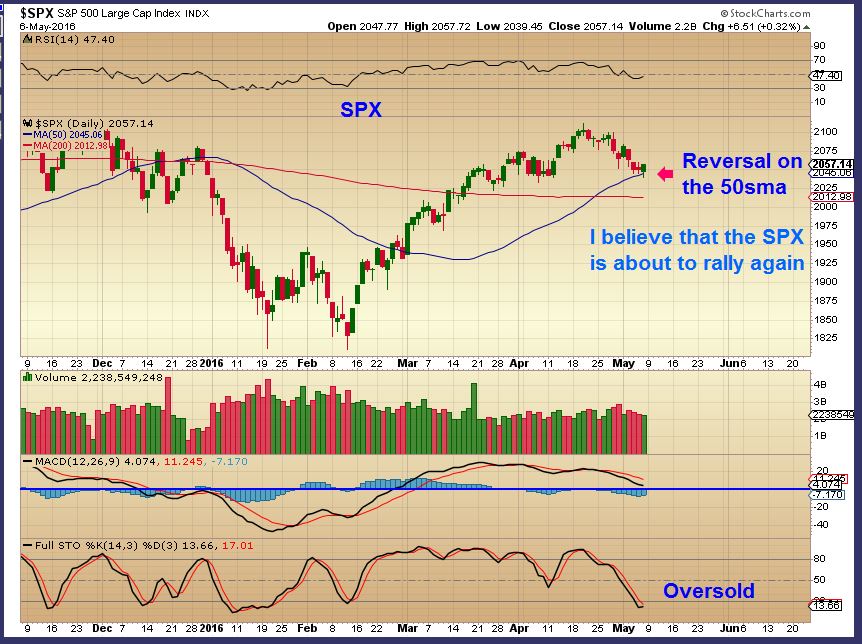
SPX – This was my May 5th chart. I have been pointing out that the SPX ( And general markets) are due to rally.
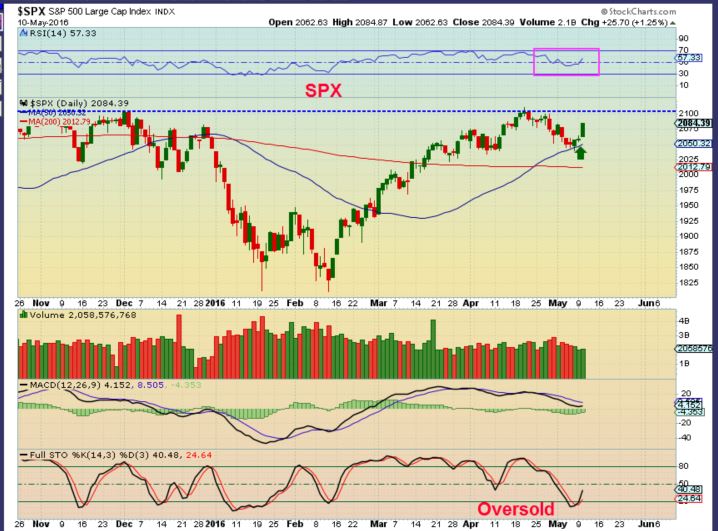
SPX as of Tuesday – That is what we see happening as the markets were green for the past 3 days.
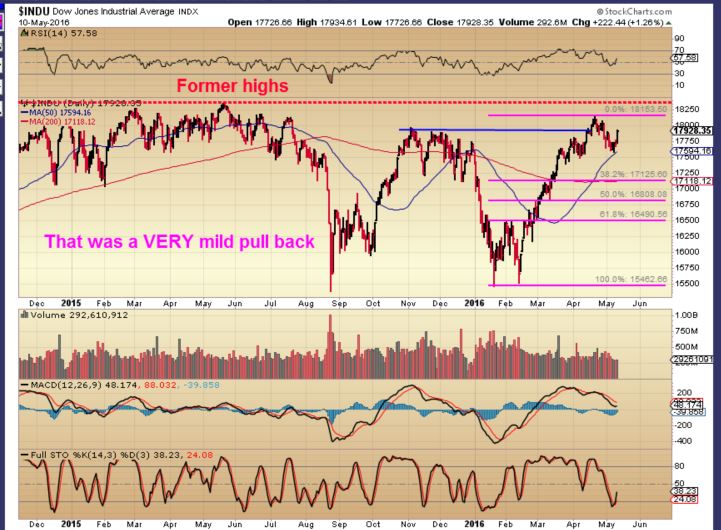
Notice the DJIA ( Dow Jones). This pull back was more sideways than a steep drop, it remains close to the May 2015 highs. That was not even close to a 38% pull back, so we may be in for a strong rally from here. The sellers were not able to push it down, and all I heard was negative news about the markets and earnings. “Climb the wall of worry”? The markets might rally to new highs and really run when most are not expecting it.
.
IBB April 4– The IBB broke out of a base in March , and I had been anticipating that as a bullsih sign with the rally in the general markets. I pointed this out here on the April 4th chart.
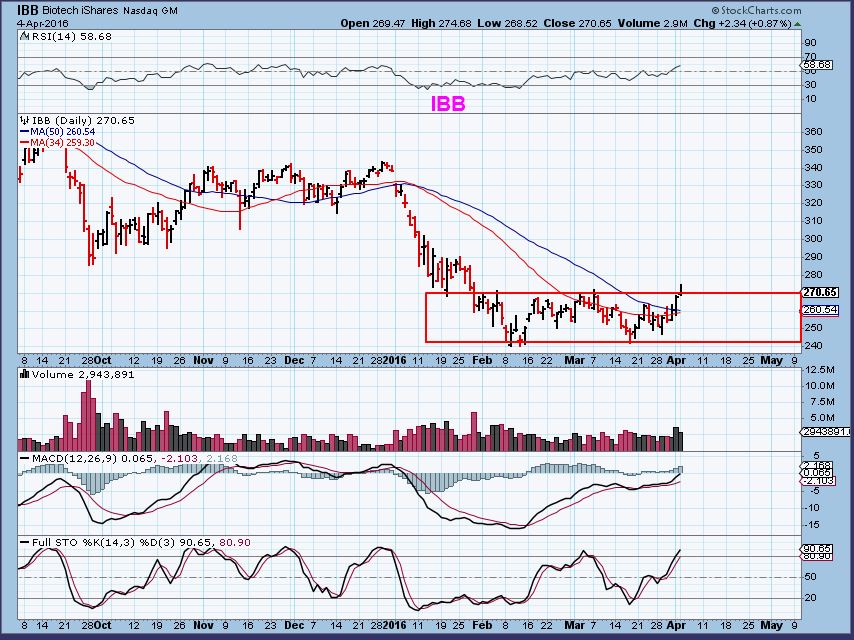
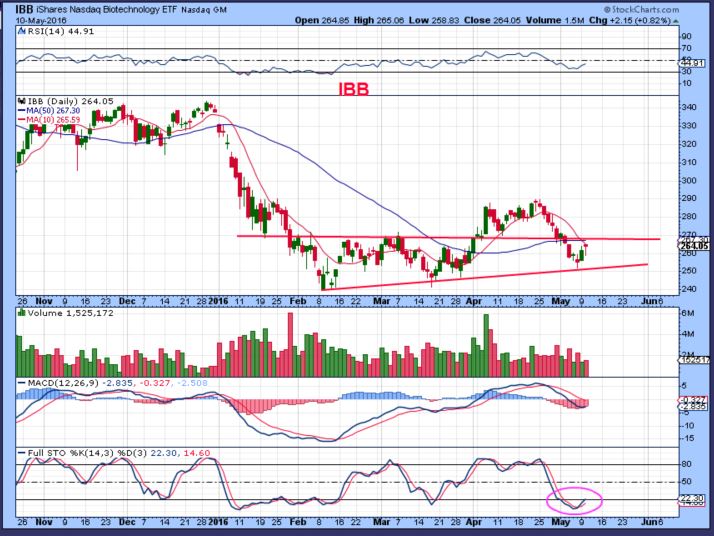
The IBB back tested the break ( Still good) , but then just meandered along and then broke back down back inside of that base. When a “Good set up” that I feel is bullish for “certain reasons” fails? I leave it and keep an eye on it as time goes on. Lets revisit the IBB.
1. So right now the IBB is back inside of the base, but trying to break out again.
2. It has a series of higher lows too, and that is bullish.
3. The volume is light and this isnt strong looking, so it need more time to prove itself to me. Time will tell.
.
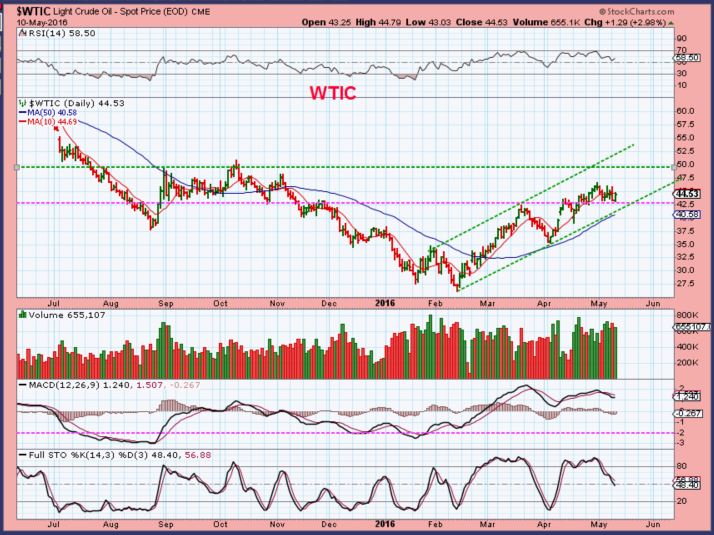
WTIC – Oil has provided no change since my last few reports.
NATGAS – Basically NATGAS has moved sideways, being pinched between 2 major moving averages. It still looks like this could play out in a bullish manner, but as time goes on, it will want to dip into a DCL. Maybe that is just a drop to the 50sma, however…
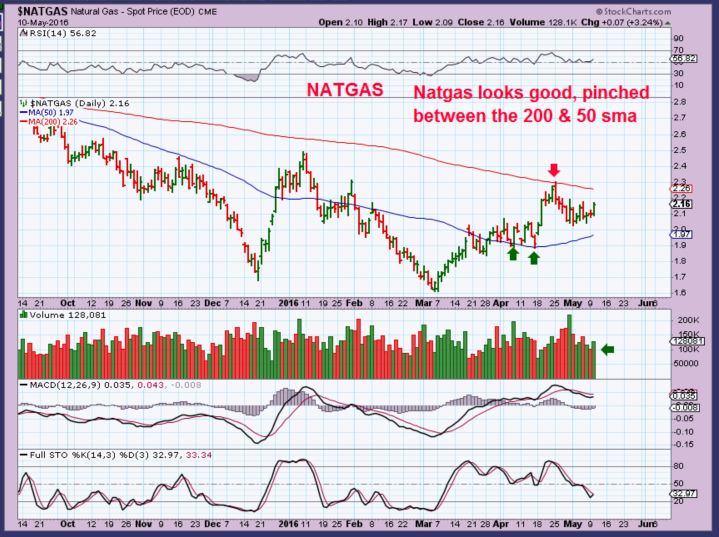
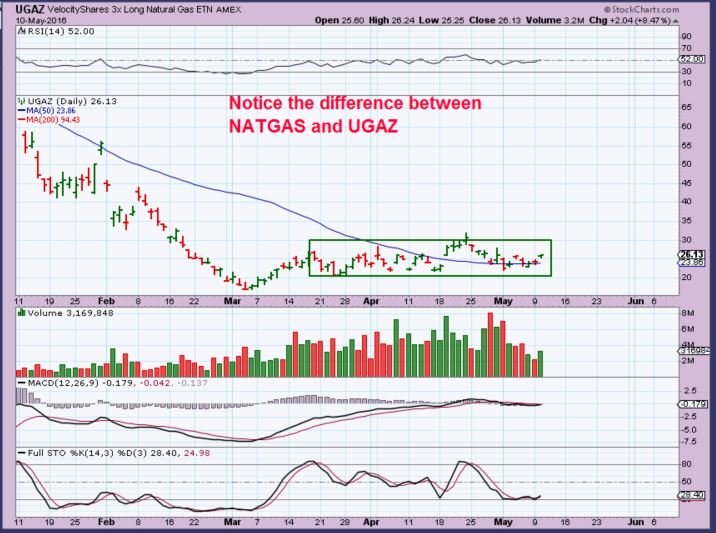
I have warned that the 3x ETFs are NOT for long term trades when a sector consolidates, moves sideways, or bases out. Many that write to me play NATGAS by using the 3xetf UGAZ.
.
See the above chart again. Notice that as NATGAS has moved higher out of the lows, then sideways, then higher, and now sideways, it is well off of its lows.
.
This is UGAZ, the 3x etf for NATGAS. DECAY over time does NOT put this well off of its lows. This goes for NUGT, JNUG, DUST, JDST, LABU, UGAZ, etc. etc. Please understand how these work over time, before you jump in and plan to ride it. If you do not have a trend, they will decay.
.
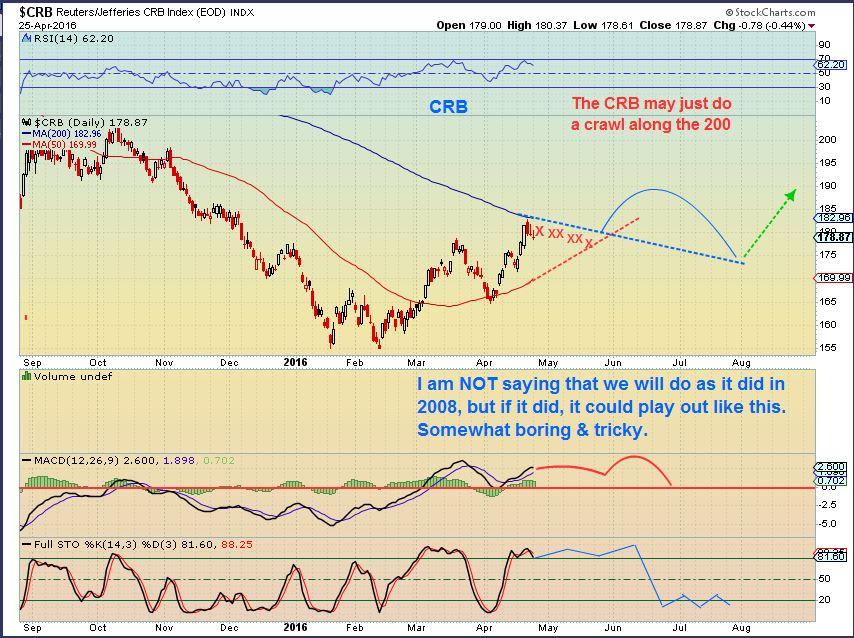
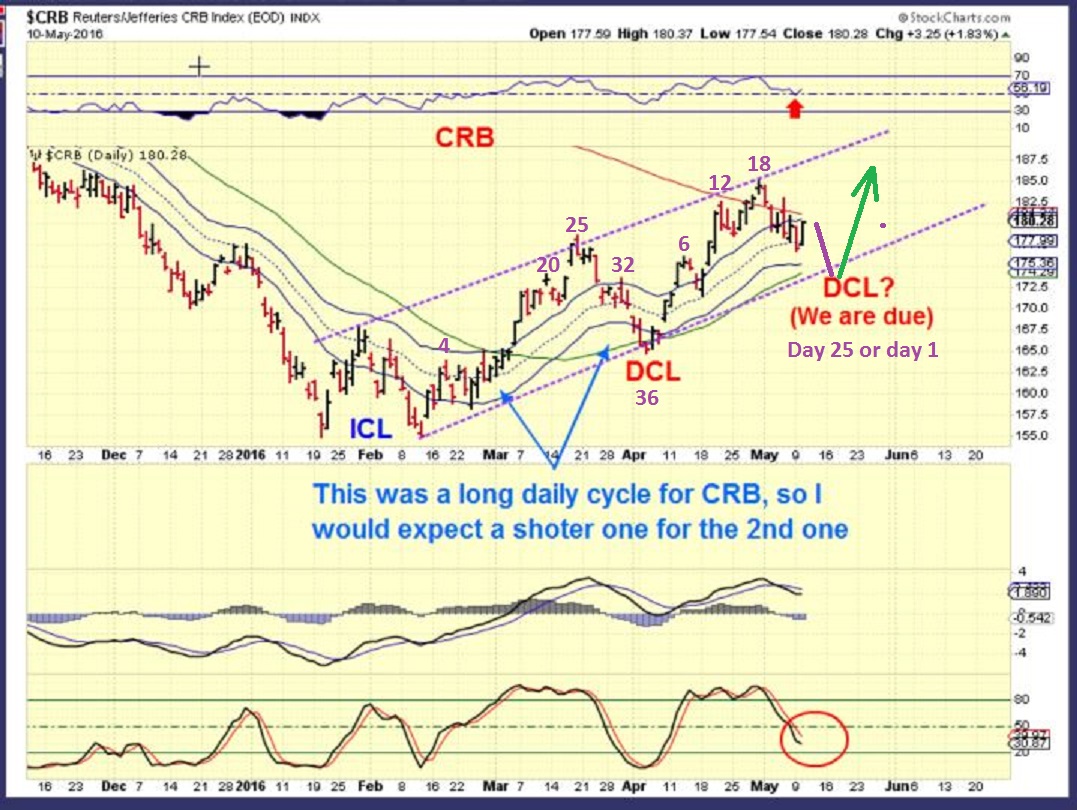
CRB – Back on April 25th As the CRB approached the 200sma, I had a feeling that it would crawl along the 200sma, and tag the 50sma eventually , building steam to break out higher (Hopefully).
Here is the CRB – Basically it has done just that. No strong break above and run, no solid drop. The MACD kind of looks like it tried to curl up with todays push higher. lets zoom in…
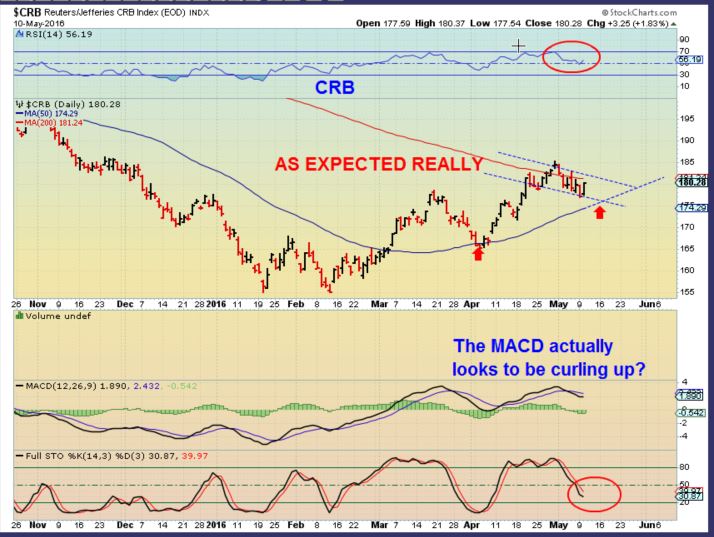
CRB – Is the CRB preparing to break above the 200sma? If it were to do so now, I’d think that Monday was a DCL, and we have started the next daily cycle. The 1st daily cycle was really long, so I would expect the 2nd to balance that out with a shorter one. Obviously there is still room to drop and tag that 50sma, so I stayed patient and watched this play out.
.
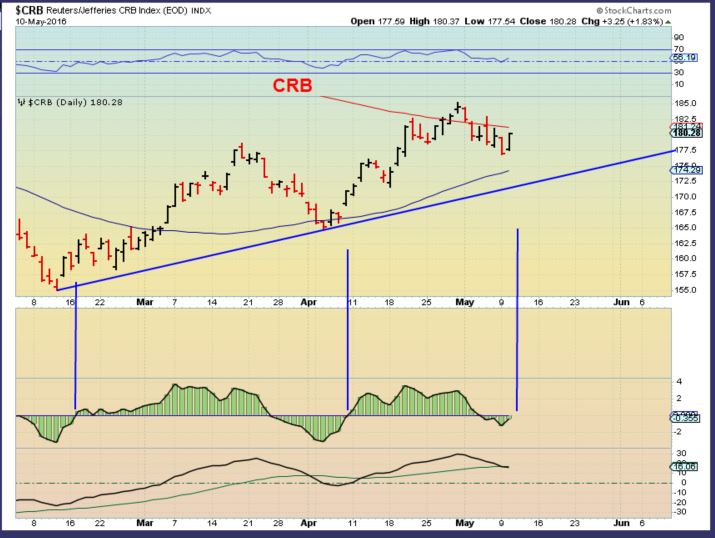
CRB CYCLES – We have a trend line break on the break back below the 200sma. A trend line break overhead ( a move above the 200sma) would make me think that we have left a DCL behind.
I can also picture a drop to the 50sma into a DCL , and then a run higher, so we need more time.
.
Time will tell, for now it is rather 50 / 50.
.
GOLD & MINERS
.
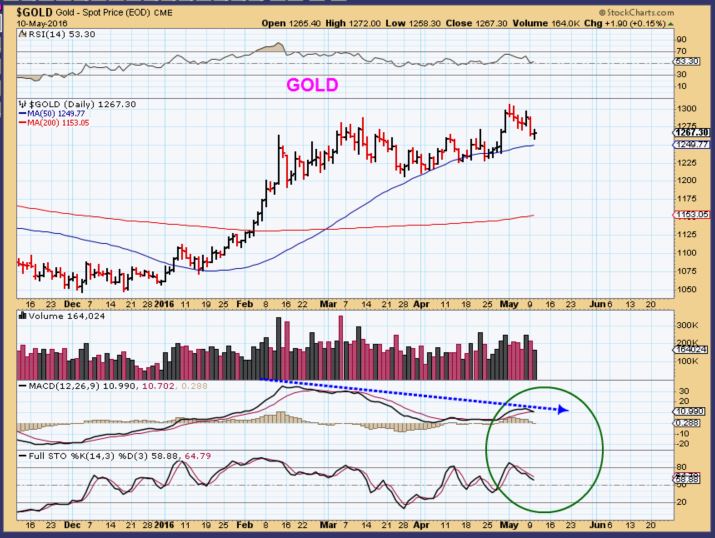
GOLD – It is still above the 50sma, but the MACD shows weakness on the recent climb
.
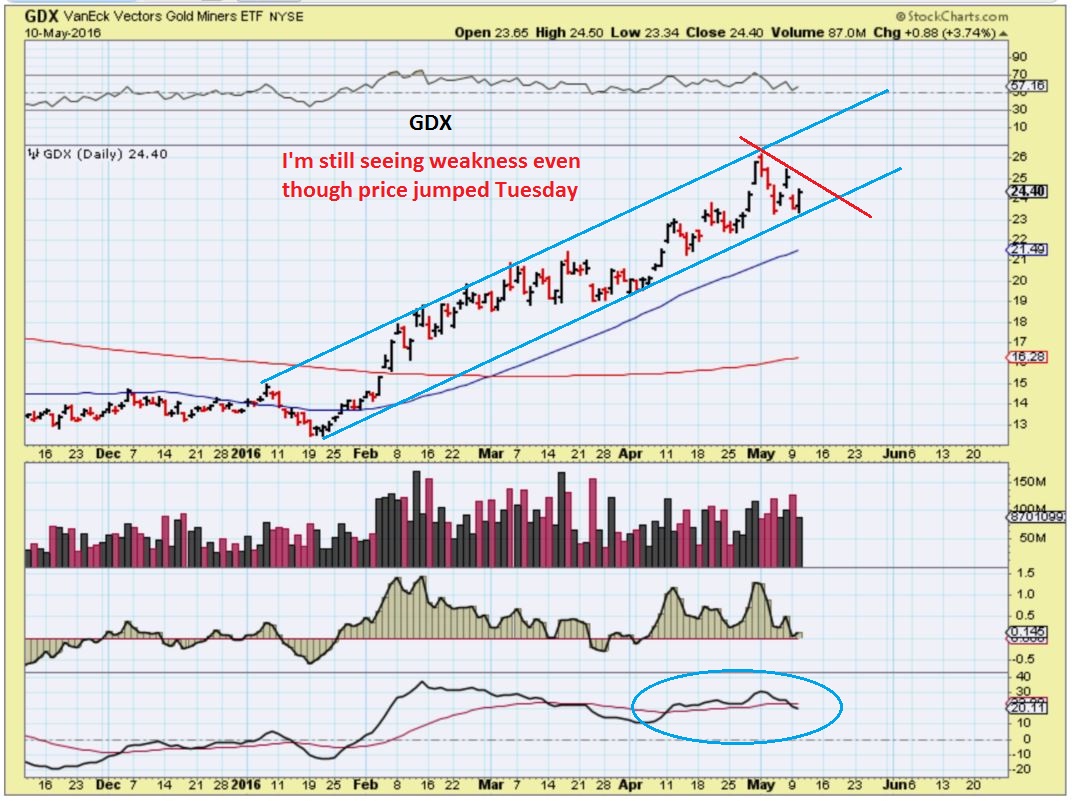
GDX – I still see weakness here, although the Miners jumped higher yesterday.
.
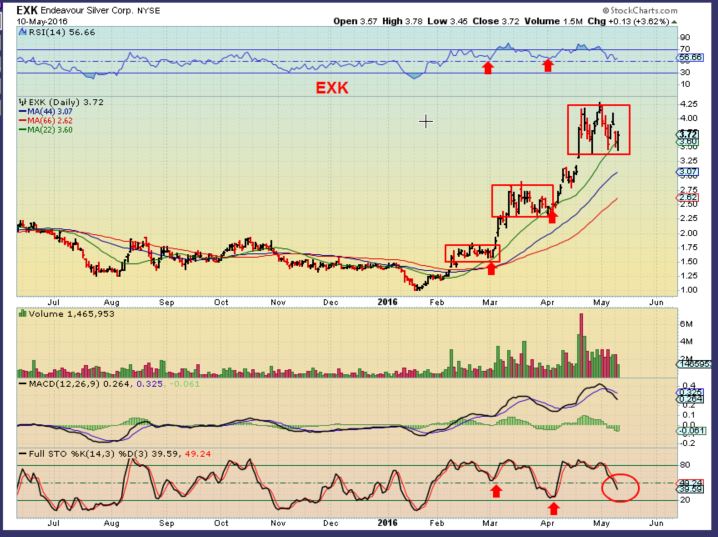
I mentioned in the comments section yesterday that what really looks good is SILVER and Silver stocks like AG, EXK, etc. They keep running, consolidating , and running. As a trader, I love those set ups, but with the dollar moving higher, and we are expecting a drop in Precious Metals? I cannot recommend the trades as low risk, but I may take a couple as a trader until I get bitten. So far, those trades are still working out. It is a strong move out of the lows.
.
EXK – Many of the Miners have run higher, consolidated, run higher, consolidated, etc. So it is tough when you dont see them falling back to stay away, but the consolidation in the later stage bases are a bit looser and the RSI is threatening to break 50%. I am still expecting more of a pull back, but even with the dollar run the past few days, these are not ugly. I look at this and remember what CLF did and I can only hope that we see that here in this sector. 🙂 Right now, they seem to be getting bought up around the 20sma.
LETS DISCUSS TRADE SET UPS
.
With the recent commodity sell down, I posted the Theme picture. I got bucked out of my CLF position. At this point, we really do see what could be called low risk entries. Many have landed on their longer term uptrend, and the 200sma, so do we get back on the Bull when it bucks us off? I hate to rush right back into a stock that has stopped me out or gave me a reason to exit, but sometimes there is valid reason to reassess. Lets discuss at a couple of ideas.
.
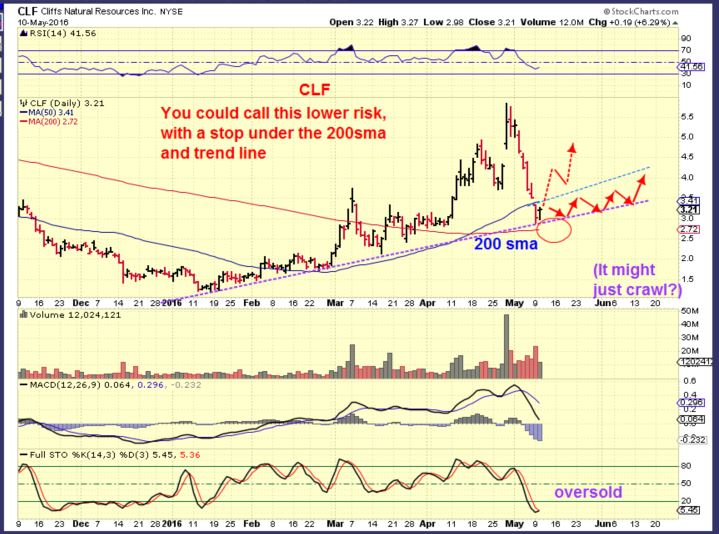
CLF – Like I said, I hate jumping back into a stock that I just sold, but my reasons for selling were rule oriented. Look at that drop, that was CLF falling off of a CLIFF. The 50sma was being threatened, and I bought higher. I had to stop out. Now the dust settled a bit and we can take a look.
.
A reason for entering could be that when the selling stopped, it has stopped at support that can now be used as a low risk stop. CLF is above the 200sma and possibly the new longer term trend line is shown in purple. It may only go sideways for a bit below the 50sma and above the 200sma, or it could move higher if Buyers step back in.
.
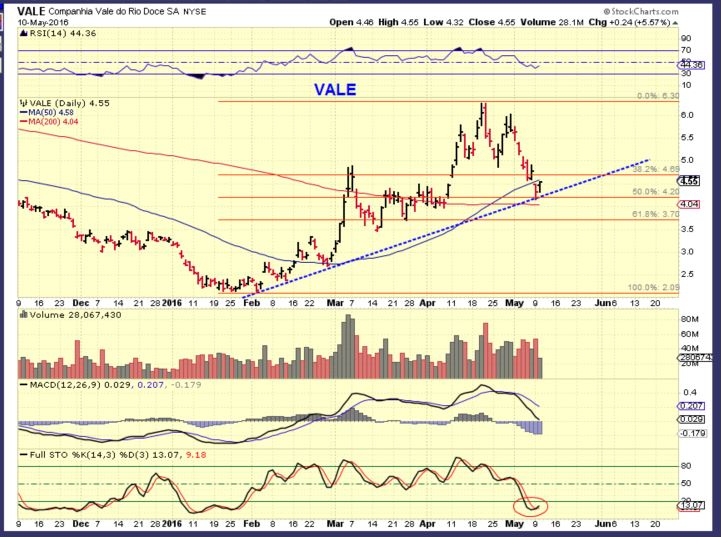
VALE – Same story here. A 50% pull back to the 200sma and the up trend line. Oversold. So you do see the bullish look and low risk entry, right? As long as we recognize tht volatility could come back and we need to honor stops.
There are other stocks that sold off and are starting to look similarly set up. I am NOT saying that it’s a guarantee that the selling is over. It got a little volatile in the commodities and the selling has exhausted for now, but support could eventually give way too, couldn’t it? What I am saying is that you have a lower risk entry here that you can quickly cut your losses from if it goes against you. If selling is complete and this support holds, this may be the next lowest low for a while.
.
FLIP SIDE:
.
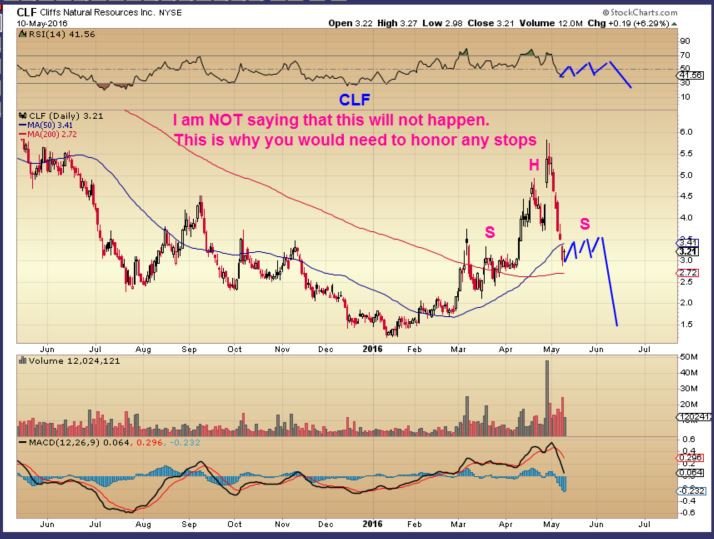
So I can also picture this bear flag forming over time, but dont be ‘Afraid to trade’. I just wanted to point out the possibilities. There is always risk, but low risk entries protect you if you honor your stops.
.
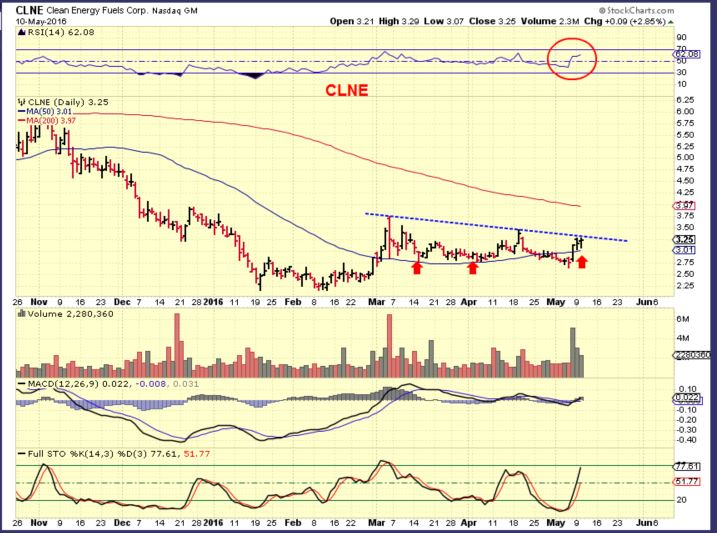
I did buy CLNE in anticipation of a possible break higher. It is currently at resistance.
.
CLNE – released earnings and I bought it as it re-gained the 50sma. It is pushing on the overhead resistance with volume. I added yesterday to my position at this resistance area too. Some may want to buy a break higher or buy it here, if this trade interests them. My stop is slightly below the 50sma and even a POP to the 200sma would be roughly $3 to $4.00 – although CLNE is now $3.25
.
I also Bought IPI. They released their earnings and the entire sector seems to be perking up. Here is what I am looking at.
.
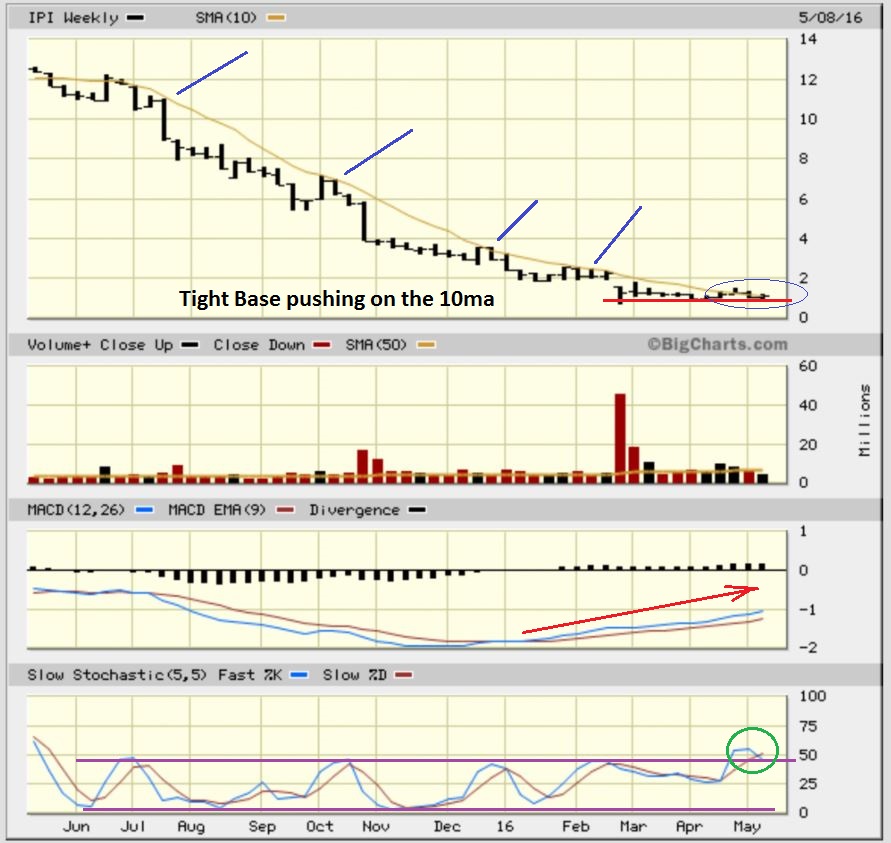
IPI WKLY – I like watching tight bases that show signs of breaking higher, not lower 🙂 If you have been here for a while, you know that these can be explosive. Not always, but we saw it with LGCY.
.
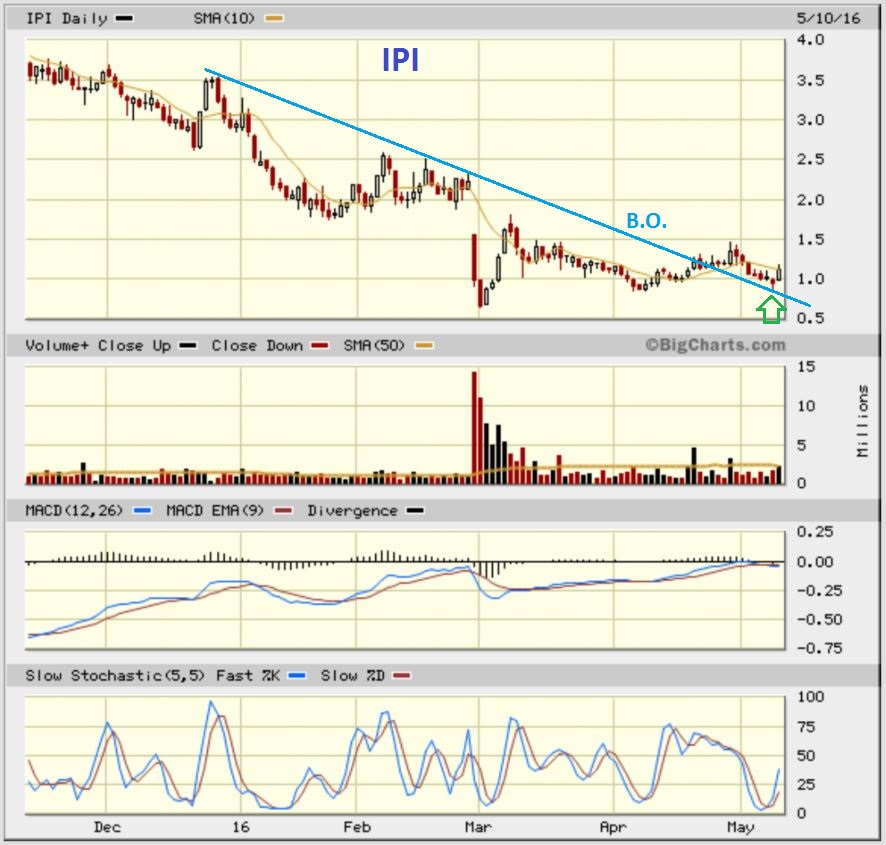
IPI DAILY – Break out and back test possible. This ran from $0.90 cents to $1.50 in April. That is 65%. This looks like it could easily run to $1.50 or $2 again. Again, no guarantees, but I’ll take that trade with a stop below $1.00 and earnings already released.
.
SO that’s todays wrap up. Monday and Tuesdays trading behind us and the picture gets a little clearer each day. Commodity selling stopped for now, we’ll see if this support area holds. Energy stocks are consolidating and seem fine. I’ll be watching quite a few areas, but I’m trying to be patient and wait for some good set ups to present themselves. Maybe Miners will finally start selling down instead of moving sideways? Time will tell. Enjoy your Wednesday trading.
.
~ALEX


I didnt even see what GOLD & SILVER did while I was finishing this report this a.m.. Look away – dont stare at the pretty bright light. 🙂
Good morning Alex! Good work, as always! Quick point regarding miners: Looking at the 1 hr chart, price was building h&s patterns all over the miner charts, BUT…. that can always be negated. If we break above that trendline established last few hourly bars of April/ early May, these can still run strong. I’ll be all over AUY and EXK if we get this done today. It is very close to happenning, so it could very well happen in the first few hours. Miners do keep finding buyers at the 20 sma! I’ll keep readers updated if I see it happen! Have a great day big Rob!!
Hey Peter,
Thx, I have a core and have traded several Miners on my own , an I must say, they just keep going. I have done this in the past and its like that old game of musical chairs, when the music stops, it’s a mad dash for the chairs when the sellers head for the exits, and someone ends up without a comfortable seat. So far the Silver stocks have been excellent since a bit before Silver broke.
Charts of GPL, AG, ETC. are amazing really
I know what you mean, and thats why this wouldn’t be a longer term buy and hold strategy at these levels for miners. But they can be traded using the lower time frames, so that when the music stops, you can react quicker. But a good pop from here can take a stock like AUY a good $1 higher.
And it would also fit with my expectation to see a top for miners near options exp, the week of the 20th, or thereabouts. Also 3x etf’s are splitting around that date, which is always tons of fun!
BTW, Yamana (AUY) looks ready to run. Stronger looking than EXK, IMO. Closed yesterday right at that trendline.
I’m looking for a good buy and hold for my Sister. She only has about $150 in a trading account. The fees moving in/out will destroy it. Any recommendations?
BAA
Took a small nibble in AUY on a break of downtrendline this morning. A reversal back below the trendline today would be my stop.
SA chart also looks very good here. Hit bottom BB, Slow Stochs turning up after the grind lower/sideways….
fyi… SZYM is no more… now TVIA
ADDED to IPI at the open. Strong volume right away
Good call
I hope others jumped in yesterday, it has a great %-Gain potential
I wanted too! Just didn’t pull the trigger . Rest of the sector is down today?
mini-pullback in the offing (to 13ema on 5mins?)
You snooze you lose… i was gonna buy the minor bull flag in the hourly bars in IPI in pre-mkt up .01 cent! And I completely forgot…… :-/ up >20% …
Bull flag in MOS just triggered, POT still hasn’t, but has its bull flag ready. Took POT position, let’s see if it can follow, even if gains are much smaller than IPI.
No earnings reports on these until late July, early Aug.
Commodities looking green today
Not anymore. Poo.
actually It still does….try a 5 day 30 minute chart . If the gap doesnt close today, it could remain valid.
Another one that recovered the 50 sma.
Sweet!!
For those in ERF: https://ca.finance.yahoo.com/news/enerplus-announces-c-200-million-201000334.html
CALGARY, ALBERTA–(Marketwired – May 10, 2016) –
NOT FOR DISTRIBUTION TO U.S. NEWS WIRE SERVICES OR DISSEMINATION IN THE UNITED STATES.
Enerplus Corporation (“Enerplus” or the “Company”) (ERF.TO)(ERF.TO) has entered into an agreement with a syndicate of underwriters led by BMO Capital Markets, RBC Capital Markets and TD Securities Inc., under which the underwriters have agreed to buy on a bought deal basis 29,000,000 common shares of the Company (the “Common Shares”) at a price of C$6.90 per Common Share for gross proceeds of C$200,100,000 (the “Offering”). The Company has granted the Underwriters an option, exercisable at the offering price for a period of 30 days following the closing of the Offering, to purchase up to an additional 15% of the Offering to cover over-allotments, if any and for market stabilization purposes. The Offering is expected to close on May 31, 2016 and is subject to Enerplus receiving all necessary regulatory and stock exchange approvals, and other customary conditions to closing.
The net proceeds from the Offering will be used to reduce indebtedness under the Company’s bank credit facility, to fund its capital expenditures and for general corporate purposes.
The Common Shares will be offered by way of a short form prospectus in all of the provinces and territories of Canada and may also be offered by way of private placement in the United States.
The securities offered have not been registered under the U.S. Securities Act of 1933, as amended, and may not be offered or sold in the United States absent registration or an applicable exemption from the registration requirements. This news release shall not constitute an offer to sell or the solicitation of an offer to buy nor shall there be any sale of the securities in any jurisdiction in which such offer, solicitation or sale would be unlawful.
Thanks for posting that….I sold my shares back awhile for a nice profit.
Alex, thoughts on SRPT chart?
It is kind of 50/50 at this point. It really doesn’t say anything to me. It could be a bull flag right now for a push higher, or it just ran up to close that gap and has completed that. The volume on the way up was strong, but that could also have been a lot of people short the bad news, and they had to cover.
oops CJES
i’m glad Cason got out yesterday, otherwise he’d be looking for a bridge to jump off
I did see that the beat the earnings estimate, yet down on the news. A loss is a loss, even if its less of one
WOW, CJES down 50% what is going on over there?
I would have said goodbye in the chat first. But then climbed up to the top of Moe’s building to be sure I missed the soft grass.
I feel terrible for the guy that was dumb enough to buy my shares from me…
the dumb share buyer was just your market-maker/stockbroker i would guess?
guaranteeing liquidity in the markets no matter what.
they make their tidy profits with the bid/ask spreads,… so don’t feel bad
BOOOOM on my energy stocks
Don’t go so many OOOOOs just yet! Fingers crossed!
BCEI dropped and filled the gap from 6 days ago on a daily chart, then BOOOOM volume flipped it around
.
refresh for 15 minute chart
.
Nice BOOM. I wonder if big runners like LGCY will be smaller winners this time, and smaller winners last cycle will be the big winners?
Alex, do we have a short term cycle low on FCX? Would this qualify as such to my newbie eyes? : )
Looks like it’s getting ready to run again. X is trying to hammer out a bottom, it looks interesting here for a short term trade.
FCX looks good.
Oversold , held the 50sma and reversed off of it, and really nice volume higher today. I like it here
Another solid day like today and I’ll already be back in the green (bought too early on the sell off but avoided buying the absolute top for once!
I definitely think X could go for a spin here!
HL and ECA broke the 50sma and flipped back over it. Shake out. Many energy stocks perking up. I believe the inventory report came out and inventories were down.
The 1/2 cycle low in Oil might be in place
picked up fcx @ 11.13 – sorry to mention it but it happens so rare that I’m in the money with the first tick that I just have to do a little jig
It looks good R.B.
It broke from its down trend line and held the 50sma. Nice grab ! 🙂
I know the feeling:)
Don’t you love that? I like to buy stocks ‘on sale’ which usually means I’m early instead of buying on strength. So, there is nothing worse than buying and being in the hole within minutes. UGH!
ECA is a good lesson in bad reactions to a small earnings set-back. They had a minor miss last week and got spanked for it, but today came back like something out of 50 shades.
Stopped out of AUY on reversal back below trendline on price and rsi in 1 hr chart.
I have stopped using stops while I’m sitting in front of the computer. It takes a lot more discipline to actually sell when something goes against you, but when you keep actual tight stops the market makers can see them and come down and pick you off. Instead I am setting an alert on my chart program, and I set the alert a lot tighter than I would set the stop so I have a heads up if something is going the wrong way and I can watch the ticks and make a decision.
Very smart as long as you can be around to monitor it.
I have really dorked that up before…
I know exactly what you mean, and to be honest, I really don’t use stops because of those same reasons. I use more mental stops and a *point* in a chart where i’d get out. But so happens that today I had a few things happenning and wasn’t gonna be able to babysit that trade, so went with the automatic stop. Did buy it back when I got the alert that I was stopped out, and so far it is bouncing back. So far only a minor loss between the stop price and buy back. And no stop right now either. Will wait to see how we close.
Can I ask, which chart program you are using?
I set the alerts on Worden TC 2000. You can set a line on the screen – and I set a green one for where I bought, a yellow one which is nearby and has the alert, and a red one which is my line in the sand – get out now line.
The alert message comes to you by a sound of your choice and an email.
Peter, I agree – I will be travelling for June so anything that is not sold in May will have a hard stop in place.
Thanks RB. Quick look. Looks good
Here’s were I kill myself – mental stop and watching it – probably around a whole number – b/c I know it could break it by a little. Mental stop at 30, see it hit 29.5 and quickly recover over back to 30.5 so I’m safe. Then it dances around the line – literally oscillating around the mental stop area so I don’t put it in hard b/c it would go. Then I stop watching or we have an overnight gap and Boom! it’s gone, big break to the downside and I’m in trouble. Done that more than once. Developing new rules to guard against that. Maybe first time and recovery is ok and then hard stop goes in, if I get stopped I just deal with the loss and move on. Or maybe 1 cent below that recent reversal. idk, ideas?
great reports CF – luv the trade setup section…great job… thanks very much for those explanations… muchoHelpful ;o)
— mannnn u are NAILING um … IPI – great great call…. vrooom vroooooom … :O)
Thx Stranger.
DNR breaking higher today with good volume. I think that was one of your babies.
I’m no stranger silly man …. I’m here every day reading ….. learning ….. watching u…. 😉
… yes DNR has been berrry berrry good to mommy….
Oh, I stopped out of DNR at 2.2 a couple months ago. D’oh!!!!!!
Old favorite HK back above the 50 as well…
VALE too
I added some more VALE on that break above the 50 again. If it breaks back below i can just take those extra shares off. Having to play a lot of defense again to recover from last 2 weeks! More defense than offense.
i know where youre at Peter.
i’m very light in stocks at the moment.. also in need of recovering composure from past 2 weeks.
dont want to trade emotionally
Don’t really like to play like this SOG. There is a big difference in playing to win, and playing not to lose. But man, last year I put a real dent in my account in just a couple of months. I finally was able to get back, and above. Then last 2 weeks we take the @$$ kicking we did in commodity stocks, and the last thing I want is to have my account back at square 1, which is VERY close to happening! Trading/speculating/investing, shouldn’t be like that. You shouldn’t have to be afraid of losing small, if the potential reward is large. But it is what it is… right now, I just can’t be overly aggressive.
I guess I got lucky. As much as I was complaining (which I love to do by the way), I was really only giving back gains. Sucks, but I didn’t go below where I started. I need a few more days like this, right? 1 day in a row isn’t quite enough. :O
She’s sitting right on that 50-day. But check out the Full Stoch on a daily. That’s a sweet curl!
F.W.I.W. – Looking at UCO , UWTI and the move in Crude Oil- I think the 1/2 cycle low is done and we are going to break to new recent highs.
I see set ups in many energy stocks ready to go too. I really like the way BCEI, BTE, DNR, ECA, CWEI, etc etc are acting correctly and set up. The volumes on the above for 1/2 a day trading seem strong.
Then you back up and look at BTE, BCEI, CWEI , etc on a 1 yr weekly. Sweet.
I watched CWEI go from above $6 to above $20 in a month. Now that wkly looks like a giant inverse H&S.
BTE also looks like ginat inverse H&S on a 1 yr wkly . DNR could be an oddly shaped one too.
LGCY MIGHT be in a bull flag daily – not sure if it will break out & run this time around or not, but it could
love the flag on LGCY. Got in yesterday in the lull of the day. Enjoying $$
Alex – I have pretty heavy positions in OAS, WPX – think that we are ok to hold these here for a few more days? Both regained the 20 SMA and 13 EMA this week. Earnings are both released (OAS bolted higher, WPX was a disappointment but at least it is out). Probably need to at least sell half this time – don’t want to be too early but don’t want to give back like I did with CLF. I just pulled up an OAS chart – it looks pretty sweet to me on the daily. Thoughts?
Also have BCEI (smaller pos’n though) which tried to stop me out until EIA rpt came to the rescue (don’t hear that phrase very often do you?)!
I’m seeing some individual gold miners pause or drop, while others are still raging.
These are red today: EXK, GUY.TO, KGC, SVM, TGB, BAA, GSS, LSG, TGD, FNV, SEA.
Alex are these cracks in the armor we are seeing, leading to a possible correction or are they anomalies more related to earnings.
I’m not seeing the price of the yellow metal itself making any progress lately either http://www.kitco.com/charts/livegold.html
EXK is the only one of the few silver miners that is not catching a bid. Can’t find a reason other that the dilution re: sales of common stock the other day. Any thought ?
I know the day is not over yet, but wouldn’t this be worrisome action for the markets if it loses its 20dma this early in the cycle?
Great analysis and great call on IPI also Alex, , thing is ripping out,
BCEKF, what a chart!
Any idea what’s up with Copper??? I bought cs.to and it looks sick.
I should say that I bought it higher.
Could have horizontal support right about here. I was saying this last week about some of our positions – yeah that one fund really hosed us with CLF but the FCX, HBM – I mean copper got slaughtered. I’d look to $COPPER the same way to look at $GOLD for GDX/J clues. It could go lower here, but not much, heavy support just below here.
Cason, bet you’re glad to be out of cjes today!!
Holy Crap!! You got that right. I knew I didn’t really want to hold through their earnings, but I didn’t think it would be that. Whoah, that was too close!
And where do miners go tomorrow? (please down so I can buy! Come on!) *refresh for 30-min*
So far, GDXJ just cannot lose!
HBM lost her baby! If we pull back to $3.90 tomorrow then this is a BUY!