FOMC AGAIN
Wednesdays release of the Fed Minutes certainly caused a ‘reaction’ in the various sectors of the markets. It falls in place with the timing of certain cycles, so lets review the action and what it may mean moving forward.
.
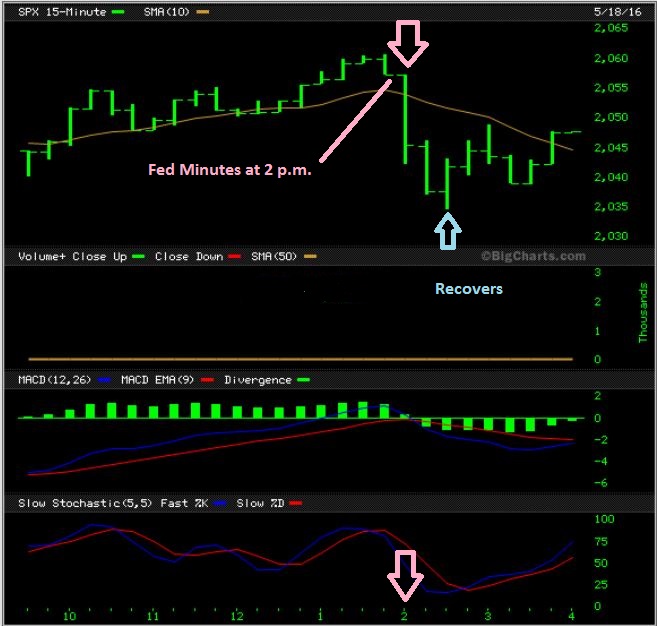
SPX – The General Markets sold off with the Fed minutes. They recovered into the close. This still looks like a H&S and has yet to recover the 50sma.
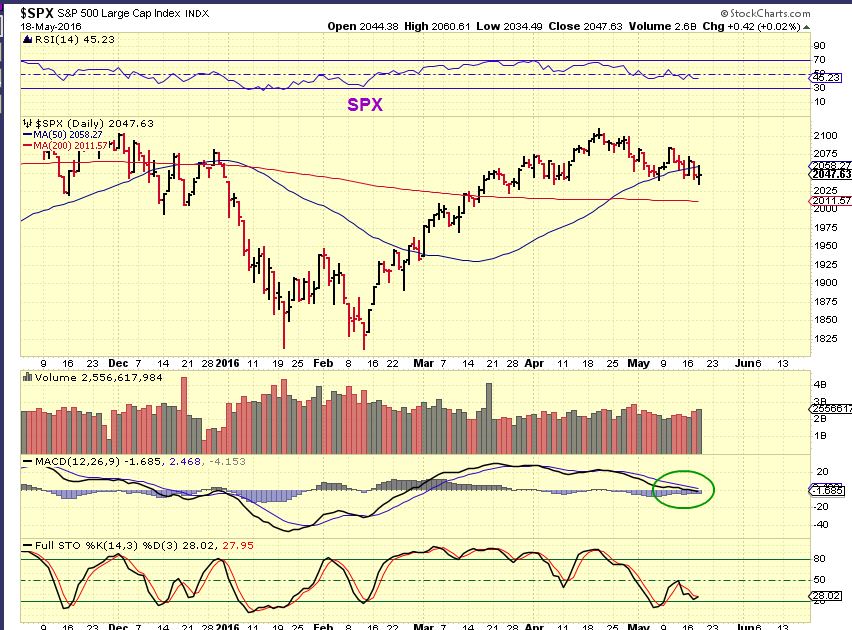
Something that I find very interesting happened on Wednesday, I’ll discuss it later in the report.
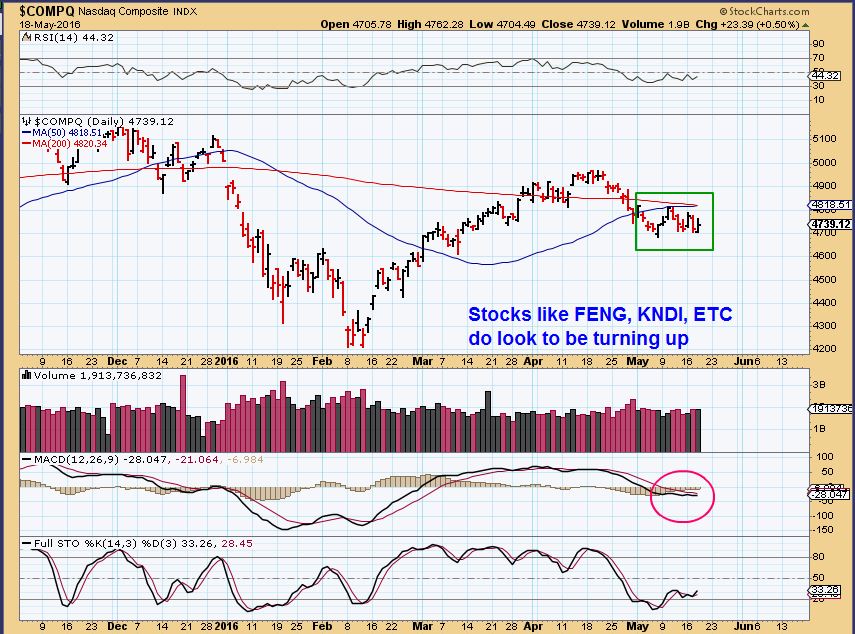
NASDAQ – I pointed out that the NASDAQ is under resistance. It sold off with the Fed release, but also recovered. Will it have the juice it needs to go higher?
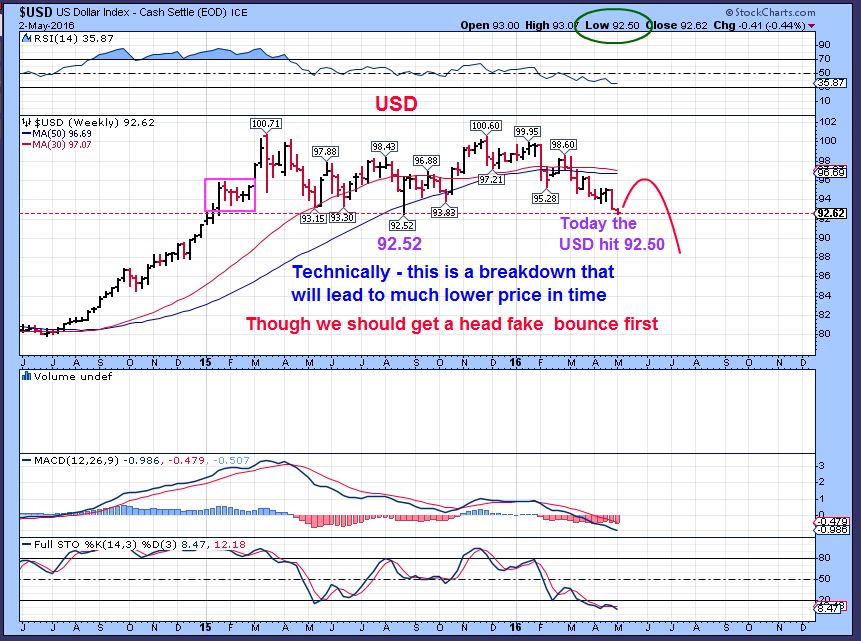
USD – I have suspected that the USD put in a DCL, and possibly even an ICL. This would likely finally cause a pull back in Gold, and we need to be careful with Metals and other Commodities during this time too. The FOMC helped the $USD today to surge above the 50sma.
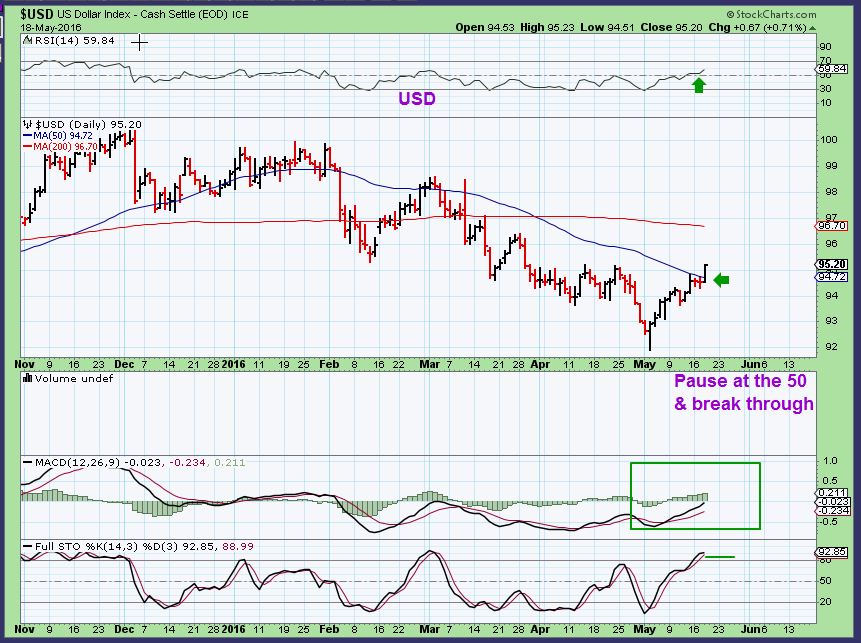
Reminder: MAY 2 CHART – Longer term I think that this will be a $USD bounce and a Pullback in Gold. How Far and for how long will that last? Maybe 98. That will be determined as time goes on, but it will take a while. No Long term change at this point.
.
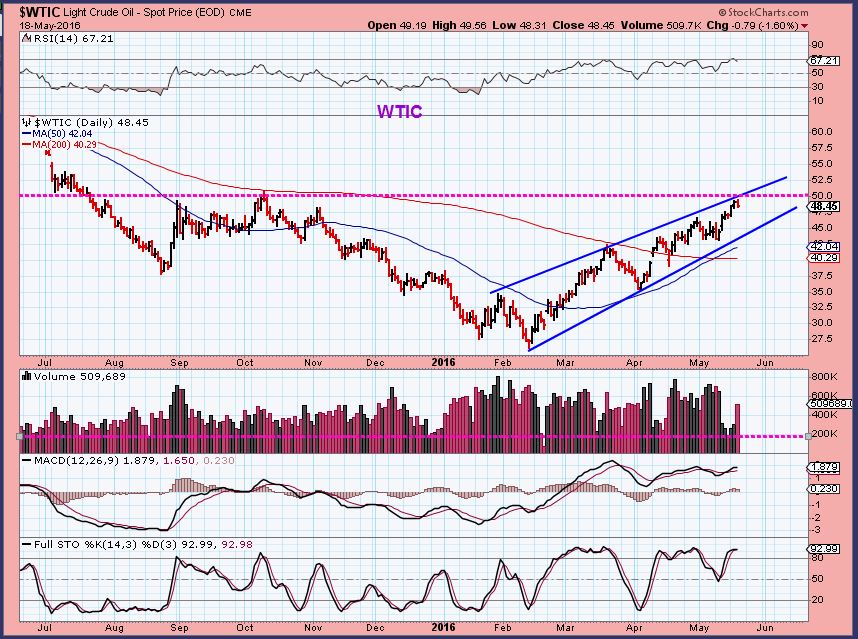
WTIC – Caution at this point. Oil hasn’t hit my $50 target, but it may still get toppy in this area. If so, I still expect it to continue higher later after a pull back.
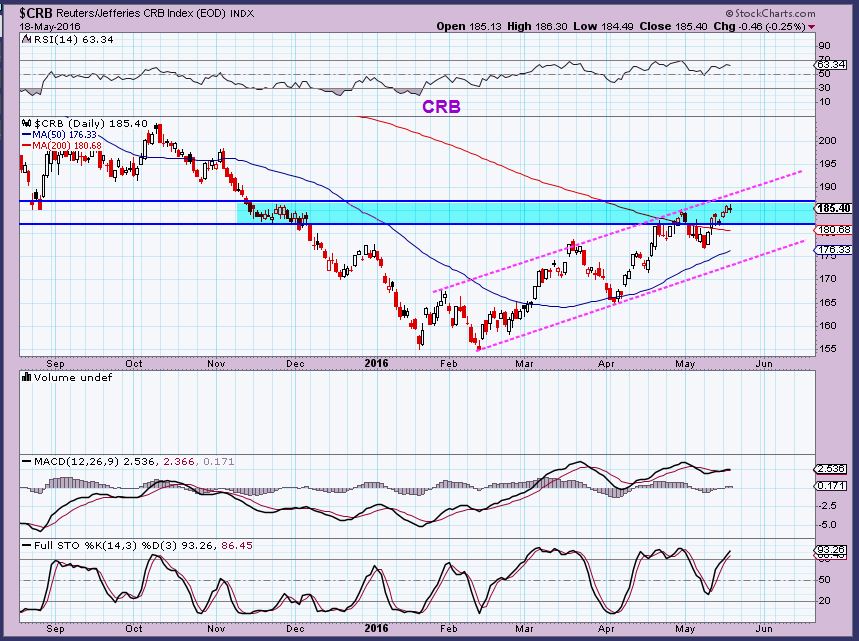
CRB – The CRB didnt flinch much with the FOMC release Wednesday, but is in a resistance area. It does also look like it is possibly slowing down. This is the 3rd daily cycle, so I have mentioned that this late in a cycle, you dont want to be too heavily invested, using leverage, etc. I expected 190, but it may or may not get there. Time will tell. ( It can top Left Translated and drop or go sideways for weeks. The CRB is made up of many things components . Energy, Metals, Grains, Meats, etc)
.
GOLD & MINERS
.
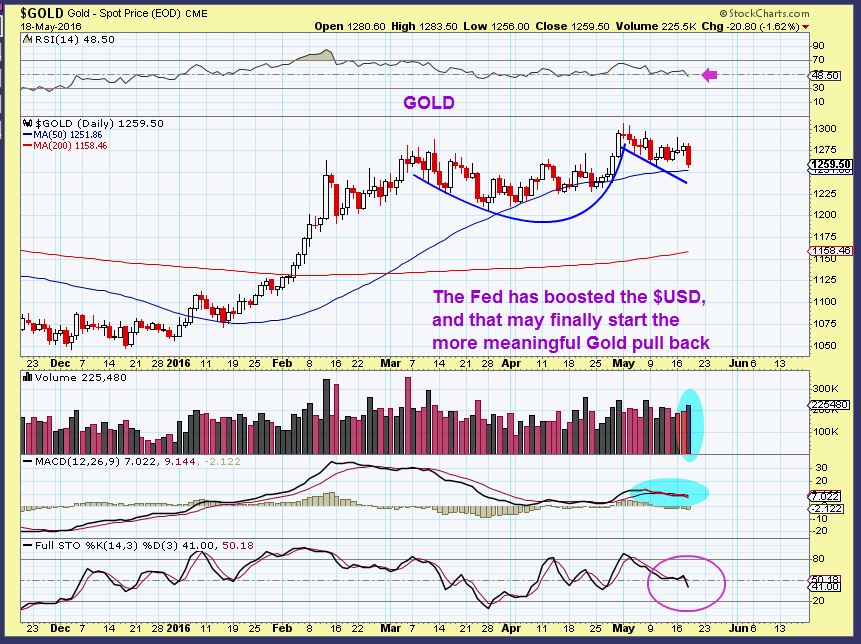
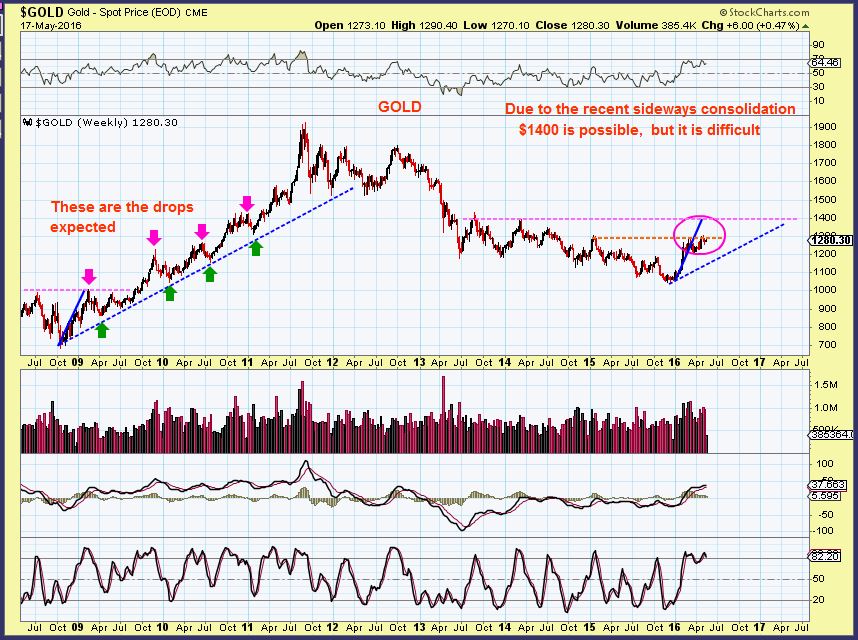
Believe it or not, the CUP & HANDLE is still valid in Gold – B-U-T – that reaction Wednesday was a huge warning sign, so lets not ignore it. Gold dropped and held at the 50sma, but that MACD and RSI and other indicators are showing deterioration. With the POP in the USD, This may start the drop in Precious Metals.
.
Yesterdays long term chart of the GOLD was 2 fold in purpose.
1. It showed how in the 2008 recovery, the uptrend should stay in tact, but some of the drops are easily visible.
2. It also showed how that Cup & Handle could POP Gold to $1400 very quickly.
Look at that chart again and let me now make this very important point…
This is a weekly chart. Those pull backs took weeks. A pullback in Gold would take weeks.
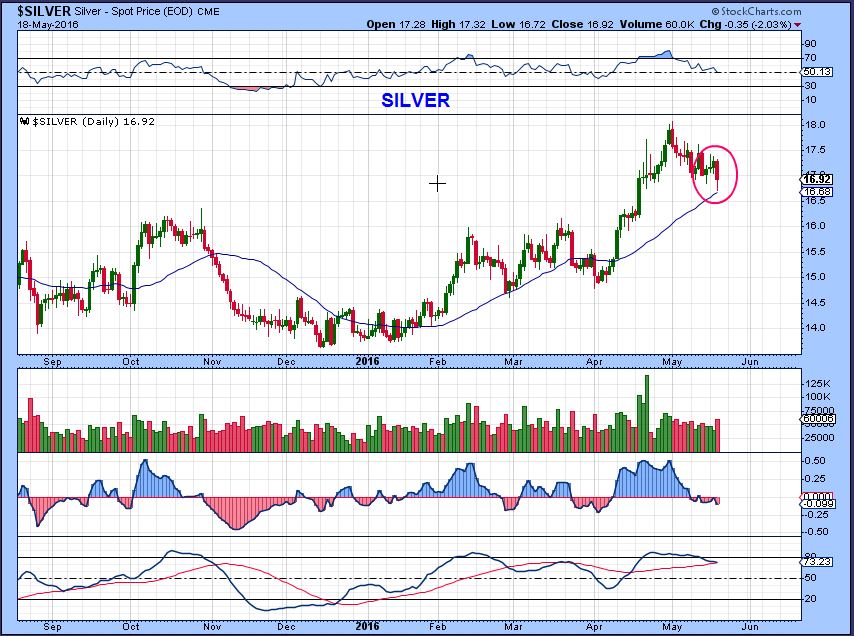
Silver – This acted fine, but will it hold up going forward?
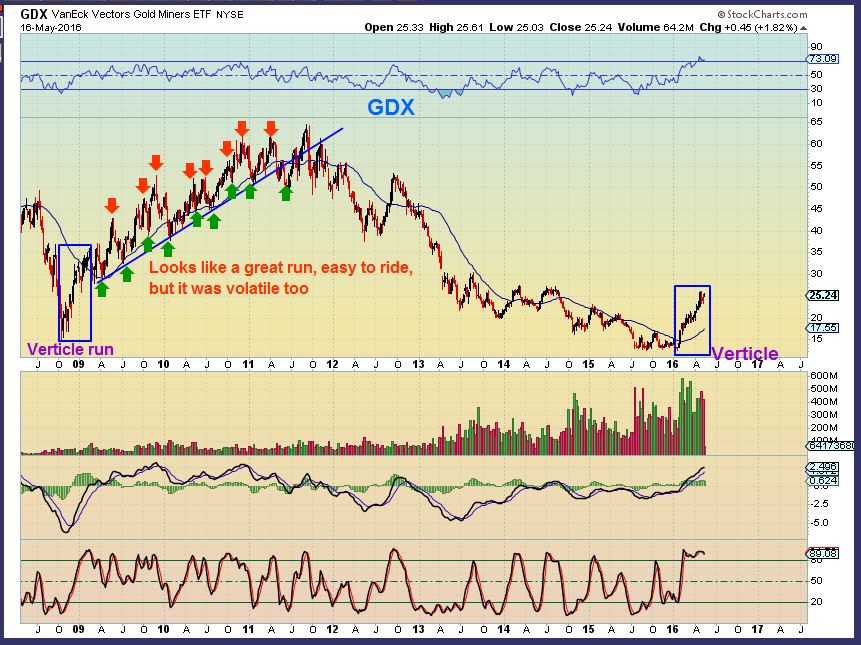
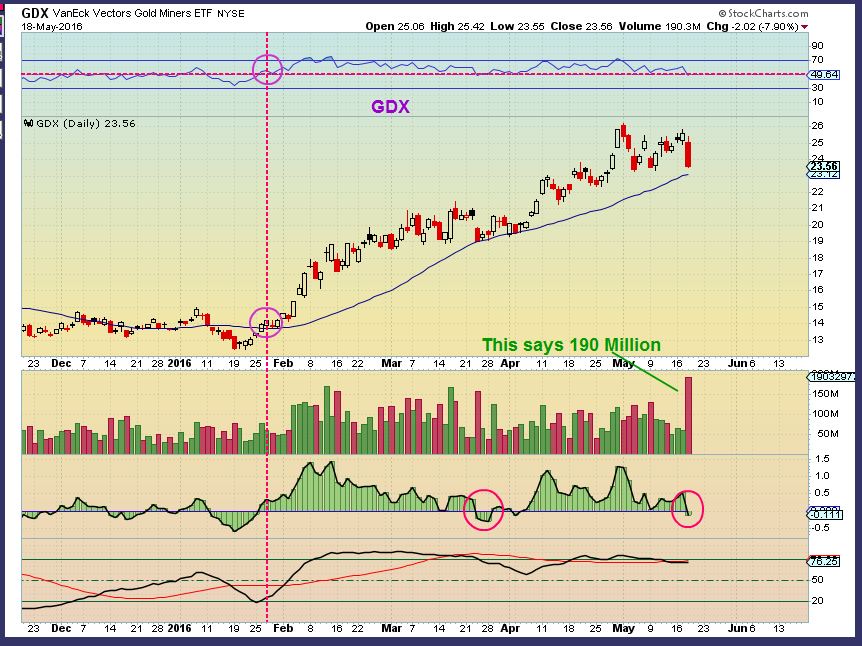
GDX – See that uptrend in 2009? The Miners dips are a bit steeper and also do not take many days. We will need patience when the real pullback comes.
GDX after the FED RELEASE Wednesday – Not broken, but that was an 8% drop on HUGE volume. DUST and JNUG had HUGE volume that usually signals a top in Miners. So while all critical areas held up in Gold, Silver, and Miners, DUST VOLUME may indicate that this is the start of the pull back.
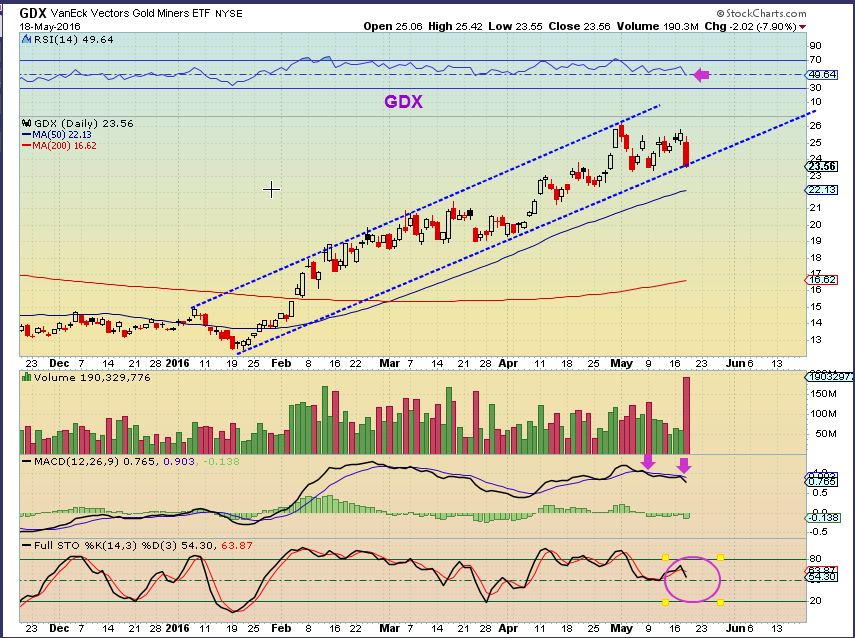
GDX is not broken. It is still above the support area, but these indicators also show weakness in the GDX. The RSI has not moved below 50% since January, but it may be about to.
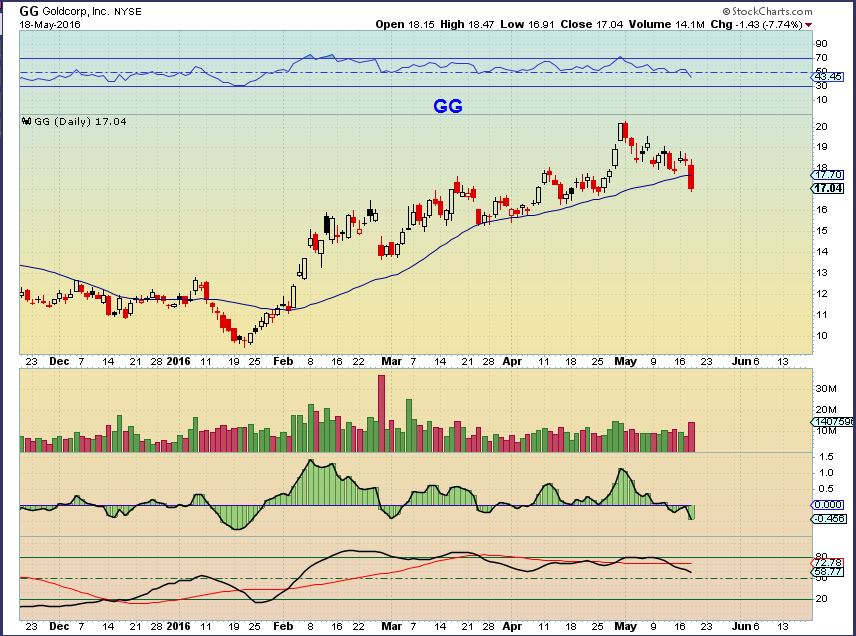
GG – A larger component of GDX. Breaking down? Warning sign? Leading the way?
Note : Experienced traders can use Options or Dust, JDST, GDJS, or GDXS to hedge core positions. TRADE REASONABLY – please do not get heavy in leveraged positions.
.
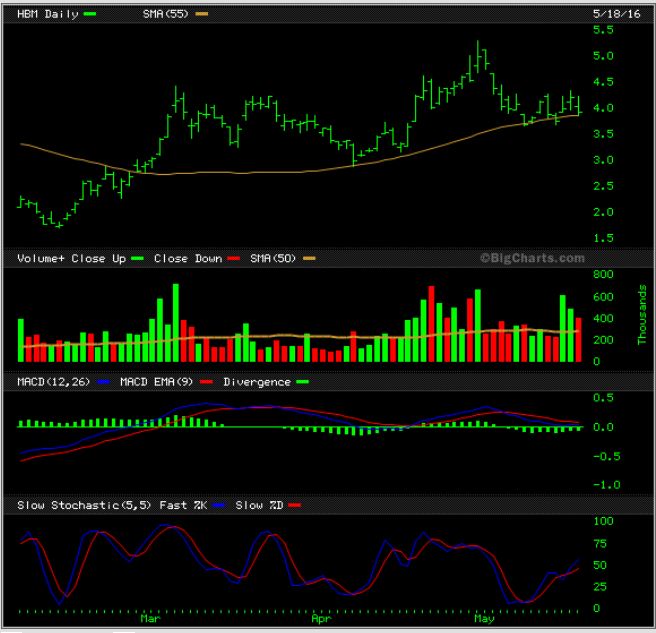
HBM ( and some other stocks) still look ok at a glance, but I do wonder how they will weather the volatility. I repeat, Keep positions small. Honor your stops, whether mental or physical. Also you do not have to swing for the fences every time we trade. I trade heavily at ICL’s, and as time goes on, I lighten up on size & number of positions.
.
-Thinking Out Loud-
.
With all that happened in the Wednesday trading and with the recent volatility, my thoughts on ‘Keeping your positions smaller’, ‘Don’t use Leverage’, and ‘Use and honor stops’ and so on takes on more merit. When the markets start to get volatile like this, the music can stop and the chairs of support are gone.
Consider this. Are you trying to be a day trader or are you just trying to invest so that you can make money? Less active traders might want to just go to CASH, or at least Mostly Cash, and just be patient waiting for a low risk set up in the Miners. That low may be weeks away, but it will be rewarding to have funds to invest with. Look at your account balance. What would have happened if you had that amount and put it on CDE, AG, GG, MUX, GPL, PAAS, and so on in Mid January? They are up 200%, 300%, etc . Your next chance to ride a nice run in Miners should be coming up in the weeks to come this summer. Having funds to invest in that opportunity is key.
Riding the recent volatility can really shake your confidence if you’re not used to trading. Constantly being stopped out and jumping back in can widdle away at funds. This is especially so if you haven’t lightened up or are still tying to “go all in” or use leverage and 3xETFs, etc during a consolidation. Know your own personality as an investor and trade in a way that benefits you the most.
.
~ALEX
.
That said, now I want to show you something that I find quite interesting. I think that it shows how smart money controls things, even on Fed Wednesdays. It also may reveal the next best investment for traders still wanting to trade.
Check – This – Out.
.
This was the SPX Wednesday.
1. Notice the sell off right at 2 p.m.with the FOMC release, and then it started to recover a half hour later.
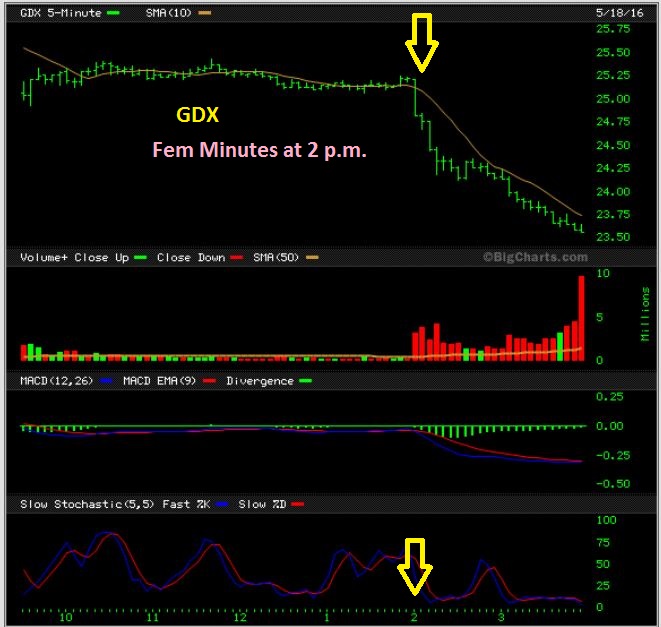
And this is GDX on Wednesday
2 P.M. sell off, no recovery into the end of the day
Now take note of this. Smart money at work? I was told that “BANK STOCKS REACTED STRONGLY TO THE FED MINUTES RELEASE”. Were you told that? I’m telling you that they did not. They reacted way ahead of the it.
.
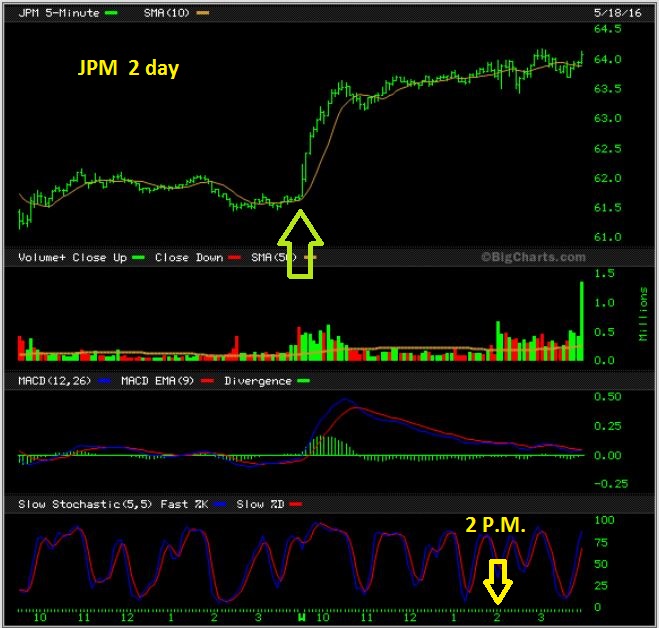
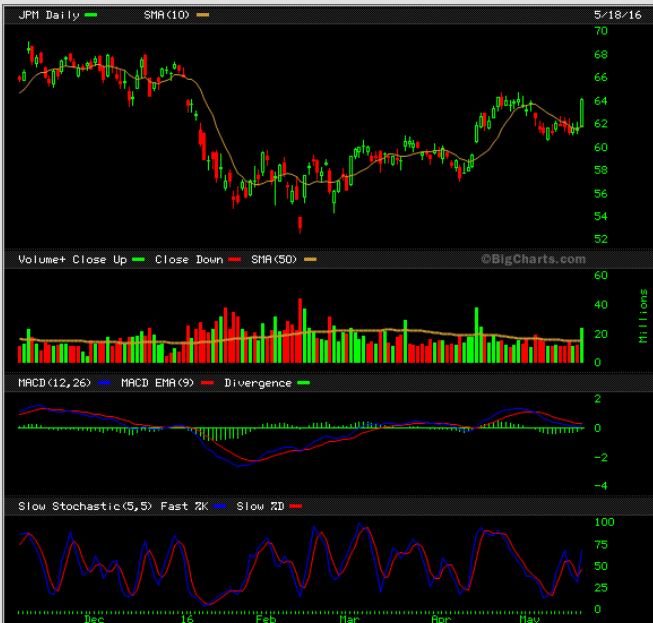
JPM Wednesday intraday – J.P.Morgan was being bought up right from the start of the day and did NOTHING with the 2 p.m. FOMC release.
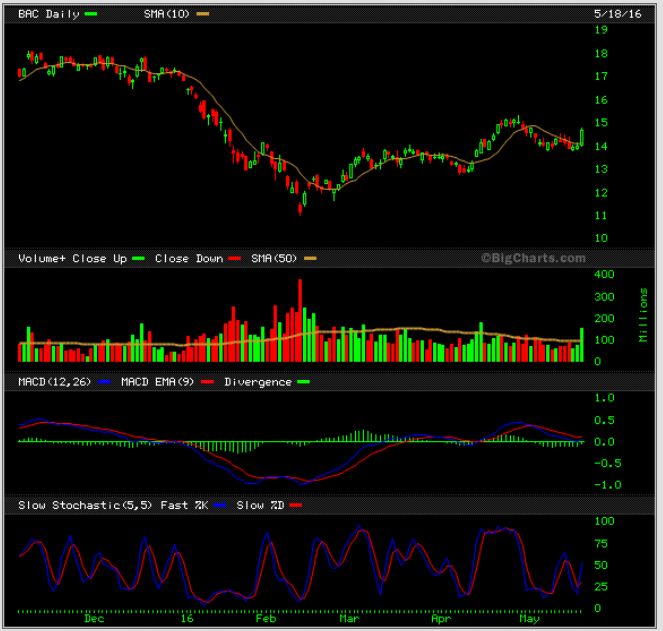
BAC intraday Wednesday – Bank Of America was being bought up from the open and also did nothing special during the FOMC. I found the same with Morgan Stanley and many other banks.
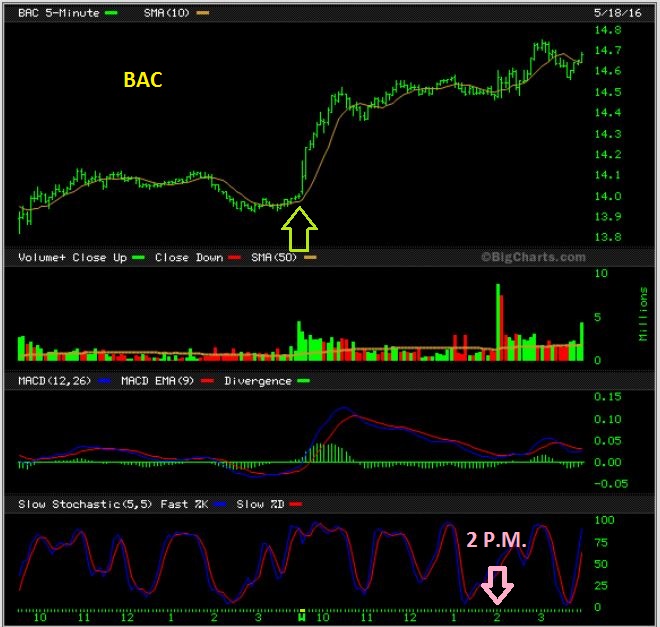
All the Bank stocks that I looked at took off from the open Wednesday, not the Fed Minutes release. HHmmm, seems like someone knew something.
.
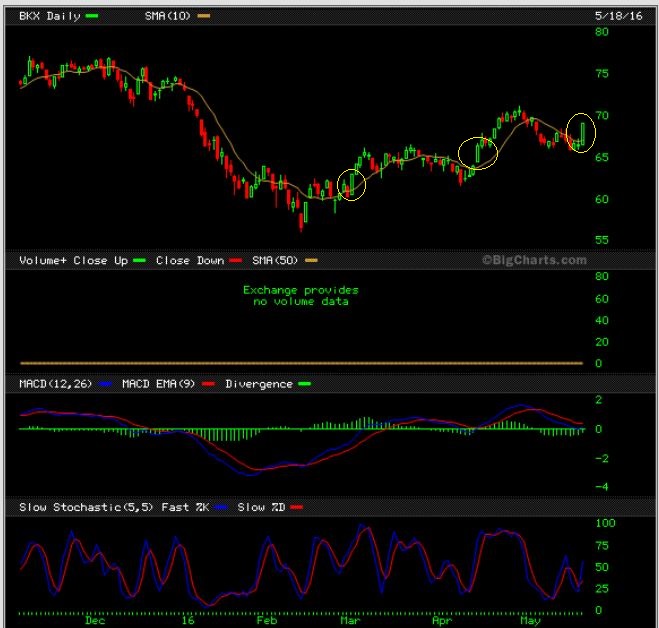
Now look at the daily charts of BKX (Banking index) and Banks. These charts are all identical and they didnt “Take off as a result of the FOMC” like you may be reading. They took off from the open.
.
BKX – Bullish
JPM – Looks exactly the same as BKX
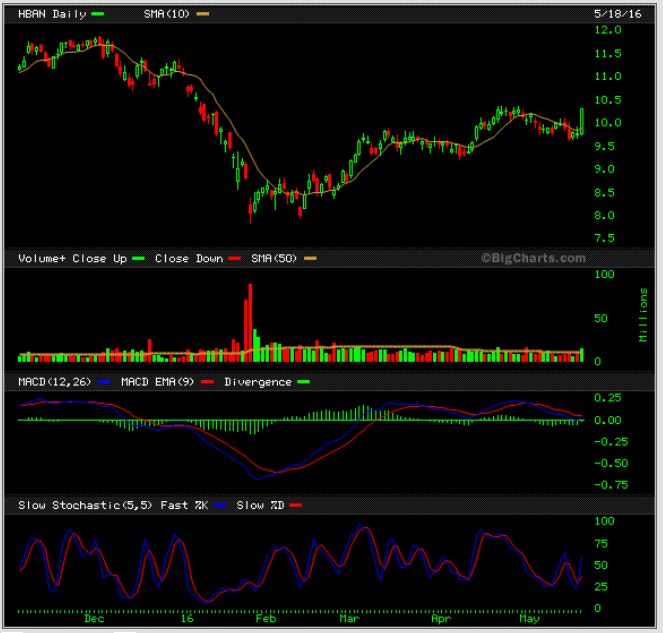
HBAN – Ditto
KEY – Ditto

BAC – Ditto
The above Bank charts all look alike and I have many others too. My point? I mentioned in past reports that this sector looked bullish and it seems that smart money is buying the dips. Wednesday I think they scooped up shares on all of the banks that I checked, and they did this before the fed Minutes release on Wednesday.
So, I think Banks are a buy.


hi, alex, great advice on holding dry powder, lost a great sum of money trading in and out . I have subscribed to many letters over time, and you are the first to tell traders to hold back, especially if like me, you can,t set a computer all the time and be expert day trader. I have a day job[might time too]. also would like to throw you a BIB BIG BIG SHOUT. you are the man, I am home yesterday and noticed hban[local bank in ohio they came in and bought out our local bank, gutted it, and now it is not worth a shit] there stock was up $0.30 in the pre- market in the morning, I thought boy that was unusal, then after the fed notes were released I thought ok stupid, now I know why. you confirmed my exact thought, I love cofimation, love your chart service. . also confirmed my thoughts that this government is so corrupt, the only difference between our government and theirs is we still value life. again great job, if you ever need a spokes person for you service feel free to call me, and I don,t do stuff like this lightly. richie
Hey Richie – Thank you, I appreciate that.
I used to work all day in an office and try to trade in nimble fashion, and it was crazy frustrating, so from experience I learned that I can go heavy at an ICL and the eventual gains will undo any wiggles. At the top of runs when it gets volatile, you have to trade differently. Position size is smaller if a pull back is expected, and I also have less positions, to keep it manageable and losses minimal. Dry Powder for the Miners pullback now is a worth while goal.
As for the banks- I heard a few news reports saying how the Banks really responded positively to the Fed Minutes release. I do NOT see that anywhere. They took off at the open and ran to their day highs well before the minutes came out. Looking at the daily charts, those reporters were fooled. Someone knew something was coming out and jumped in to Banks , and I mean all of the banks. Crazy, huh?
And of course, if you feel the service is helpful and you know traders that could benefit, word of mouth ( or twitter / blogs, etc) is always appreciated. Thx again!
Good morning Alex!!! Good analysis, as always!!! Just looked at some very short term charts (5minute), and it does show that we should get a bit of a breather from the dollar soon. $USD very o/bought in that tframe, and a topping candle at end of day yesterday. Positive candles for commodity stocks like CENX yesterday at end of day, on HUGE volume. Gold is showing a very nice positive divergence in histogram also. When you look at some of what the big money does, it really does make you question if news get leaked to a few ahead of release. There is no way any human being can read through the fed statement and react, and sell millions or billions in fractions of a second. So in the surface it does look lke at 2 pm the sell buttons were pressed with a vengeance, but when you go back and look at the 5 minute charts, weakness started in things like metals shortly after noon time, when they broke below the 200 period, and couldn’t recover. That in itself is not a sell signal, of course, but it does make it easier for these crooks to push the path of least resistance. Thats one of the reasons that should really have a longer term outlook, and focus on daily and weekly closes, unless you can and want to spend everyday in front of 6 monitors looking at what happens every 5 minutes. I haven’t done it myself because I think I would go insane, or have coronary issue within months!!!!
Didn’t even have a chance to read the report yet….HK filed for bankruptcy. Severe ouch for me.
Anyone go through these before? It is down .70 pre market.
I’ll have to read it , I havent seen it. I see the headline as —– A restructuring of their balance sheets to reduce debt — but yes, it is down huge in pre-market.
I own this 🙁 Should I sell before it’s down to zero 🙂
As a trader, I took this as a trade set up in April too , but when the ‘set up’ didn’t follow through, it just continued the consolidation, I got out. I feel bad about those still holding, I hope positions were small.
What to do is a tough question. I usually just take the loss and re-group to leave it behind and get it out of my head. It’s a loss and I take that loss, but that’s just how I do it. Some wait and see if it bounces and try to sell the bounce, but that is a 50/50 chance. Will it bounce in the next couple of days, or just drift lower?
As an example, Some of the smaller companies have filed BKRPT and were eventually moved to the OTCBB .
Sandridge changed from SD to SDOCQ – and you can see that it hasnt done much since then. Just bounced around.
when do you get out with as little damage as possible?
played it safe and sold my HK position to salvage some
Damn Nancy, sorry to hear that. I don’t think it would go to zero, per se, but linger in the cents maybe for who knows how long. Therein lies the risk with those individual energy names. Hate to see this crap happen to people, but thats where just trading off of charts can be dangerous. You live and learn. I don’t know about you, but I’m pretty tired of learning! Hope better days are ahead for you. Keep your chin up. 🙂
Thanks also for your input.
Actually, trading the charts could have worked.
When I bought it April 22, it was moving above the 10 sma and was above the 50sma. That put it in a category of possibly recovering. It then Popped really good on the 27th, but then gave it up the next day. A warning sign that it wasnt acting correctly.
It fell eventually back below the 10sma, and on May 6 it broke below the 509sma. That can be a sign of weakness, and I usually point that out as a possible shake out or something worse.
HK was giving off signs of trouble, but obviously none of us knew what was coming. Now with that news release, I believe insiders probably were selling in May.
For me, when you lose the ma’s, automatically I’m out. Only exception is if price is above the 30 and 50 wk, so it can lose the 20 or 50 day, but as long as it is above those longer term ma’s, i stay in. HK never came close to the major ma’s. And even if it would have, there is always the risk of a news event like this, doesnt matter where the stock is trading. But like you say, you look at some of the shorter term charts and you see signs of the big money getting out and leaving the bagholders only. That crap ticks me off.
Yeah, I agree… going back to weekly charts . I look for the 10 & 30 MA, but you usually have to ait for a huge base or a nice run higher .
I’ll keep this whole thread as a learning tool. Bad day for me.
probably a good idea is to learn to spot weak MAs.
just reviewing a few recent drops here SD, CJES, SUNE, LINE, HK.. (and maybe soon to go, TPLM?)
you can see (on 4H charts) how the price & 10eMA fell below the 65eMA, or never made it above.. and then price was weak at the 10eMA.
I’m using these examples as warnings for myself these days!
keep yer chin up.. next big set of rallies, in whatever sector, and you’ll forget all about Bad Day at Black HK 🙂
Thanks for the laugh. I am heading out to work on my mural project after lunch and will work on something fun and aesthetic to help my grim state of mind. I will study all the above suggestions when I return.
beware, you may end up producing something like Munch’s ‘The Scream’ on the mural
i got done for with LINE last week.. opened down at -50%
my rule of thumb , which saved me severe losses is to never trade more than $1000 on any single stock that is below the 65eMA on a 4H chart,
a lot of these bankrupts telegraph that they are in trouble before the plunge, with their weak moving averages.
i’m just got stopped out of OAS yesterday, and DNR & CWEI at open today.. so its a clearing out of the Augean stables pour moi.
now im all in cash only… maybe go DUST when it starts another move up.
also, i’ll check out the banking sector as Alex suggests
thanks for your input…am reading all news I can find before deciding what to do and when.
Good rule of thumb SOG ( not the actual $1000, because account amounts vary, but a certain % to invest and I like the 65 EMA on a 4 hr chart idea ). I too believe that a lot of future price is telecast in the charts that way.
And for me, entering the 3rd daily cycle is time to lighten up (As you just did) .
LoL.. i know.. $1000 = small potatoes for the pro.
your mileage may vary 🙂
I was thinking that some may only have $2000
They’d need to go smaller increments 🙂
thats true.
trouble with trading too small an amount is that the in/out trading fees take an increasing chunk of your capital
I am so lucky that I have free trades, at least for now. I got out of HK and am licking my wound…worst since I started with Alex.
That’s such a bummer.
I have that issue. Sometimes I go options or leverage or too volatile when I shouldn’t. But if you are getting a small position then 4% doesn’t help you – you’ll pay it all in fees. You could get the trade right and still lose money!
That was quite a burst! The USD has now move one cent since yesterday at 2 pm and that is a parabolic straight up move. I have a note attached to my UUP file that I put on the screen some time ago that says “most turns come after a mid day or late day surge”. Don’t know what’s going to happen and don’t like the position I’ve put myself in holding through all your warnings, but just doing a little hope and prayer that this parabolic dollar move is a final blow off on its trend down.
One thing that resonates is a statement on risk management in Mark Minervini’s book that you have to decide if you are a trader or an investor and you can’t have it both ways. For me to try to sell out this morning is probably going to kick me where it hurts
Tammie you asked late yesterday about SDRL. I was lucky and sold out of it earlier in the week at a break-even. I don’t like these charts that are trading sideways for so long. There are lots of bankruptcy’s going on in the O&G world and SDRL is very heavily indebted. There are also lots of good things about the company too. I have nothing to base my decision on to sell other I would prefer to be in stocks that are clearly moving up in price.
Alex, seems your recommending cutting positions in Energy and Commodities?
wondering if I should dump my position in LGCY (take a loss) and wait for the pullback in gold and then pick a few that can weather the storm. Maybe better to take a loss and make it up then wait endlessly for a rebound ~ my case specific.
thats what i do now Moe… can’t stand the psychological torture of watching something fall, wondering if i should get out
yup, sold my position in LGCY and better to take 1 step back and 2 steps forward then 10 steps back and pull the rest of my hair out
I sold all my AA, FCX, HBM, GUSH,X. all loses. But better now than lower later.
It depends on each ones individual situation, I guess. Some were wanting to buy a pull back in Miners, and we may be seeing signs of that starting. Positions that are small in those 2 areas can be traded if they are above stops.
I entered my positions with stops, as part of my trading plan I will probably let my stops l take me out.
For example, I have smaller positions by now, because if I buy low, I sell on the way up partial positions. I may add on pullbacks if conditions look ok ( And they have , until recently). So I am still in HBM, LGCY, BCEI, IPI. ( EXK/DUST)
LGCY and IPI was a much cheaper average cost, so I will lock in gains on a sell or stop
I still own BCEI & HBM and they havent violated my price targets, and are above or at the 50sma. The MACD has crossed down and the bounce did more of a ‘tag’ than a powerful cross back over, so I may sell them , just not sure when.
It does feel like we are in later stages of this climb
Alex, you bought DUST? Shocked………
It’s not a big position, I bought the EXK set up, and hedged it with a little dust sprinkle, before Minutes release. Actually JDST , not Dust. my bad
how come ENLC is avoiding the red carnage?
And CNP & CQP
DUST giving some latecomers a good smack
Gap fill on the morning open
are you back in DUST again Bill?
Bought a starter, just now
just be super alert my friend… im watching in disbelief .. as this pattern plays out… dammmmmn
not saying it will .. just say… W .. O .. W …
https://www.tradingview.com/x/OBLQfwTr/
thanks for sharing Maria
Move your candlestick pattern one peak to the left? It only made two peaks up before. Then drop
show me…..
i cant play now… but i can watch……………….
https://www.tradingview.com/chart/XAUUSD/I8T4bRIS-XAUUSD/
wow.. even freakier.. right??? :-O
YEP…. this person is still in DUST (500)
Now to see when to go out, not to late and definitely not to early.
Oeps….. give me some support guys.
THANKS A LOT, and…… have a good day.
hope you make a lot of your money back Geurt! 🙂
Thanks SOG…. I hope so too.
Please would you keep also an eye on when you see this is the top of DUST ???? (of course nobody knows for sure)
A big hug and till next time SOG. (That’s not you real name heh?)
i’ll keep an eye on the charts, but top spotting is a big ask !
SOG is not quite my real name 🙂
Very nice from you SOG !!!
Thank you very, very much.
Geurt, the Daily chart for DUST doesn’t show any resistance until $100. The hourly chart has the 200ma at $17.40 ish
Oh my dear, you will win a price if it’s going there BILL ??
Thank-you !!!
Dear Alex,
Now we are witnessing the weakness in the miners. What do you think about TGD, BAA, What is the level you are looking for re-entry.
Hi Sila,
I dont think that it is a 1 or 2 day pull back that is coming. What I am looking for in a pull back – It will take time to play out. There will be drops, buyers will step in, and then sellers again, it will pop & drop down for a while in my opinion.
Alex – thanks for the thinking out loud about the banking stocks……I’ve told myself for the past number of months that if only I were a relative of one of the FED members then I would know what was coming and could invest accordingly – your pointing out what the banks did from the beginning of the day – very good tip to remember in the future! Makes sense that if the banks don’t sell off that someone somewhere senses a “possible” mention of a rise in rates….I’m making a new poster for my wall….”FED DAY = LOOK AT BANK STOCKS” 🙂 🙂
I dont know if the reversals will hold, but certain metals stocks just went green after selling off.
X, AKS, TCK, STLD, GSI , CLF, CENX, AA,
GDX, GDXJ
V-O-L-A-T-I-L-I-T-Y
And thats why we focus on longer term… 🙂 all this short term stuff will make you go crae-crae…
Hello Alex, I stopped out of all positions. Do you use a rough mathematical formula for your stops? thank you Johnny
Johnny, I missed this question, sorry.
I use various methods ( Supports, % ‘s , under the 50sma at times, etc) .
Thanks Alex!
Trying to hold my tongue …. just cant do it….
You can Not trade the OIL JR. sector if the said companys you are trading have such high DEBT !!!!
Numerious bankruptcy’s in the last six months……sigh….. I have been warning for months.
If you day trade for a scalp ok but………..even so
tuff luv …
*ooo ur such a hardAss ;o)
I even counted to 10 before I typed…..lol. 🙂
Hey Ken, Good to see ya
( I had to count to 500 before I could say that. 🙂 You dont come on when one of my trades is up 300%, just when it’s a down day ) – LOL.
Well….That 300% is just par for course for you…..:)….AND Expected now, the bar is SET !!!! 😉
I just felt bad for Nancy is all……
*omg… brown nose (I am soooo rolling my eyes right now)
**no… that won’t get u a discount off your annual fee or unseat Bill as Teacher’s Pet
I did too, and I know that there were others in HK with me when I took it in April, that may not have cut it loose when it dipped below the 50sma.
I’ve had it happen to me in Biotech and a Miner in the past. I can only hope that people have heard me say “baskets, Smaller positions and lighten up” at this stage of the Cycle. It IS a dangerous time when it gets late in a cycle That will be in the weekend report.
Mentally freezes your insides
Ken, you seem like someone interested somewhat in fundamentals. Could you give me a quick lesson?…I can pull up info on a company from my broker….what particular things do YOU look at for a fast evaluation of danger points? And conversely, what items do you check for quality indication?
Hi Nancy,
This Sector is very dangerous right now….imo.
You really need to do your due diligence on these Oil Jrs…..I use Morningstar, amongst others,
for my research in a company’s Income and Debt etc.
This is NOT to say you can not make money big money, Alex does over and over again, just know the risks of a company BEFORE you pull the trigger.
Thanks for the answer. I did actually look but not at the debt load.
Alex, look at GDX, GDXJ, JNUG and NUGT being up on a big gold down day like this. These stocks up today doesn’t make sense to me. I look at their performance today and I think that we haven’t even started the correction on the miner stocks yet. At some point the sentiment on this sector will break and break significantly downward. Could I be wrong or missing something?
Gold broke the 50sma and regained it so far. It is only down $6.
Topping can be a process, as the Buy the Dip crowd still buys the dips, and shorts cover, but look for lower highs and lower lows in time and the selling could pick up.
Todays volume on DUST already matches yesterdays massive volume , and its only 1/2 day.
Yesterday was buying, today is selling
I’m seeing a LOT of people pointing out the h&s formation in SPY, but haven’t really seen anyone (except Alex in a prior report, I think) suggest the possibility of a bull flag in SPY. A break of that bull flag would have the SPY going to new highs. Just something to think about… Add to that, SPY positively diverging in histogram in the daily, and for all the fuss about the $USD, it is still below the 50 week ma. There is a lot of bearishness out there, so it wouldn’t surprise me to see the markets take off and leave everyone waiting.
We’ve undercut, intraday, the potential DCL from last week. Twice. So is DCL ahead or did we Left Translate fail?
No idea. We’ll see what happens!!
I took a small pos in VLO today. And hopefully it will play out as hoped. Nothing is for certain …
There was some pretty heavy call buying last few weeks in VLO, so you might be in good company.. 😉
Hopefully…. I also like the way SWN is acting today…treading lightly…
I also really like the way SWN looked. It has a bull flag look. I was watching this and ORIG as bull flags yesterday, but ORIG kind of lost it, so I decided to stay out of SWN for now.
Both charts still look really good (So far) on a weekly chart. Pushing on the 50MA on a wkly.
VLO – Looks like it may be a double bottom, higher low from Feb lows with the MACD higher low too. It’s a good entry, but just be cautious this late in Oils daily cycle. Maybe it’s just a trade?
I expect a dip into a DCL after maybe hitting the $50 area, and then a run higher into the intermediate cycle top
Valero seems to be gaining traction in new stations in growing neighborhoods where I am…. And with Memorial Day around the corner I am thinking that, and the chart, might be worth playing this as a swing trade… 🙂
I bought a little X and VZ looks like it’s trying to bottom, though it may take a few days for the selling pressure to run its course.
Quite the gap fill and reversals on UCO and USO
And UNG and UGAZ reversals look like bullish engulfing.
does anyone have background knowledge of SN. I’m in this one and really don’t like the way it’s trading. Oil is almost back to its 7 month high and SN should be picking up.
Chart-wise – I dont like what it did today, it looks to have increasing selling volume and broke below that recent consolidation. This could drop to the 50sma pretty quickly if it got going.
I’ll post a chart on BAS later. BARF!!!!!!!
Still in LGCY, OAS, CWEI for now. Took losses on others.
PQ daily chart is all messed up due to the reverse split. Because of the gap I haven’t stopped out, but I’m considering it.
Sold WG at the lows and bought back half as it went green. Guess I enjoy pain.
We may yet get $50 oil this run.
Oil did a reversal today after UCO & USO filled those gaps. Maybe we do still get $50 with another push higher.
I’m 50% cash, but still holding my positions mentioned lately.
Please post when you sell out of your positions. Maybe I have felt falsely safe if I thought you still thought a suggested trade was still ok.
Hi Nancy, Sorry for that, I trade rather frequently, in and out often.
I do try to post when I exit a trade or take a partial to buy a new one, or I post what I still own, but it is difficult, because I trade a lot and try not to own more than 5-8 positions at one time. .
Sorry you didnt know I was out of HK. The set up was good above the 50sma when I called it back in April, but my stop is usually under the 50sma and it broke out and fell back ( Like EVEP), so I exit on that type of action.
Currently I own HBM BARELY DODGING AROUND the 50sma, so I ‘m giving it time, I own LGCY, IPI, and a few others above the 50sma, but if something drops below my stop, and I say where my stop would be…. I am out. I can try to be clearer
Thanks…I know you can’t post everything. In oil am still in HBM, SN, OAS, SWN, WTI, and RIG but I may just keep that small position. So if you have comments on any of them I would appreciate hearing.
I have been bitten the same way as Nancy. I’ve said a couple of times before that I’ve been on and off of CFreak a few times, mainly because our styles of speculating are different. But I recently understood what I needed to do to make this work. You have to know what you’re comfortable with, timeframe-wise. For me, I like stocks that are breaking above major ma’s. Alex, you might recommend something basing, or breaking out of a base, but still below the major ma’s. It’s two different styles, and both are valid. You just have to know which suits you better. Maybe we are all a little guilty of acting on impulse, thinking you have a better crystal ball, and go into a trade just because you mention it. I made this mistake tuesday, going into EXK just because you did, thinking you know better than me, although my horizontal resistance line in the weekly was telling me not to, and to just keep watching it. Of course I sold it for a loss yesterday, but what made me feel silly was when I read you had hedged it!!! I felt like an idiot!!! But again, you are just putting that out there, doesn’t mean you will be right! The fault was mine because i tried to trade like you, and I am not you!! It is all in learning to act on the analysis of the timeframe that suits you best. I like to go weekly and daily, and with the major ma’s, so that I can smooth out the price action and see a clear trend. Alex, you sometimes mention a bunch of stocks, some go up, some go down. You do it well intentioned, but often times thinking as a *trader*, not as a medium to longer term investor, which I think a lot of your readers are, or should be, more geared towards a medium to longer term, but get fascinated by the short term trades. I know this is long, but maybe it helps you also in your development as an investment writer. A lot of times you definately separate in your reports what a trader should do or a longer term investor should do. Sometimes you dont specify it. But like I said a couple of weeks back, thats where the learning comes in. As an investor, you have to learn to analyze on your own, and have full trust in your analysis. There is no way that Alex can know what my goals are, and what I feel comfortable investing in. Maybe he’s comfortable owning 500k in just 3 stocks!! I’m not. But thats where we need to combine Alex’s analysis with our own. It really sucks that this happened to Nancy, and others out there. But believe it or not it will help Nancy get better at this. This helps us know ourselves better as investors. Why do you think I like sticking to etf’s???? I’ve had to wake up to unpleasent surprises MANY times. For us CFreaks, we just have to learn to recognize when something looks good for Alex as a trader, or a longer term investor, and where you fit in. Hopefully that helps somebody out there, if not, I just talked a whole lotta crap for no good reason!!!!!!!
Damn that was long! Maybe I’ll edit…..
there’s nothing quite like a substantial loss to focus the mind into finding ways to trade correctly!
Good comment. I am finding my way. I was more a swing trader before….but I tend to like stocks too much and hang on too long. I lost major money some years ago. Now that I have free trades I started trading again but I am not moving in /out as much as I thought I would. Old tendencies. I figured out that Alex moves in and out quicker than I do…and I wanted to do more of that when I am not out on a jobsite painting. I am more ok with the ups/downs on stocks I am holding for longer term gains….but HK wasn’t one of them…and not that big a downI had a small profit at one point and should have taken it.
The person who got me interested in the stock market, specifically gold and miners, is an older customer of mine, maybe 70 years old by now. 9 years ago, his first words about the market to me were “Learn technical analysis, lots of it!”. I went on to make 20k my first month trading. Second thing he told me: “the more moves you make, the more you play into their hand”. I went on to trade my way into losing the 20k, and another 80 in the course of 1 year. Granted, I was following a newsletter, and believe it or not, the majority of that money was lost following their rec’s in the midst of ’08-’09. I swore this off completely. After getting back on my feet, i saw that the 20k I had made, were not beginners luck. There was something I was doing right. That made me study, and still I lost more money. But my friends’ words still ring in my ear: “the more moves you make….”. Thats why I focus on the weeklies, and where price is in regard to 10 week, 20 and 30 week, and the biggie: 50 week. Now things are working right. BTW, that friend of mine, worth about 100 million. Has been in gold, silver, and miners, since 2001. Did not sell 2011 because he’s in it for a particular challenge: he wanted to ride a FULL secular bull from start to finish w/out being thrown off, just for pride’s sake. I think he’s nuts, but he has some great knowledge. Long term is the way to go.
wow…. interesting
… quite the roller coaster ride
Tell me about it! I still wonder how the heck I didn’t develop an addiction to anti-depressants!! Wanna hear the punchline regarding that newsletter experience? It recommended buying SLW near $8, adding at $7, again at $6, and finally recommended selling out near $4 arguing that it could fall to cents. That was about 2 months before the final bottom. You think I ever forget that??? I’ve always wanted to write my own blog, but I think the responsability that goes with it is YUGE. If you ever get bored enough, I’ll tell you about the friend I talk about that got me into this. Fascinating man….
.,.. wow – i have heard horror stories like that before – im sorry.
you are very lucky to have had a mentor like that… very lucky. I am but a lone needle in a haystack in my parts and STILL also trying to find out what it is I want to do when I grow up.. ;o)
*99% sure now though it’s Retire and Trade
**I never wanna grow up ..
I’ve learned a lot from that guy! But what i’ve learned the most is that I want to be nothing like him. He’s worth millions, but he’s a hermit, loves money above everything and everyone. I am his friend, but I am honest. I dont want that. If I had a fraction of what he has, I’d be working 3 months and traveling 9! I am also trying to make it through life without growing up! I try to put humour into everything I do. Smile a lot. Say hello and goodbye. Friendly. And we haven’t known each other for long, so you wouldn’t know this, but there are two little ones a few feet away that swear I’m the strongest man in the world, a super hero, and the best dad in the universe!! Thats what gets me through good and bad days! 😉
aww… awesome Peter kudos to u ;o)
my daddy is STill my hero .. I grew up in his front pocket.
#priorities
your mentor is scruge mcDuck?
You might say it jokingly, but you have no idea how close you are to reality!
Yes, but….I have waited to cross major MAs before in commodities. You know what I did? I bought that top. I mean the absolute top to the penny. My position was underwater within seconds. Then I cried about it.
EVEP. Oh, how I hate EVEP. I mismanaged my stop being lazy. Stay on your toes with energy right now folks!
Hello Nancy I may be new but I sure feel for your loss. If I see anything in the future, I will help also.
I’d appreciate it. I did read up on most of the trades I took but should have been more wary of oil shale because I have known how badly they have been doing. I did not really look into their debt loads. I just was not familiar with the oil sector…have not bought in it often. More pipelines in the past. And I am just learning about cycles here and did not know about the longer cycle in oil than metals. Guess I am just still learning.
I sold OAS today for profit but more b/c I goobered my stop and less about the chart. I was in the green so I took it home with me.
An Avalanche of Shale Bust & BK Just Started (More than 2 dozens Sanchez Peers BK this month)
Sanchez’s financials are very much the same as PVA, HK, LINE, GDP. Basicaly $2 Billion Debt, much higher than Sanchez’s UNAUDITED assets on balance sheet. Sanchez losses in 2015 are in the billions while paying ~200 million on debt. Most Shale BK this month, even a lot of them don’t have default risk financially, they defaulted on loan anyway. Because no one wants to pass the opportunity of paying bond holders pennies on the dollar at Chapter 11 court. Heck, you borrowed billions of dollars to buy land lease at the highest oil price, now the bottom is falling out. Instead of struggling with billion debt why not force bond holder to accept few pennies on dollar, so the company owners can start a new company after emerging from chapter and doing exact same thing without worrying about any debt issue. Shales will do because it is now a fashion to write off billion $ loans for free, good justification. Perfect timing. Perfect Justification. Less
Yep – Just wiping the dust of their hands and moving on. Ugh .
I thought the loans were bank loans and I really thought that the banks would struggle with that. I think Ur right.
Thanks for the write up. I may get hit on SN too. Home from work too late to take any action today. At least oil had recovered while I was away.
Sold SN and BTE – net break-even. I don’t like this bankruptcy trend going on right now.
I love Alex’s work and the LGCY play was masterful. But there is just no reason to be in the micro cap oil plays right now. None. There are plenty of good setups in the higher priced ones.
Go look at the list we traded last spring. All but like 3 of them are bankrupt or OTC at this point.
You had a short list, I can name way more than 3 🙂
The problem is, we are too late in the intermediate cycle to be in the higher risk ones.
I’ll put it in a report
Exactly, and I certainly realize and agree with that. Issue is I didn’t realize that 2 weeks ago. Really get my attention with the “Sell now!!” sign next time. I mean, like someone hit me in the headbwith a hammer type of get my attention.
Dont know what to make of the action in HBM.. testing that 50 sma too much for my liking. FCX up very nicely today, but HBM seems to be lagging for some reason…. will hold it until tomorrow and hopefully it can get back above the 50 convincingly. But it doesn’t really make me feel warm and fuzzy inside…. the volume profile is positive, but price is just stuck.
There are some really interesting points in the weekly. But lets see how the week closes. An up day tomorrow of decent size can have it b/out above a multi-month trendline. Fingers are crossed!
I am in HBM and SN…both already red. I appreciate the comments and evaluation. Please keep it up. I may have to take more hits…but I sure don’t want another heartbreak like this morning’s HK surprise!
Thanks Nancy!! They definately don’t make this easy!!!!
Two thoughts, when I have had a mental stop at a revolving point (like said 50), it’s often ended in a sudden break (usually a morning gap) and disaster. 2) copper charts posted end of last week. Remeber the vomiting camel? Yeah….
You think copper is gonna do the vomiting camel??? I would normally have sold out of HBM today because it broke the 50 (again), and cci 50 also broke below center line, BUT… being that it’s thursday, I will give it the benefit of the doubt and wait to see how we close tomorrow. Might regret it tomorrow, but if it were to bounce, the weekly chart might look very interesting.
I was being dramatic with that one, channeling my inner BK. I’ll post that and BAS later tonight.
Posted
Alex – let’s say that the currency situation does start to reverse overnight. All of a sudden we would be in a positive mode for commodities. If that was the case, what would you suggest are the best of the breed to get back into?
over 100 comments today.. but only 4(?) from Maria.
.. and 0 giffage
is this a new world record?
;P
Hey, SOG…off topic here, but I was just looking at the charts you posted for me earlier today and had missed the comment before I left for work about the Scream…LOL VERY appropriate. That is EXACTLY how I looked when I woke up and looked at the pre market chart for HK!
know the feeling.. same face on me last week with LINE 🙂
… but then you just gotta take your smack and move along.
it feels better when you know what you did wrong.. and next time would be able to avoid it
and i don’t mean ‘smack’ as in heroin… in case you were wonderin’ 😀
LOL..However, I WILL be having wine with dinner! Or maybe I will treat myself to a cococabantini to have a bit of a stronger relaxant
Bullcrap. Ok, I’m going elsewhere then.
giggle…
LOL … busy day in MariaLand
Stopped – OAS, WPX (I screwed that one up), VALE, HBM. Hated out of AA. Bought JDST at lows (GDXJ hi of day). Still in BCEI (thanks to broker error) at about breakeven, CLF – down but minimal. Otherwise, heavy cash today. I don’t like the action, I imagine sitting on my hands for awhile here.
Here is what I am reading http://s2.q4cdn.com/462548525/files/doc_financials/quarterly/2016/Q1/Q1-2016-DVN-Operations-Report-FINAL.pdf
I like what I read., but am not a great chartist. I have been looking for a sub $40 oil play with good upside and fundamentals. (If only I had caught this at $18).
Alex, looking at the chart is this safe to buy a starter position? I am hoping to buy a core and either buy on dips or trade around it.
Wow… Do any of you watch live crude prices after hours like I do? Last couple hours are impressive
Every night!
me too 🙂
I dont watch them during the day, much less at night!!! 😉
Where do you watch them?
CNBC mobile app
Anyone like how Copper looks? Neither do I!
What’s wrong, BAS? Bankrupt much?? It’s coming – worst looking chart in the energy universe!
GDX to GOLD ratio update. Been on a HUGE run. Crushed yesterday and back up to the 20-day today. What happens tomorrow? Stay tuned!!!
*REFRESH*
Anyone have CYBR? The volume is off the charts today .. And the one year chart looks good.. Or so I think …that it’s getting ready to break out.
I AM PROOF READING TODAYS REPORT…..ITS A BIT ‘WORDY’
It’ll be out in about 10 minutes