
Stretching It Out
The various sectors of the markets continue to chug along and stretch out, ahead of the FED this week. The Fed Minutes are released Wednesday. Obviously since the weekend report was posted, not a whole lot has happened, but lets review our expectations anyway.
.
SPX- An idea from the weekend report. A pullback similar to the OCT -Nov run higher.
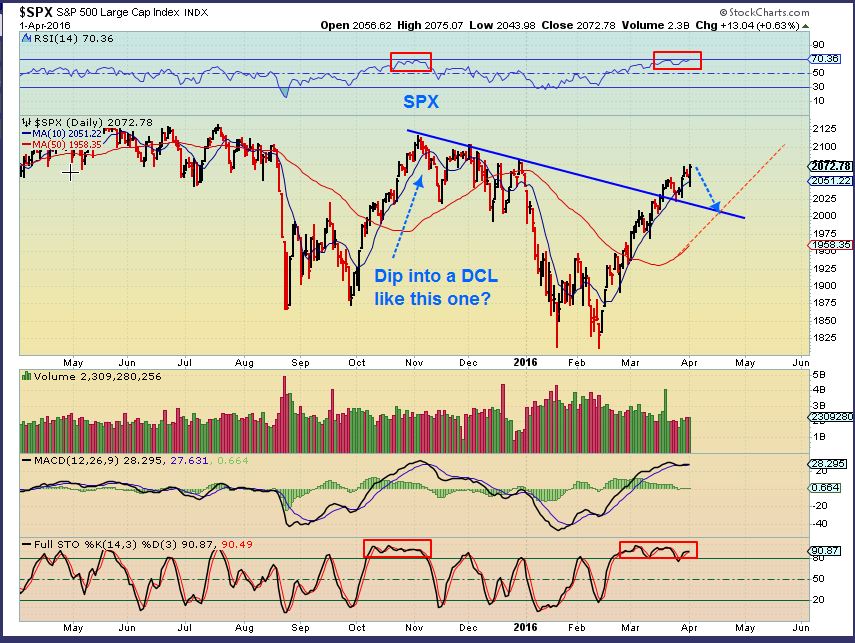
I captured this chart of the SPX Midday today. Notice…
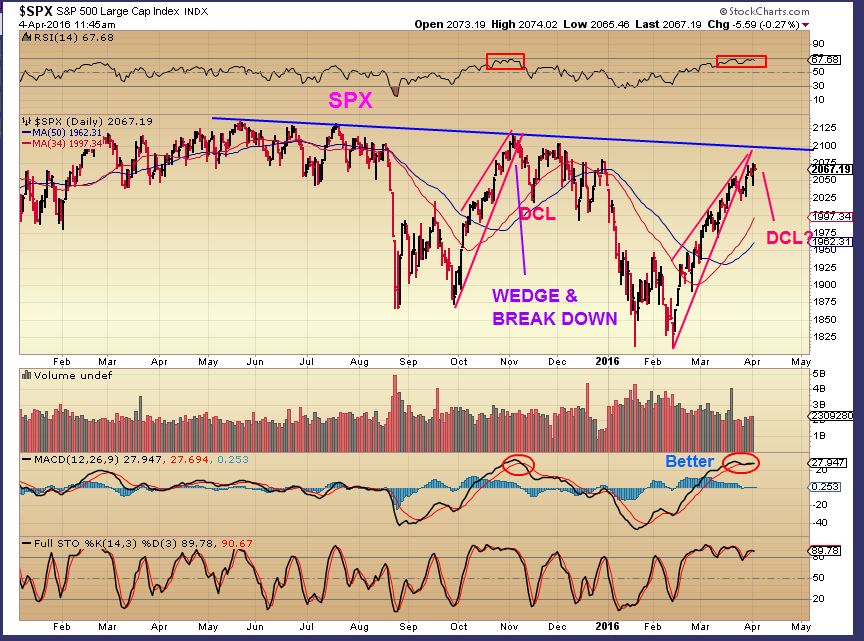
That the MACD looks a bit better this time. The pull back may not be very deep.
.
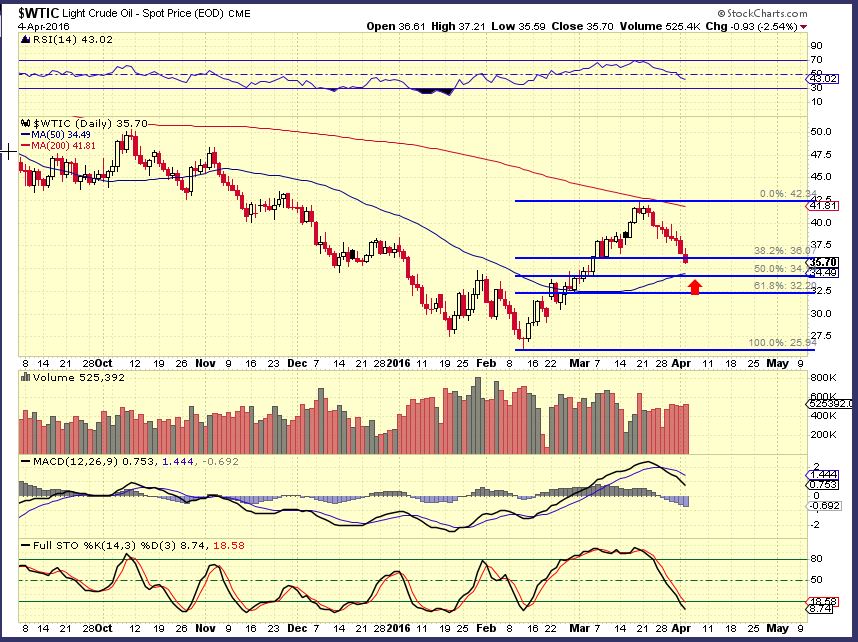
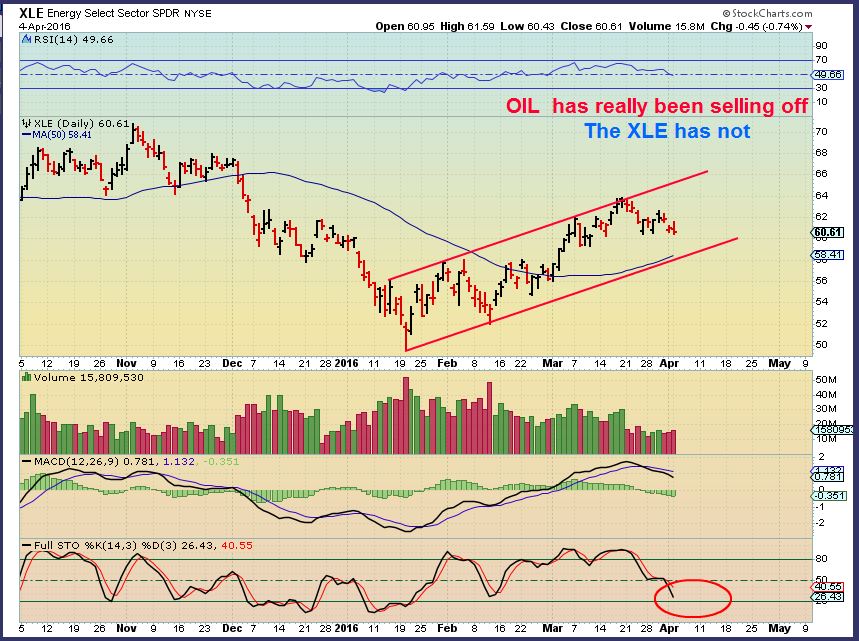
Oil continued to stretch down into its DCL. I’ve been pointing out the $34 area. We may be close to the daily cycle low. YOU WOULD THINK THAT – with OIL down about $1 AND down 9 days straight, we shouldn’t see strength in any Oil stocks, right? Look at BTE, WG, BGG, MRO, etc
AREX, CRK, ARP, LGCY were holding up for junior oil stocks , and the XLE ( mini h&S?) has also held up well in the Oil selling recently.
.
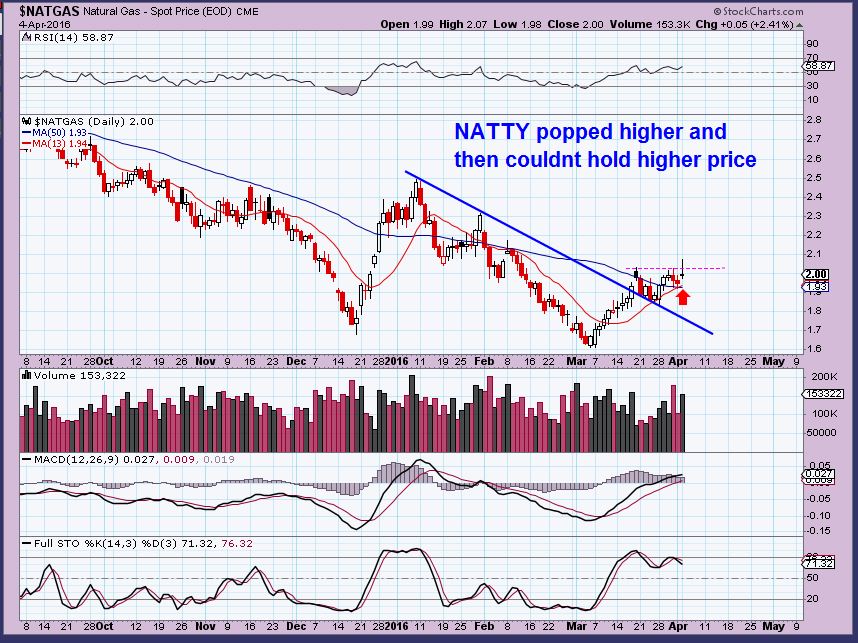
NATGAS – Broke out higher by quite a bit – 6% at one point ( 12 cents) , but couldnt hold the higher price. Usually leads to further selling or possibly consolidation.
.
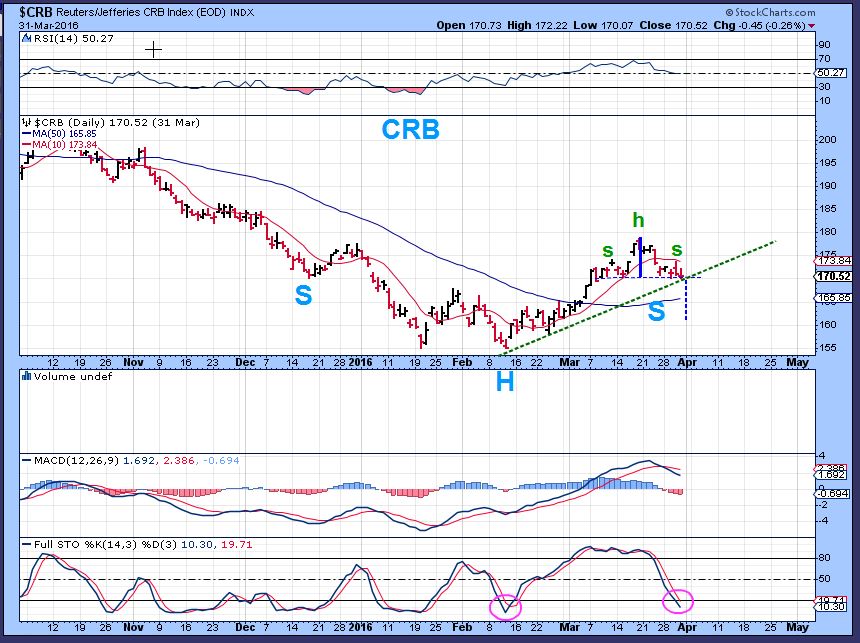
CRB- I mentioned this drop should be close to finished. I did spot this mini H&S and pointed it out here on March 31.
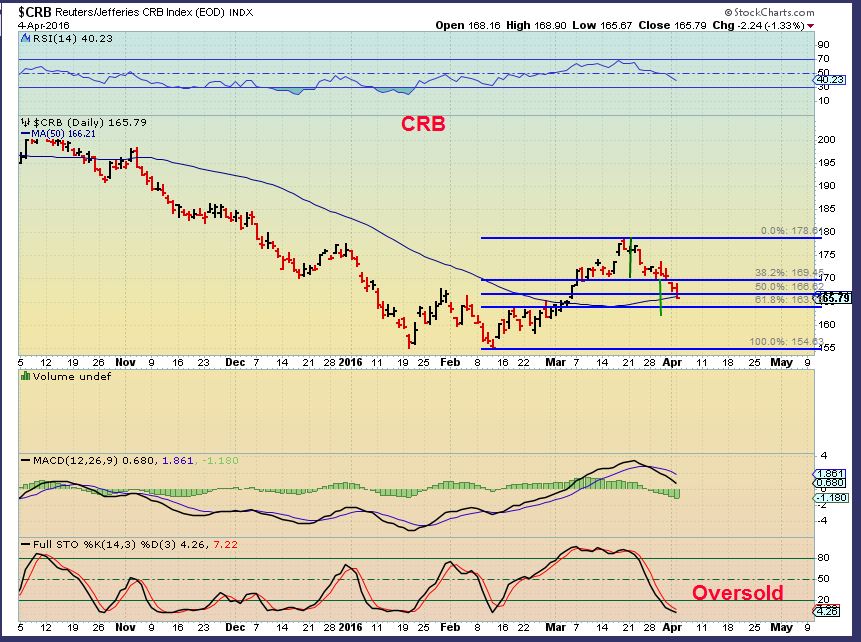
CRB April 4th – I dont like to see the CRB drop below the 50%, and especially not the 62% retrace, but it should still be ok.
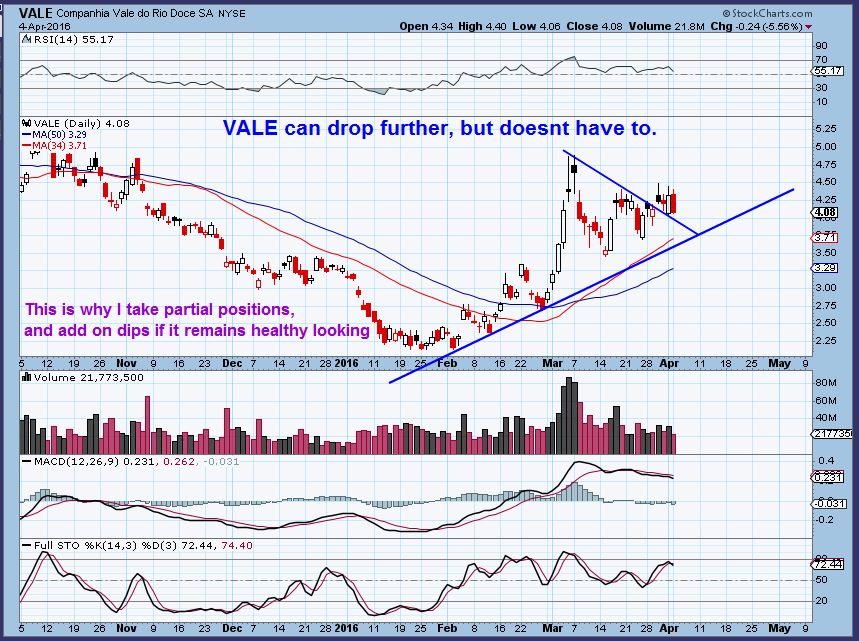
Commodities like VALE were selling down today, but still holding up nicely overall. Could it drop further? Yes. Consolidations take time and can be tough to ride out.
.
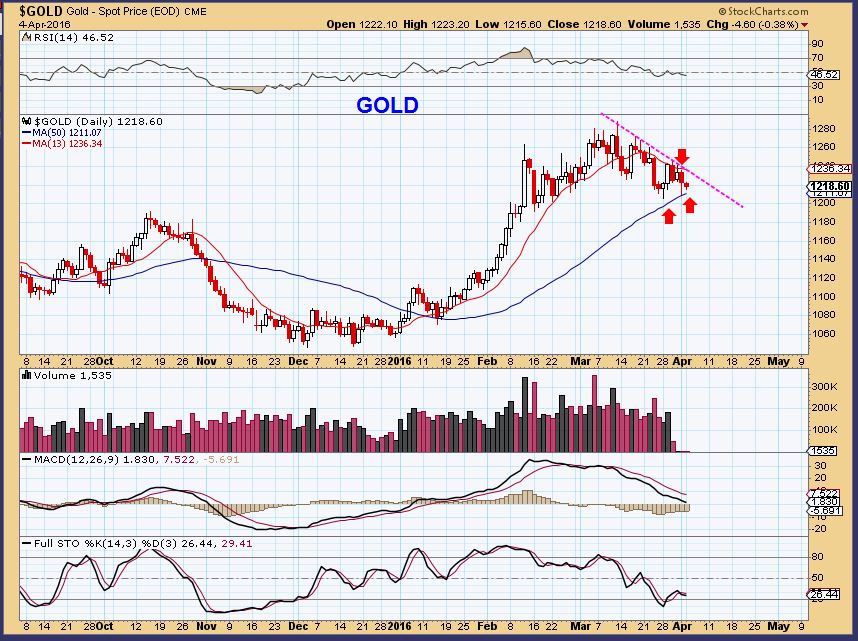
GOLD – I’m Still expecting Gold to pull back. I know, I know – Friday it bounced right off of the 50sma, Monday it held that level, and as I write Gold has popped about +$15.00. 🙂 It looks strong, but if you are tempted to jump back in, just look at the Magenta line overhead. I dont think we’ll see GOLD close above $1235. Even if it did, I see lower prices in the near future.
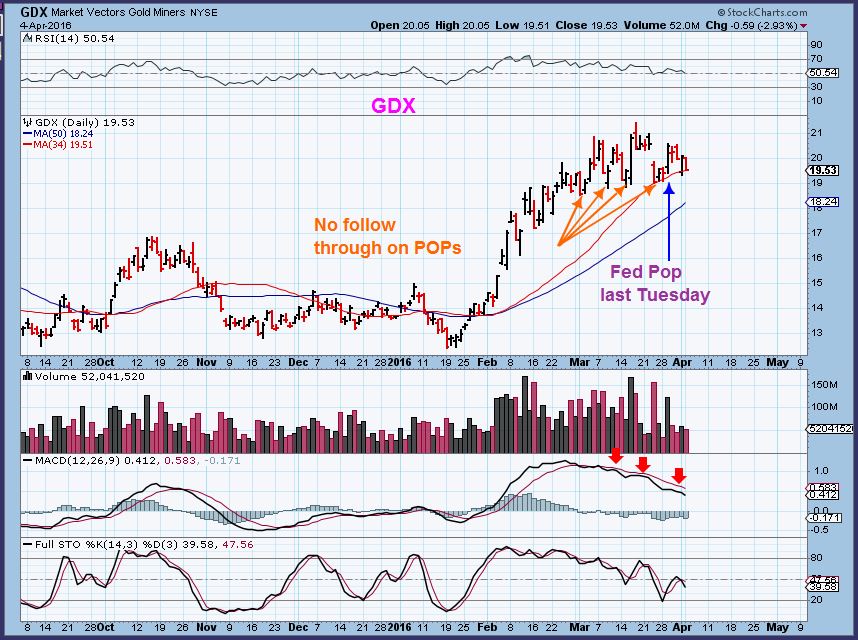
GDX – Many “Pops” that didnt have follow through. Remember the FED POP last Tuesday? No doubt these POPS suck people back into the sector, but the lack of follow through is probably smarter money selling into those pops. Will we get a POP with FED MINUTES WEDNESDAY?
 .
.
We are exercising patience for now with Miners, but I do like how many of these are acting.
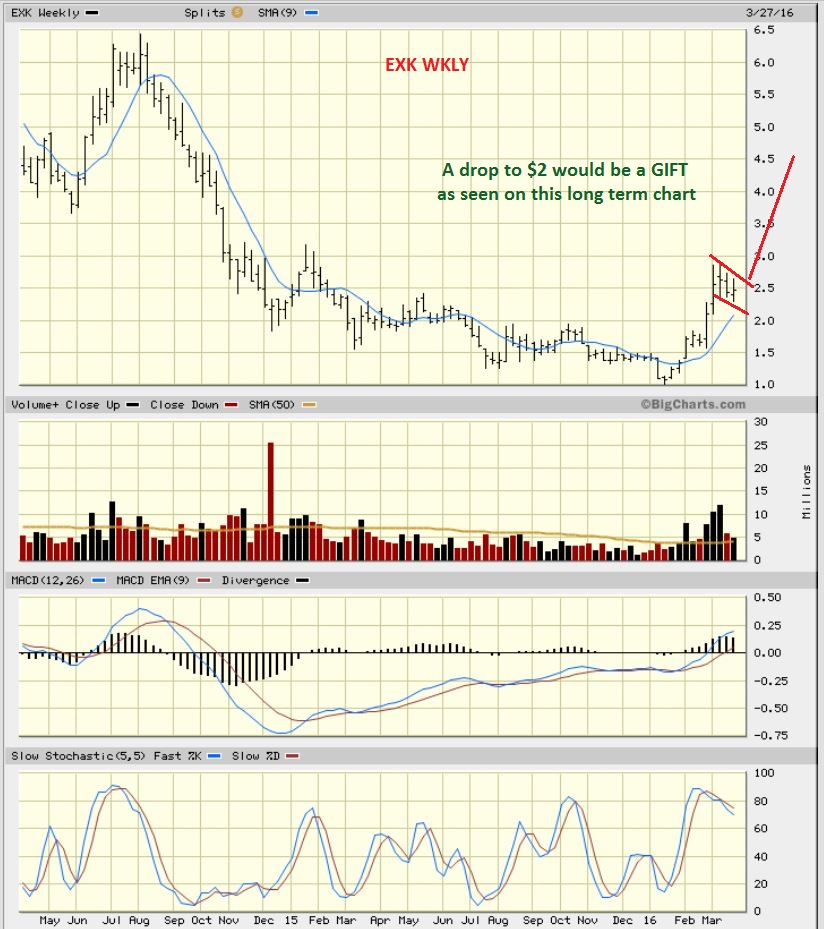
For example, I posted these 2 charts last week.
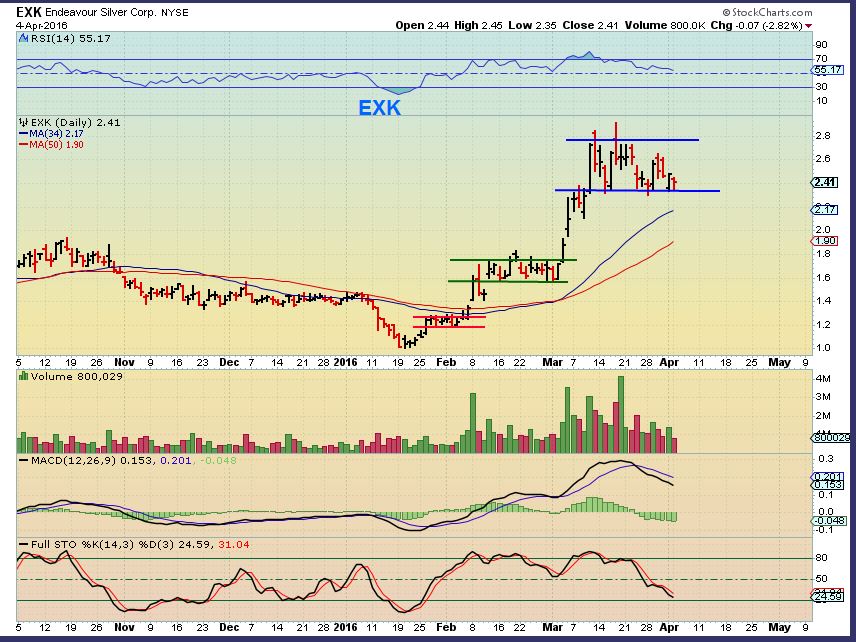
EXK at $2.49 last Wednesday. Not quite oversold. I mentioned a possible BOX consolidation would keep some of these strong.
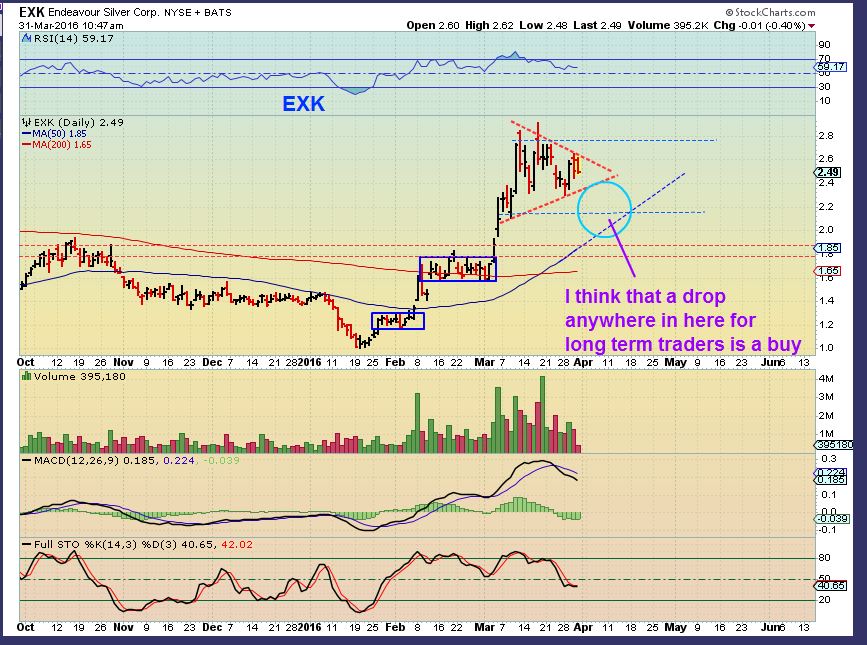
Today EXK is still in the area consolidating. I really do like the way some of these miners are acting.
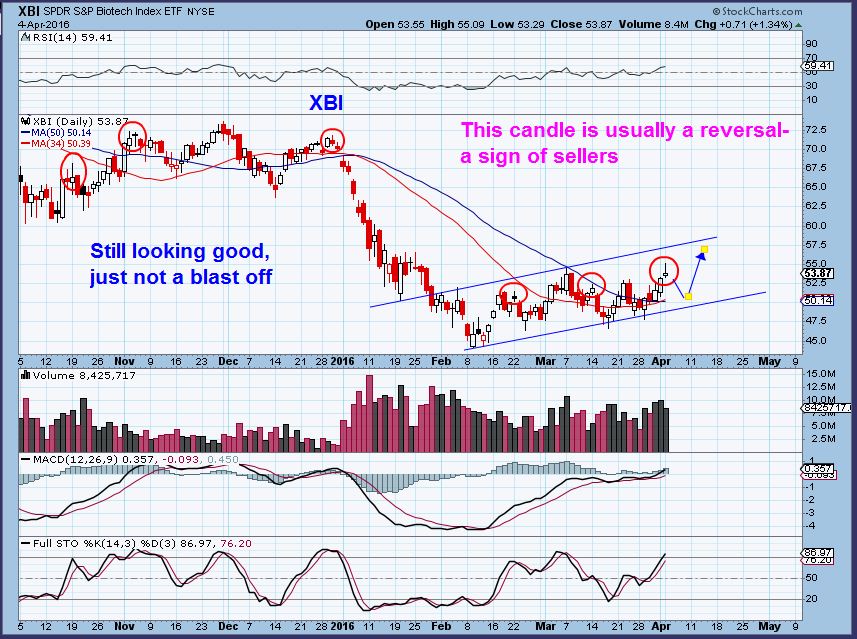
– IBB XBI –
.
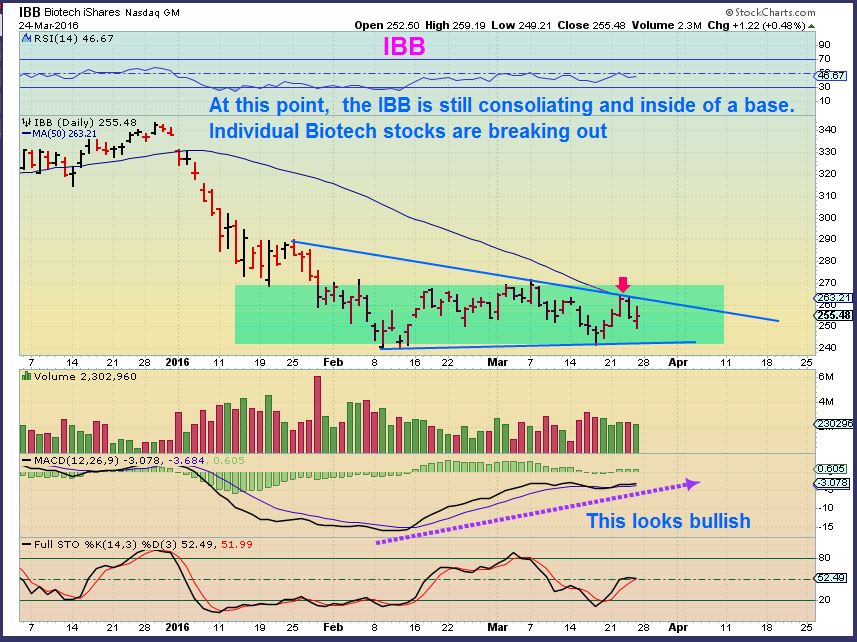
In the weekend report I mentioned the IBB, XBI area. I used a few charts to show that we were breaking above the 50sma, but I also said, We need to see if we get follow through. If not, we might still be caught in a base.
LETS REVIEW
March 24 – This is the base
Fridays break of the 50sma, not a break from the base
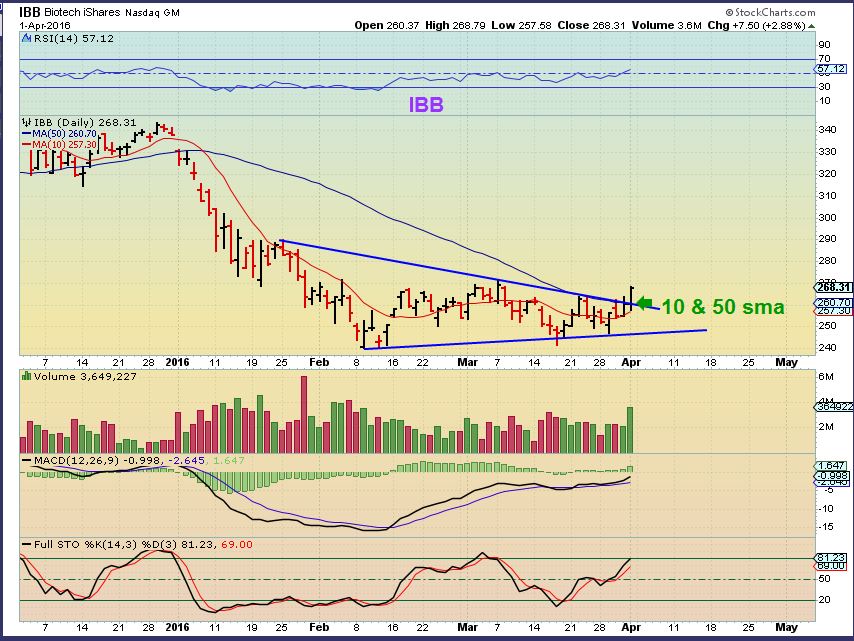
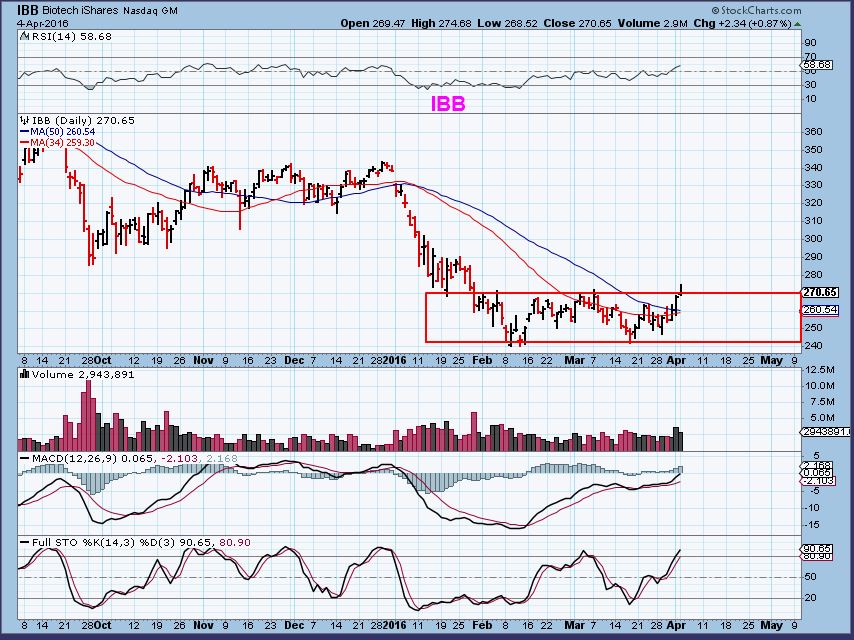
TODAY – a break and reverse back inside. That MIGHT be a false break out and the consolidation / base can continue if selling overwhelms buying.
XBI – That candle is often a reversal / topping candle. This isn’t “bearish”, it is just a continuation of the base unless buyers can overwhelm sellers and shorts start to cover.
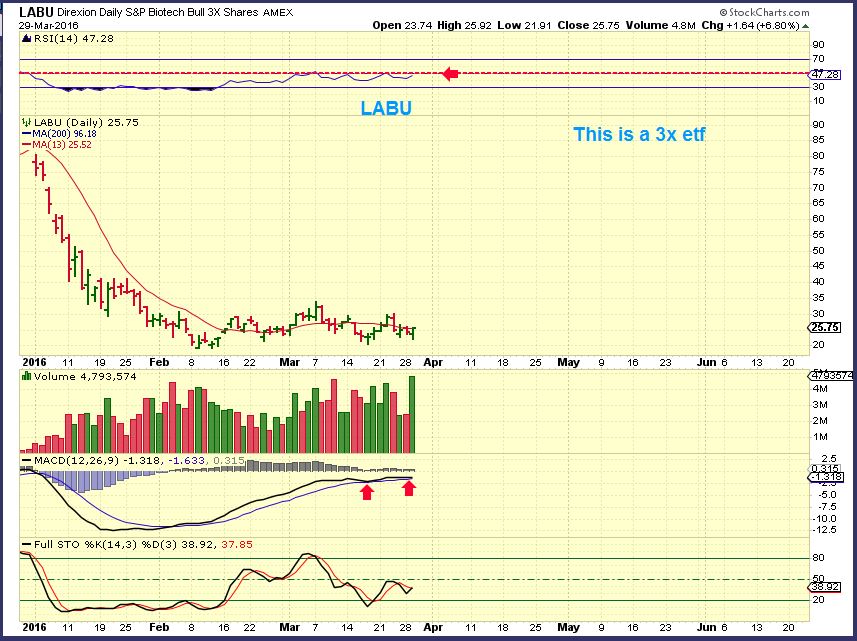
SO I get a lot of questions about LABU lately – If you bought LABU when I mentioned it here at the lows- you are fine. It should be used as a trade inside of a base ( It hit $33 today). I can’t guide people through 3x ETF trades day by day. If you entered that trade, please have your whole Buy, Sell, Stop in mind.
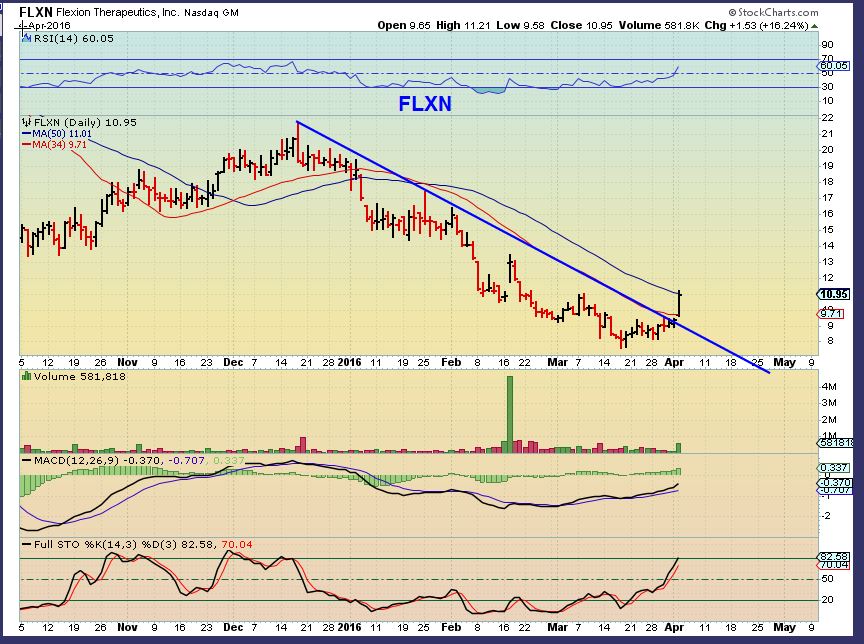
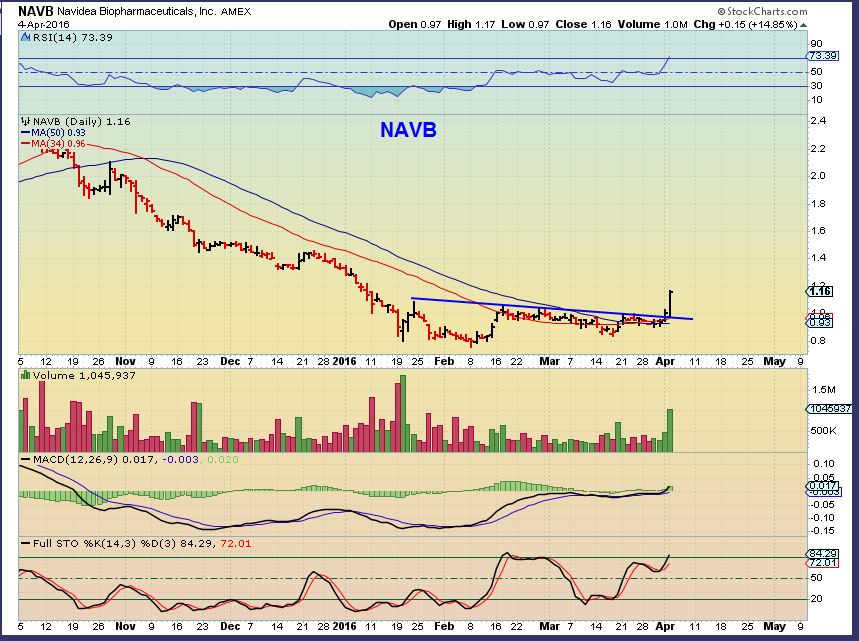
I looked at MANY MANY biotech stocks and they almost all have BULLISH looking set ups to them. This would lead me to believe that the IBB and XBI should continue to base out, or break out . Let me share a few charts.
FLXN – Nice break out
NAVB – I love this set up.
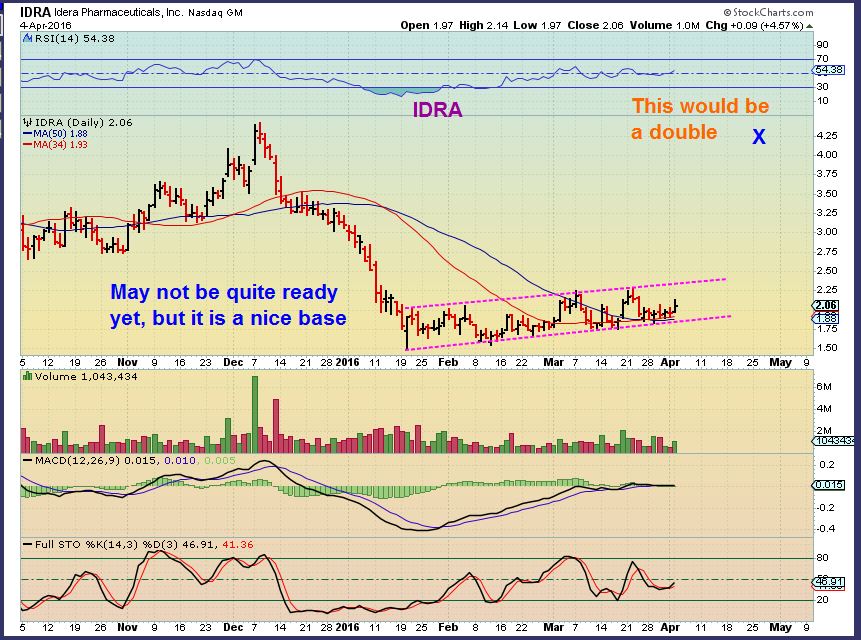
IDRA –
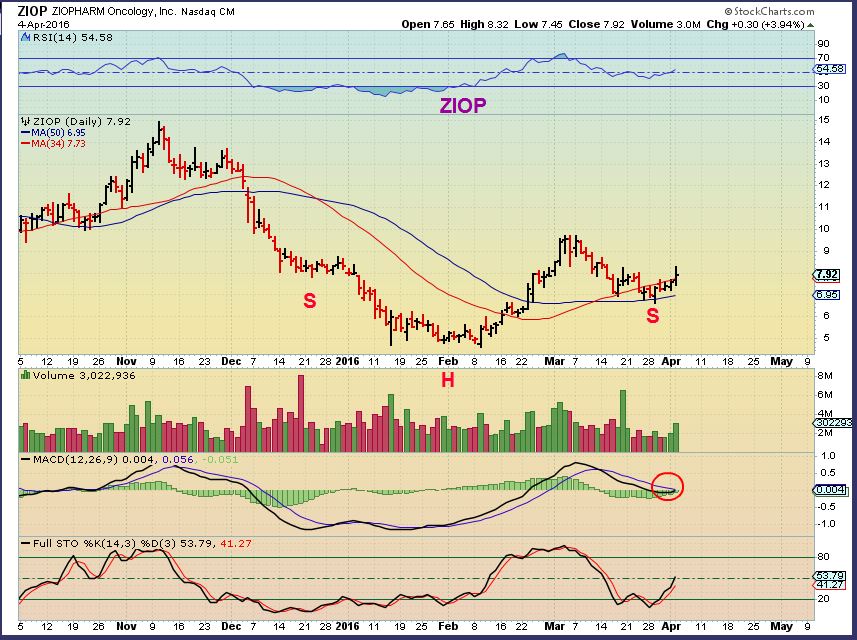
ZIOP
LJPC recommended in Feb as an Inverse H&S and March 21 as a back test. I want to use this chart to make a point.
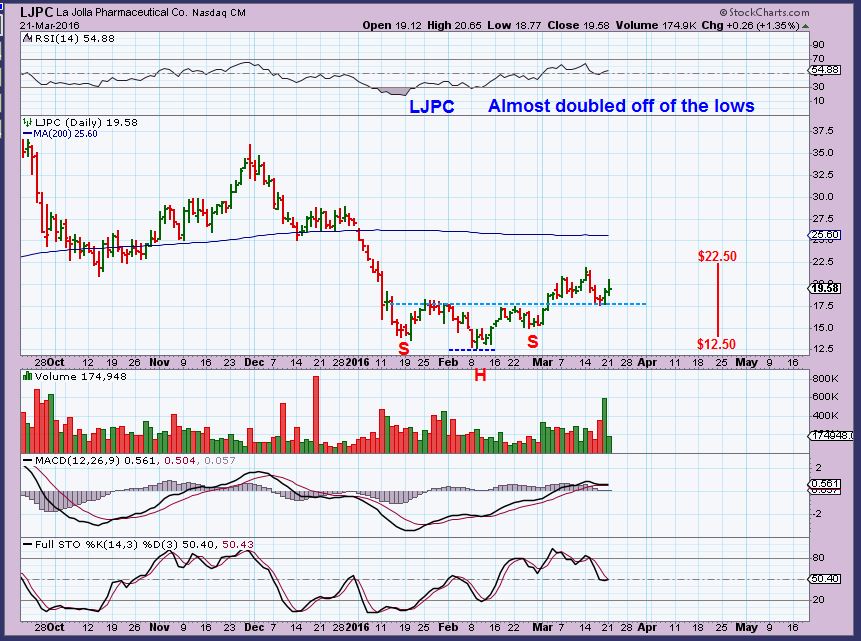
LJPC NOW- Still looks good, still moving higher over time.
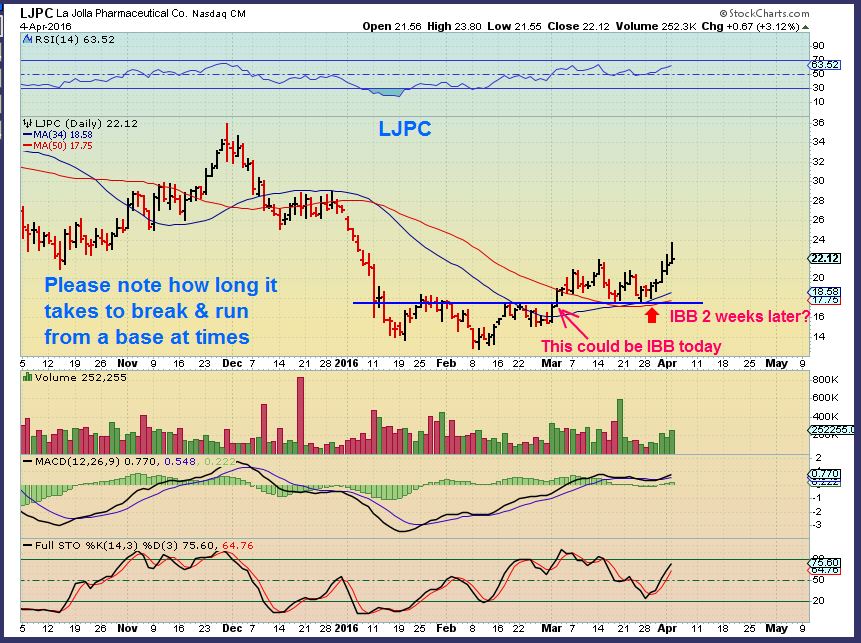
To make a point – Look at when LJPC broke from its base around March 1. 4 Weeks later it was still at the base. This can happen and 3xETFs can be affected. I use this just an FYI. I get a lot of email questions about every movement that IBB is making due to LABU or LABD, or Gold and Miners due to NUGT, JNUG or DUST. So my point is that BASES and CONSOLIDATIONS can take time and are frustrating. 3xETFs may exaggerate that feeling.
.
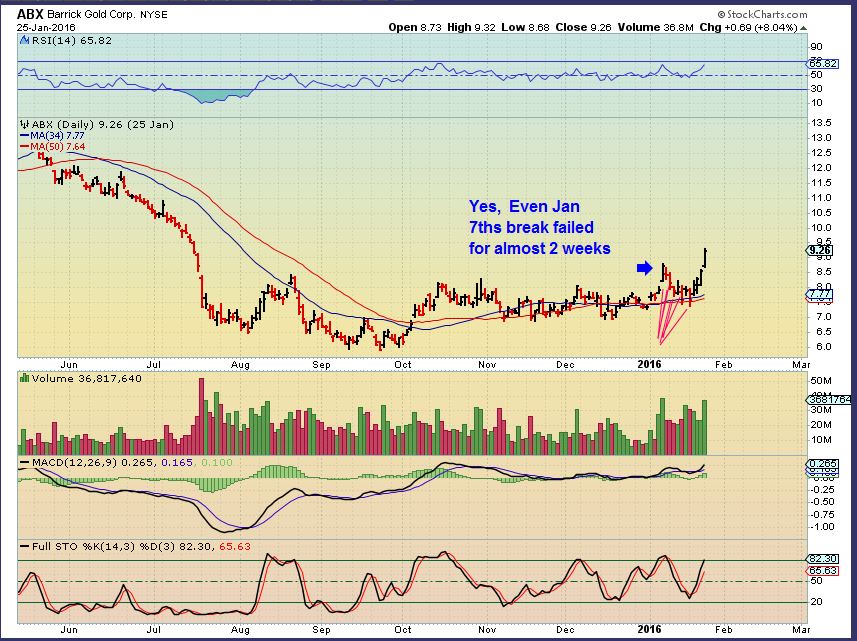
One other example that I remember well was when ABX recently broke from its base. Look at these false jumps ( Many false breaks higher) and then finally the Jan 7th break out. SWEET, but…
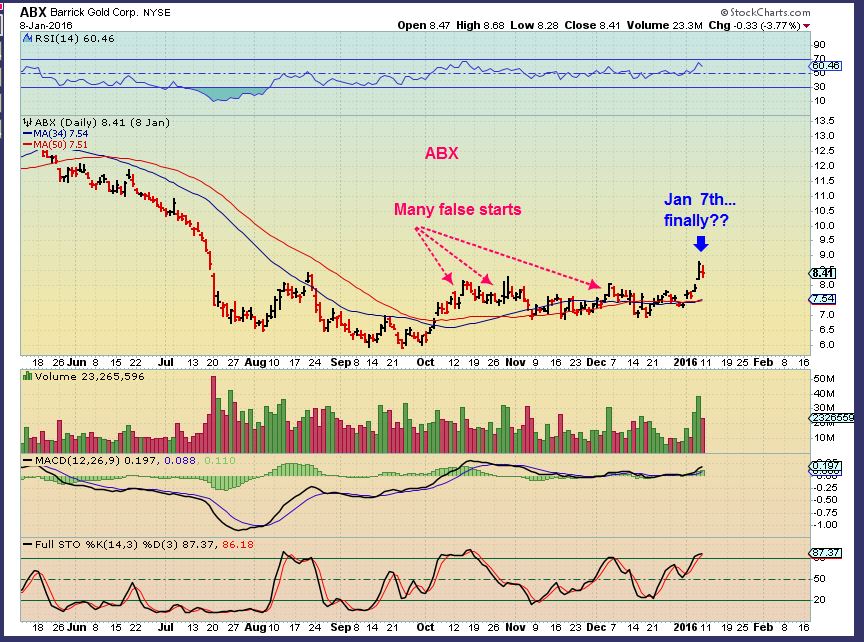
No. Even THAT Jan 7th break failed for 9 days before the real launch.
.
So the IBB has been bouncing and breaking higher and dropping for weeks, but it remains in its base. Some of the individual Biotech, Medical, Pharma stocks are popping and running, so I would expect the XBI & IBB will break out upside, but when will we see follow through? No one knows that for sure.
It’s a FED WEEK again, lets see how the market decide things should play out.
.
~ALEX
.
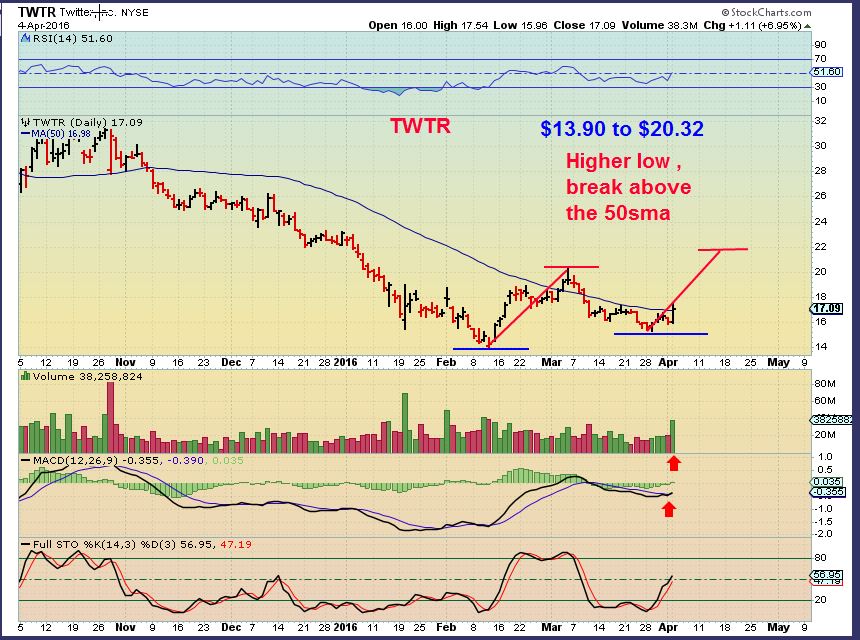
P.S. Stocks like TWTR and GRPN look pretty good right now.
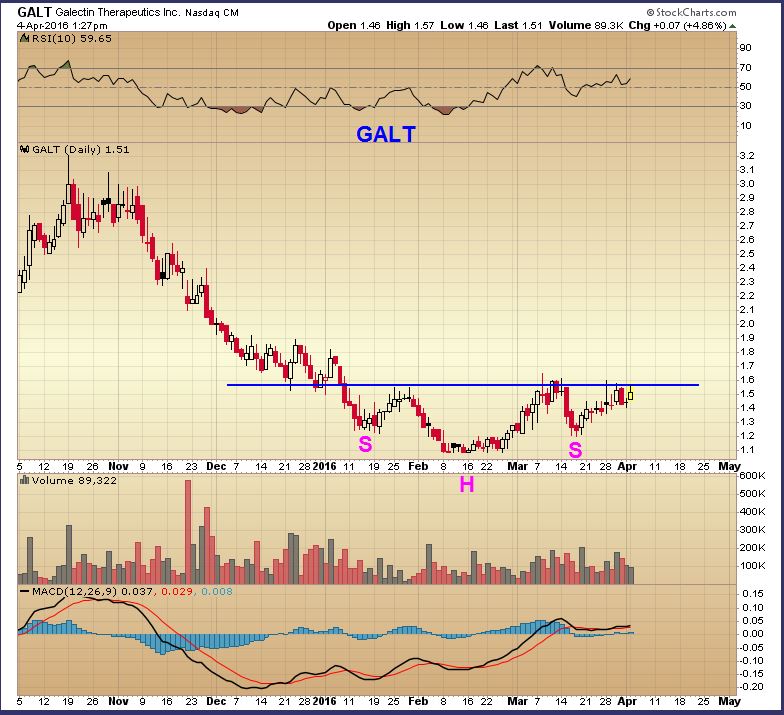
GALT –


If you read the report before 7:55 a.m. Eastern, I added 1 more chart – the last chart on the report now. For some reason, I missed adding it in there earlier.
It is GALT, it is a bullish set up that hasnt confirmed yet. A close above $1.60 could run another 60 cents ( or more), a stop below the neckline would be prudent
GALT, you have to wait for a close above $1.60 to confirm? You looking for a break above the neckline?
You dont have to , but that is basically how to play a H&S or Inverse H&S. The break of the neck line and a close there confirms the patterns validity and usually starts the follow through.
I always jump in early and take my chances that it will play out if other indicators are lined up correctly ( say for example MACD, Divergences, etc )
Dear Alex
First of all, you really really deserve the top notch place for identifying the lows in oil (around $26) and bio sectors. Not just the price you always follow through the big picture as well as review of how things changed down the road. I never seen such a follow up and frank opinions.
Now oil is approaching your target $34, GASL is ready for the move up?
Yes, CF, Congrats on nailing $26. I remember you making that call, and I said wow! that’s a lot more than I was seeing.
Thx Bill,
It was more than I imagined too. We were at $42 when I saw that and I thought that I would look silly posting that chart after already dropping from $100+ to $40’s
Thank You Siva
To be honest, I had the $26 on a weekly chart from Nov, but there was also a possible $24 – so I had 2 targets and the first one held nicley.
Kind of the same as OIL now. I had $36 or $34 – So if it does hold at $34, I had 2 targets ( And $32 is a 61.8% retrace and possible too) 🙂
There were some energy stocks holding up nicely ( in this report) as OIL sold off for 9 straight days. That’s a good sign that a low may be close.
Thanks again for the kind words. Yes , I would expect that GASL ( be careful with 3x etfs ) should move up when OIL does
Thanks for the clear direction on SPX. I’ll wait for a pullback to 2000 then invest.
Thanks Alex, I agree with Bill.
Hoekman – Maybe your 1st comment? Welcome …and thanks!
How does this chart look to you, Alex? I see a big inverse H&S.
Yes- but just so you know, that left shoulder took a whole month to form ‘peak to peak’ and often the right shoulder is symmetrical.
Getting close to a good spot to start collecting energy stocks. Some are down 88.6% off their highs. Look to be trying to turn. Look at REN. Others haven’t corrected as much and may have more downside.
Did you see the ones mentioned in the report? BTE, WG, BGG, MRO – They have hardly flinched as OIL sold off for 2 weeks straight. Kind of a good sign
I was watching them Yesterday. I think the ones that have sold off hard are starting to hold up, already cooked in the lower oil prices. Ones that have not been beat down are continuing down and will turn later. I like REN, PACD, and dare I say it REXX here!
PACD broke through the 50 sma and has fairly strong volume. May test the lows again. See how it looks there.
I ( SO FAR) like AREX on the 50sma, but have to wait and see. BAS was holding and gave it up today too.
Thanks for providing review for small cap oil stocks on right time. Updated my watch list for subsequent follow-ups.
Yes, a watch-list, I do recommend those for future reference 🙂
Here is my crystal ball approach to PACD. What I’m thinking, check link to chart.
https://www.tradingview.com/chart/PACD/Ma0vPfhe-PACD/
KEG, NADL, CLNE, AREX all bouncing off the 50sma
PACD corrected another 13%. are you looking to get in?
PACD yes, I think the energy sector is getting ready. I’m not saying to buy here, but get ready. Start looking at ones that have been beaten down. Find a solid company and you could get a 2x or 3x run. Look at REXX, I’m not recommending REXX because of the bottom line financially, but you can see how it could really shoot up. CF mentioned AREX, holding against the 50sma
NOT for short term traders but just spotted a nice looking chart in the health care sector, BSX. Breaking out of a major 1 year consolidation pattern. Strong trends tend to hold above a 22 day ema and good medium term trends will hold above the 66 day ema so those might be ideas for sutiable trailing stop loss levels for medium term traders/investors. Technical view only as have yet to look at the fundamentals but the chart looks interesting in a general area Alex has been highlighting.
That is a really sweet weekly chart – maybe a bit extended on the daily, but a good one to keep an eye on
It certainly jumped out from the screen! Maybe a little overbought in the very short term so we might retest that breakout level but certainly on my watchlist now. And as you’ve been highlighting recently Alex, in a general sector/area that is looking positive.
I used to follow ( invest in ) BEAT and VASC – because my wife works in the cardiac room of a hospital and always talks of the new developments there.
Thanks Alex. I’ll take a look at those as well. That sounds like quite some job your wife has!! I doubt there are many dull days there!!
Actually, she used to also talk a lot about ISRG equipment in the O.R. and MEDTRONICS ( MDT) too. May want to watch those.
5 year Inverse H&S WEEKLY ISRG
MDT seems to have one 1 year long
Yes, she sees a lot ( I dont know how she does it) , but then when there’s a squirrel, Racoon, or something else dead in the road, she HAS TO look away.
Thanks again Alex.
Wow! At first glance looks like ISRG may be just emerging from a 4 year consolidation/re-basing pattern. That will be interesting to follow. 🙂 Won’t be able to afford too many though at what looks like $600 a share!! Lol
Giant H&S on the monthly chart careful. Financials not great not bad. Steady income not much growth. Net income is negative.
Thanks Bill. My chart data doesn’t go back far enough to see that on the monthly but the weekly trends are most definitely turning bullish and wouldn’t enter without some kind of stop loss. Appreciate the fundamental comments as well. Thanks. 🙂
Here is what I see in BSX. Could still go up for a while, who knows. refresh
I take your point Bill I just love the way it’s climbing up that MA in a really strong trending move though as as you say with regard to future price action…who knows!! That what ‘risk management’ is for!! 🙂 A lesson I learnt the hard way!!
Looks good above the MAs. Might be worth it sell if it drops below the 8ema.
It does. But persoanlly it lloks a little stretched on my very short term charts and I’d be more comfortable waiting for a possible retest of either sbort term ma’s or the breakout level. I would also be looking on a more intermediate time frame as well so would more likely use something like the 22 ema on a closing basis as a potential SL level and adjust my postion size accordingly to keep the rsik within acceptable levels. But that’s just my style and I know everyone has their own approach. But certainly one I’ll be watching in the near term. But appreciate your insights as well Bill. 🙂
I like the way VALE is holding the 22 EMA
Hey, baby steps , right. I know you longer term investors would like to see it hold for 6 months or so, but Its off to a good start ; – )
And that’s while the MACD and RSI are correcting overbought positions! Impressive. 🙂
hi chrisssss :o)
Hi Maria 🙂
Good report. Alex, RIG looks pretty interesting here. Oversold on the daily, not quite there yet on the weekly. Daily chart price is also approaching the lower Bollinger Band. I’m watching this one for when oil bottoms out.
Does the weekly for $WTIC give you concern that $34 might be optimistic on oil? I’m still learning weekly charts but the position of the Slow Stochastics for $WTIC does give me a bit of concern. I’m tinkering with the 10 Day RSI on the weekly and that gives me a bit of concern as well. Any advice you can share with me on using the weekly chart on oil is appreciated!
Commodities perking up.
My VALE, CLF, and AKS heading higher in that consolidation.
ALSO SID, TMST, etc
CLF good, LABU, RPTP and SRPT all green. REN up 10%
rexx is suckn pond scum… hope u didnt bite
#bottomFeeder 😉
No – he meant FELP, not Rexx : )
tehee
Hard to believe that’
s 13%. Looks like nothing
I don’t have REXX. Probably going to double bottom or go out of business.
oh good …
thought for a minute i was gonna have to post another HB for u…. to ease your pain ;o)
LOL
You could still post a couple
ill save them for when you realllllllllllly need them… 😉
Alex, With gold, the 2nd DC is usually the most powerful. Is it the same with oil?
Hey Rob,
I’d have to look into that to answer with historical accuracy, and I would think that it depends on being in an uptrend or bear mkt.. You know how A 2nd daily cycle can top early ( R.T.) in a bear market?
However, if you think in terms of Elliot wave – and a 1-2-3-4-5 move out of the lows, the 2-3 move is usually the better move, and you could count the first leg up and the pullback as 1-2.
thank u for adding that ew…. ;o)
SuchAWealthOfKnowledge
Oh, the 1-2-3-4-5 thing? Its just something I picked up in Kindergarten with my A-B-Cs 😉
ahhh… yes .. back when you ate paste & clearly fell off the jungle gym & landed on your head….
*u prob still eat paste
Alright, alright! That’s me ringing the recess over bell!
he pulled my hair first…
ha ha ha
She threw paint and pulled my chair out from under me while I was drawing charts ( yes, I did that in kindergarten)
u drew charts?
*prob just boobie pictures
Why? Why do I bother? Why do I try? Anybody (but you know who)?
giggle..
ohhh chartfreak..uKnowIluvU & im jusJoshin …
Check out ‘SA’ ( And DRD, HMY, SBGL, etc) and let them know that the correction has started please.
SID has the type of set up & volume where it ‘Could’ break out soon.
I thought that it might fill that gap, but it acted as support today
Already up 7%
Inside of a consolidation
I really cant be sure that the a-b-c happened yet, on a zoomed in chart it does seem possible.
Anyway- this (refresh) is at least amusing 🙂
You buying?
I’m in it, but I got in today at $2.05
Sid could break out, with this volume increasing , and the GAP held as support during the consolidation,
.
Or it could further consolidate and fill that gap.
.
refresh- and click on the chart to enlarge
.
SO then I will sell it out of boredom : ) For a small profit in one of these bounces later
.
Go SUNE – LOL
well i mentioned it doesnt do things by half….
how long has it got left do you think?.. dangling over the cliff’s edge by its fingertips
Oil went green
Do you think the DCL is at hand??
How’s a big maybe : ) It is oversold enough and the timing is right.
It’s usually best to wait for a swing to be in place and a break of the 10sma is even better
Oil stocks may give the first clue, like Miners often do for Gold
Not sure if you watch $BPGDM, but it went positive today. amazing strength, but $BPENER turned down today.
I do , but I wasnt. MIners are really holding up well.
Too well. I only have partial positions in EXK and SA and they are not giving me the dip to add to.
I know, I’m being patient, but as time goes on it gets tougher . When we get the DCL, they do usually just kind of start dropping for no reason and sellers start running for the exits . We’ll see if we get that in the coming days / weeks.
SA may double top, but it looks like it really wants to break out .
I know! Come on back guys. Anywhere below 2.2 and I add to EXK. My sale on SA looks totally insane now with the recent price action.
oil inventory tomorrow AM may give final boost or at least clue-in direction. API suprise bullish tonight.