
Divisions
Thursday – 2 trading days left in the week. Again we have had another great week of trading, but how long will this last? Should I sell my positions? Lets do a quick market review and then discuss positions.
.
SPX – April 18 had the markets Bullishly moving higher.
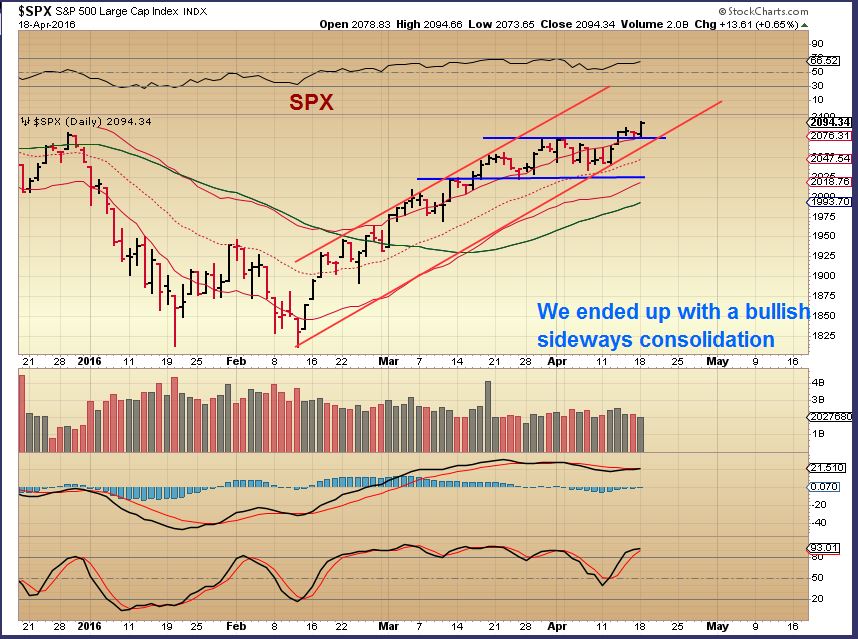
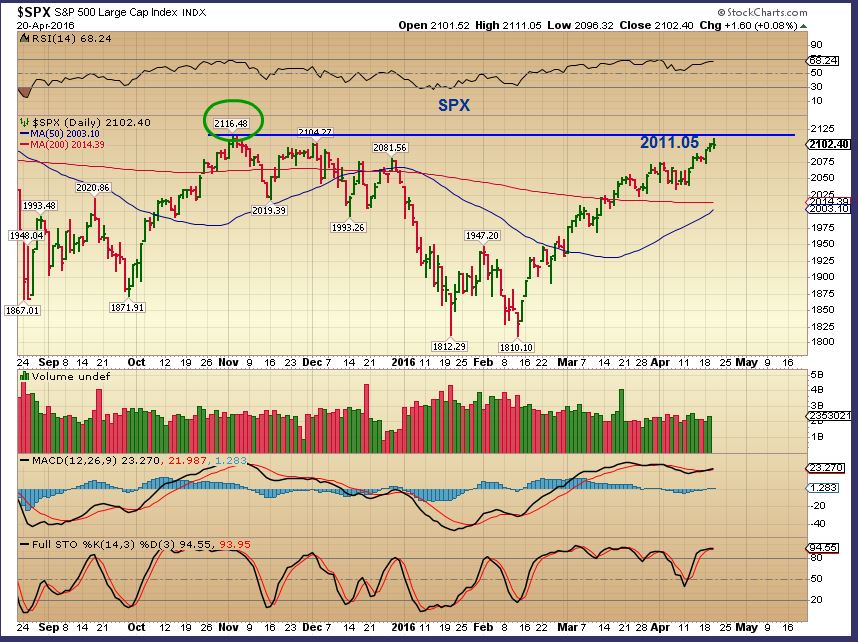
SPX April 20 – The SPX is almost at the November highs and remains bullishly aligned. This may be an area that gives resistance, or the shorts may pile in and be forced to cover if it breaks to new highs.
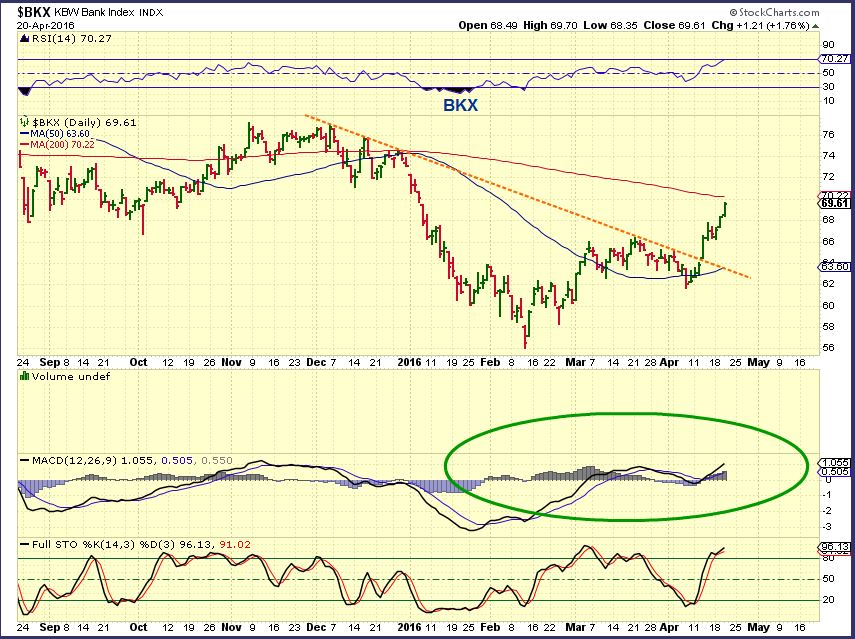
To gauge the health of this rally ( NOT fundamentals, there are cracks in the fundamentals) , I have discussed the importance of BANKING for the markets, and I showed that after crashing down, they were improving a lot. Are they still?
.
BKX– Very bullish surge higher. I also mentioned JPM, MS, GS, BAC, etc as BUYS because of this sectors strength. They are breaking out and moving higher too.
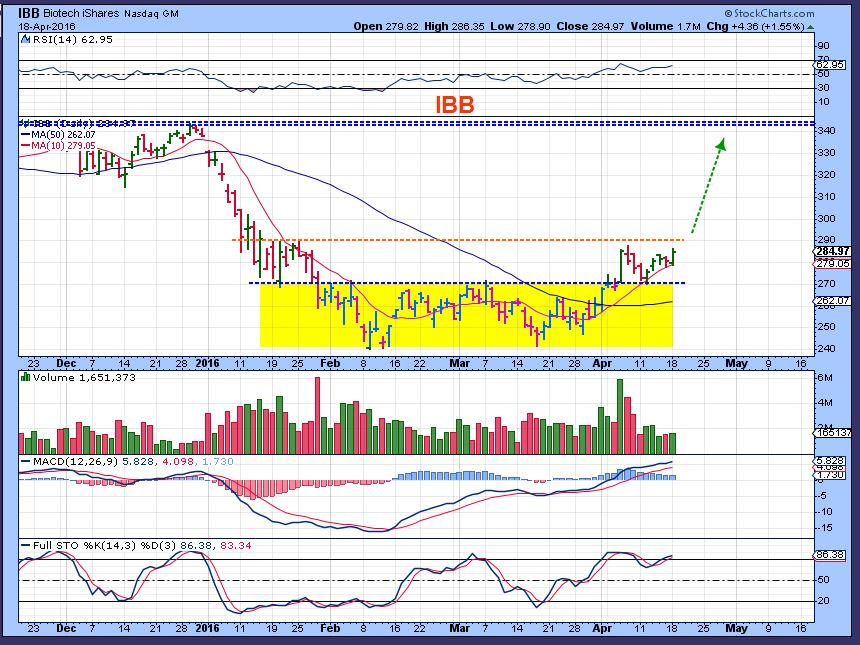
IBB – The IBB remains inside of this area above it’s base shown on the April 18 chart. It is fine above the 50 sma. I believe that it is setting up to break higher.
.
Lets get right to the area where most of our trading is OIL & COMMODITIES.
.
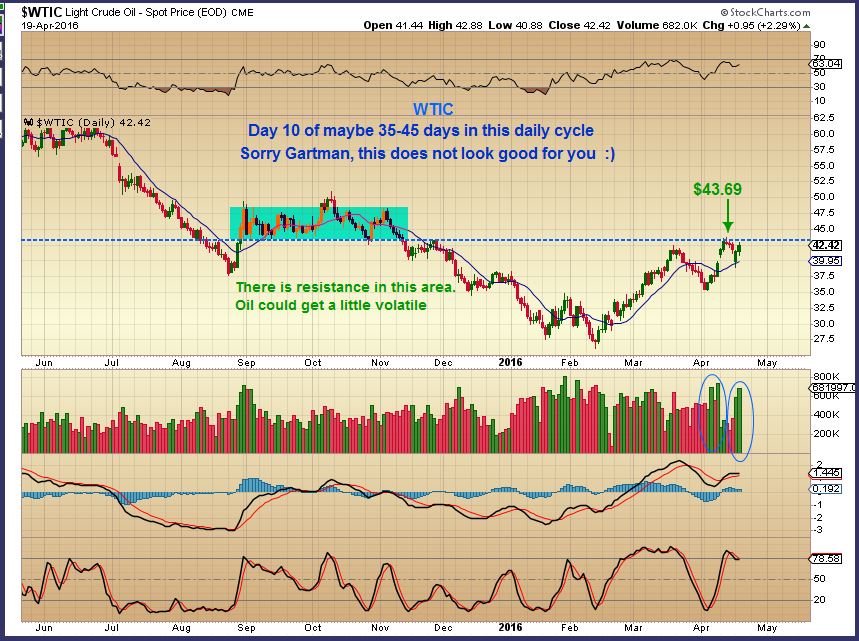
WTIC – Yesterdays chart shown here mentioned possible resistance, but this is a bullish set up ( and I wrote on the chart that this doesn’t look good for GARTMAN).
.
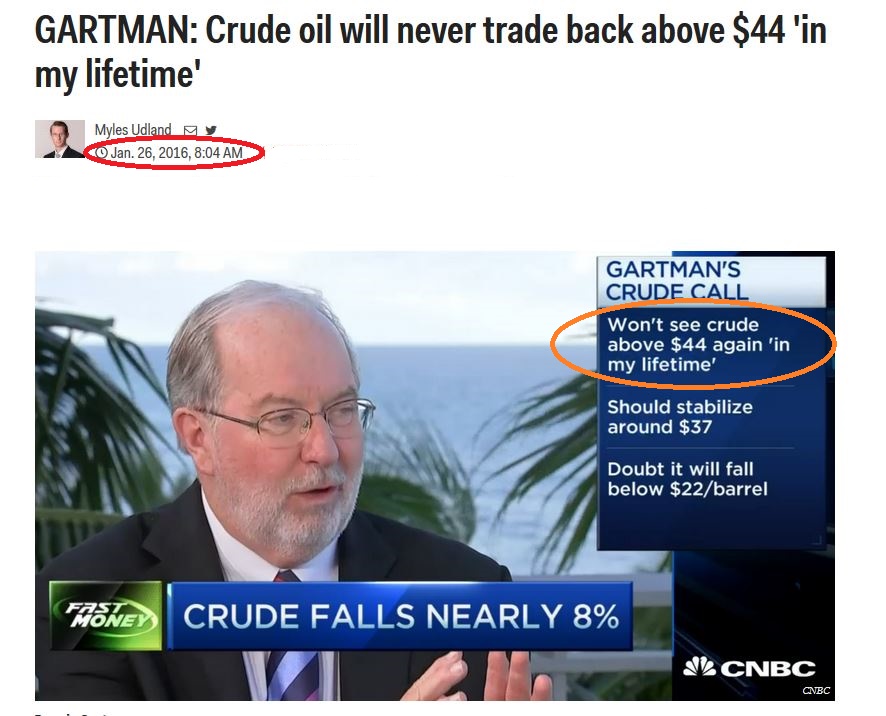
If you are new here, I have been calling for higher OIL prices, and showed that Dennis Gartman says that Oil will NOT trade above $44 during his lifetime. I kind of have a pet peeve with these dramatic – Emotional statements from people who think that they know-it-all and it can never be any different than they say it is. How embarrassing. We need to be humble and flexible or the markets can humble you quickly.
.
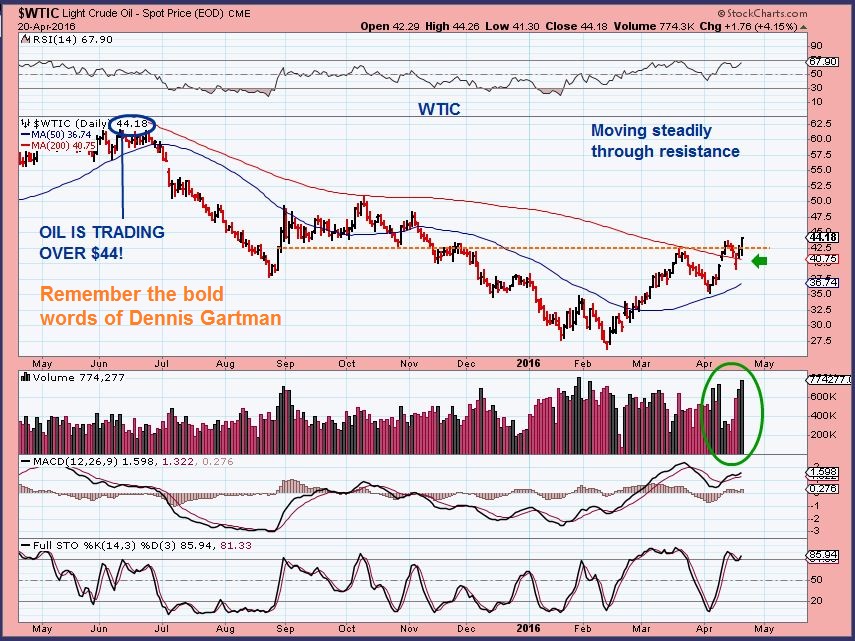
Today is a sad day for Dennis  , but happy day for us! WTIC is above $44 and resistance couldn’t even stop the advance.
  Now OIL trades above the 50sma and the 200sma.That is still a resistance area that Oil is working through.
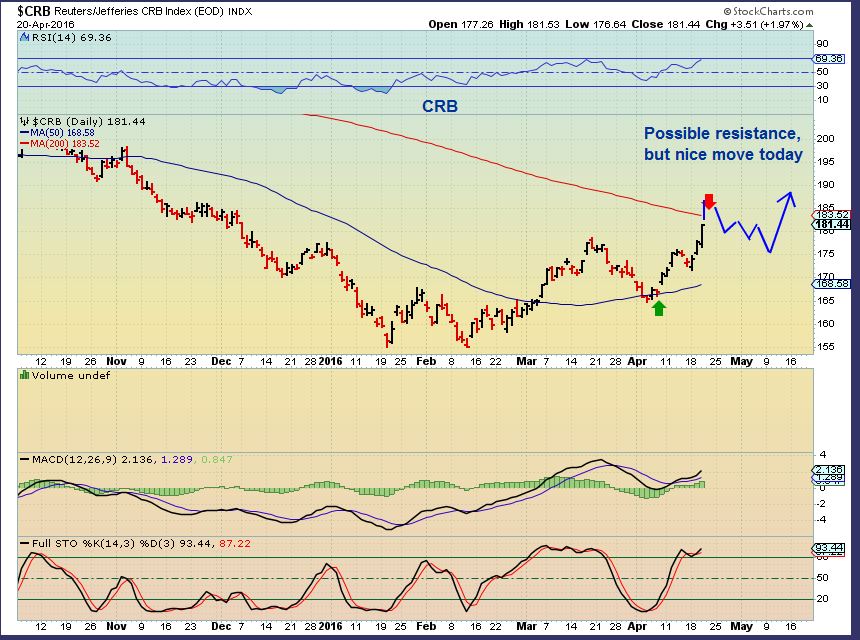
The CRB – The CRB is approaching the down-sloping 200sma. That has caused many commodities and energy stocks to run along underneath and go sideways, so I drew that in. The CRB may do the same, but individual Commodities may still move higher, while extended ones pull back.
.
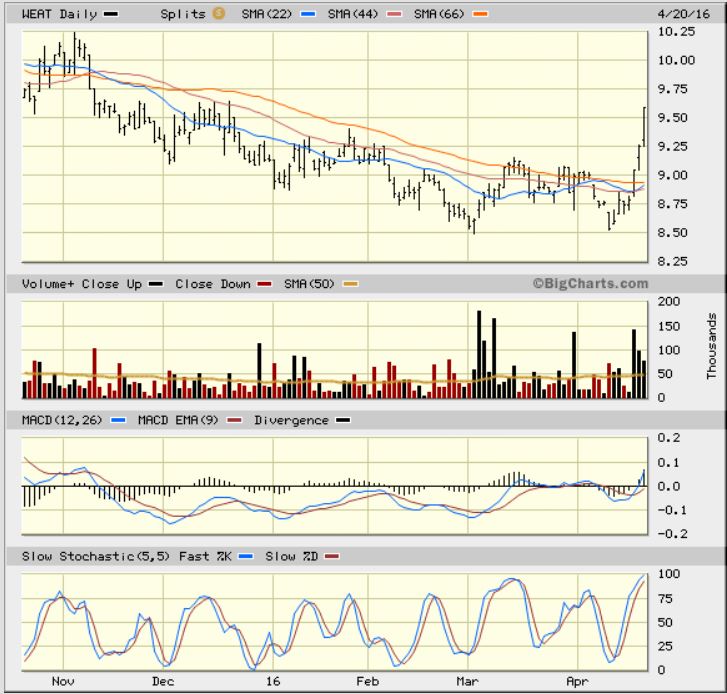
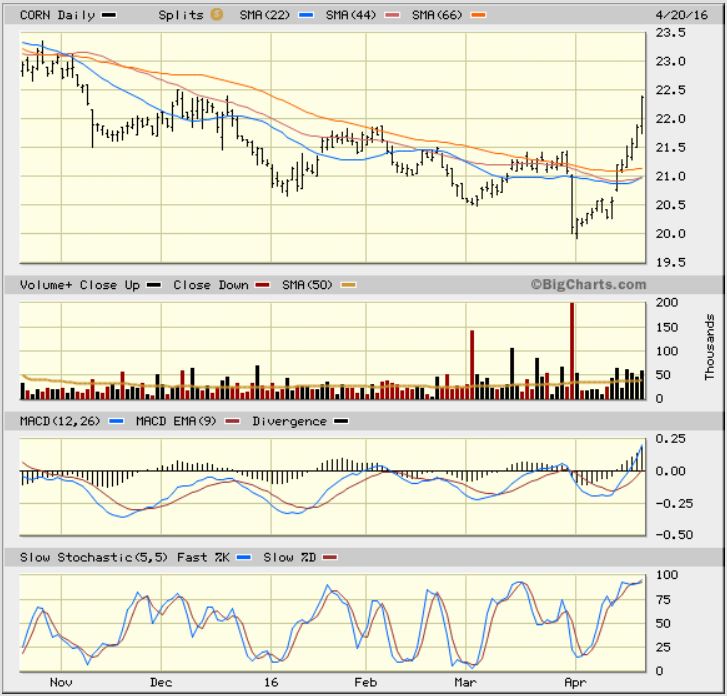
I mentioned a week or so ago that it looks like prices are going higher in your grocery store too. This is what has happened since then.
WEAT-
CORN
.
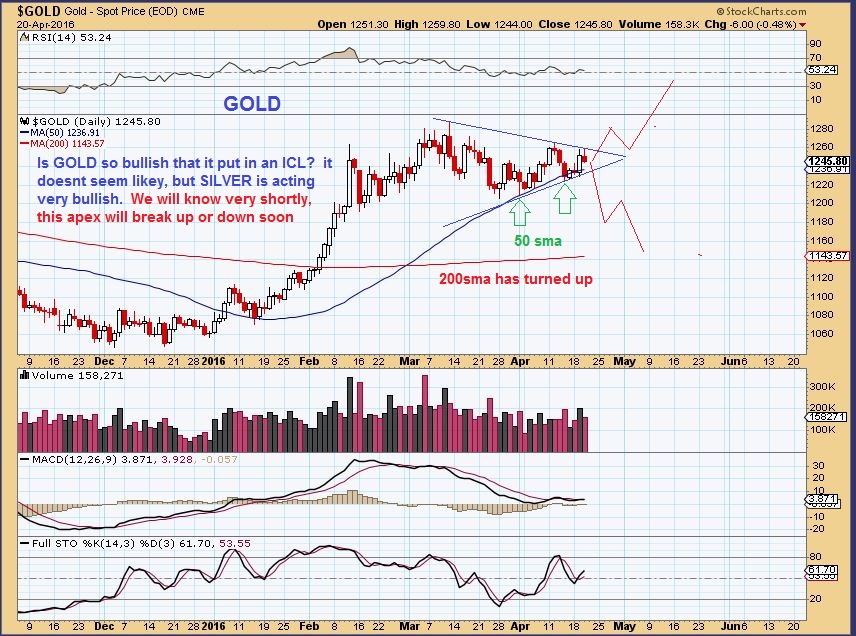
GOLD – If Gold breaks out above $1260, it is a bullish set up and looks like it wants to make a run higher. It could do a false break out, but Gold is no longer overbought.
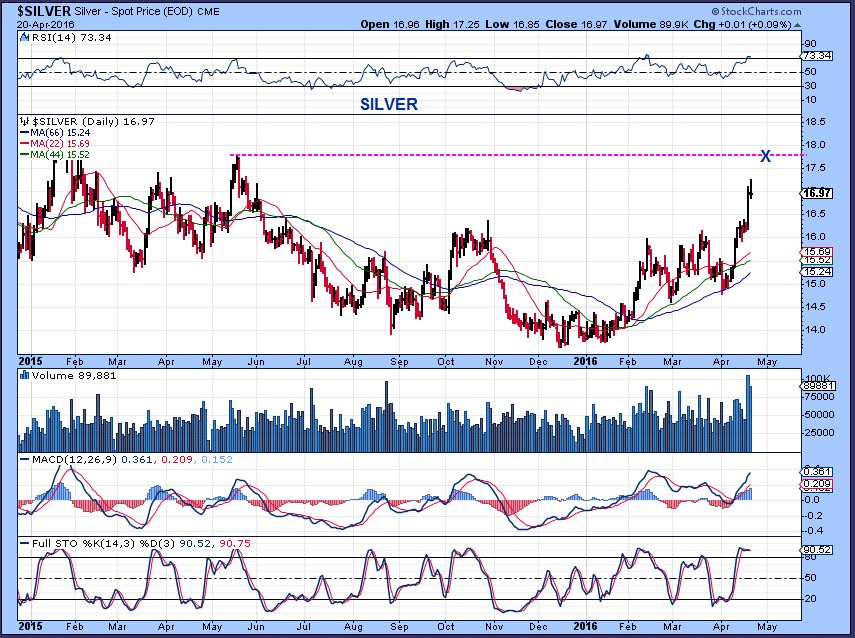
SILVER – I think that Silver wants to reach it’s May highs.
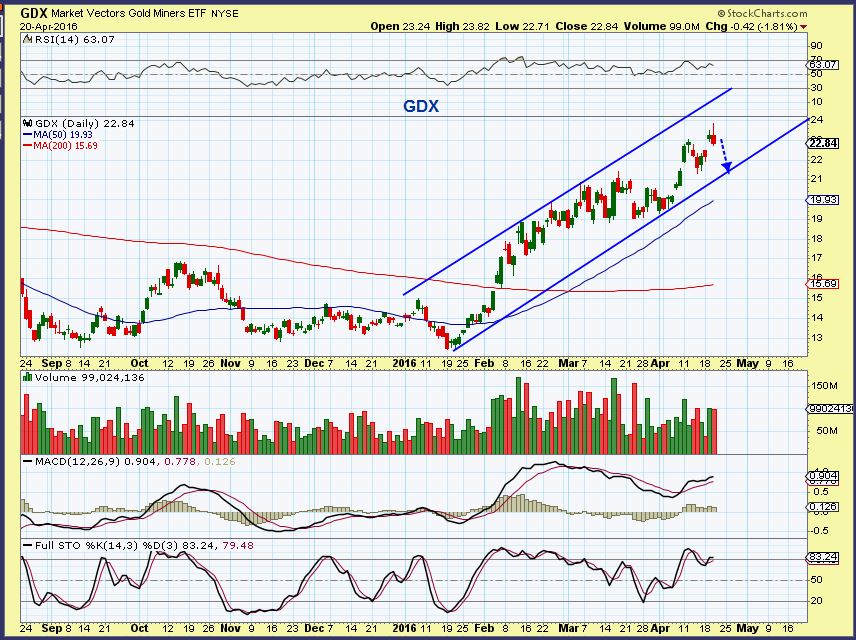
GDX – GDX didnt reach the top of this channel yet , but That looks like a reversal candle and MANY MINERS also looked to have reversals. We may finally get a pullback and this may hint that GOLD want s to pull back further too. At this point, this still looks strong, but a drop into a DCL would bring out the sellers. SO FAR, EVERY PULL BACK HAS BEEN BOUGHT.
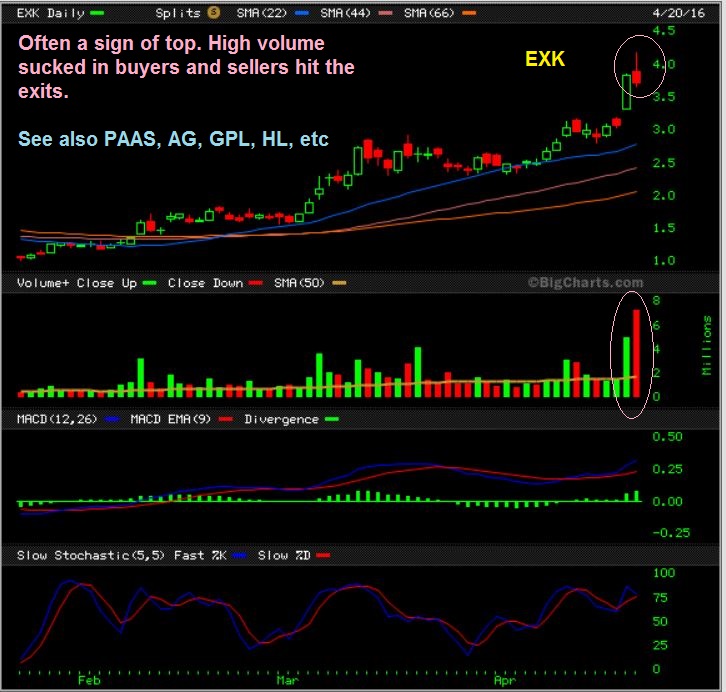
EXK – Many miners ended the day ( And likely their run) like this.
SIDE POINT ON GOLD– I have something set aside for the weekend report that will help us to gauge the coming drop in Gold better, if we get one : )
.
NOW LETS DISCUSS OUR POSITIONS
.
Almost all of the Energy and Commodity stocks ( And Miners too) have been running really strongly. OIL is still early in its daily cycle-timing, so whether it goes sideways at resistance or moves up towards the $50 area, I think we have many Bullish stock set ups that will continue to play out.
.
EBB & FLOW
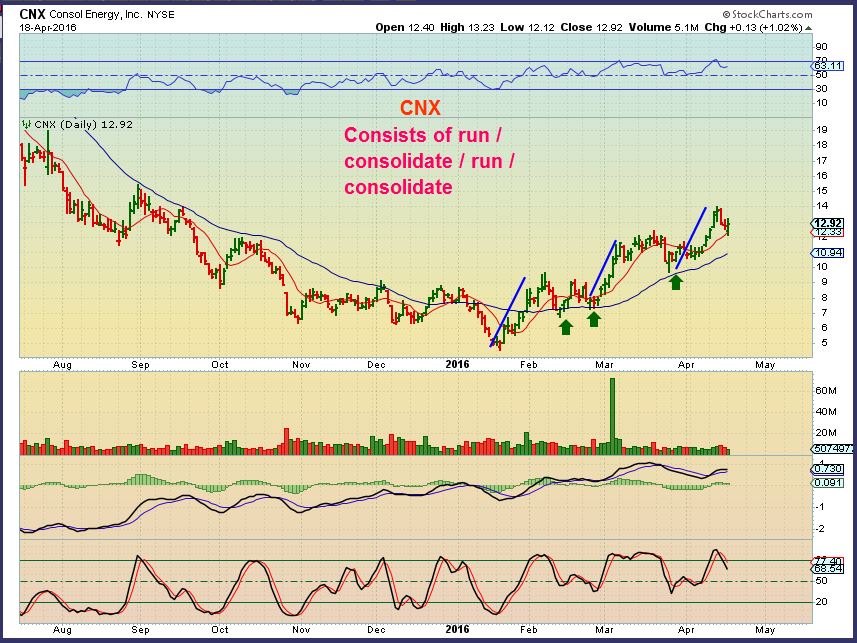
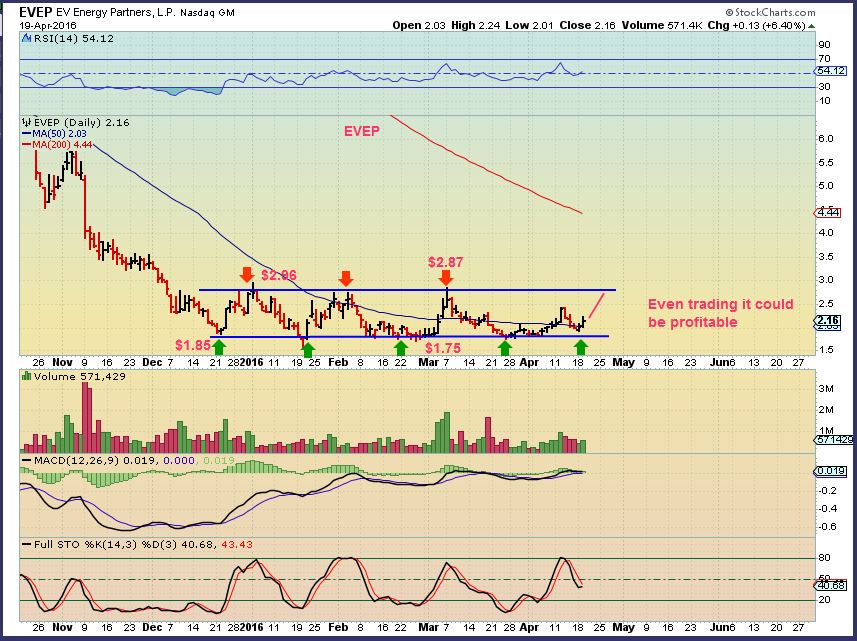
I’m showing this chart again to point out that these runs are not straight up. Look at this company. This has tripled from the lows, yet look at it closely. In Feb it went sideways for 2 weeks. In March it went sideways for 2 weeks. Your stocks may do nothing or go red one day and others are up 7-15%, it doesn’t mean “There is something wrong with my stock.”
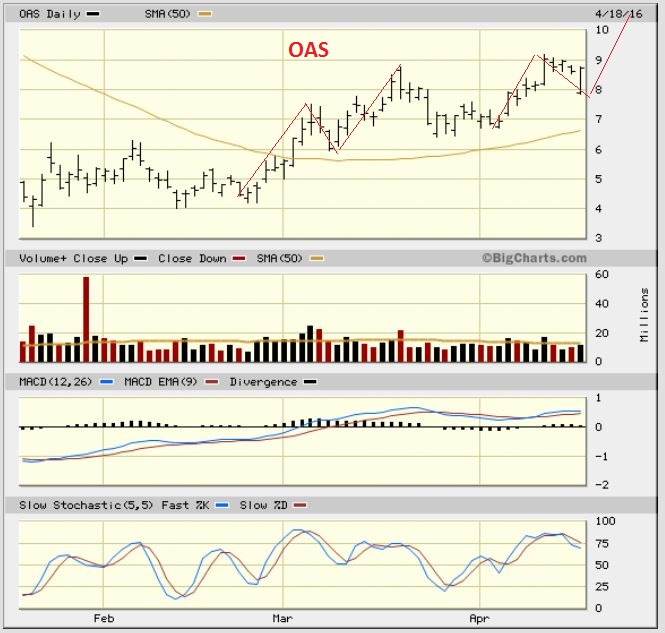
This was OAS – It is $9.34 today and it is still bullish. It only gained 1.9% yesterday and a friend of mine was ‘worried’ about it. That is a beautiful chart.
LOOK BACK at yesterdays report, I had MANY set ups that are breaking out , but can still be good entries. These charts are from yesterday , for example:
EVEP – jumped 7% yesterday to $2.33, still looks like a good entry
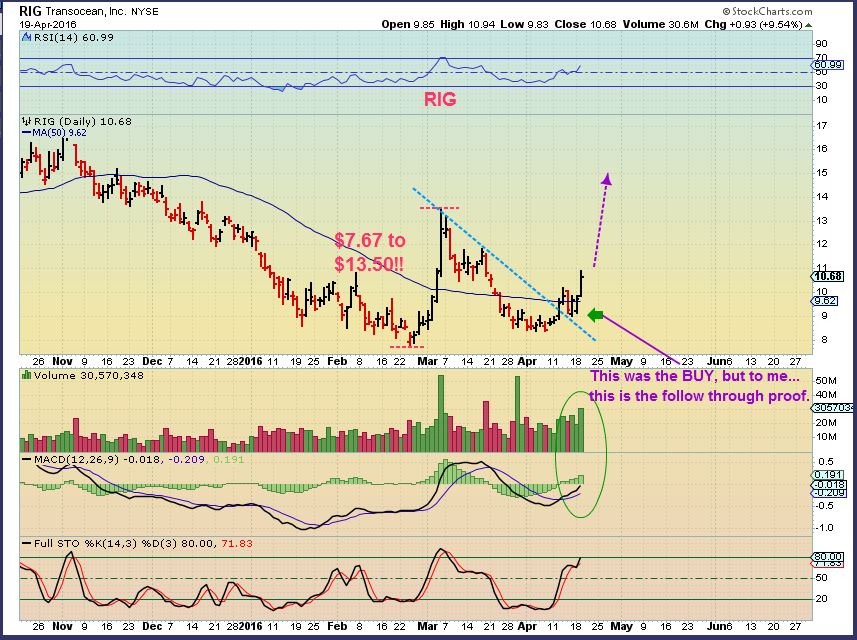
RIG- This only moved up 8 cents, but looks bullish with good potential upside.
So with yesterdays list still valid, I will give you several more that look possibly ready to join the run.
.
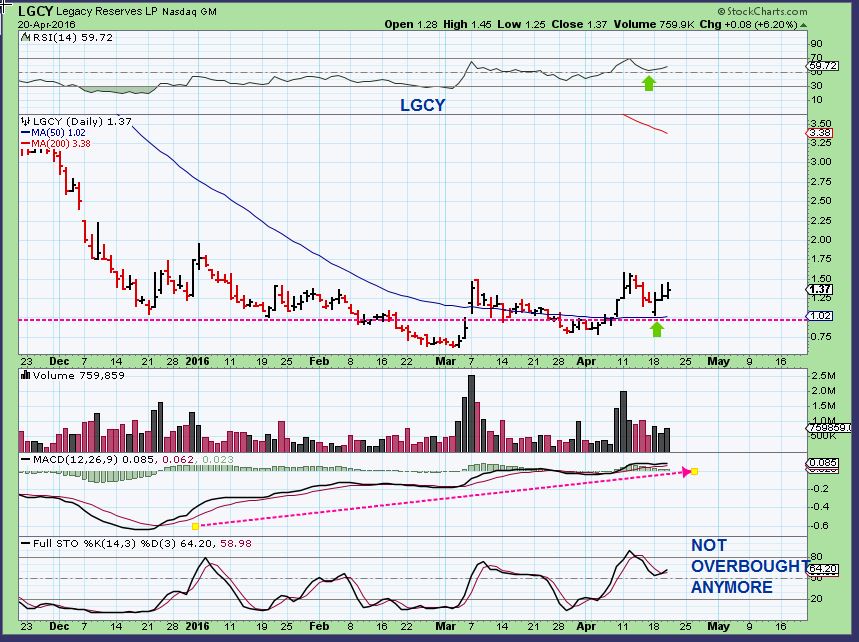
LGCY – Still bullishly set up. I don’t like to ‘pump’ this one too much for 2 reasons. I own it and don’t want to look like I’m promoting my stock, and also it swings like a monkey in a tree. It can be difficult to ride, but the gains can outweigh the pains in my opinion.
This could always break out from the base & run to the 200sma like many others have. 200% from the 50sma to the 200sma.
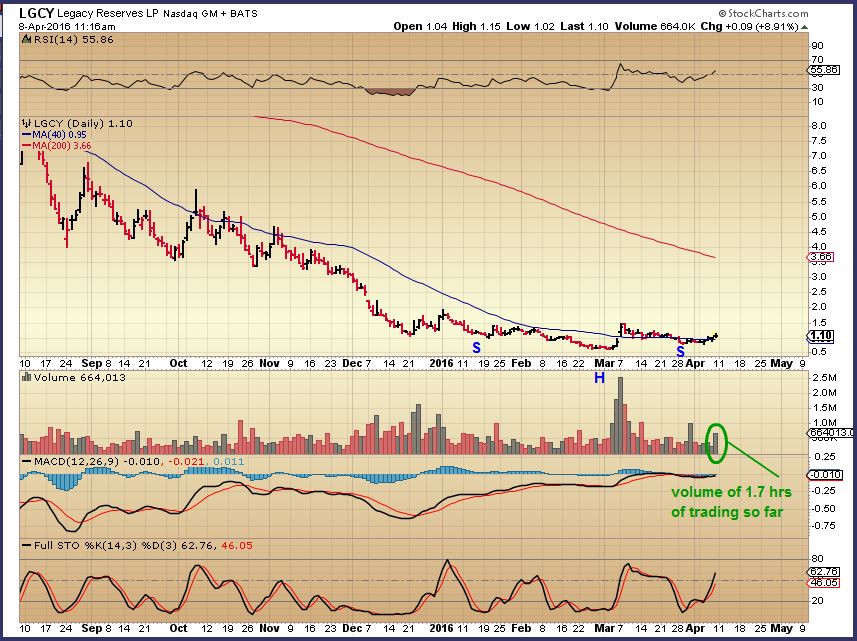
My April 8 recommendation shows a bigger pic view
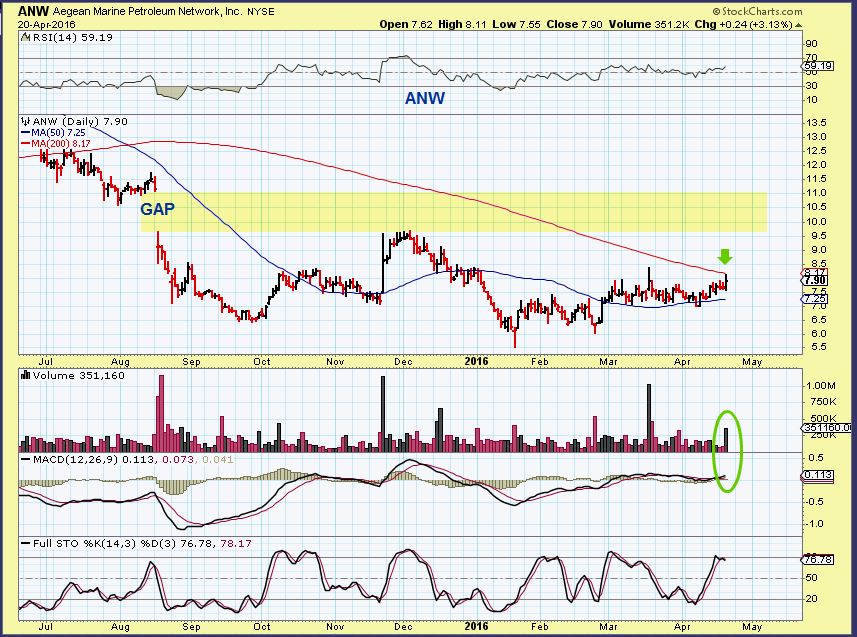
ANW – Ready to break out & run? A pullback to the 50sma could be bought at the 50 with a tight stop, or a break above the 200sma could be bought ( maybe a close above)
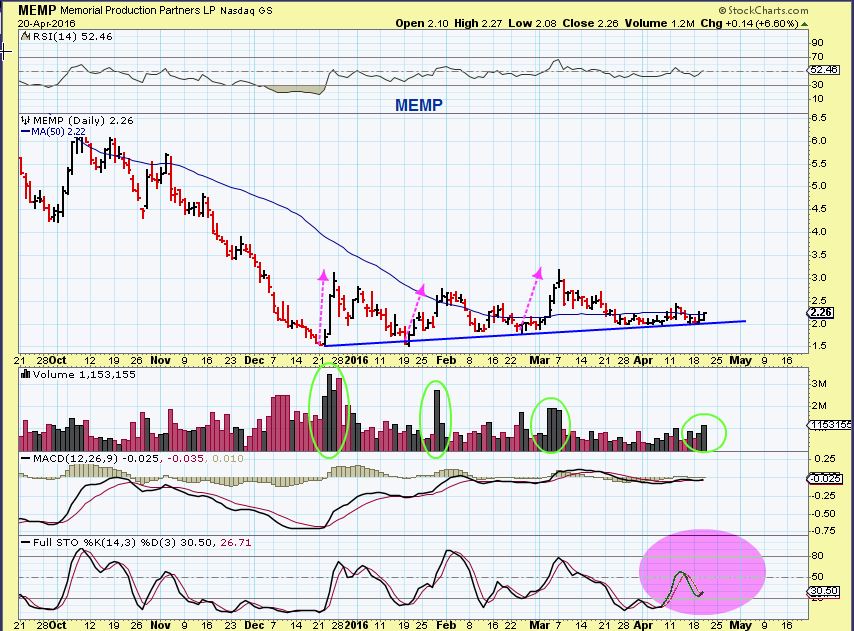
MEMP – I’ve been watching this. It is climbing along ( Like PQ) making higher lows. Its a lower risk entry here, because your stop is below the blue line.
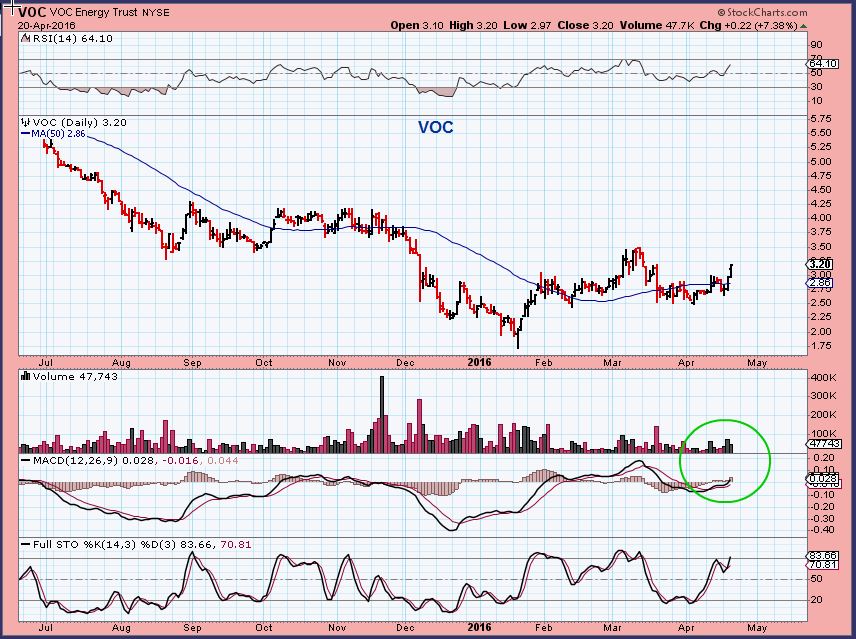
VOC – The RSI is above 50% , this one has been a bit sideways after the initial run off of the lows.
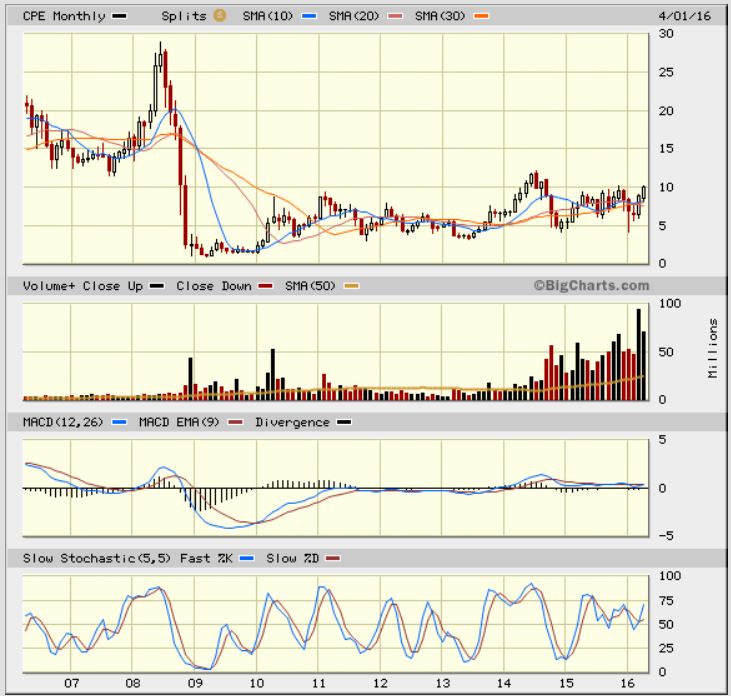
CPE – I recommended CPE at $6 on a break from the down trend line. It had a surge of volume yesterday as though it wants to break out from something big. Is it?
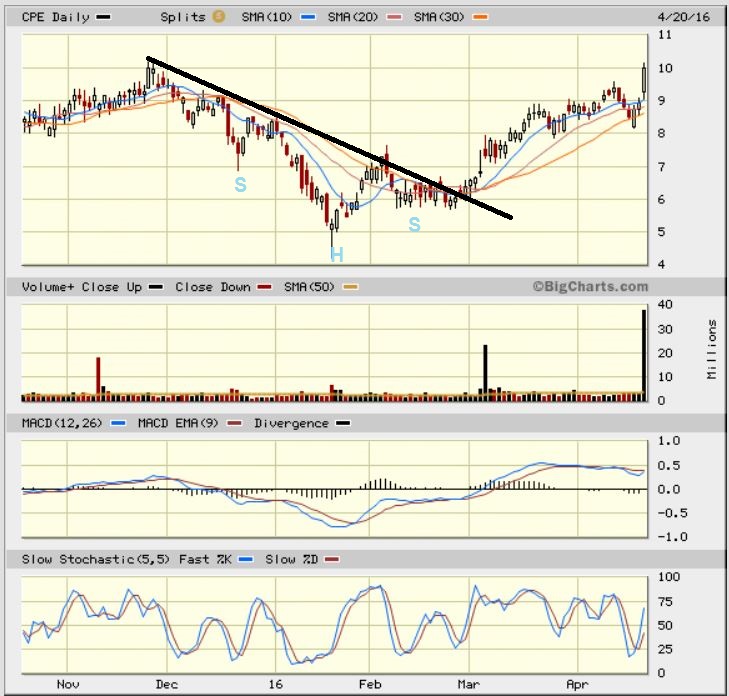
CPE MONTHLY– I think it is. THIS IS A 7 YEAR BASE! If this company recovers, it looks like it wants to run from $10 to $30 , and over $10 allows certain funds to buy it that may have restrictions. Some FUNDS cannot buy stocks under $10. I am keeping an eye on this one too.
2 companies by request –
Hey SABIN! I left the chat/comments section mid day yesterday and didnt see your request until late.
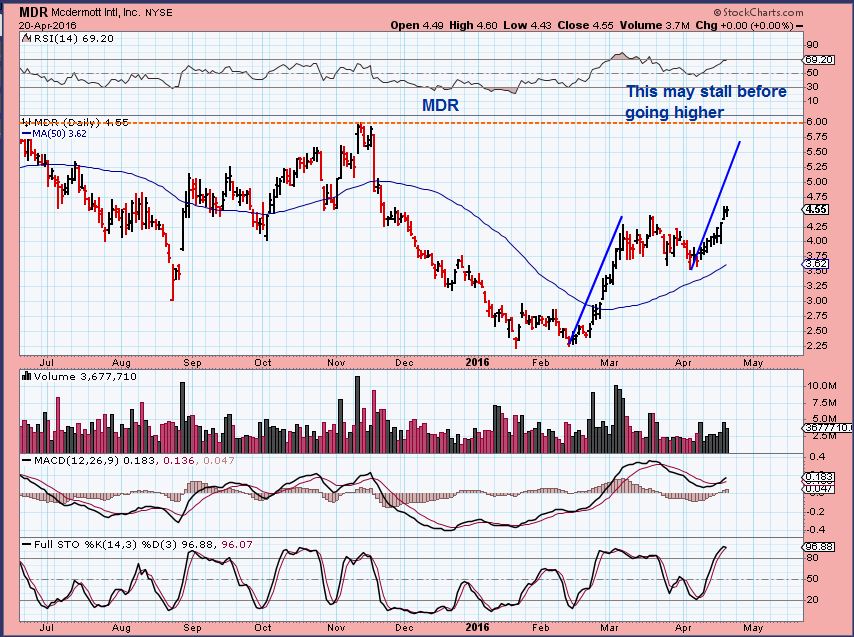
MDR and EMES were both mentioned here already. lets review & update .
MDR – It still looks like it wants to run higher, as far as $6, but I would like to see more volume pushing it along. Volume may come in as it has in the past. This may stall since it is breaking out from this multi week consolidation with average volume.
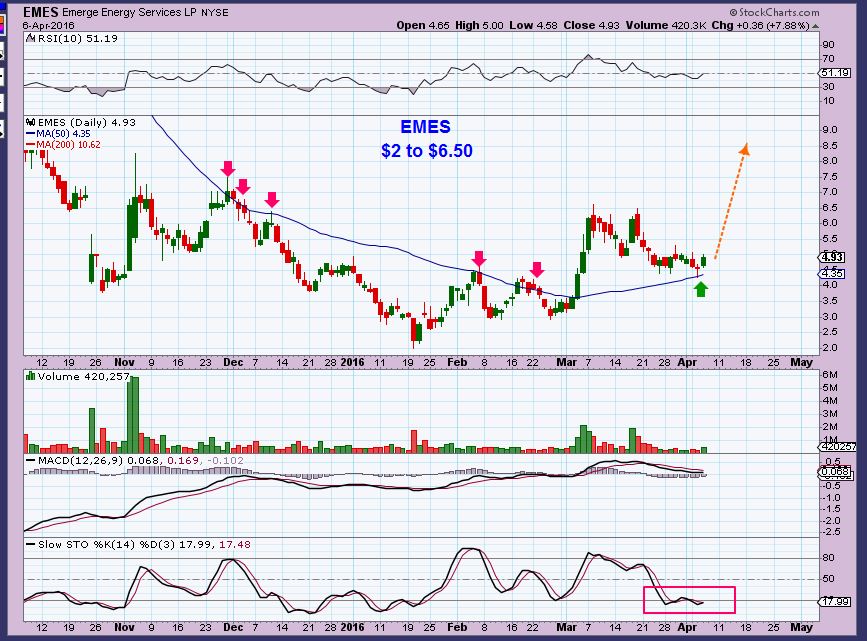
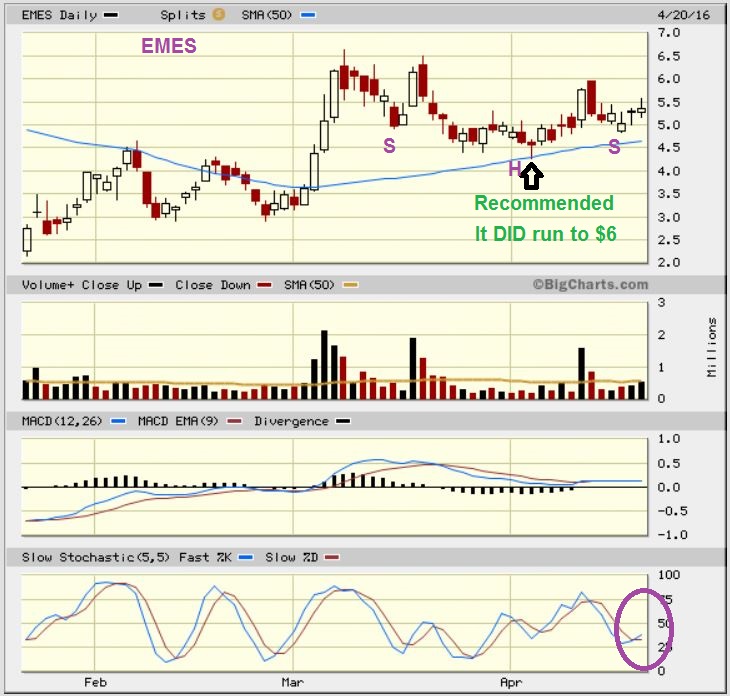
EMES – April 6th I used these 2 charts for EMES. It had a nice run and was a LOW RISK BUY at the 50SMA support, put your stop there..
I then showed this Long Base to show the upside potential if this gets going.
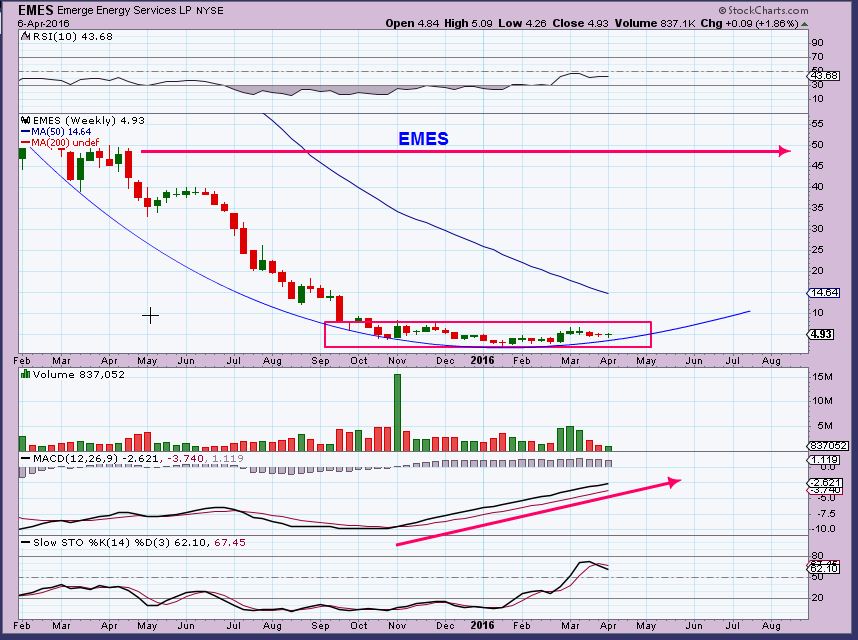
EMES – Emes has popped and dropped , bumping along this base, but at $5.35 , it is only $0.47 cents higher that the above chart. Is something wrong?
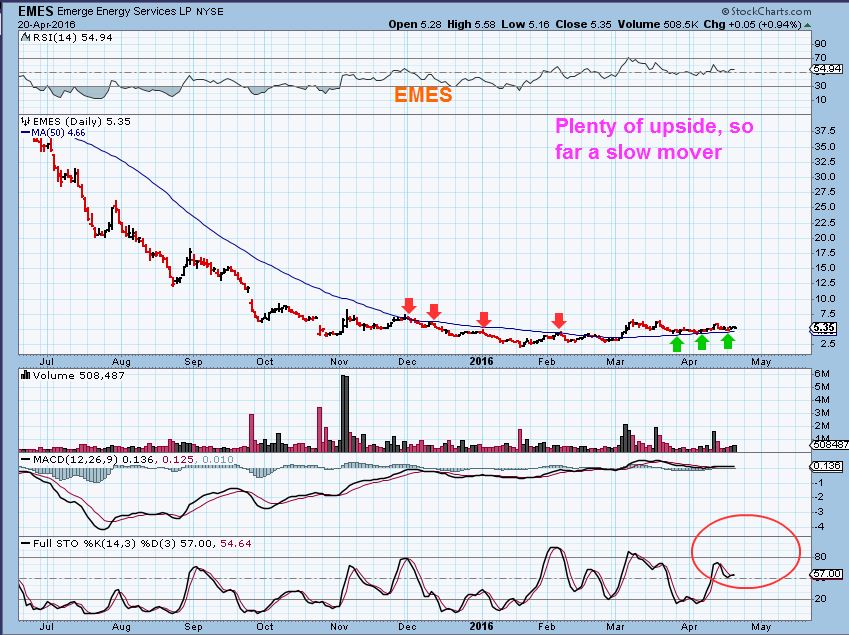
CLOSER LOOK – This actually ran from $4.35 to $6 and has pulled back. This looks bullish and could make a stronger move higher soon. I see an inverse H&S. IF YOU CAN WITHSTAND more sideways action , you could buy here with a stop under the 50sma, or buy a break out.
As I write, GOLD is at $1260 🙂
I dont usually have Friday reports. ( Except for the last 15 Fridays) 
When I started this service, I was going to do a weekend report to cover Monday, and then do a Tues, Wed, Thurs report, Friday as necessary. On Thursday morning I write what I think will move the markets and be valid for Thursday and Friday and then just cover the weeks activity and future thoughts in the weekend report. The markets have been so active and profitable lately, that I have written a small report every Friday for weeks now. I do not PLAN on writing a report tomorrow, this report & trade ideas and yesterdays trade set ups should still be enough activity for us to use for the last 2 days of this week. IF something exciting happens (Gold?), I will see you in a brief report tomorrow
.
Thanks for being a chartfreak!
.
~ALEX


Hi Alex. Am I right in thinking that $HUI (and GDX) is on week 13 of this IC and that they normally last between 19 and 23 weeks? That would mean this is already confirming as right translated and we are unlikely to see the ICL low before end of May.
Yes and theoretically .
I remember when daily cycles lengths were supposed to be 21-26 days in length, and suddenly things were so bullish that we had a couple of 14 days daily cycles.
Good work big man!!
Thanks Peter 🙂
Yea…what he said big man..
I was gonna say tarzan tho… giggle.
*bcei..be still my heart…
BCEI – The gap fill today will hurt if I watch it, but it has 2 million in the first 15 minutes. Now THAT is what I’m talking about for trying to break above a former high (March high).
Szym…hmm
I like that set up, but I have issues with such light volume rises.
I think that the ECB Decision may have lit some dynamite
I know I have seen charts for CHK in past write ups, but it appears to have just completed the backtest of the inverse head & shoulders. Seems to have plenty of room to run.
DAVE – Nice to see you here again
I my finger on the trigger for UWTI after inventory yesterday and didn’t do it. Dang. Gold is just flat killing me. Come on, let’s get this done. In the past an afternoon bear raid like that would have smacked gold down $30. Smart money COT short is crazy high; they’ve lost control.
RIP….Dennis Gartman. 🙂
Thanks Robert, nice work as always! The service is definitely worth the price. I’m eyeing CRK by the way because the fundamentals may be better than I thought.
Hey Thomas, Thanks, it’s a lot of work, but I love it too.
I was watching CRK too.
It is at the lows, and stochastics is oversold. This was one that I was looking at along with BCEI, and I took the BCEI trade instead, since it had stronger signs of life. If CRK gets above the 50sma, that may draw in more buyers.
OUT OF THE GATE – THESE COULD CHANGE…
BCEI – up 20% again. I really hope someone took this trade 2 days ago with me.
BAA and LGCY also adding on to gains.
BAS – Looking good
AREX Breaking out ( SXE UP AGAIN 🙂
NCQ (Nova Golds copper company in yesterdays report) – I like the company, hate the volume, but it is also moving higher
I took bcei
Great- It has really strong volume today, so the follow through is bullish. 🙂
Alex, i am in AREX, LGCY, REXX, PACD for some time. Recently in BAC ($13.77). Can you please help to cover the “Core positions” for metals. So that we will ready for the grab if we get the chance.
PACD just got a downgrade!
Hi Siva,
When I discuss ‘Core’ positions, I’m mostly talking about past reports when I mentioned starting core positions already. I showed a lot of Miners that already had put there lows in yrs ago ( LSG, BAA, NG, RIC, etc) .
So when we were Buying Miners in Jan and Feb, I had discussed selling partial positions on the way up and maybe holding some as a core or to sell if we went higher.
Some also have 2 trading accounts ( retirement, etc) and hold core there
If you do not currently own any Miners, you’ll have to add on pullbacks.
thanks Alex for timely updates. Currently i don’t have any miners (except HL, XRA). planning to start a core position slowly during pullback.
big silver swing.. is that a top for PMs now?
WATCH BAS TAKE OFF FROM HERE
One comment for BAS. “Ahhhh…!!!!!” (frustrated yell)
SRPT – biotech down 40% can we get in?
personally , I wouldnt touch that for quite a while.
good thanks for your guidance. I am following your IBB chart and already in LABU quite sometime.
Good – I traded a few biotechs recently, but Biotech is much safer with an ETF.
Ya, I got caught in that. Nice gains all wiped out. Have to hold now.
I replied to Siva above. I’d sell as soon as you even potentially see a window. I didn’t want to take the loss year but I did. It went from $3.50 down to $1 so while it was bad, it never went back again. Ever.
NO! Stay away. Seriously. Once a bio-tech loses or fails a trial, it’s over. It’s just dead money. Pull up a 1yr. chart of CLDN – it never recovered and now it bops at $1 doing nothing. I ate that sh*t sandwich last year. I don’t purchase individual pre-approval bios anymore. If I want a completely binary bet, I’ll just play roulette.
CF, thanks for the IBB chart…..LABU….maybe getting ready for another run to 39 in a day or two?…kind of a sleeper here just like before?
Yes, maybe even higher. The IBB is in a consolidation above a base. Its boring at times like this ( Like CLF & VALE, etc) but if they do break higher, its worth it.
IBB still looks good, just boring.
Where has Maria been? I have missed her
She has commented further down if you sort this page by newest
….
… here I am :o)
Hahaha! Love this!
Cute.
..just letting my winners run…. ;o)
hope all is well with you Eddy…
Using today’s pop on PQ to double positions from yesterday and set a mental break-even stop. It’s how I like to take larger positions on risky things and keep my sanity. Thanks (again) for the tip!
As of this morning – Dennis Gartman goes with his gut for 2 long plays…….and they are Gold and AA……hmmmm
https://finance.yahoo.com/news/dennis-gartman-goes-gut-2-123323601.html
Crap – No wonder it went red : ) lol
Maybe he’s a CF subscriber? 🙂
Any news on HERO today that it’s getting smoked??
No , Haven’t seen any, but that sure is a big drop.
It’s close to the 200 period in the 1hr chart , but that drop looks to have broken that uptrend. I was having a fine week until HERO showed up in my life!!!!
Alex————This sounds quite intriguing:
SIDE POINT ON GOLD– I
have something set aside for the weekend report that will help us to
gauge the coming drop in Gold better, if we get one : )
Can’t wait!
Hey Rube – Well, let me downplay it a bit. it’s not really mind blowing info, but it is information that should be considered at this point : )
Looks like that Mid Day dip that I often see in my stocks that took off like rockets at the open.
Now I get to see if they go red and close down , or just close a gap & reverse higher.
Lately, They have rebounded
Oil chart looks like maybe an inverse head and shoulders….from about mid March…..if that is the case (and who knows if I’m right or not….still learning…) – then could $50 be a potential target when it makes a good break from the neckline?
I am selling my fisrt entry of HBM , just to lock in some profit until I see how this settles out.
I’m looking at some of these miners, and I know that cycles call for a dip, but they are acting so well, it is unbelievable
fyi sog…shaved off a good portion of my PQ… kept a little for a little somethin somethin….
hah.. me too M.. sold up at 0.85 🙂
it looked peaky.
also thought it might pullback around the 30/34 weekly ema (see 2009 coming of the lows) .
could carry on higher, but there’s other CF picks to consider
I’m still fully in energy. No selling yet!
BCEI – Gap fill ? : ) HUGE volume. i want to add to my position, someone please stop me – lol
The A-B-C-D actually reached its target, so it may consolidate before moving higher. Or Move back to todays highs and Flag up there. Or Overshoot the target . or ——- You get the idea
Its tough to call in the middle of a move
Famous words by Mike Tyson: “Everyone has a plan, until they get hit in the face”. That was HERO for me today!
Man, Massive volume already and it is still dropping.
It doesn’t look like it gapped down, I hope you had a stop?
That is a rhetorical question – do not answer that. I have had mental stops that didnt trigger in my past.
No stop. Some of these speculative stocks I just let’em run & correct, if I think they have further upside. I was looking for a correction before a move higher towards $6, but this isn’t a correction though. I don’t know what the heck happenned there today, but sold out and took my @$$ whooping like a man. That chart was looking good though. I tried finding some news on it but can’t find anything of real importance. Man, had it not been for HERO today, I would’ve had a great week. Might have to order water with lemon tomorrow for dinner instead of a couple Stellas. BUT…. week ain’t over yet!! Might still do good with the positions I have.
That chart was one of my favorites, but I missed it and was hoping for a pull back.
I think I’ll pass – I cant find news on it either yet. If its insider selling, someone knows something
maybe finding support at the confluent 34 & 65 emas.
34 held last month
I have SRPT today! Same boat, different oar!
We’re in it together Bill.
Doesnt that mean that you both have a paddle? ROW!
.
Sorry, I couldnt pass on that
Paddles yes, rutters no!
*keep your day job
XON was down 27% today as well. But IBB ended green. LABU sucked compared to IBB – huge penalty on the 3x etf today.
Hero is a big drop, but if you got in 5 days ago, its break even.
I hope you got in 6 days ago & just gave those great gains back . Its less painful
Did not. Bought the big day up. Ouch… but, I’ve been through worse! I’ll live… 😉 It did wipe out a large part.of my profits this week, but it could be worse.
I analyzed the chart the other day, I even posted it, and liked the b/out, although I thought it could pull back. I was actually planning on keeping it towards near the end of the oil cycle, so I was ready to add on a pullback. Then today happenned!! Chart looked good!! Again, don’t know what the heck went on there today… see the volume dumped on that thing??? If this is a shakeout, that is THE MOTHER OF ALL SHAKEOUTS!!! But that’s where learning to play defense comes in. No matter how much I like a chart, it gets the same % of my portfolio as the rest. Only after it clears a major weekly ma do I add, and even then, only double my position. No more. Let’s see what kind of surprises tomorrow brings!
thats a bummer.
i’ve learned myself, never to buy more than $1500 of a single stock …( etfs maybe more).. when the price is below the weekly 34ema.
Trust me SOG, i look at the same stuff. But part of being succesful at this is keeping emotions in check. Bottom line: i was on a strong roll, and I got into a name that I thought would keep the party going. I got a bit greedy. There WAS a b/out on the chart, but, b/outs can fail, like today. I do buy a little bigger, but it’s still a small % of my account, so although it hurt, it doesn’t kill me. Nobody likes to have a position go down like that, but it’s part of being a speculator. Day’s over! Let’s see how the week closes out.
That sucks! That is why I am staying with higher priced right now. EXXI? BBEP? NO! REXX is a maybe.
It does. More than that, it kinda destabilized me a little. It is a reminder though that I really need to trust myself more. Not to double guess that trade, but the risk reward in that entry was not the best. And I’m being too *active* and that’s not me. I like to buy above a certain clean break, a line in the sand, and hold as long as everything is behaving as I thought. I dont like *trading* in & out. But truth is I got too excited with the profits I was running, and got stretched too far. It’s tempting to *trade* all these charts because they all look good, but it’s impossible. So I just need to listen to a little yoga music and clear my mind!!! I have my eye on a couple of moves tomorrow, only depending how the weekly charts shape up. ERX, AA, GDXJ, CENX, just to name a few, are working on big weekly b/outs. XBI working on a daily b/out, UNG also. But I need to take some time over the weekend to regain my focus.
Don’t beat yourself up too much, it does happen. I missed metals in Jan after waiting 4 years for the best to end. That was pretty awesome. 🙁
Good morning Cason! Not beating myself up because of that particular trade. More so because I’ve been overtrading. Thats what i have an issue with. But I know what I have to do though. It’ll be alright. I’ll share a little more with you later!! At the gym now getting my mind focused again!! 🙂
I over-traded last summer, early fall after rocking it earlier in the year. Really took a hard look and revised my trading plan, going much better since then. Plus CF’s been en fuego recently.
VALE Reached its measured ‘D’ move yesterday
.
Any idea of a re-entrance target price to keep on the watchlist?
Hi Chad,
Depends on time-frame & might depend on the CRB cycles, but anywhere below $5 will pay off eventually.
I may start with a small position at first and add to it. I’l cover it in future reports
Oops. Still have it. I’m with Chad, when do I buy more. 🙂 10 day is only 18 cents lower, 20 a full $.75 I’ll bale before we hit the 50-day
any thoughts on ziop here?
If I owned it, I’d sell, if I was looking to buy, I’d wait.
I’ll grab a chart and show you why
It has been a decent run, but notice that was climbing the 9sma nicely on the first run up almost $4.50 to $10. & the 2nd run up it also held the 10sma ( except 1 day intraday) .
Now this run $7 to $9 It looks like it doesnt want to break above the March highs, the MACD is riolling and the 10sma has been lost.
.
To be safe I would lock in price just in case it wants to keep selling off. Volume is a tad heavy here. You could wait & see if it closes below the 10, since it didnt last time, but it has heavy vol.
.
ty..hate when good setups fail but better to buy it back hiogher if needed. ty
Me too, And much better to get out before a drop than after if that is whats going to happen here.
I’m leaving for the day – I will have a short short report tomorrow morning. Have a good day all!
Very nice Alex that you are willing to do this tomorrow morning again.
Have a great evening.
16 Friday’s in a row!
Crude Oil WTIC predictions? I see WTIC on the 2nd leg of a AB=CD pattern which puts the end point at $45.03. I am not a wave guy, but if C wave is supposed to be 1.618% of wave A then I could see us going to $49.67. Looks like we are on day 12 of the cycle that goes 30-50 days. Any other thoughts? refresh for chart
Nice use of harmonics!!
Nice chart! I am in several oil plays so I appreciate seeing your views.
More. More! I went long USO today. Yeah, maybe late to that game, but I’ve been in suggested energy names this whole time.
Tons of put buying and call selling today. Not liking that at all…
What sector
In big names… can’t give u specific sectors right now though. I’ll post some of the names later.
Bill, how can I share some info with you privately?
Are you on TradingView.com?
No. Are u on twitter??
Yes, wchowe! Don’t use it much
Got it Bill. I’ll shoot you an email a little later.
Or I can give you my email so you can send me an email back and yours stays private.
Bhowe@charter. Net
Bill, is that a paid service? I need to up my charting game, but don’t want to pay out the wazoo. I am on ST but by the time I read through Maria’s 99 gifs at nite I’m too tired to post anymore anywhere else.
No, free website. Stock charts.
… Et tu, Brute??
*can’t live with me .. can’t live without me ;o) https://uploads.disquscdn.com/images/18880db18115430e208747aa557ea69ef3e35d136abd39e63199843f2ef52dda.jpg
I got Trade Station recently but did not open the “brokerage acct.” my beloved optionsXpress acct. since 1999 i use. but for r/t i pay $285 a month plus $170 for my local area’s 250Mbps top tier internet only, no cable tv nor phone nor home monitoring lol. vintage 2008 sony dual-core laptop i am impressed with. i have 3 ext. displays connected, 1 hdmi and 2 usb3-to-dvi via “express-card” slot (to pciX bus). but a mid/full tower box with 8-core cpu,etc. is soon lol. {`_` } .
Email me at bhowe@charter.net
CF….check out ZYNE as a quite one that could double expectedly….any interest on this biomed?
Hey Shermo – I dont like the low volume for myself. If they start selling off, they are hard to get out of without selling lower.
double unexpectedly….
I like the nat gas fundamentals starting to shape up. Need a hot summer coming up!
i can’t resist the “perfect match” of a BTO option position and a “volatility-squeeze” play. the “potential-if-i-am-right-lol” outcome is quite favorable.