
Waking Up To A New Week Of Trading Ideas
It was another excellent week of trading. I received more than a couple of emails expressing joy over the past couple of months of activity. I’m really happy to see these results. Since we know that these runs dont last forever without consolidation phases, lets get right to the trading and our expectations going forward.
.
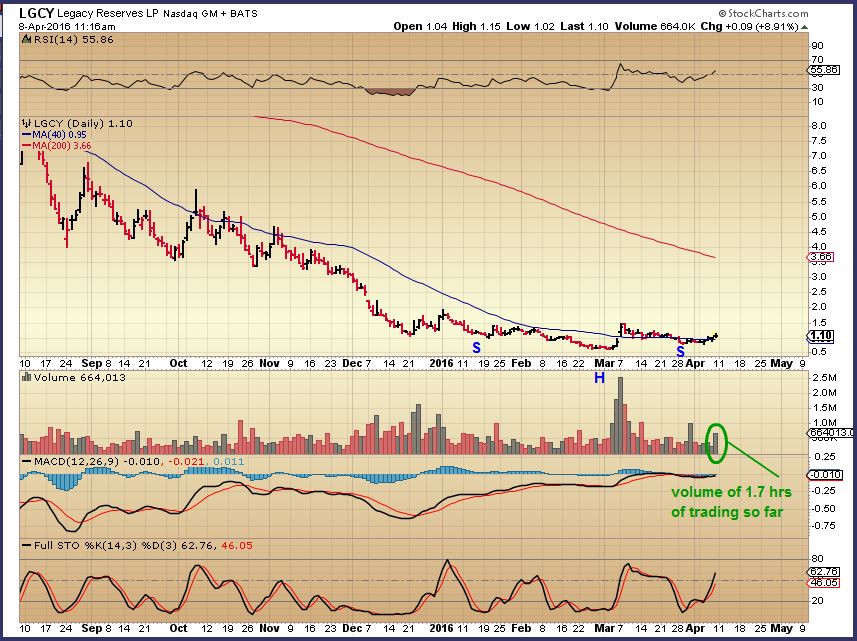
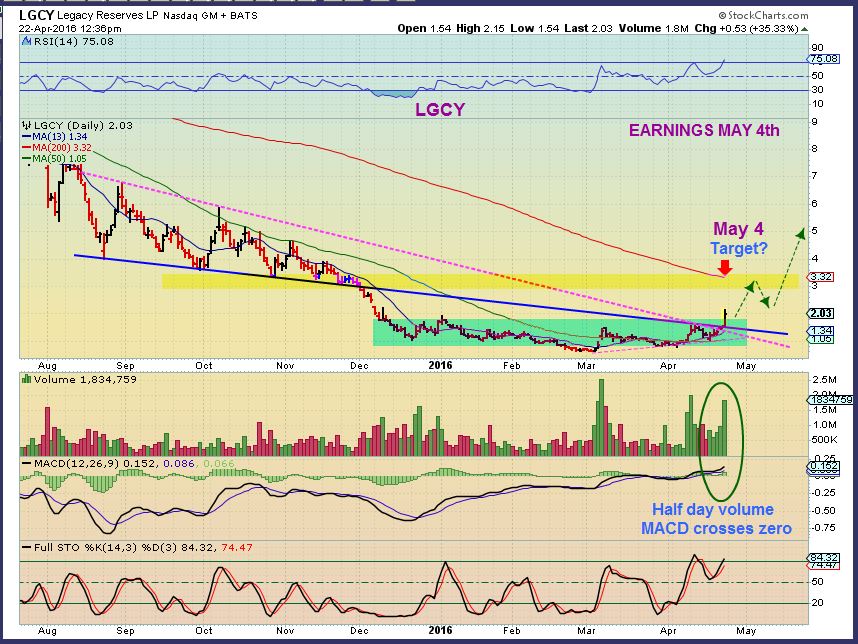
LGCY- This was the trade of the week if you ask me. I showed this base as having huge potential back on April 9th.
This was Last Monday – It was a buy when it bounced right off of the 50sma near $1.00. These types of bases are explosive.
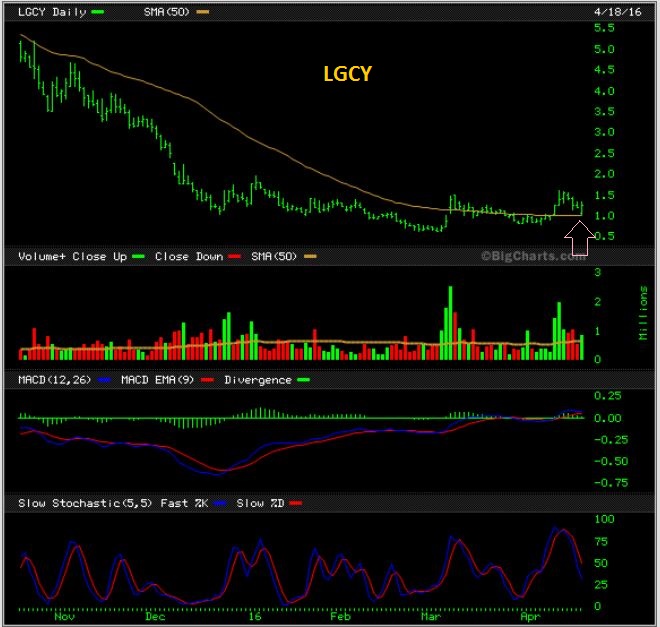
Last Wednesday – Still could be bought, inside of that long running base.
APRIL 22 LGCY – It surged to $2.35 Friday! Well over 100% in 5 days, 46% Friday alone.
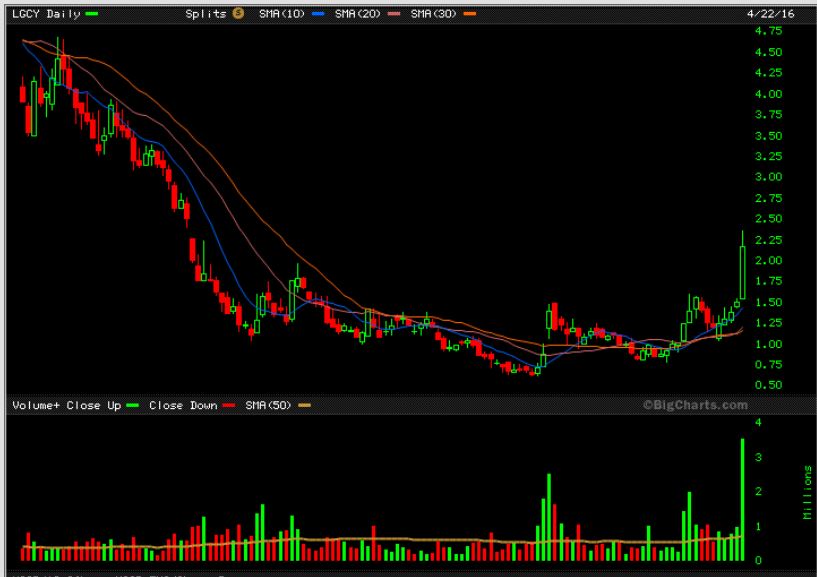
I am going to discuss what to expect from LGCY and a few other trades of ours that have done well later in this report. Is this just the start of a break out from the base, or has it exhausted itself? Stay tuned.
So that was an awesome trade and I think it does have a lot further to go, even if it pulls back first. If it pulls back, I may consider adding to my position. I will discuss more at the end of the report. Lets do a market review now.
.
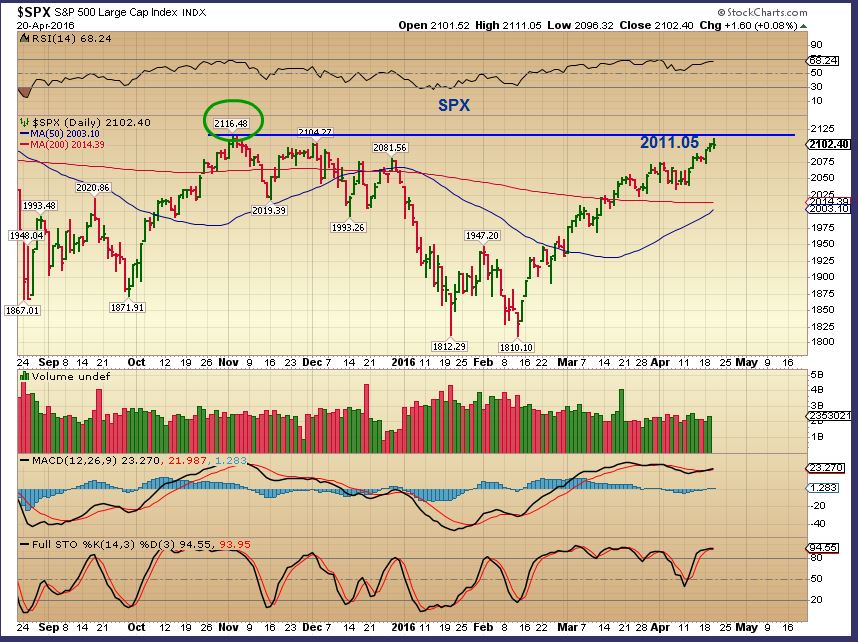
SPX – This was April 20th, it has been a nice climb and now reaching some resistance. We should expect a pause.
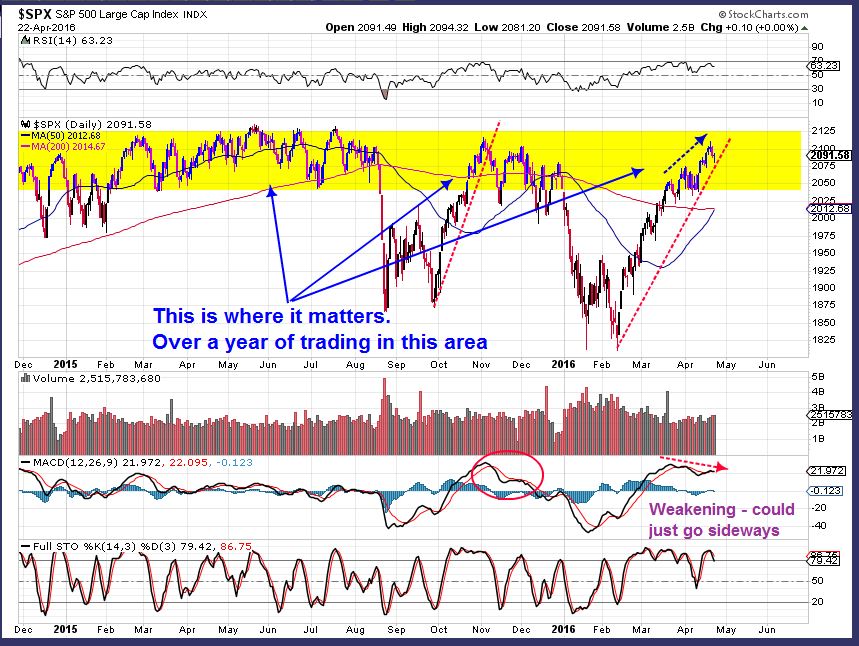
SPX currently – The macd is showing weakness and this is the area where it gets volatile. We need more time to see signs of strength here or signs of weakness. Looking at other markets may help.
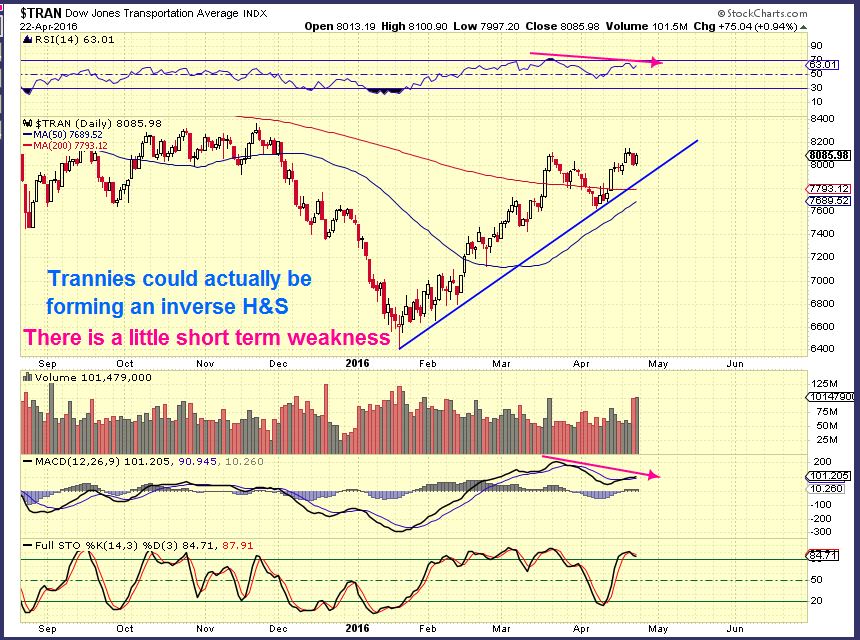
TRAN DAILY – The TRAN is at November highs, but No where near former highs of 2014. I see short term weakness but this remains healthy and the weekly looks quite good.
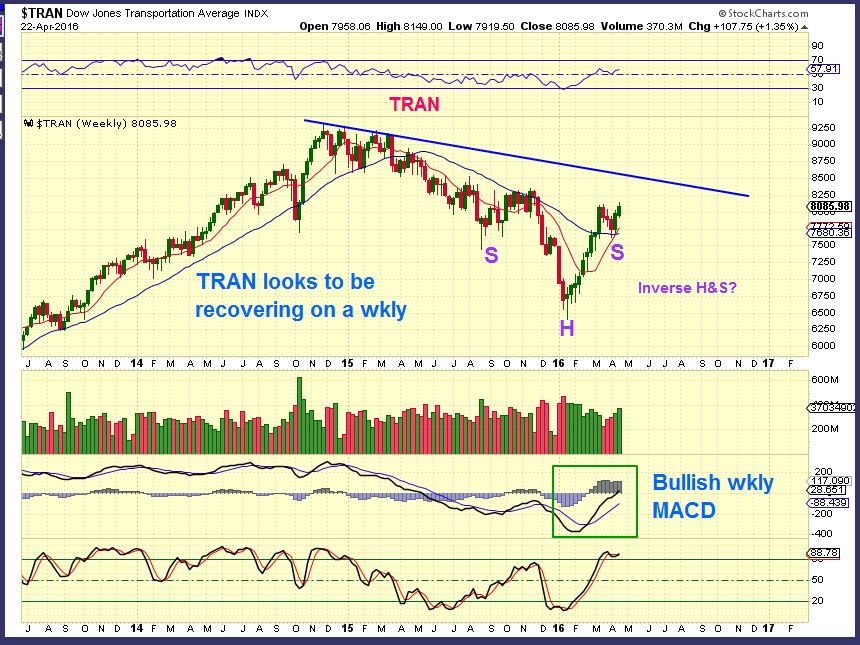
TRAN WKLY – If this Inverse H&S breaks out, it could lead to 2014 highs. Stay tuned.
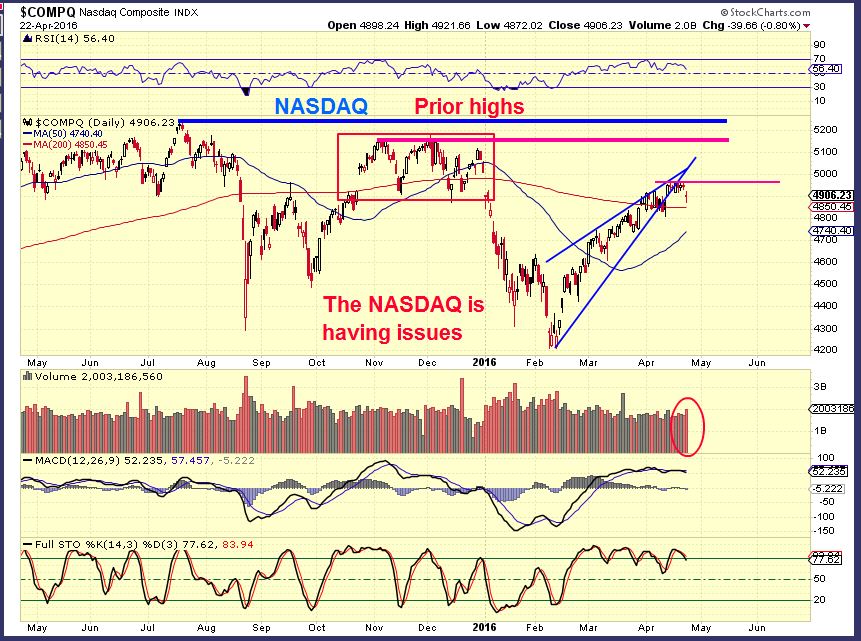
NASDAQ – I think that it is odd that the NASDAQ is not really acting as well as other areas. The NASDAQ actually dropped 40 points Friday with strong volume. THIS needs watching, we’ll see if the 200sma holds as support.
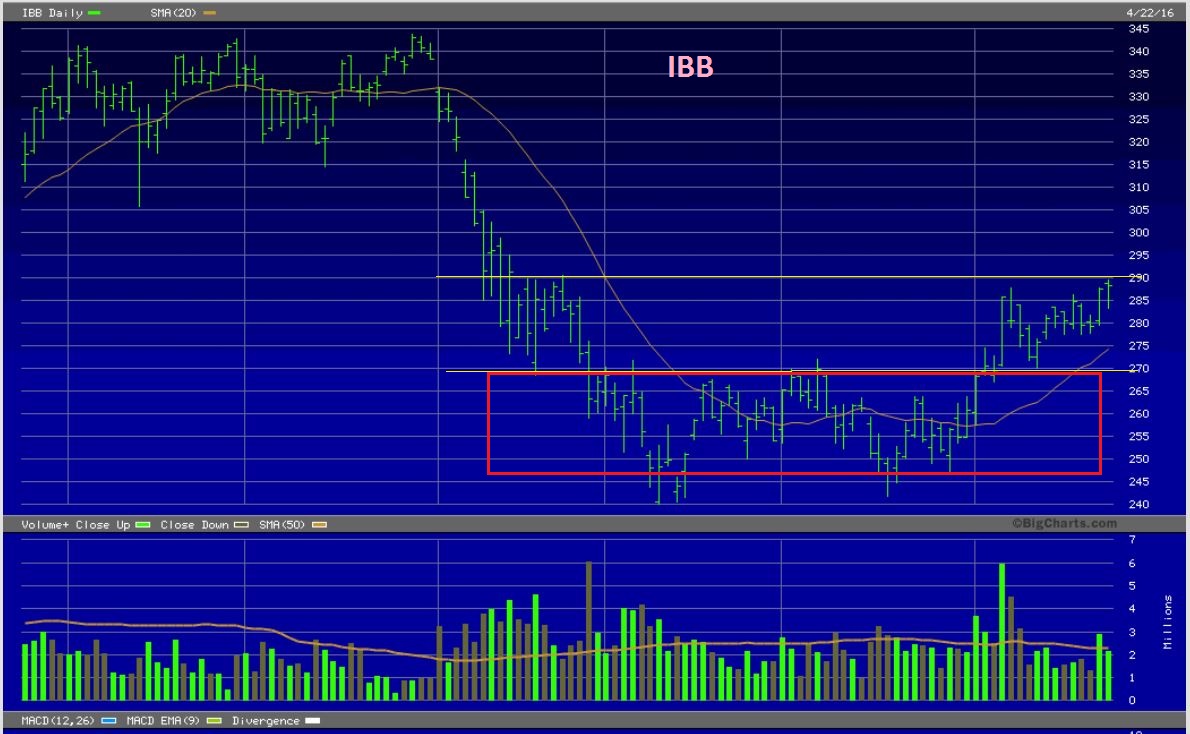
The IBB is inside a basing situation, this was my April 18 chart. It is a bullish set up and I see a break out and back test here and now working through resistance areas. This takes time.
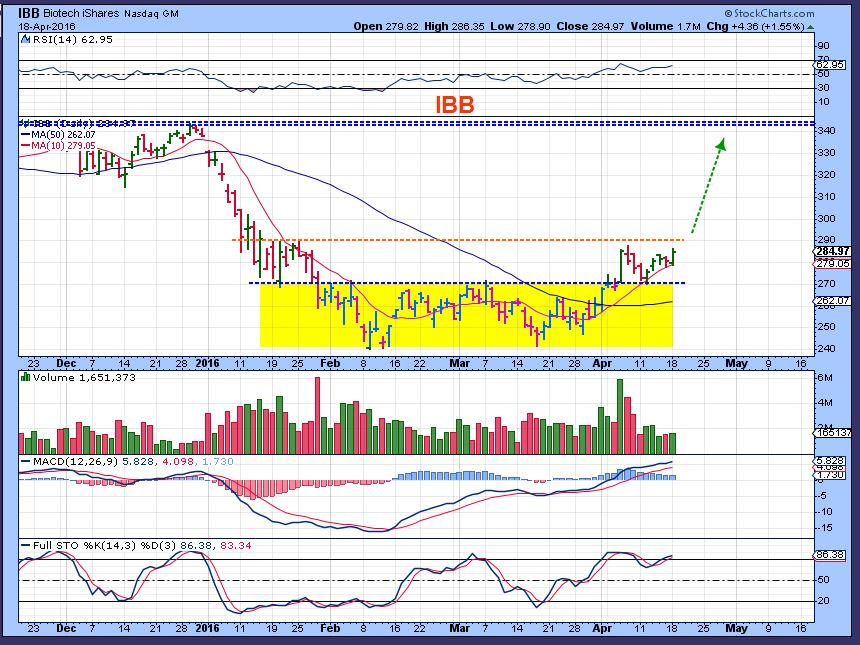
IBB NOW – This could break out further this week, but it might continue to bounce around. it LOOKS ready to break out by Wednesday.
SUMMARY : I also showed that BKX ( Banking ) was playing catch up rather well, but it also remains far from former highs. So what does that tell me? We are getting mixed signals, but overall it looks like a recovery and the different sectors are playing out progressively at different stages of the game.
.
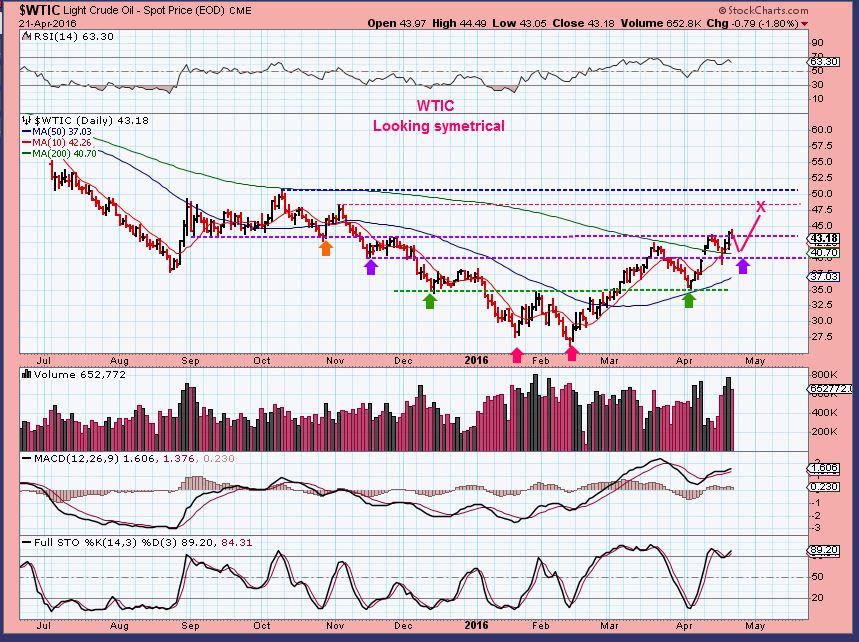
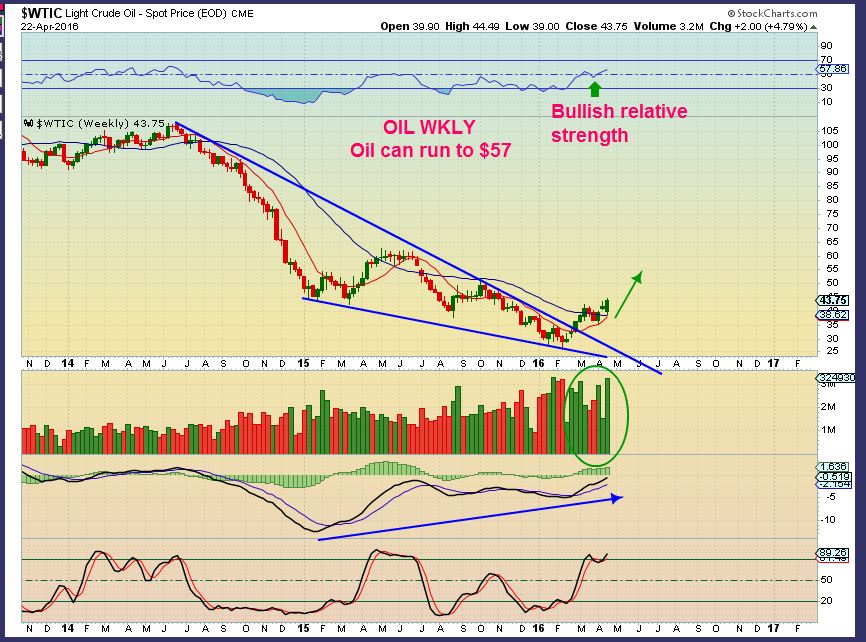
WTIC – I will show both Daily & Wkly charts. The one below is from Fridays report to show that there will be resistance and a bit of bumpiness, but the Weekly is Bullish to me. Oil should still be moving higher.
WTIC WKLY
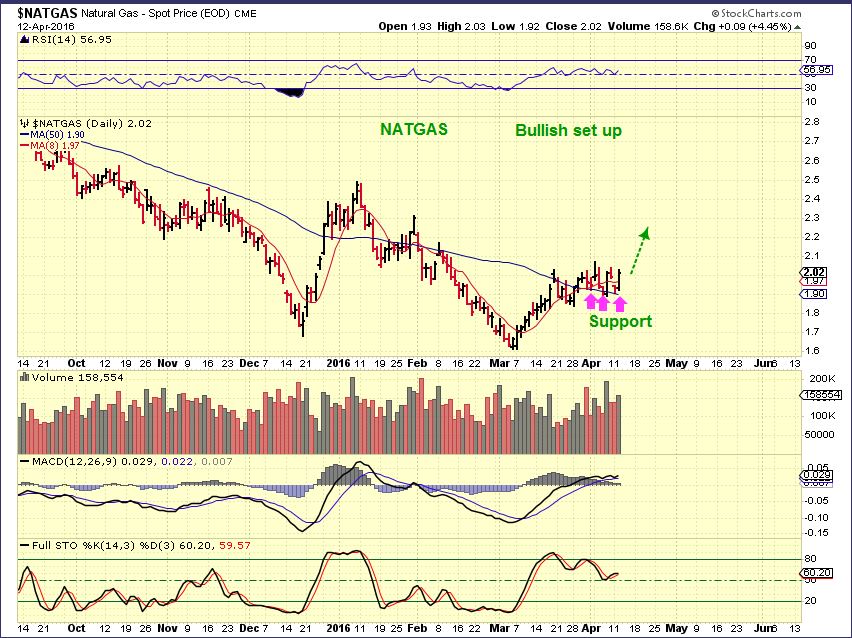
NATGAS – It was bullish bouncing off of the 50sma in my April 12 chart and continued sideways for a bit. I expected a break out higher.
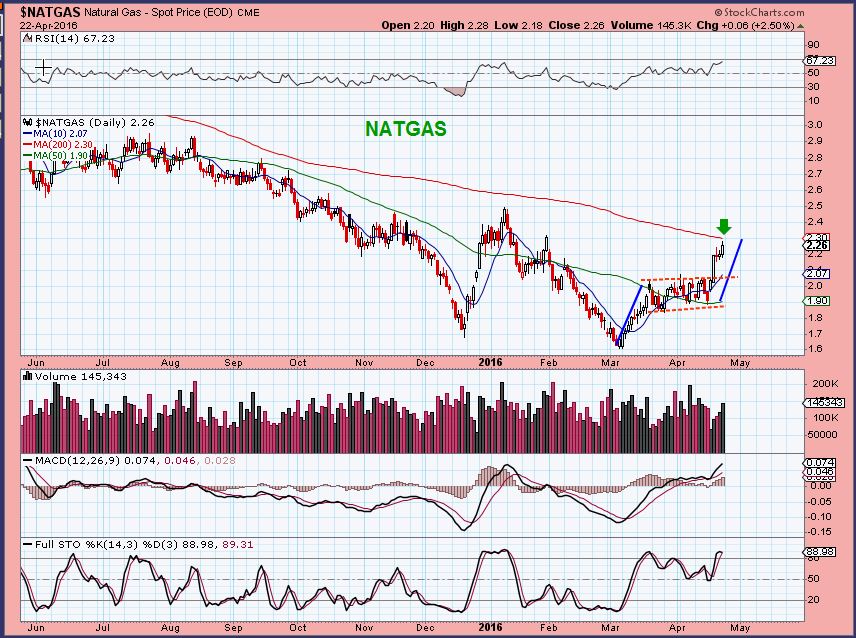
NATGAS – We got the break out and have now arrived at the 200sma resistance area. This can break above and then coil along the 200sma just like it did at the 50sma, or pullback and try to break through later. .
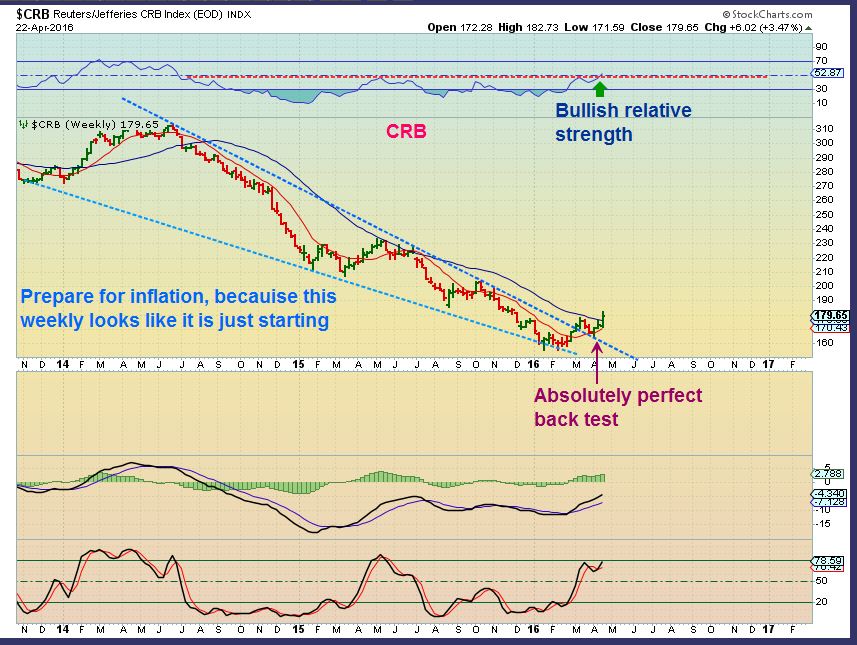
CRB– Excuse the typo, I just noticed it. I have been saying that I thought that the lows were in since February. The CRB still looks like a recovery story and we see a break out & back test. The CRB remains bullish.
.
GOLD, SILVER , & MINERS
So much to talk about in this sector , but I have already said much about it in previous reports. It just wont die 🙂 Please run through the past 7 reports or at least a prior weekend report, if you dont know my thoughts in this area. For now I will cover it briefly again here.
.
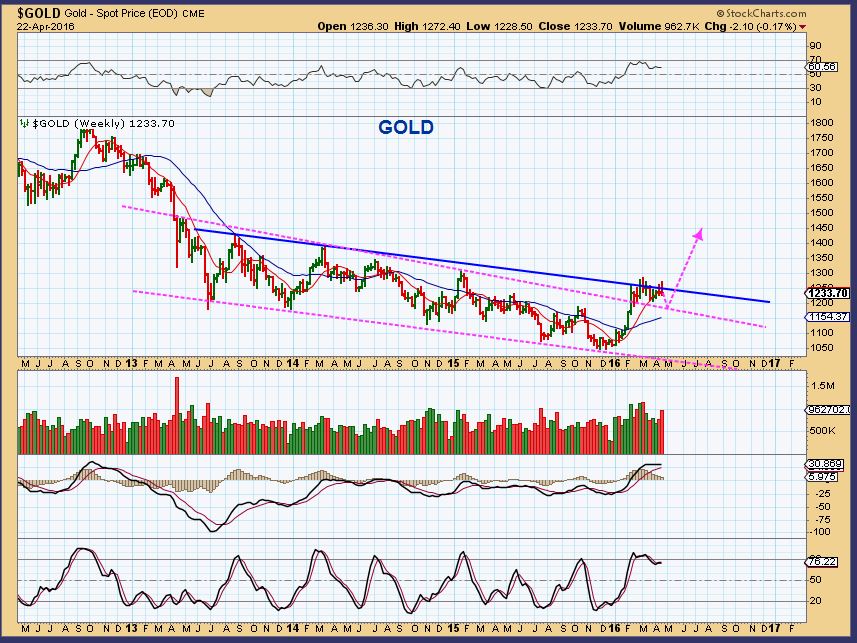
GOLD WKLY – I already showed this possibility of a ‘not- so -deep ICL’. Just a back test.
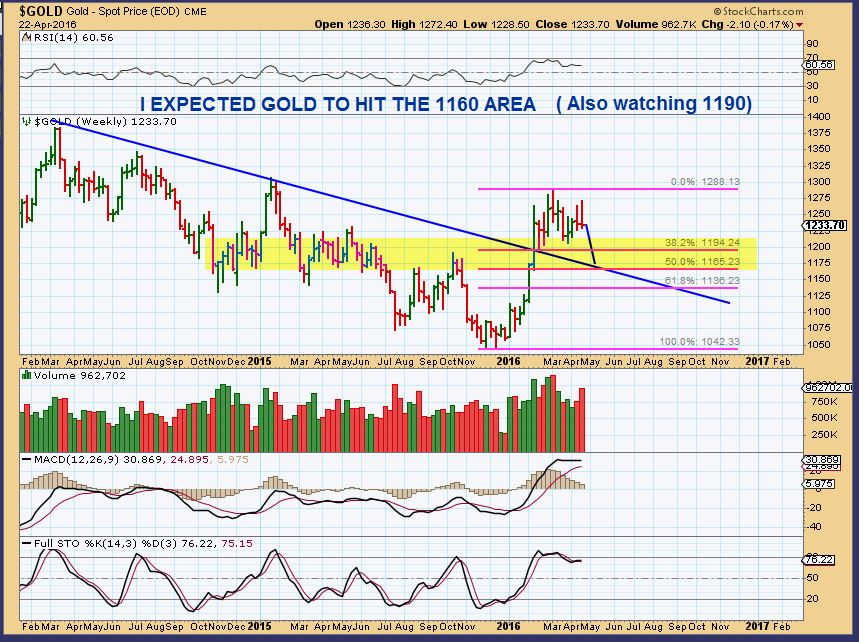
GOLD WKLY CLOSE UP – This can still drop into a DCL, or even an ICL I am Still watching GOLD $1160 and 1190. Past reports showed a H&S in this area. I do have other ideas, but for now this is the expectation.
.
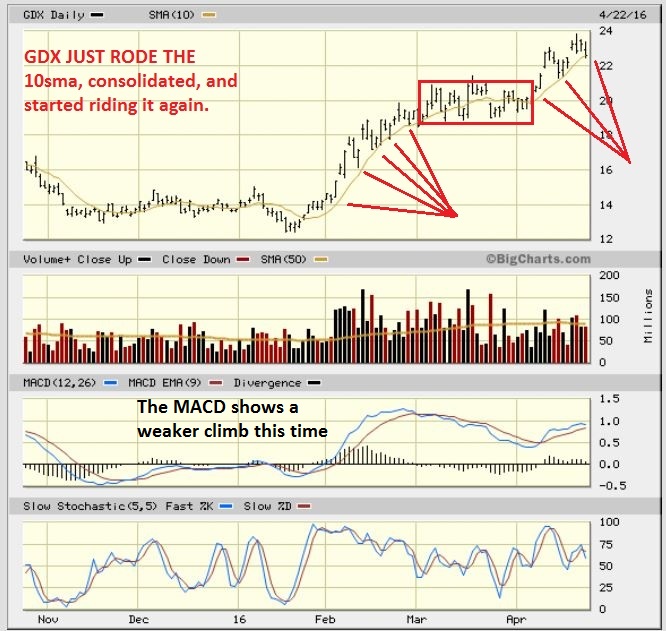
GDX – Miners have completely ignored Golds multi week sideways topping process that is seen in the chart above. For the past several weeks, GOLD went sideways, Miners ran higher. I did mention that this could occur in a prior report a couple of weeks ago, and my reasoning was this…
.
GOLD BOTTOMED on DEC 3rd, MINERS BOTTOMED on JAN 15. That is 6 weeks later. SO I wrote that some Miners could have more ‘time’ to go higher considering things that way. And many miners have done complete A-B-C-D expansions. As a trader, I have mentioned these trades , but could not recommend them as “low risk”. I pointed out what GSS did, and called for TGD, VGZ , and a few others like ( BAA that did not play out completely yet).
,
GDX – So GDX so far has done this (Read the chart). I am still in TGD and BAA as trades, and I own a core positions in Miners, but if GDX breaks decisively below the 10 sma, I may sell BAA & TGD trade positions. I do expect Miners to eventually dip , and if you haven’t started core positions, CORE positions can be bought when we dip.
.
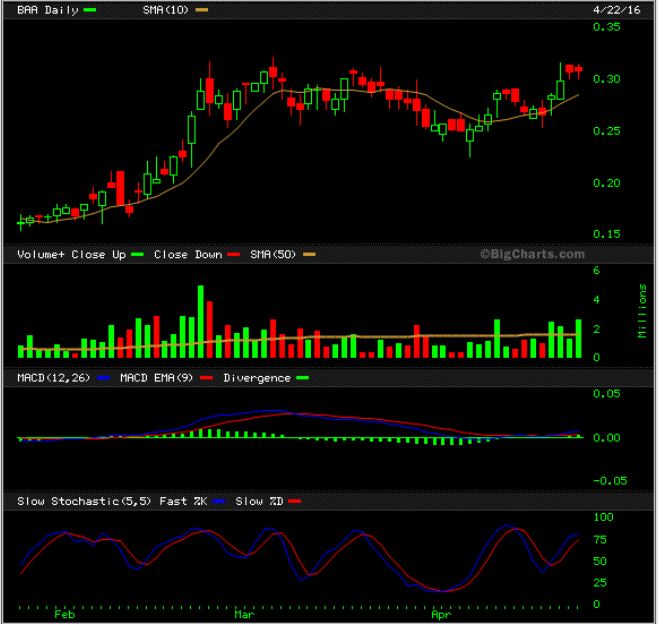
This was one of the BAA charts used. Bought at 24 cents and added at 26 cents.
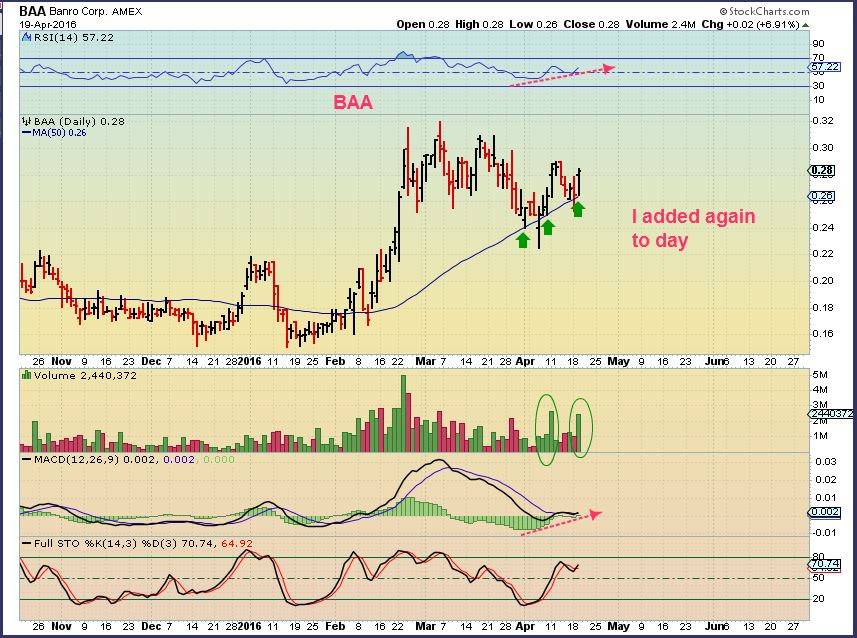
BAA – Now at 30, it still looks like it wants to break out of a cup & handle here, so I am holding for now.
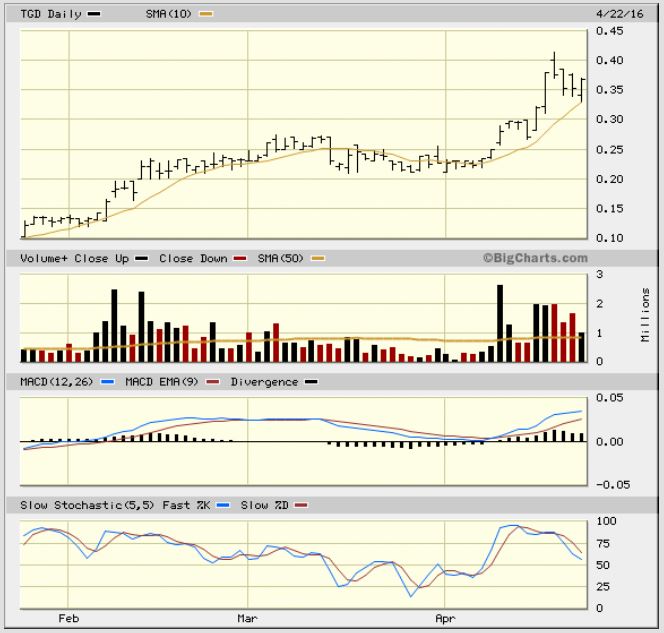
TGD – This was TGDs trade, showing that some miners are still progressing. I used this chart on April 12.
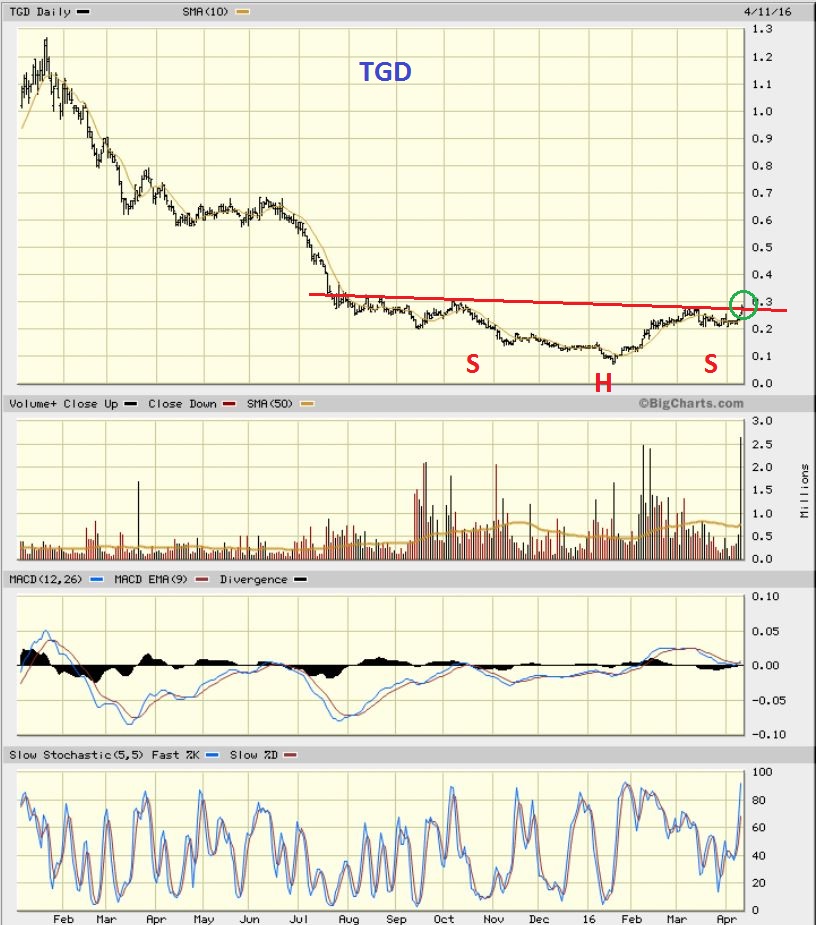
TGD – I posted this showing that TGD was breaking out and using T/A – it was legit . Huge volume.
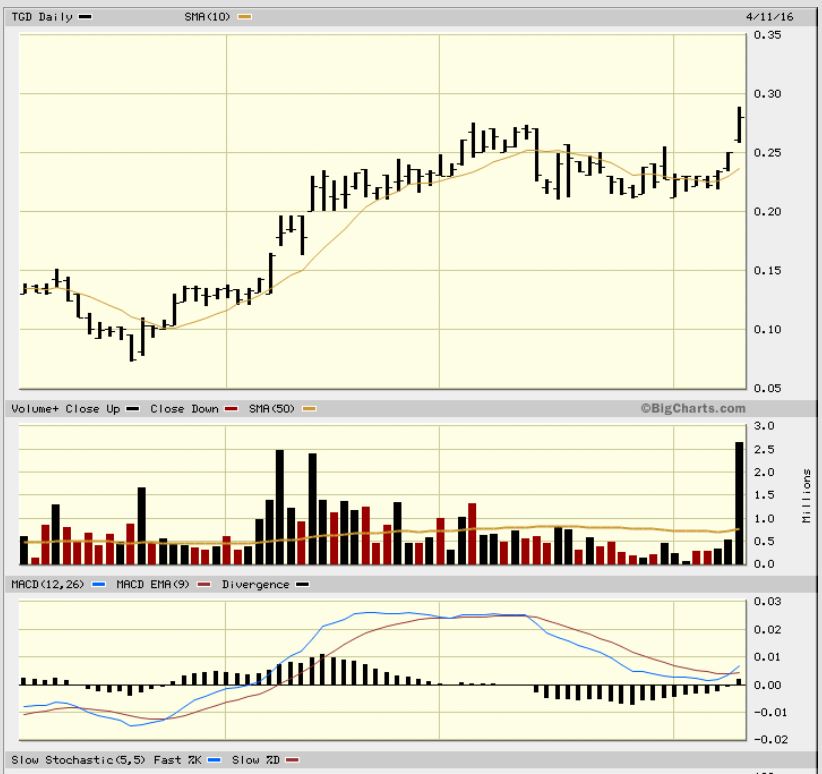
It sure was.
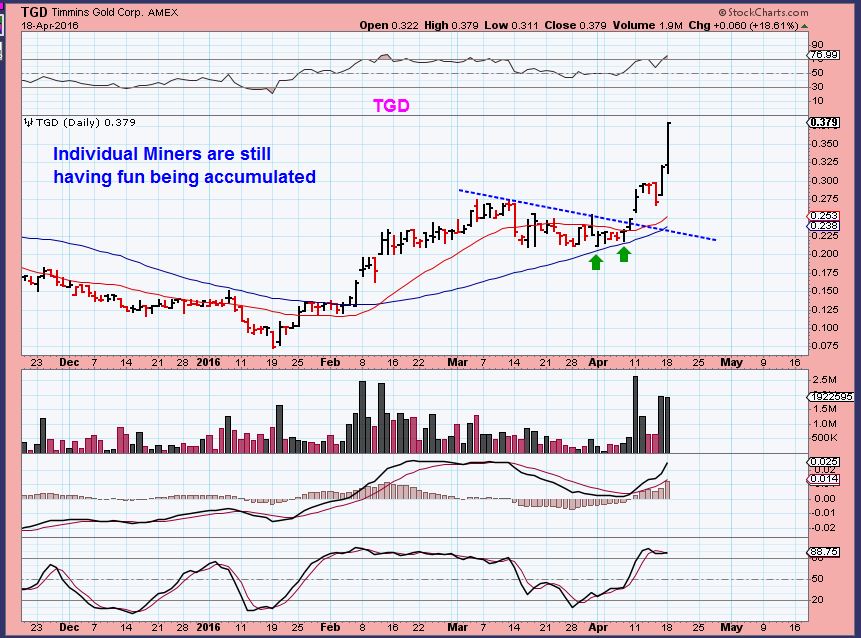
TGD actually reversed off of the 10sma and remains bullish last week too. When I took the trades in miners, I said I will stay in them ‘until they tell me the trade is done.’ So far? It is still a working trade for the TGD & BAA set ups.
.
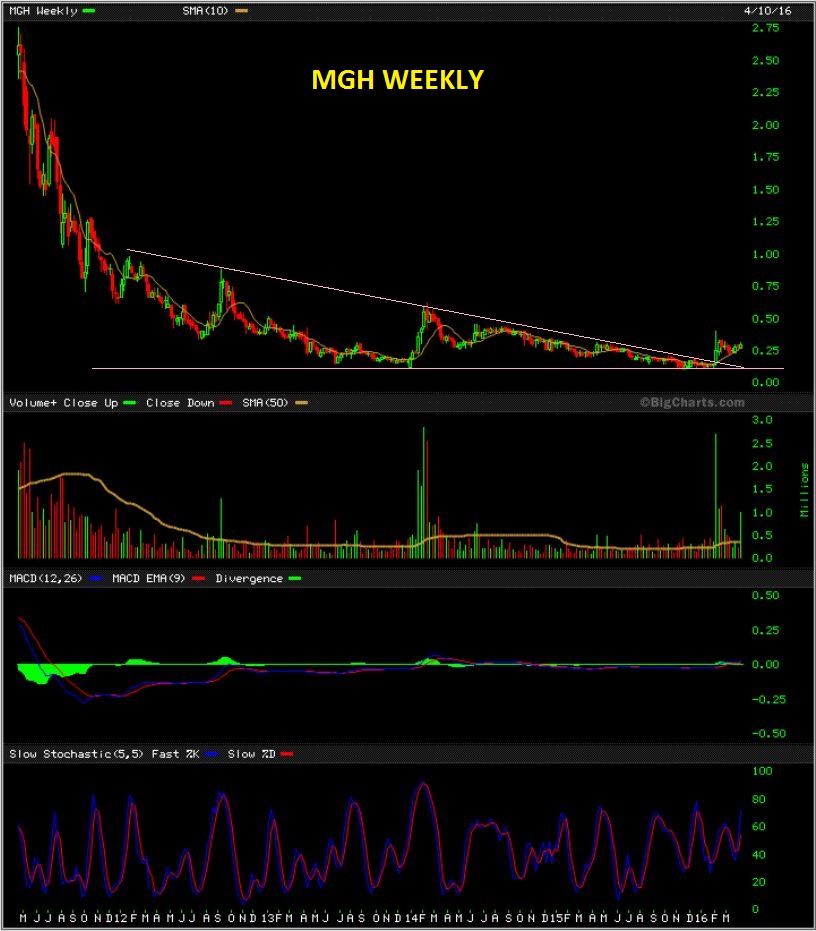
SIDENOTE: I also pointed out MGH – I am keeping my eye on this . The weekly chart is longer term bullish. If GOLD drops fast, this will stall, but if GOLD keeps going sideways, MGH may start a break higher too.
So people have been asking me, “What do you think of the fact that Gold ran strongly and Silver is just taking off. Quite surprising, huh?”
.
NO.
.
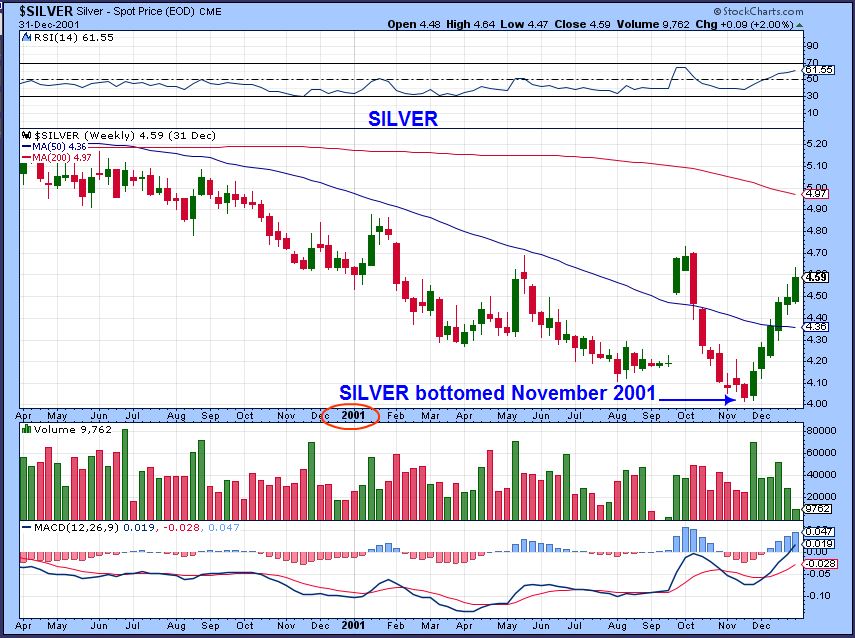
– I put this in several reports last yr. These charts were from those reports. They show that in the LOWS of the 2001, Gold bottomed over 6 month before Silver.
.
Notice that :
GOLD – Bottomed 2001 SPRING
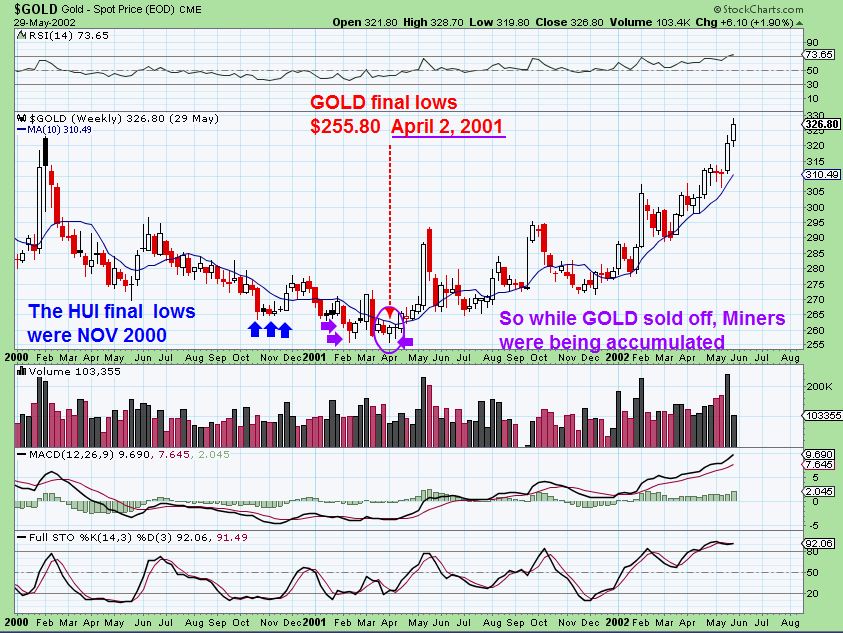
SILVER – SILVER BOTTOMED LATE NOVEMBER 2001
That is our General Market Review. Lets go back to that question about whether LGCY is done (up over 100% from the 50sma) or could it run more?
.
LGCY – They release earnings on Wednesday of next week – MAY 4th. Here are 2 possible scenarios. Please understand that what I do is estimates based on past experience. I CANNOT know how this will go, but I will tell you which way I do lean more towards.
.
LGCY GUESS #1 – ( I drew this at noon time Friday, so the volume is 1/2 day volume) . I lean more toward a continuation of the explosion that we saw this week, eventually to the 200sma. Then it would drop on earnings May 4th.
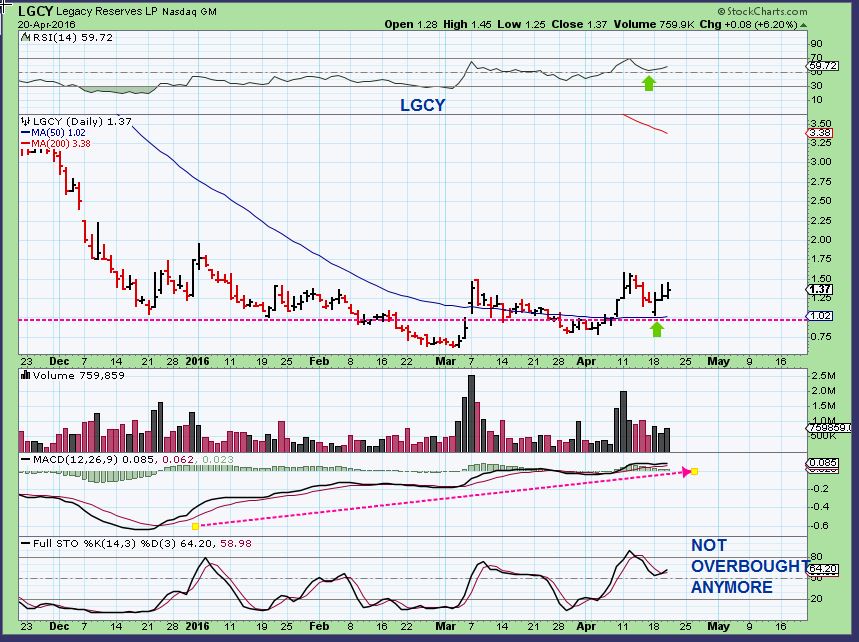
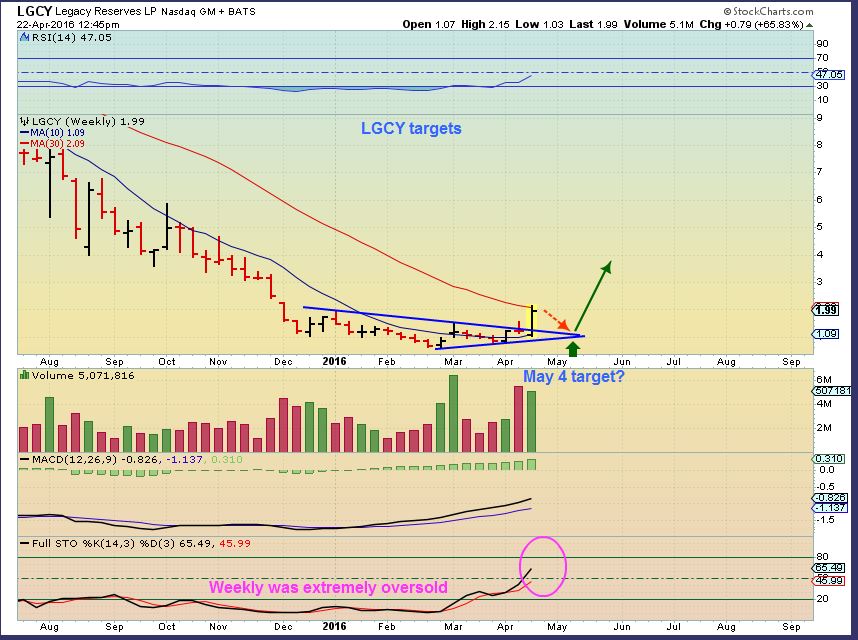
LGCY GUESS #2 – This wkly chart says that we pushed VERY strongly into resistance, so we ‘could’ pull back for a while into Earnings on May 4th, and then we could do another run higher.
.
Readers are asking me….
“WHEN DO WE BUY CLF, VALE, ETC?”
.
LETS TALK COMMODITIES:
.
We made very good money on those trades on both the first run higher and the 2nd run higher, so I know you dont want to miss the next run higher. I do feel that they will be moving much higher over time, so I have planned on watching for the next possible entry points. Lets discuss what I am seeing now.
.
If you have been with CHARTFREAK for a while, maybe you recall that I repeatedly pointed out that in an uptrend, the 20sma can be a good buy point. If it falls at a 50% re-trace or other important area, you have CONFLUENCE. On MARCH 16 I was pointing that out here, encouraging us to buy these dips. If you bought this near $2.75 or $3.50, you did well.
.
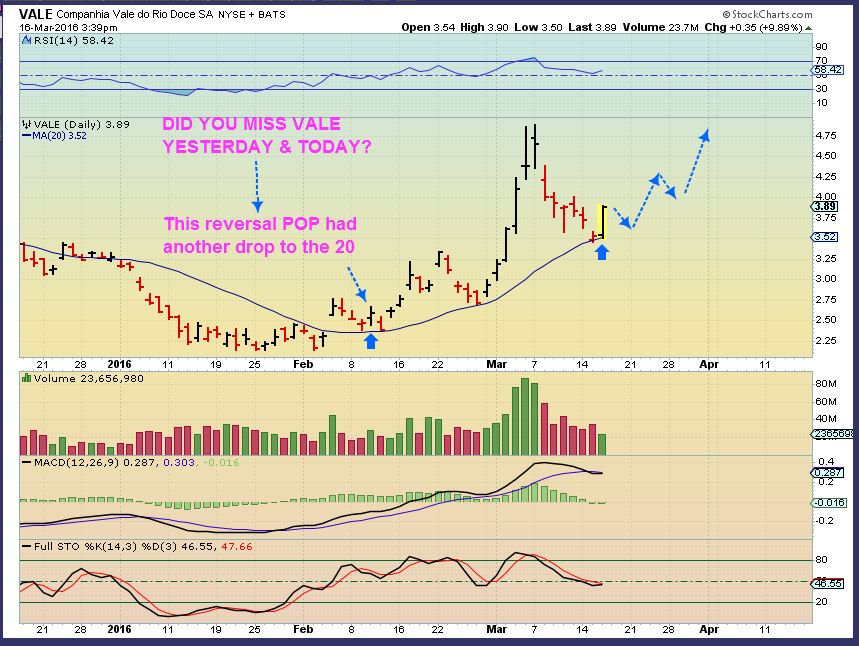
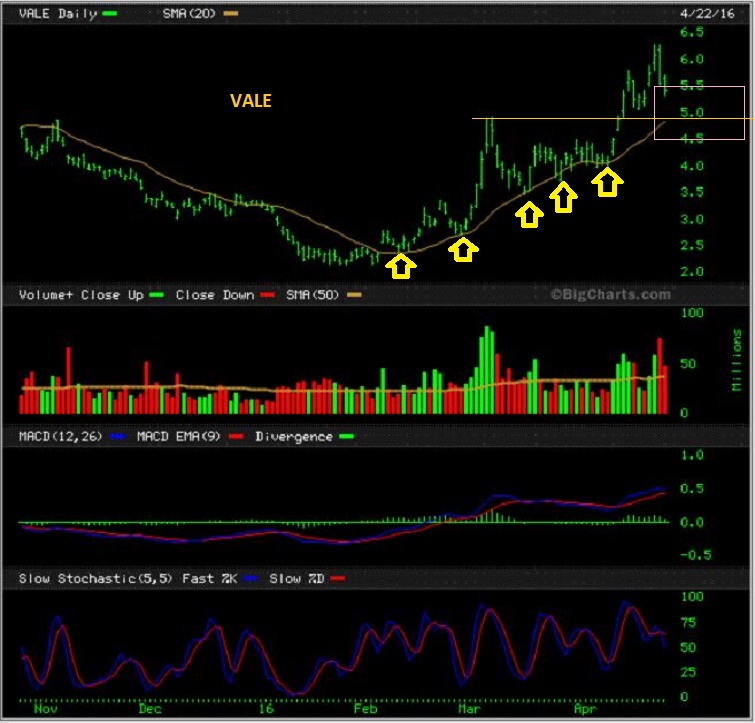
VALE today – You now see that the buy at $2.75 & $3.50 eventually ran to well over $6.00 after repeatedly tagging the 20sma as it rose higher. Now I see confluence in the $5 area. Vale could be bought there if you dont mind a possible sideways volatile move like we saw at that $3.00 area.
I will cover these stocks more as time goes by, and yes I do expect them to fall a bit more. Some decided not to wait for the pull back and entered early. That is fine too, I think these will be much higher over time. For me, using the above idea, I am looking at the following area to buy :
VALE- $5.00 area
CLf – $3.75 area
Again, I will watch the above VALE, CLF, SID, etc. daily and update this if it becomes clearer. Yes – These can just run away too, These were very popular companies that were in he $20s & $30’s, even more. Funds may step in and buy the dip before we reach my expected levels, but so far patience has paid off for CLF & VALE.
.
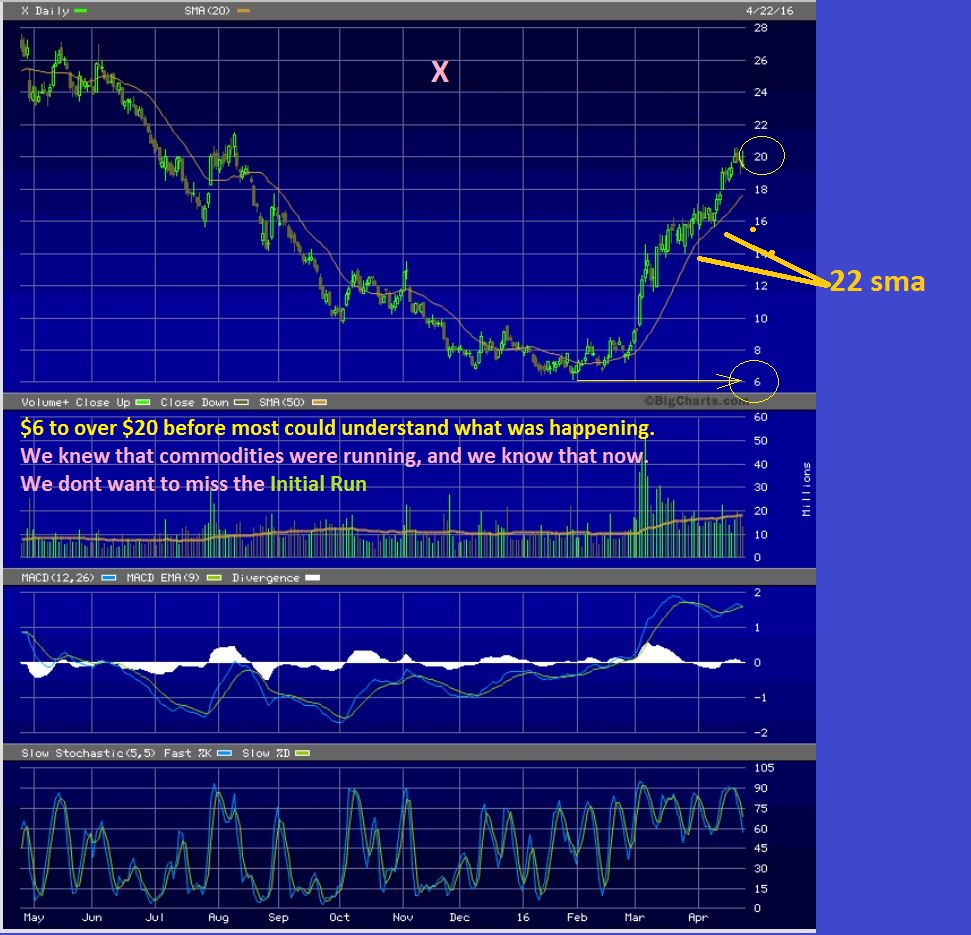
I want to show you something: I have been saying that Commodities are recovering since January/ February and that we want to be in these trades. Steel & Aluminum stocks ran first and X, ZEUS, AA, CENX, etc have done VERY WELL already. SO we dont want to miss the ones moving now . This is “X” for example. Look at that run! Most missed it. It was a triple!! CLF & VALE may do this too.
.
That said, let me tell you what else I am focused on in the commodity sector immediately.
COPPER STOCKS
.
This is COPPERs WKLY chart, and it looks ready to go. It had its first run Jan – March also , and so did FCX and other copper stocks.
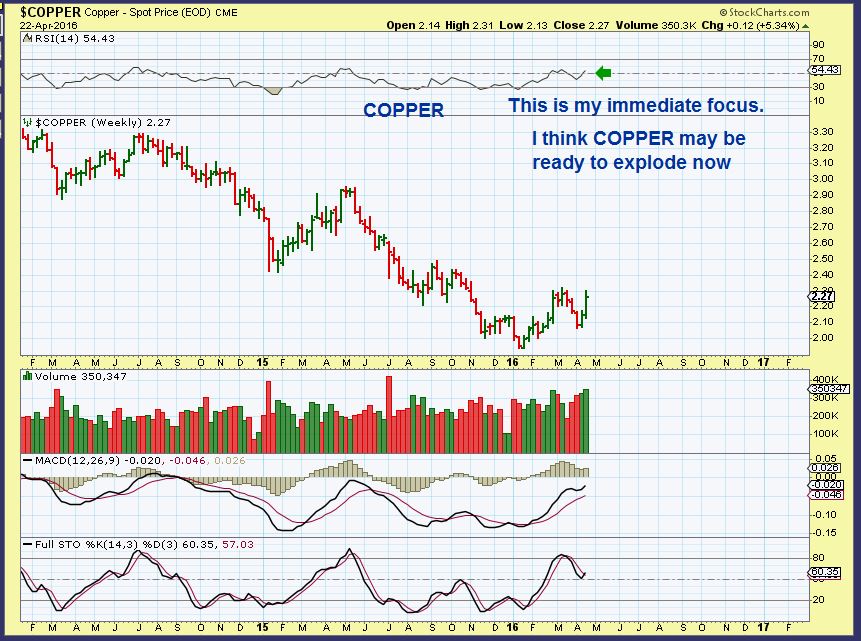
So lets look at Copper stocks and see if they are also ready to run again. ( They are in my opinion)
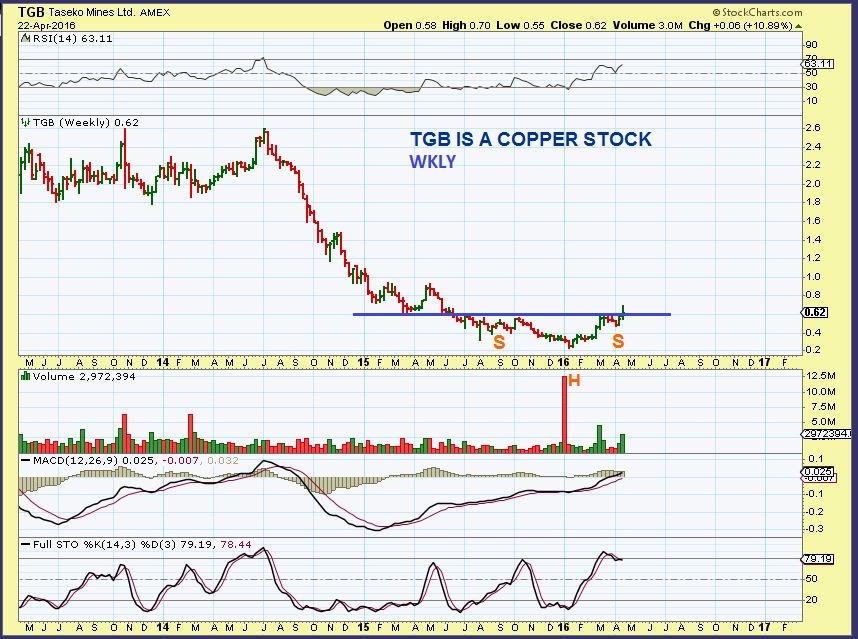
TGB WKLY – Bullish.
FCX DAILY – This jumped and actually looks like it could pull back for a day or two unless volume picks up, however…
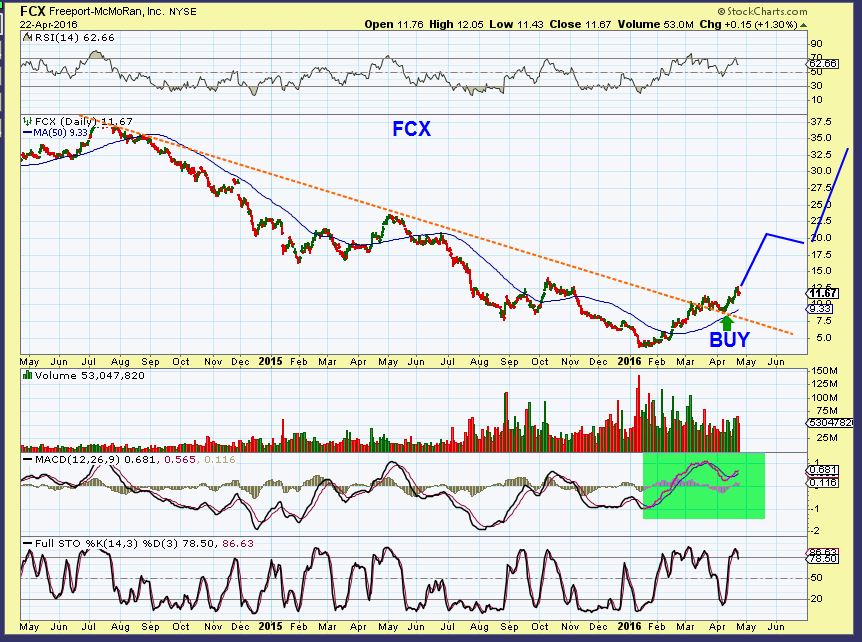
FCX WKLY – Bullish

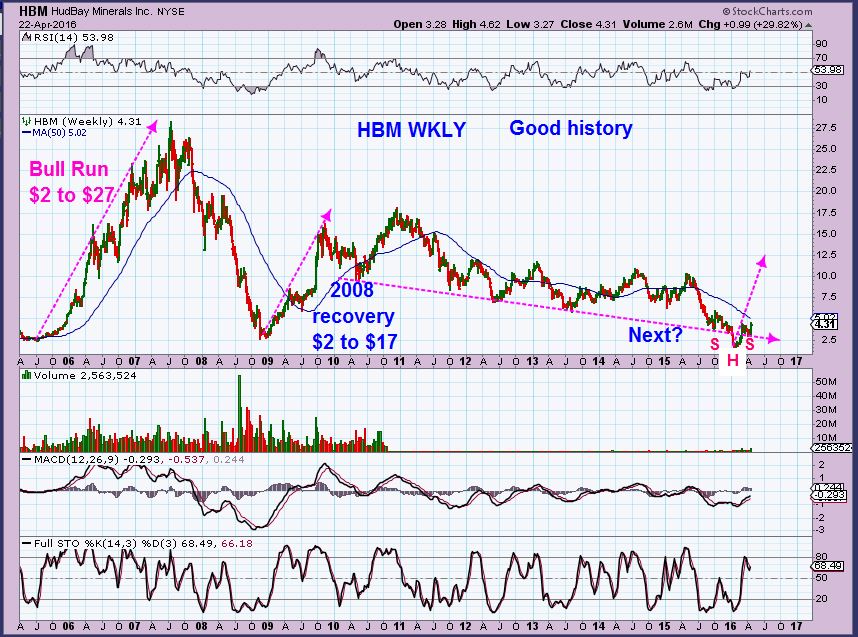
SO with the above charts of Copper & Copper stocks looking quite bullish, I have also been discussing HBM. Like FCX, it is a COPPER / GOLD MINER.
.
HBM WKLY – I just wanted to point out the companies history at lows in recovery mode.
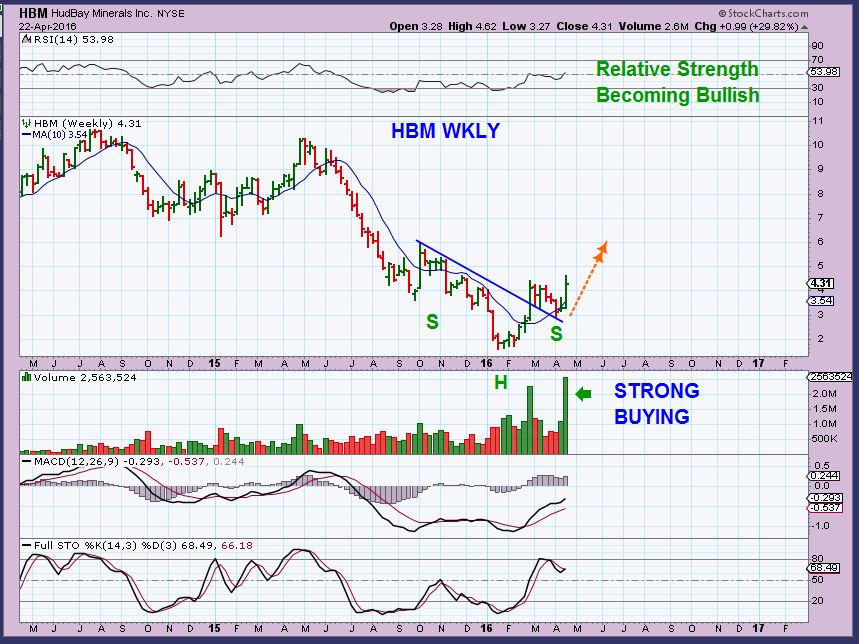
$ 2.00 – $27.00. and $2.00 – $17.00. And now? This is bullish, so lets zoom in…
HBM WKLY – Just about to Break out. This looks very bullish and I expect it to run this week. You can see on this weekly chart that it could easily double, even if you bought it right here. Do not be surprised if I sell some AA to lock in profit, and buy some HBM this week. HBM looks like it wants to double.
.
Finally, I have been posting many set ups for Energy. You can see my reports from last week, and I have advised keeping a running list to keep track of how they perform. Most are a lot higher, but many are still valid for entry in my opinion.
.
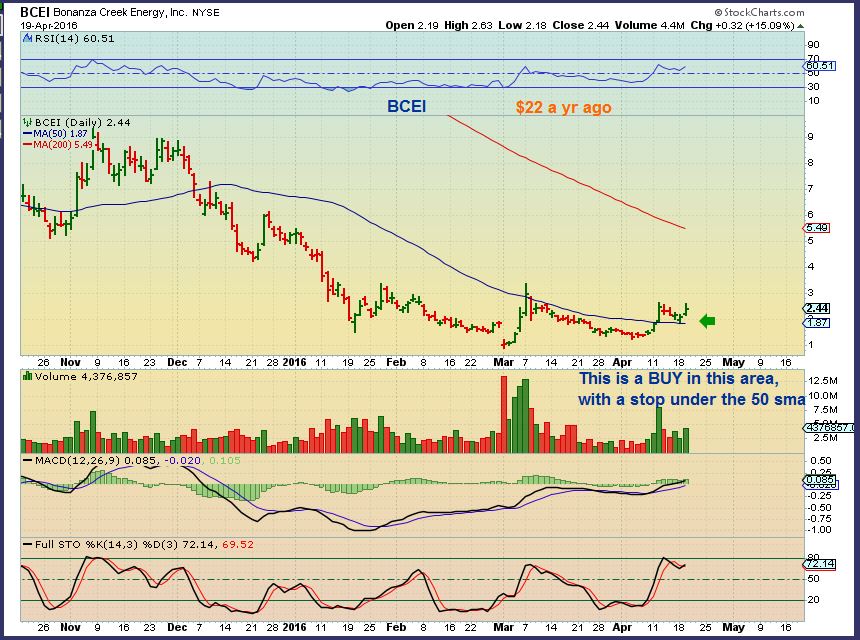
Lets look at BCEI last Tuesday – I was buying this tag of the 50sma under $2.00 and recommended it as a low risk opportunity here too. The set up was bullish in several ways. It looks like it wants to run to almost $6!
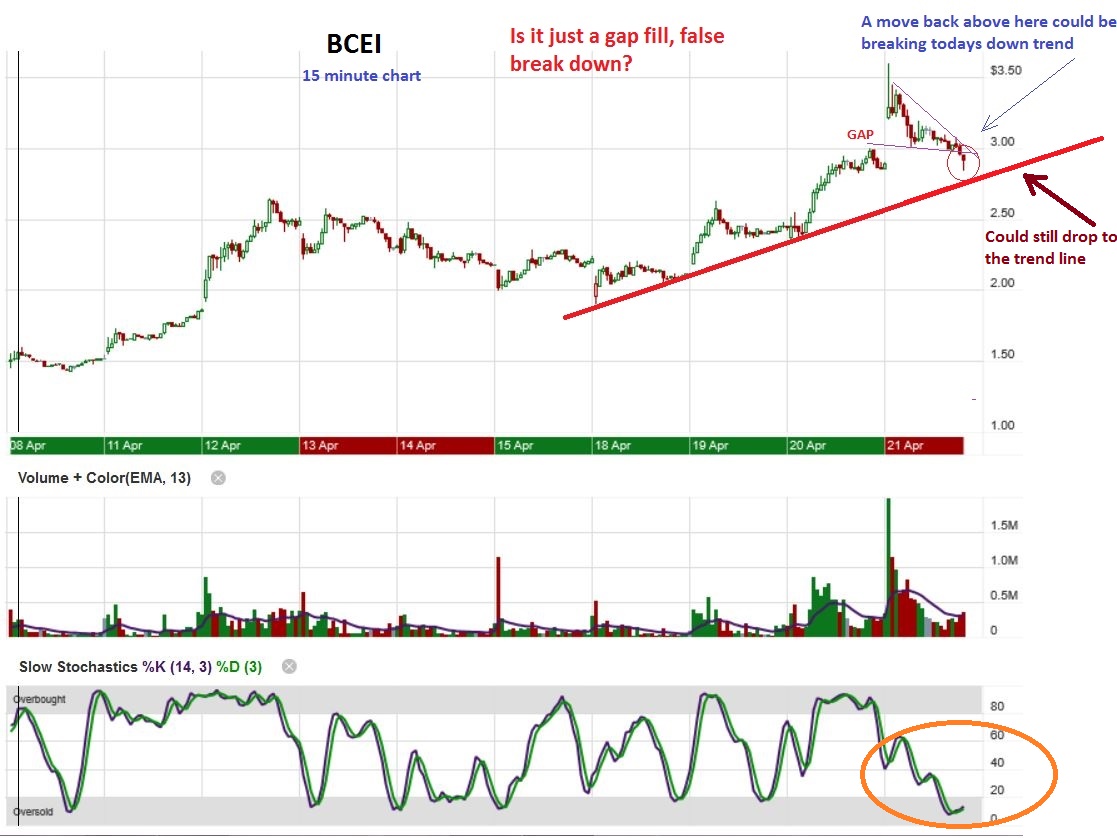
April 21 – I recommended this stock as quite a bullish set up. I pointed out that as a trader, I added on this dip to fill the gap, and posted this chart to show you how I trade intraday. It might drop to that red trend line, but it is a bullish daily set up here now under $3.00.
.
BCEI FRIDAY – This now looks even more bullish, breaking above $3.00 and breaking out from a Base with volume swelling. It continues to act correctly and improve as a good set up. A dip to the 10sma is a gift. As an inverse H&S , it can be bought as a break out too.
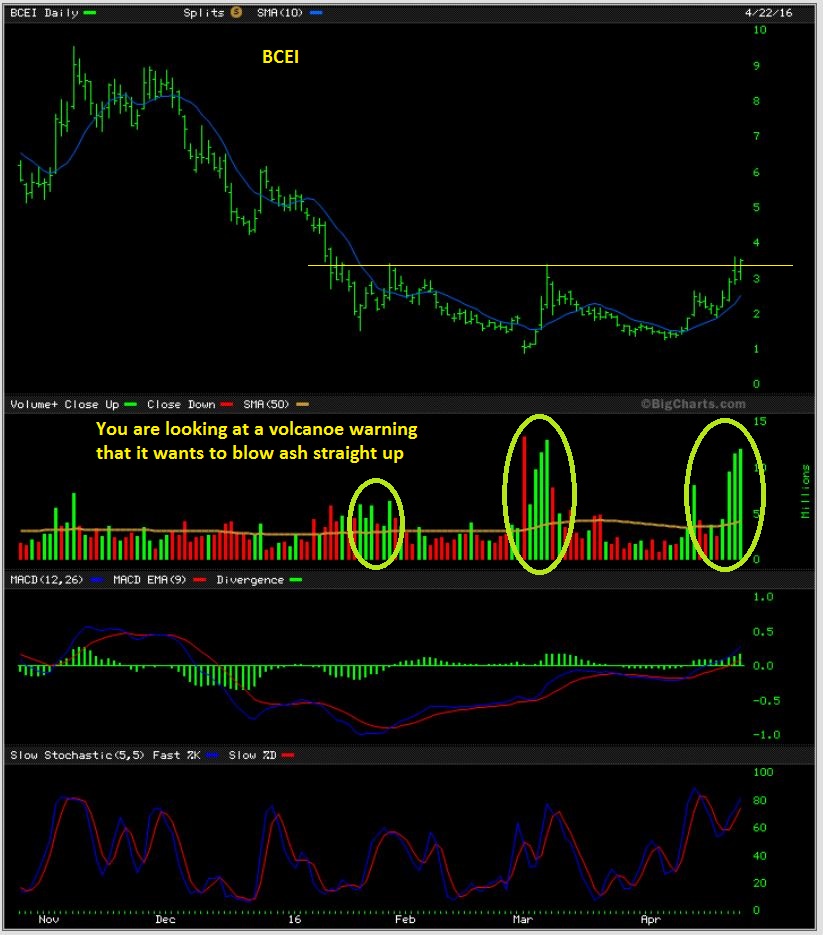
I can see BCEI doubling from here over time, if it can avoid any ugly surprises. As an energy stock, it is hard to recommend it after it already run from $1.25 to above $3.53 in just 11 days, right? Watch for a possible pullback to the 10sma. Personally I would buy the dip there or even add on the break higher from the inverse H&S for a quick trade. Again, it is hard for me to say where a good low risk entry is without a pull back, but I do think that this could easily double.
.
And my disclaimer:
All stocks contain risk. Some ENERGY stocks that are running strongly do have unfavorable fundamentals ( a lot of Debt). Are they running because the markets are forward looking and with OIL recovering, they may be able to survive and improve in their earnings and business affairs? I cannot know that, but the charts are bullishly set up as though buying and accumulation is taking place. Trade defensively – Keep your positions reasonable , Diversify with a small basket of stocks, use stops, and watch for their earnings release and hold or sell accordingly.
.
When I first bought X, AKS, SID – All I heard in the news was that ‘ China demand is low and there is no hope for Steel companies!” . I am a contrarian and I love it when the news is filled with that kind of talk. That is what I hear at the lows time and time again, but the charts may show obvious signs of accumulation and real buying. It also happened with ” GOLD must drop to $800- $900 before it can go higher” and ” Oil is going into the teens this winter” or ” Oil will never trade above $44 in my lifetime!” Etc. “X” then ran from $6.00 to $20.00. Vale, CLF, CENX, AA, etc ran very strongly out of the lows. Most likely , many will never see ‘X’ prices anywhere near $6 again. We may never see CLF and Vale near $2 again, and I can point out MANY MANY Miners that have doubled and tripled in 2016 alone. Those lows may not be available again. So trading opportunities are all around us, and we are doing excellent at capturing these companies at Fire sale prices. Yes, there are always risks, so be wise…
Protect yourself, small positions and not all your eggs in 1 basket. Trade reasonably, but dont be afraid to trade because of the news, or you may get left behind.
.
Have a great Monday!
.
~ALEX
.


time to do some shopping this week and look for some basement bargain prices! Thanks Alex!
May I interest anyone in Copper stocks 🙂 More on that tonight
didn’t pull the trigger today as it just didn’t feel right. Let’s see what tomorrow brings.
Thanks for the report. Let’s make some money!
So far so good Eddy!
Anybody like CRK here? Besides me!
Dear Bill, I took small position last Friday @0.80c
Hi Bill
Charting on hourly, looks to drop to PSAR +- .81…if it holds I may buy. Earnings expected on 5/4
No. CRK been on my watch List for a while. She’s a goat. Dumped again this morning. Cannot sustain upside momentum and has lower highs as compared to 1st oil run. I’d stay away.
Alex, just wondering: what charting platform do you use to organize and monitor so many stocks?
Its all in my head ( occasional post it notes, notebook scribbles, etc ).
Have you ever seen the movie … Its a beautiful Mind?
*me sticking my finger in mouth…
oh, what….they dont have a GIF for that? 🙂
You really asked for that? Why?
Hi all, I bought some Hudbay Minerals warrants last week from the TSX. There are also warrants on the NYSE ( i think). Volume is very low but it could be very profitable if Alex is right about the underling security (HBM). HBM warrants on the NYSE currently trade at 0.24 but have a 52 week high of 1.73. My tranch is quite small but it would be a long term hold…they expire summer 2018 or there about.
Rob, thanks for the heads up on HBM warrants.
Alex,
Excellent report, thanks for the sustained perspective-building on commodities
Hi Rube,
I am thinking that some of the commodities are getting close. Look at my report and VALE & CLF are near those targets. They could drop further, but they are pulling back slowly and orderly so far.
I knew this pullback was coming, and thats why I wanted to be patient. The next thing is that they can bounce around and go sideways like the last time we got into CLF & VALE. We spent a week or two waiting for lift-off
I cant believe that the BAA trade is working out. Great volume today on the break out.
.
I also mentioned TGD and NSU. The NSU trade has gone south. It was also a nice set up, but today is down on strong selling.
BAA holding from last Aug at .23 ave
just watching it grow 🙂
Refresh – As long as this stays this orderly, I like the potential. FCX is the same .
.
Thank you Alex.
My limit order is in. If it doesn’t pull back much I may just buy 1/4 position at market and add on pullback so I don’t completely miss it.
I hope you mean HBM!!!!
Good catch – I do 🙂
$BPGDM just turned lower today.
I haven’t heard from Crystal in a while. I know she was holding LGCY down at $1 and even lower , so I know she is doing well with that trade, I just hope she is busy or away and not posting due to that, rather than illness.
*or she’s afraid of “mom” ….
*mom that wasnt
Hasnt she been here since then?
i dont believe so …
oh THELLLLMAAAAA…. where you at girlllllfriend… ;o)
*she’s probably tired from riding the LGCY Bull with me…
(yeah…we were just in NYC too)
ps. do you see how we were well ahead of our time taking selfies with a Polaroid….
More like this. I’m placed myself in indefinite time-out:)
…. pppshhhhh… nonsense.
…. not EVEN close to me over the years…
**u just shush y’all
Well Betty…..from Wilma❤️ https://uploads.disquscdn.com/images/60170deeb2a3b36a6b68d31b01d8ae8541c01bf5cc55f776695bed0712c37864.jpg
… yeah.. mine’s been sorrrrrrta ground down to paper thin swiss cheese over the years as well……;o)
*particularly on ThirstyThursdays
*snicker….
BUTT … giggle
.. how about those energy plays… what what is you were telling me earlier while I was working like the diligent soldier I am…
Swift Energy emerged out of Chapter 11 today… Watch it ;$
Yeah, NOT EVEN CLOSE TO MARIA – lol
oh.. hilarious …I’m gonna start charging u2chartboy…
EARNINGS PRE MARKET AKS, TCK, and maybe FCX?
REN starting to look good. Just wondering, is that an inverse H&S on the weekly and is it threatening to break the neckline? And if so, how do you calculate the pricetarget if the neckline is descending? Thanks in advance 🙂
Ren is starting to look good. I do like that weekly. As for the inverse H&S, I can kind of see it, but trying to get a target from it may be tricky.
It actually looks like a $1.50 ish target, but it has to break out first.
Thanks a lot!
See what Cason said above about BAS!
Almost at your CLF target
Yes, I’m waiting for now.
CLF – I’m adding back here. I went to just a little light and left a bit more dry powder in case she drops more Tues or Wed.
Alex, what to make of BAS??? It’s frustrating as heck! Can’t seem to keep any sort of gain….
Looking at the chart, Seems to be the way it moves. big swings.
yup.. i bought a lil bit of this, and it swings like the silver rollercoaster.
i went away for a few hours the other day, came back and the thing had plunged & recovered in that time.
if id set a stop ( i hadn’t) , i woulda been chucked out.
ARGH!!!!!! AHHHHH!!!!! That is my official commentary on BAS.
CLF getting there. I have a 4.04 average. Not great. but not worry
What do you mean a 4.04 average?
CLF bought a little too high. I forgot I had a stop price at $4.04
vale is lookn tastey as well…
looking for 20EMA. almost there
Tasty at the 20sma
In my report , I used the 20 as a gauge, and that is below $5, so I like that.
There is also a gap on VALE and it can overshoot the 20 and then recover too. I’m going to mention in the report the gap.
Any worried about missing a move can start a partial under $5 and add if it drops further, as long as it doesn’t drop recklessly.
yes daddy
sxe – also lookn tastey
*darn fingers typed that wrong the 3times…
*giggle
Dont forget my BCEI 🙂
yes..still own that… want to add. … i like that chart… a lot…..
The wkly chart reminds me of LGCY wkly too.
Hmmm!
..yes.. didnt BITE yet..
MEOW
any thought from you guyz on CLD ? looks promising to me
RAY! I have that for my report tonight 🙂
And yes, I liked it too.
Maria, your Rexx’n is Flex’n in after-hours!
lol… i see that…
i actualllllllllllllly just had that up on a chart….
*me looking around for a webcam…
Hi all – new here. Just read through the report and don’t know why I have been ignoring the opportunity to join up, but here I am now.
I’m sure you’ve mention SDRL a number of times, but I don’t see it mentioned here and I am in it. Any thoughts?
Hey R Byram,
You’ll find that the comments section slows way down after hrs, but I just happen to check in before gathering some charts. nice to have you here.
I like SDRL ( And I think a few here own it too). IF you refresh your browser a chart will appear – It could drop to the 50sma , but I drew a more positive view. -Click to enlarge
Of course everything is connected to earnings and other surprises, so atay cautious .