
APRIL 2016 – REVIEWING THAT BIG PICTURE
Here at Chartfreak, we have always discussed the day to day market movements, trade set ups, and the bigger picture where things seem to be heading as time goes by. So in this weekend report, lets discuss the various sectors of the markets again, short term and the Big Picture scenarios.
.
SPX QUARTERLY – If you were subscribing back in January, you may recall this chart. I was pointing out the break below certain critical areas at prior tops never recovered, and I said we would watch these Quarterly, Monthly and Weekly.
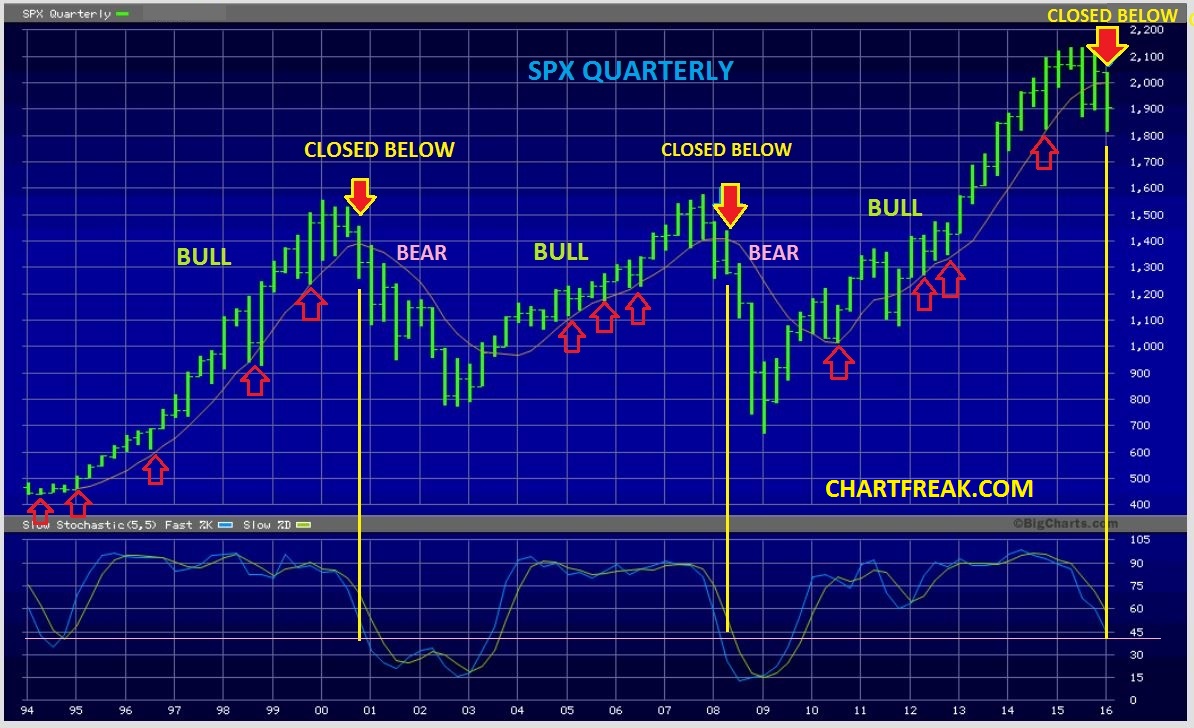
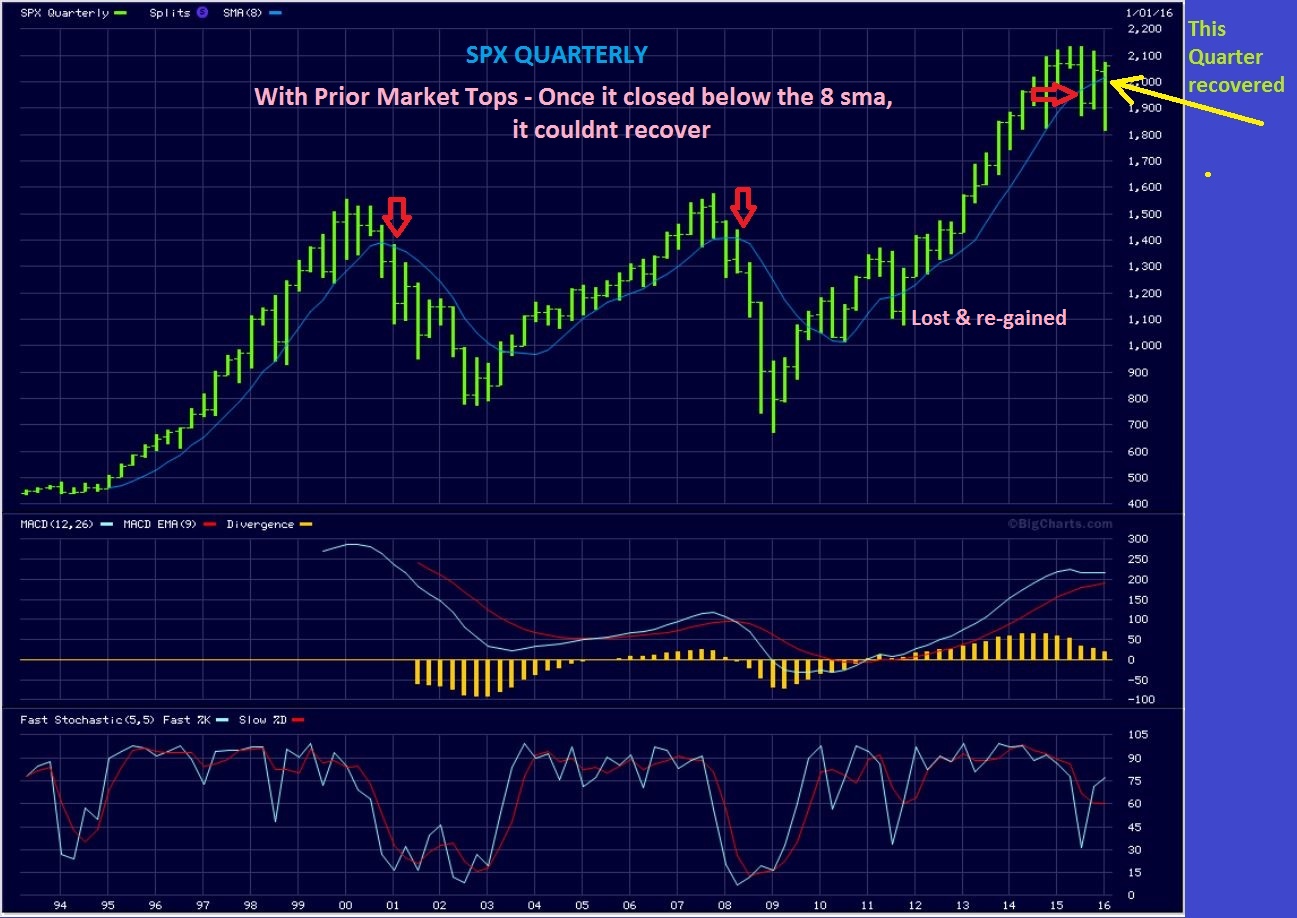
SPX QUARTERLY – The quarter has ended, so did that break down remain? Actually no, the SPX recovered by the quarters end. That did NOT happen during the 2000 and 2008 topping process. This would NOT be the time to think of shorting the markets. That could be a bullish quarterly reversal, and it could have follow through in the coming quarters..
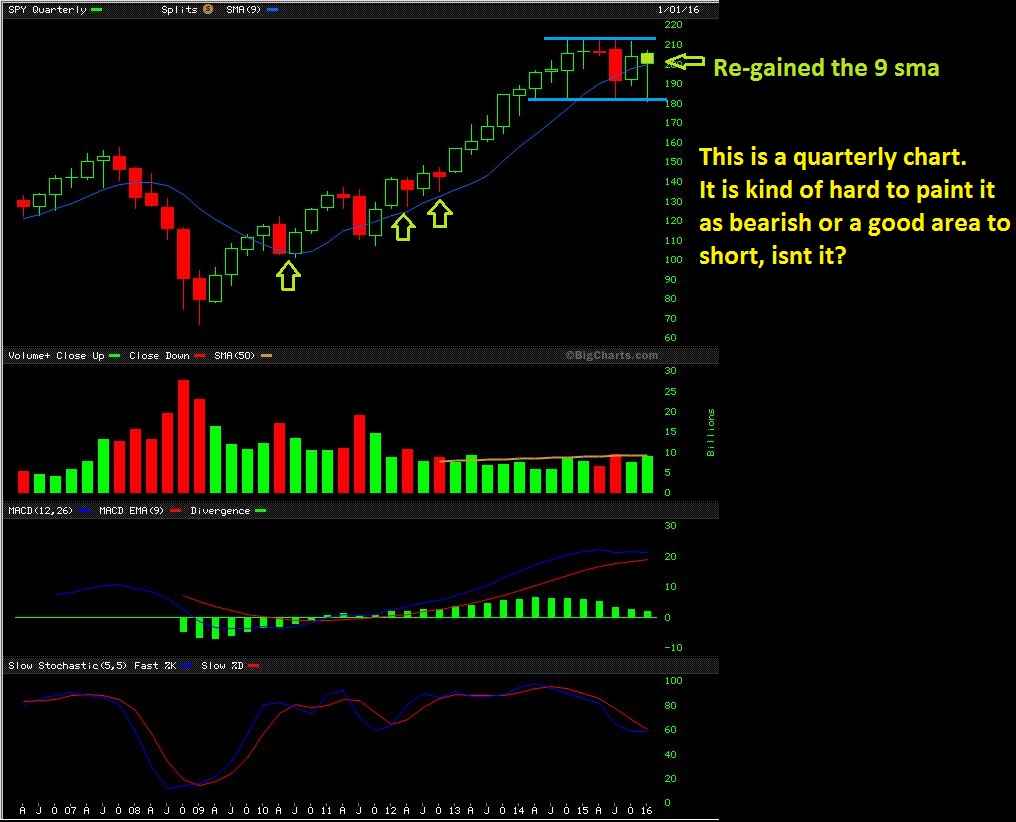
SPY QUARTERLY – This sideways consolidation is just that, at this point.
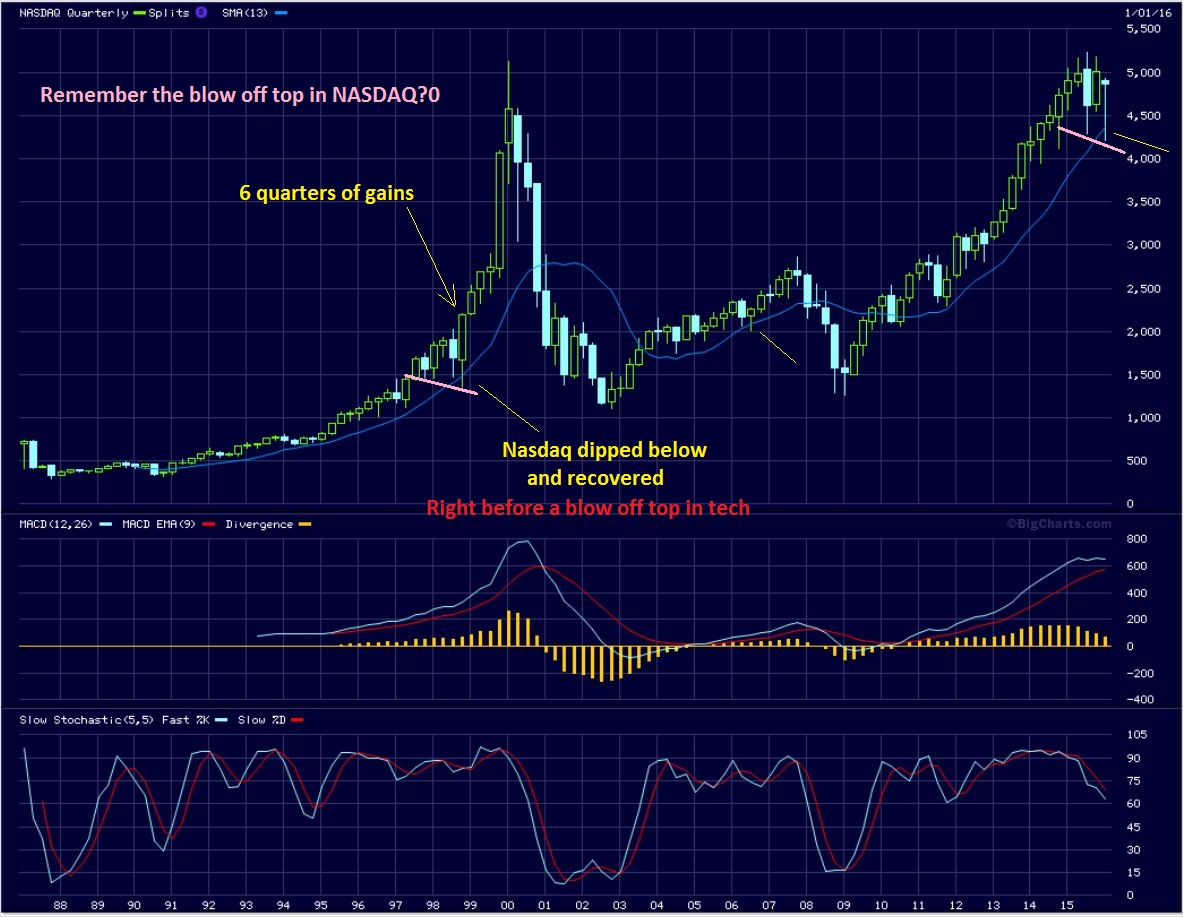
So look at the NASDAQ QUARTERLY –
Do you see on the left side of our chart how the NASDAQ rode the 13ma (Quarterly) all the way until 1998? It then did a shake out break at the pink line and recovered. THEN we then saw 6 straight quarterly gains because it was a blow off top to the Tech bull mkt. We have had a similar shake out/ reversal now. This means that we need to watch for a break out to new all time highs, or a struggle and continued topping process.
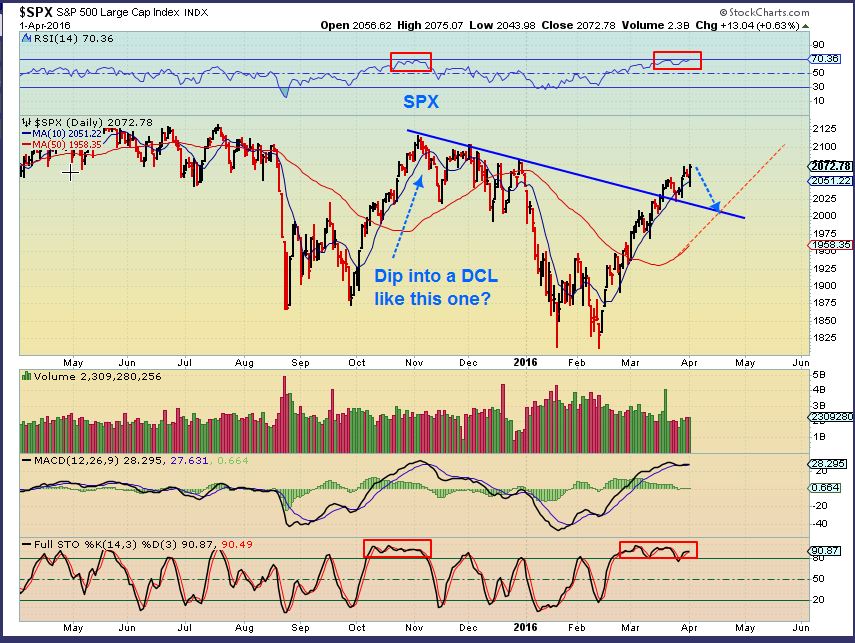
Friday – The markets keep popping, so have we seen a DCL ( that possibility was mentioned in recent reports) or is one coming soon? The conditions resemble the top in November. A little more time will clarify. If this Drops to a DCL and then takes off to new highs, we could see a much more bullish big Picture view (And plenty of time to react to it). The 6 quarter blow off in 1999 was CRAZY.
BIOTECHS
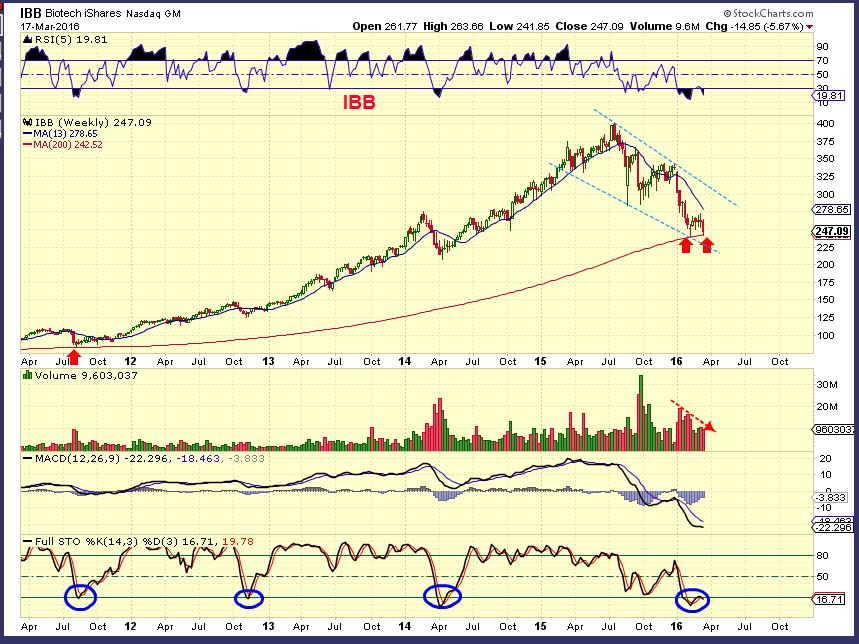
From March 17 – The weekly could have bottomed here, oversold and volume selling drying up.
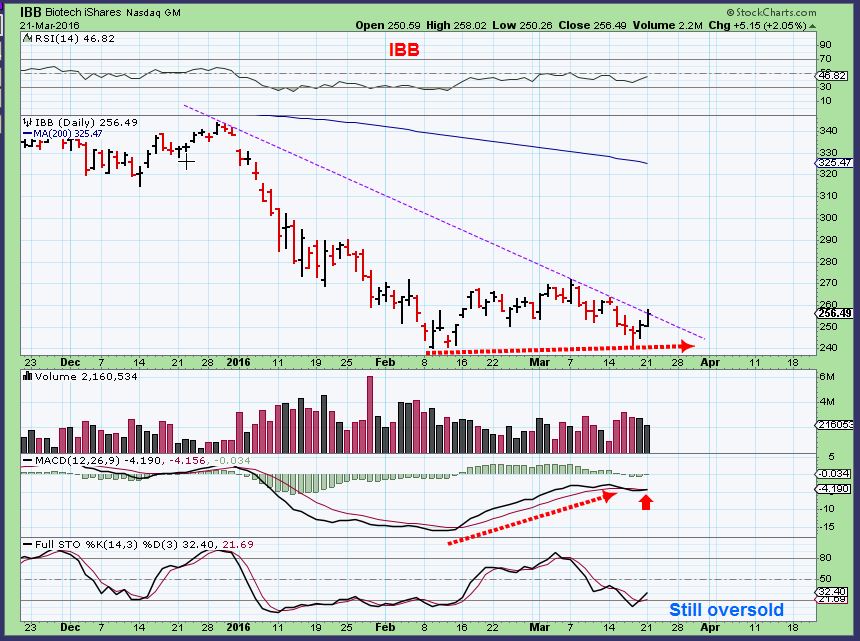
We’d been discussing the BIOTECHS as a possible double bottom. ( A low risk entry) This was my March 21 chart.
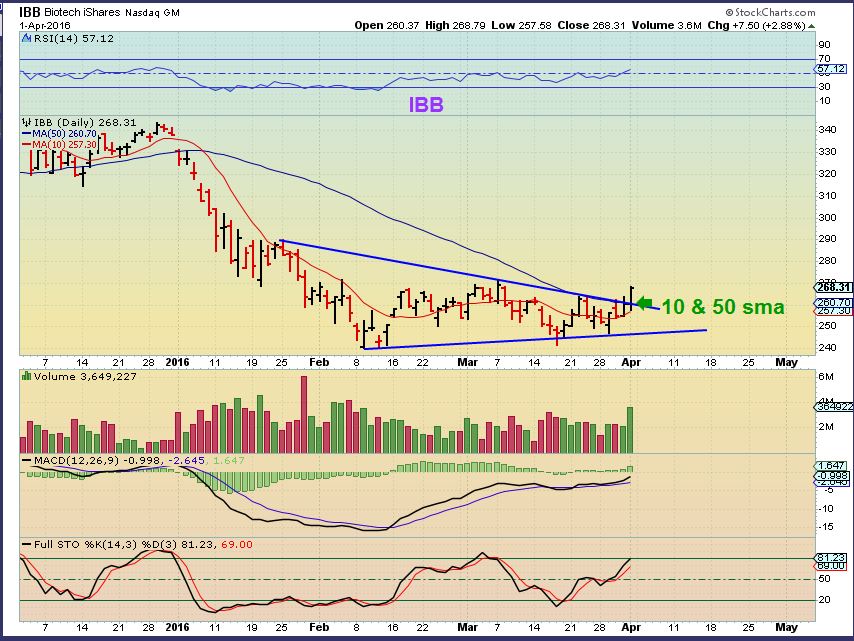
IBB FRIDAY – A break above the 50sma with good volume. Low risk too, with a stop below the 50sma if someone wanted to do it that way. We now see that the ‘double bottom’ before March 21 was part of a bigger base. We need to realize that that could continue, if this is a false break out.
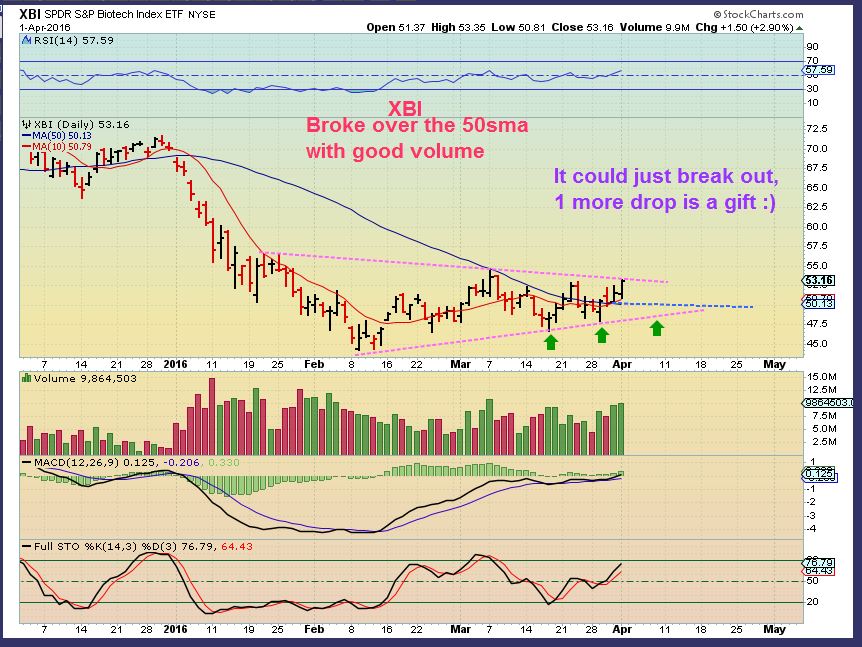
XBI – We have a break above the 50sma with good volume. Low risk too, with a stop below the 50sma if someone wanted to do it that way.
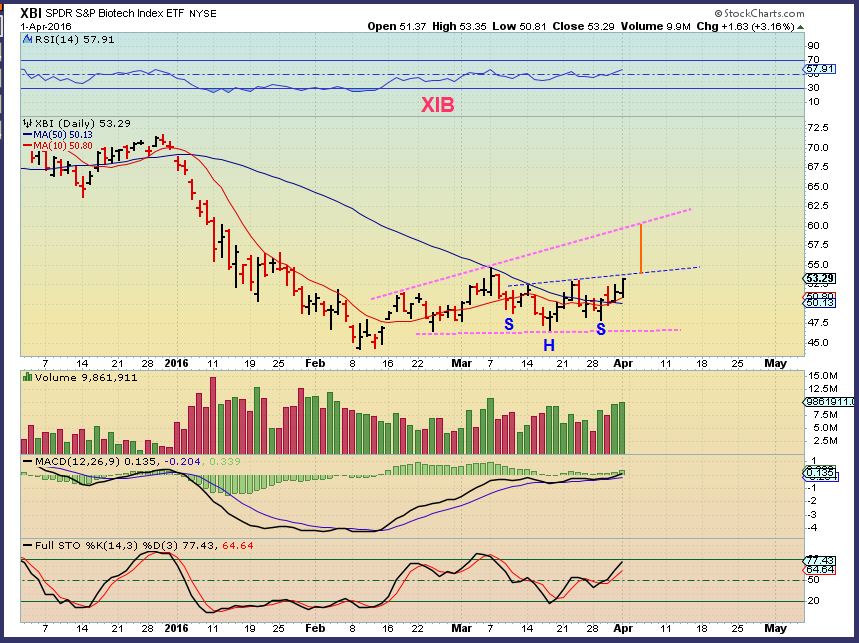
XBI – Same exact chart as above, only I add the bullish inverse H&S view. This inverse H&S is not confirmed until it breaks the neck line, but upside could be rewarding.
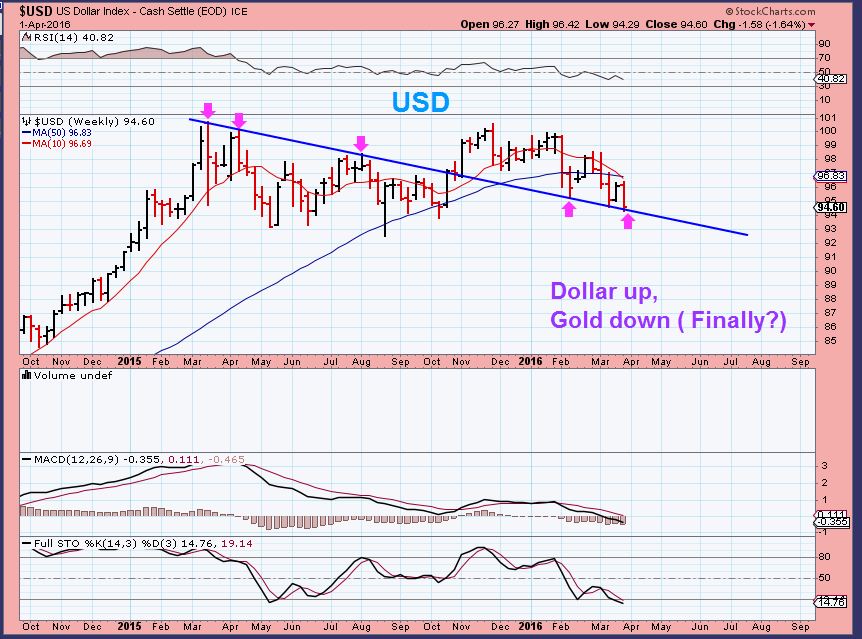
USD – I pointed out that if we dropped to the bottom trend line, the dollar could bottom and Gold could finally pull back in a more meaningful manner.
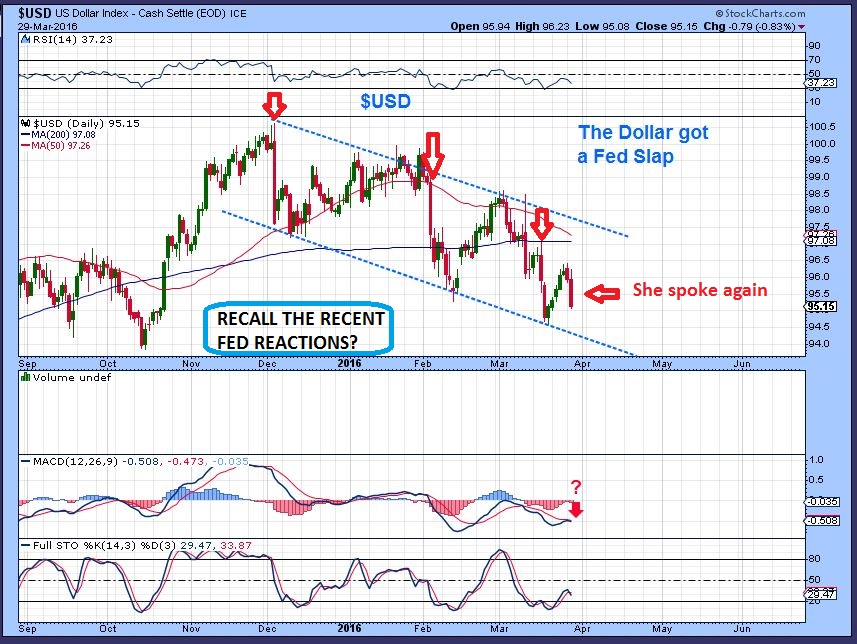
Friday – We may now see the Dollar move higher.
.
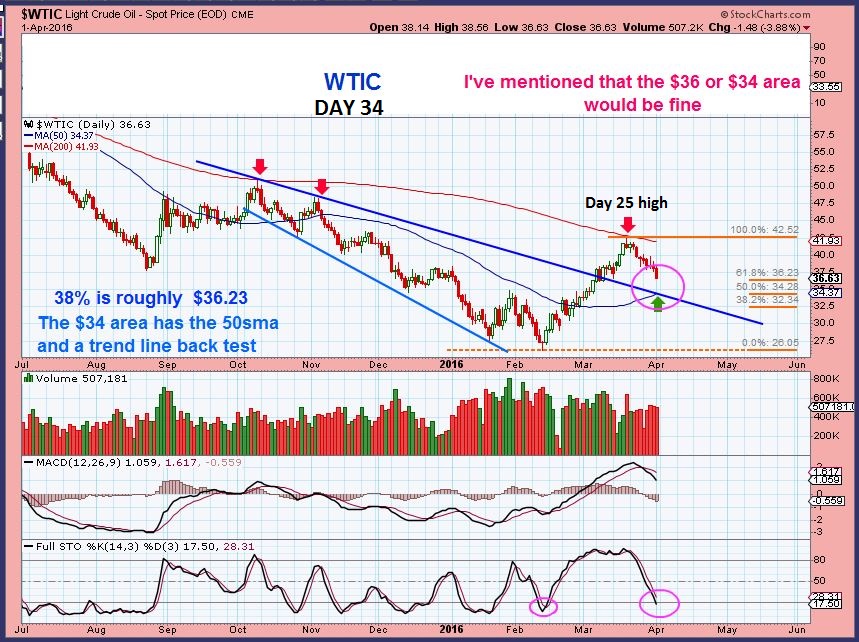
WTIC – I have been waiting for a drop to the DCL and discussed how long these daily cycles in OIL can be. I also said that $36 or $34 would be good. We are just above $36 now.
When I look at this chart, the 50sma is at the $34 area, a 50% retrace is in the $34 area, and a trend line back test is in the ….$34 area. I’m watching the Energy / Oil sector patiently.
.
CRB – I think that the commodities look good and are acting correctly. I will still show 2 Bullish charts and 1 shorter term semi- bearish.
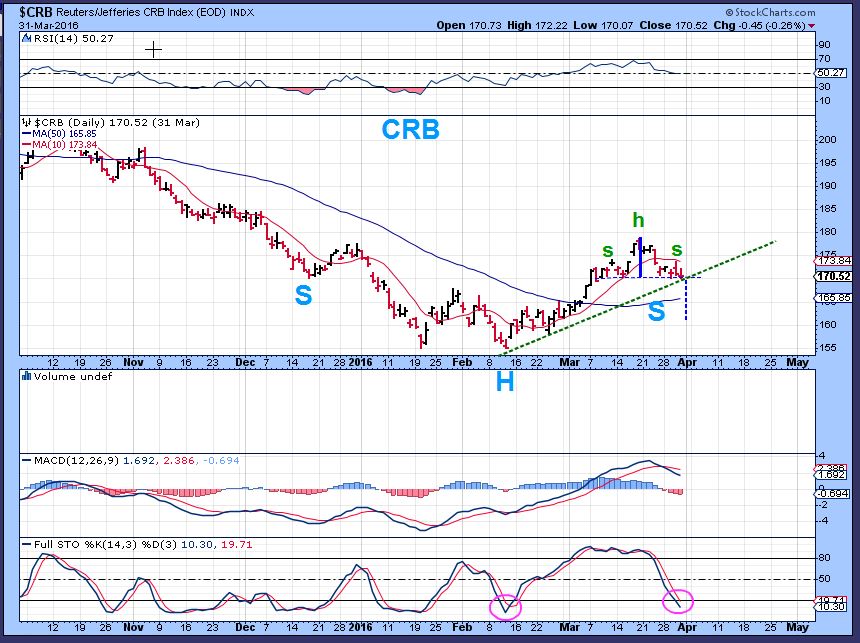
THURSDAY MARCH 31 – Short term semi-bearish mini H&S that I saw on Thursday. A drop to test that base area, a dip below the 50sma (Shake out?).
.
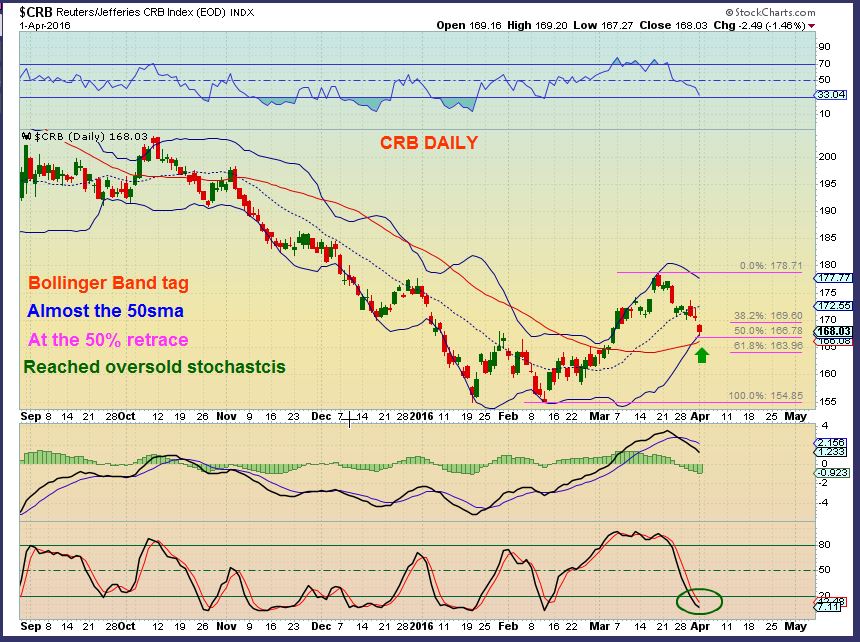
The CRB did drop Friday, and now is hitting the lower Bollinger Band . Also the stochastics is now oversold.
The 50sma is right below price. Can we get a move higher please?  I have mentioned that I still like the charts of X, AKS, VALE, CLF, FCX, CENX, ETC ETC – so a move higher could help them to move out of their current consolidations . Read the left side of the chart.
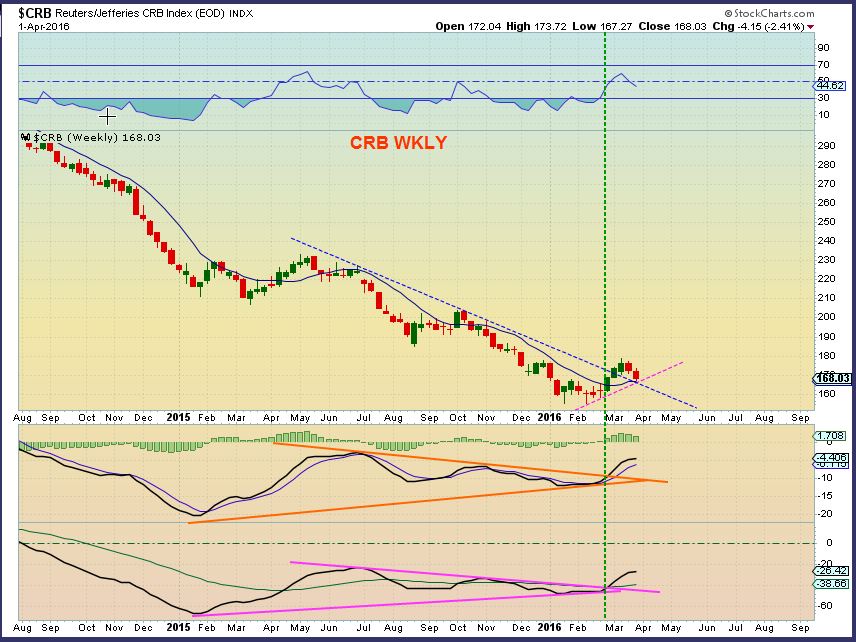
CRB WKLY– The Bullish buy signal from Feb lead to a break out and now a possible back test. X – marks a good spot for price to find support.
 .
.
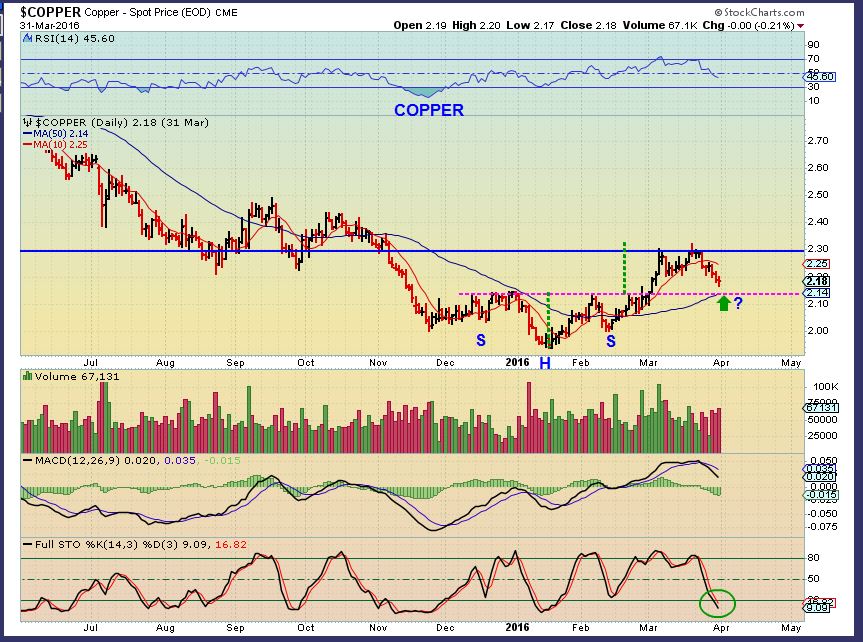
At the end of Feb and beginning of March – I was watching an inverse H&S for Copper. I posted this chart of Copper in addition to the CRB
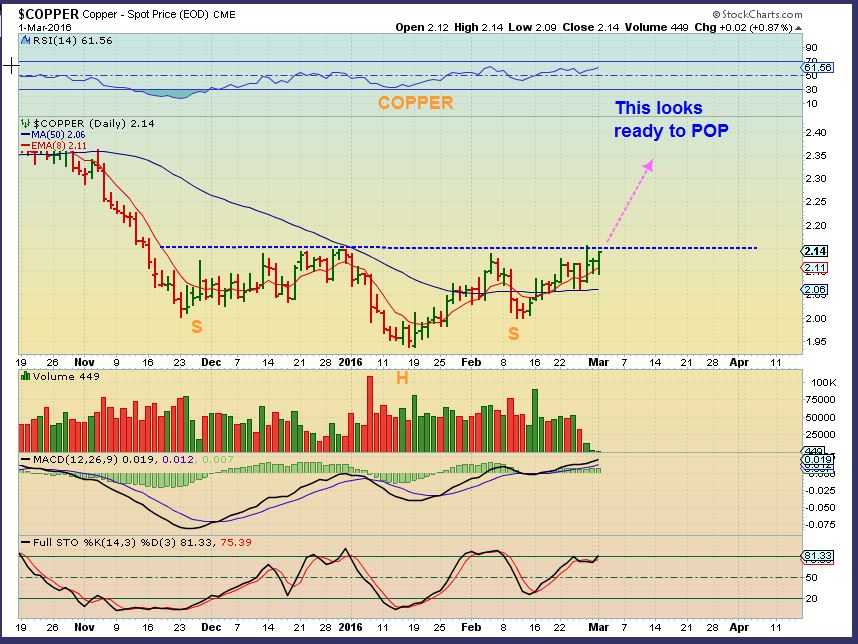
COPPER – It did break out and acted properly, and is now pulling back after hitting resistance. Copper is now oversold on a weekly too.
.
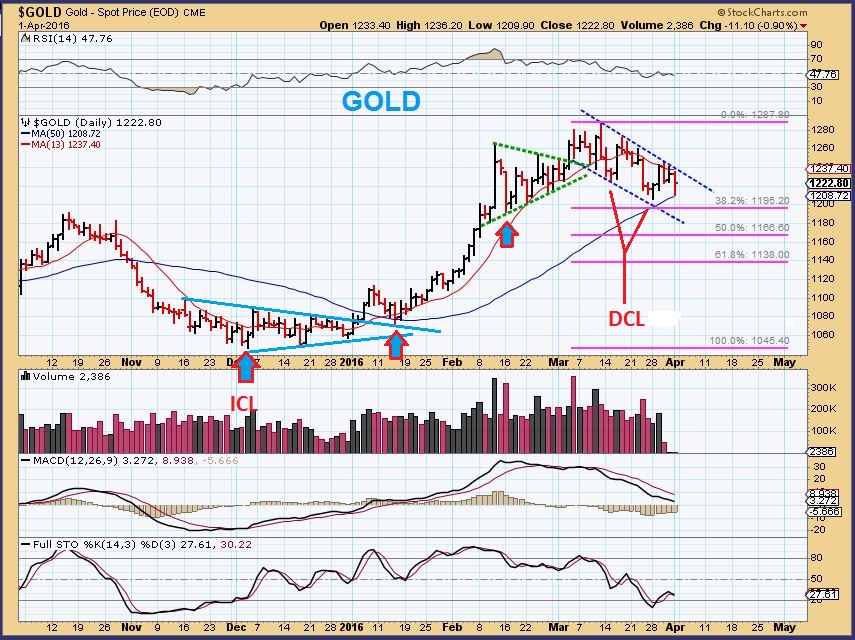
GOLD
Gold is basically going sideways or topping as time goes on. There is nothing wrong with that. I am trying to exercise patience and keep an eye on things. In a final daily cycle, price can drop quickly. Are we there? Price also can keep going sideways for a couple more weeks, so why not just watch it? Gold found support on the 50sma Friday. That may or may not last.
 .
.
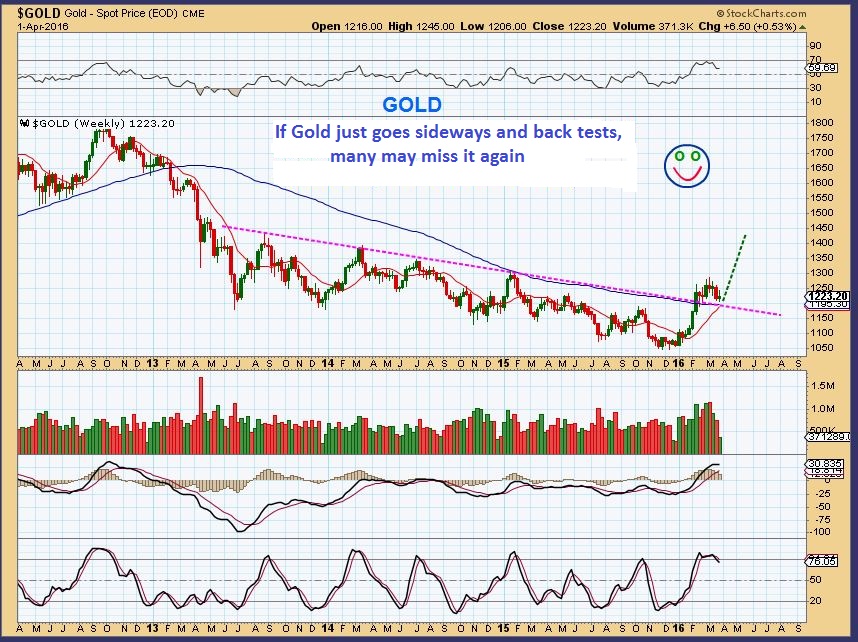
GOLD WKLY – Waiting for a big dip may cause many to miss the next leg up, so we are remaining open and unbiased to all possibilities as this plays out for the next couple of weeks. A reminder is that the dollar could be ready to POP, that might weaken Golds ability to hang in there.
.
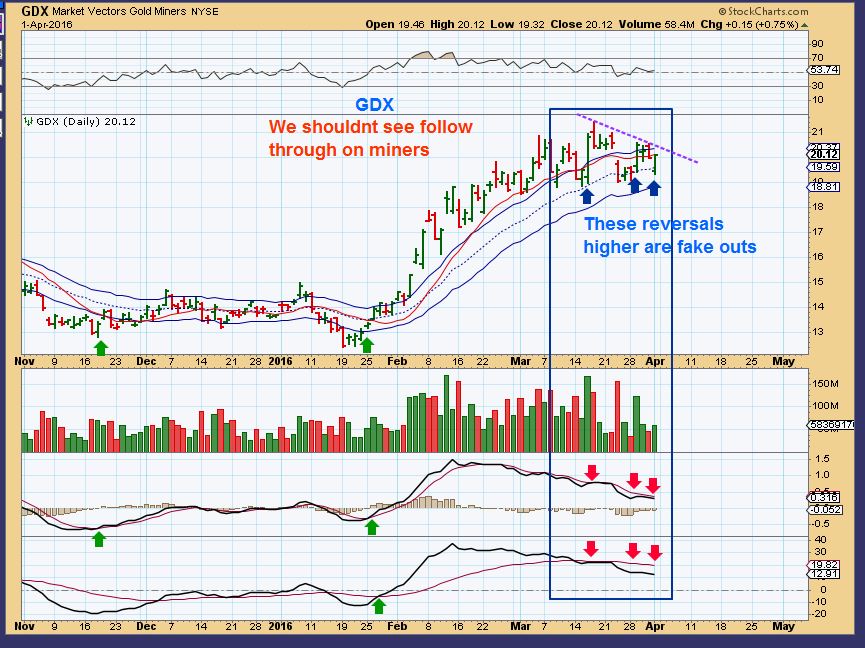
GDX April 1 – Miners are hanging in there with reversal after reversal, but my lower indicators aren’t impressed yet. I dont think this move will break out above the purple line. I am being patient before heavily investing in Miners, but I am watching things constantly. MINERS tend to drop into a daily cycle low right at the end, but could they just go sideways? Or do they need to drop a lot?
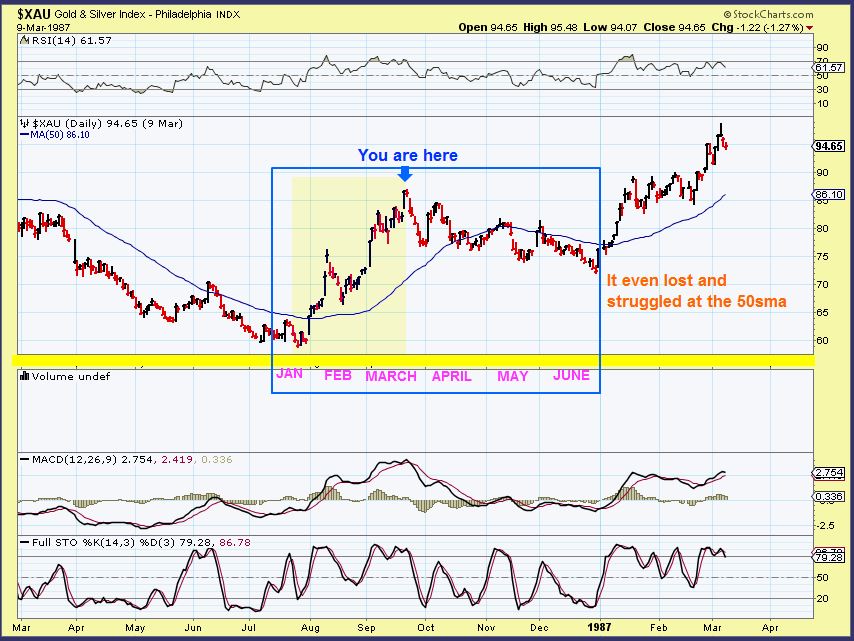
Look at this drop into the ICL in 1986. This went fairly sideways, probably driving people crazy for Months, struggling at the 50sma.
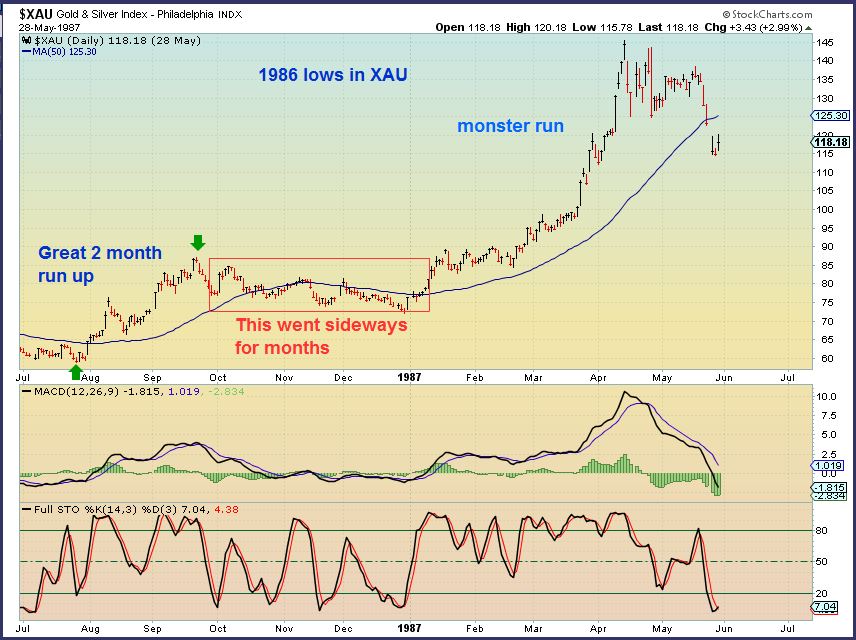
Here it is again, sideways for months above & below the 50sma. People likely got bored and so sick of miners. Dont get so bored with Miners that you give up altogether. Hang in there, that next run was HUGE. Maybe we’ll see that again. 
.
So now we get to see what Monday brings. Biotech looks like it’s breaking out, we will look for follow through. Without follow through, you can get a false break out above the 50 and then a quick reversal. Then the basing process of the past 2 months can continue. I only say that because buying that 3x etf LABU at lows 2 months ago has been dead money / bad timing. The break above the 50sma Friday was still a lower risk trade, because the upside potential out weighs any downside with a stop. Good follow through will be a break out from its base. That could lead to a strong run higher. Staying inside of the base could just continue up & down sideways. Monday may help us to see a break out from the base.
I like the commodities, they are still acting correctly. I think OIL is dropping into a DCL and will present a buying opportunity soon. I think GOLD & MINERS will be dropping into a dcl for a buying opportunity in the near future too. That means that things are lining up in various sectors for now. For some, trading has already been good, but others are just content to wait for Miners or Energy stocks again. For those waiting on these proper set ups, this time period may be boring and require patience. Keep in mind that when the consolidation is done, we should get another run higher. Those strong % – gains lasted for weeks and I do expect that kind of run higher again.
.
Have a great Monday and Thanks for being here!
.
~ALEX


Hi Shermo,
I have such a mix of traders here, its impressive.
Some buy the lows when cycles point out that the lows are due , some wait to buy the dips after the initial run higher ( 1-2-3-4-5, they buy the ‘2’), others buy breaks above the 50sma, and still others buy backtests if the occur , and some buy inside bases with a stop at the lows , or break outs from bases. All valid in my book.
I do have some that are looking for confirmation of a trending move higher, and I am impressed with the patience of some here in that boat. Not just wanting to dive in at any point because they feel the bull market has returned and Miners arent pulling back much, they are actually watching and waiting for a good entry. I think that they will be rewarded well.
If the Bull market in Miners ( and commodities) has returned, there is a lot of upside, for years to come. We’ll see what the rest of the market brings with the Biotech base action and the quarterly recovery. Very interesting times in 2016.
well said Alex.
do you have any idea, how the market (metals) will react on Wednesday. FOMC minutes are going to be released.
I dont know if you mean Precious metals? Commodities? you said ‘Markets’.
Like I said in my report- Precious metals are due for a drop, but lately the FED moments have acted rather bullishly for Metals & Miners.
I am expecting a drop in GOLD/SILVER/MINERS at the beginning of April regardless of what the fed says. Timing wise, we are due for a drop into a DCL.
I think the Fed speaks Thursday too? Its a Fed week of activity this week.
thanks Alex. I am in LABU (22.75 to 25.00). Bit scared of holding till Wednesday. What do you think…
Great report! Can the dollar and oil be both bullish at the same time? I’m watching both but can’t pick one! 🙂 What do you think?
Hi Zoli, Thx –
Well, to answer your question: if you look at the summer of 2011 to the summer of 2012 both the dollar and Oil were rising ( Oil went from roughly $80 to $110, the dollar went from 72 to 85 . SO they can run together.
At this point (Short term) I feel that the dollar is going to bounce or move higher, but I’m not thinking that it breaks to new highs. I think it has put in a double top, and then next steady drop will help gold/Miners/commodities in the longer term.
OIL still has time to drift and drop as it has been, so I don think OIL is quite ready for a long position yet. It’s close and it could be the $36 area that holds it up, but OIL really looks to me like it wants to get down to that $34 area ( who knows for sure though right?).
So I am waiting for OIL to bottom to play energy.
Awesome, thanks Alex!
BIO Med appears to be the real deal. Sector moving higher. You all know I’m in LABU, RPTP and SRPT for a week now
It is a nice set up.
PETX has been a sweet run
Alex, FYI, I’m still waiting for your advice as to when to get back in the SP500. Patience for now?
Well, you know that I was calling for the rally from the Feb double bottom lows, right? See the attached charts. That was when to get back in for the next short term rally . I expected that that was an ICL, and could rally like OCT into Nov did. 2nd chart attached.
So I’m not quite sure – Did you get in then and then sell at the recent top? Now looking to re-enter? In my mind, that was the first daily cycle out of an ICL, so it was right translated and I have been saying recently that I expect the 2nd daily cycle to break higher than the first daily cycle. Then we could see if the correction continues or was that it. ( In Dec 2015 – I thought the markets were topping for a deeper dip, but recent signs do show strength to the rally out oif this ICL).
AS THE 2ND DAILY CYCLE plays out, it should become clear if we are getting a strong break to new highs and that was just a 1 yr sideways correction….or is it breaking down. MY SPY QRTLY chart in this report shows a 1 yr correction may have occurred.
The quarterly recovered this time, which it did not in past tops. Thats another sign of strength for now.
So I’m not sure what you mean by you are waiting for me to tell you to get back in. You mean long term? You could have entered at the ICL in Feb with a trailing stop for the rally, and then see if it drops later. I was thinking that the markets would continue to correct, but that quarterly chart looked rather impressive.
I posted a few times, that I have some cash in a MM account in a 401k. I was looking for help determing a low risk entry into a SP500 mutual fund. The past month you have been talking about this rising wedge, and how it could break down.
Right, and it did break down out of that wedge . Then went higher.
Are you talking short term or long term? It will be a while if you are talking buy & hold for months. If you are talking about short term trading, that is different.
I want to just find a good point to invest an leave it there. Dollar cost average into it.
Ok, thats longer term. The hard part on that is that to know for sure whether the SPX just put in a 1 year correction and then will resume the bullish run, we may need a break to new highs.
It’s mixed right now, some feel we will resume the bull and break to new highs, others think this is a 1 yr topping process that will resume downward. I see that Quarterly chart and it was an impressive recovery from the corrections drop.
Attached is a chart 1 yr 3 months long. We are at a point that will help answer that question. See attached chart. If we drop into a DCL as shown, similar to last OCT / NOV, that could be a lower risk entry, but we still may only rally in the 2nd daily cycle and then roll over- so a stop would be necessary. IF the Bull is to resume, I would expect the rally in the 2nd daily cycle here would break the blue line above and go higher. That would be another indication that the market is strengthening.
Its still step by step for now, but I always ‘trade’ my Longer term positions at the start. I buy / trade at the lows and hold some as core once I get higher price. ( Like Miners in their recent bases. I buy them to trade and end up holding a core if things morph into more of a bullish big pic look. ).
.
Thanks
DCL Might be coming up now…
mornnnnning glories :o)
good stuff CF — a lot to study… dang
sweet ‘x’ marks the spot chart…
Hey Maria – yes, I’d like to see the CRB hold up right in this area, but it could drift down that blue line a bit if the markets have a pull back.
szym?
I do think it is holding up in this area. It has some good support. Rather light volume today so far
NATGAS continues moving higher. It rested on the 50sma Friday . Forgot to put it in the weekend report.
Some Interesting Energy charts.
With Oil pulling back lately, these have held up nicely ( Along with some others) . = SWN, HK ( on 34 sma) , SM, MRO, COG, VLO, BBG, BTE,
Crytal Blue Persuasion. 5.75%
IDRA & ZIOP charts look decent . One is a nice base and the other is a higher low.
There are many nice set ups actually.
PETX, LJPC, HALO mentioned in earlier reports.
LONG BASE on CEMP and INSY
And what would happen if SRNE goes back to $400?
I think they did a 1:25 reverse split, but if it goes there and you own it, we’ll visit you on ur own private island?
I did a ‘Bill’ and sold my LABU too early. But I wasn’t making a 2nd round trip on the same trade. 😛
I was trying to be clever. I thought it was Crystal who suggested BLUE last week? Was it you Cason?
*stick to your engineering job…
meeeeowwwwww ….
congrats on being .. up … ;o)
Thanks for that! I don’t have BLUE, but I remember Crystal had it. Geeezz.
Cason, and now I’m an adjective for selling early? 😉 Okay. I’m still in LABU?
welll …. I have an idea … oh nevermind… 😉
*wink
Is that Hally Berry?
Of course… special just for u
Thanks for both of them
Yes.. very nice 😉
goes something like this…
doing a Bill = selling too early
doing a SOG = buying too early and/or selling a bottom
doing a Cason = buying a top
heyyy… sog … u 4gottttaboutme… ;o)
maria… searching out rounded bottoms… yeee haaaaahhh …
Louise/crystal – in Spain .. also searching out bottoms
nancytheartist- painting (nude) rounded bottoms for mardigras
etc….
*reminds me … darn .. i must dig out those old mardigras pics… funTimes ;o) whewww …
didnt include you though, coz i wasnt aware you had any trading maladies… (only going on Cason’s word for Bill, too)..
no doubt all your bottoms will be perfectly round
pfff.. i have PLENTY of naughty habits….
*snicker
that goes without saying.
but actually.. your only trading vice is your crazy leftfield EW labellings 😉
giggle…
Left Field…That makes sense now.
I told her to try some Elliot Wave that was a little out of the box. I guess She left the batters box and ran way out to left field with it .
J/K Maria – no angry faced gif necessary
clearly baseball season is underway…. 😉
i played short … not left 😉
LOL!
Funny stuff, can’t make it up.
btw-i cant get this song out of my head …..
https://www.youtube.com/watch?v=XDl8ZPm3GrU
nice… 🙂
Well my favorite mining stock Lakeshore is officially gone, gobbled up by Tahoe Resources. I’ll likely be selling some of that and rotate into some of my lower priced PM stocks.
That was a great run, one of my favs recently too. It wasnt selling off when the bear was.
CLF, VALE, FCX really testing my patience! ZIOP nice though.
I understand, that could be because CLF, VALE, FCX are still in consolidation phase. You could sell and wait for the next run, but…
Look at a chart of CLF for the whole month of FEB – same up & down consolidation phase and we were in it. Then when it took off, many couldnt buy without feeling like they’d be chasing it. It actually doubled in 6 days.
SO I buy the consolidation or pull back & wait for the next run up. It does take patience, and sometimes it breaks down and you feel like you wasted your time, but sometimes you double your money 🙂
They take time, but those charts look good to me.
Thanks, Alex:) Being patient but not liking it too much lol!
MEEEE EITHERRR! 🙂 Too many false starts
Its like playing baseball – you’re waiting at 2nd base and then next batter keeps fowling them off.
Hit one outta here for goodness sake, so I can bring it home!
I’m in VALE and CLF with you. C’mon! Git ‘er done!
CF what are your favorite oil stock etf’s to work with after we bottom?…..XES, XLE ?…..any others?
GUSH?
Thanks Bill.
You dare devil , rebel 🙂
What about XLU?
$41 to $50 in 3&1/2 months. Thats too slow for you , Bill ; – )
It has an odd relationship to OIL?
Those work, I kind of like the way XES is setting up, but I dont trade either personally.
Tech-wise : TWTR, GRPN looking good for some reason.
Oh, and those 3-D stocks still holding up. Especially SSYS looking good today SSYS, XONE, DDD,
Taking a new position in POT today…as the time to sow in upon us…based on seasonal trend. I’m thinking as long as it stays above 16 it’s good to go, but would appreciate a quick chart read.