
She Said What?
I heard that Janet Yellen had lunch on Tuesday and spoke quite a bit about…never mind, lets just say that she spoke quite a bit.
Some things that I heard seemed to contradict other things that she said, but we see from the moves mid day onward, the markets received it positively. There are some very interesting developments…
SPX – This chart was from the march 18 wkend report. A rising wedge that needed to break down. I expected a dip after the recent run higher to a daily cycle low maybe in early April, and then we have to see if this can break out – or break down. The markets did start to dip, but Tuesdays FED chat added some push to the markets. Lets discuss this …
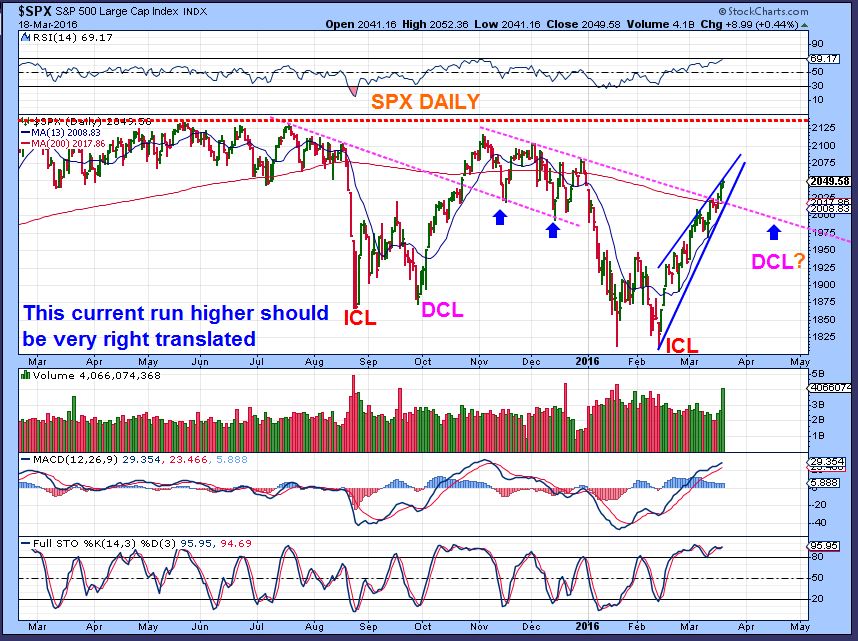
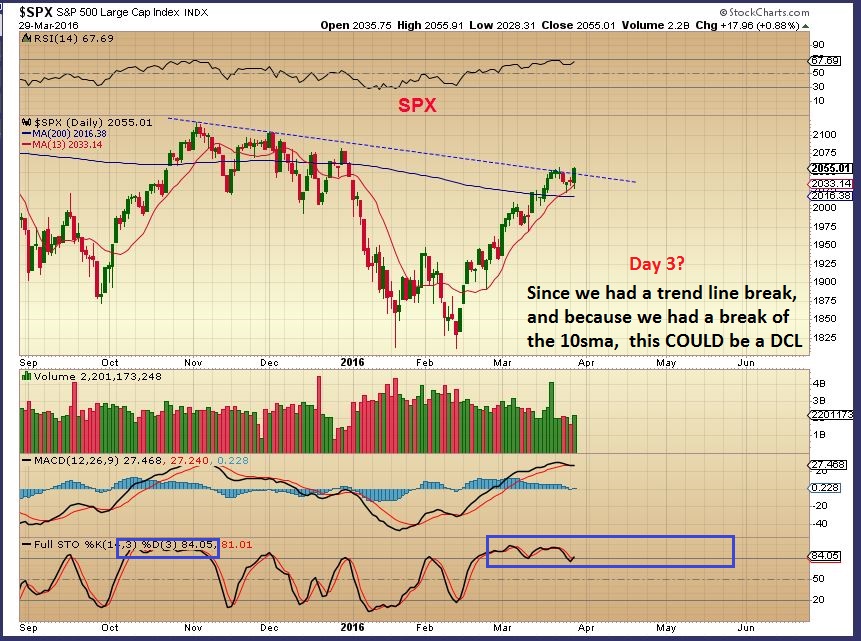
SPX – After dipping to the 13 sma, we had a break of the trendline and the 10sma. I usually look for that as we dip to a dcl. COULD THIS BE AN EARLY DCL, caused by hawkish Fed Chatter? I think this might be day 3. We also could POP & DROP, breaking that overhead trend line. Lets discuss even further…
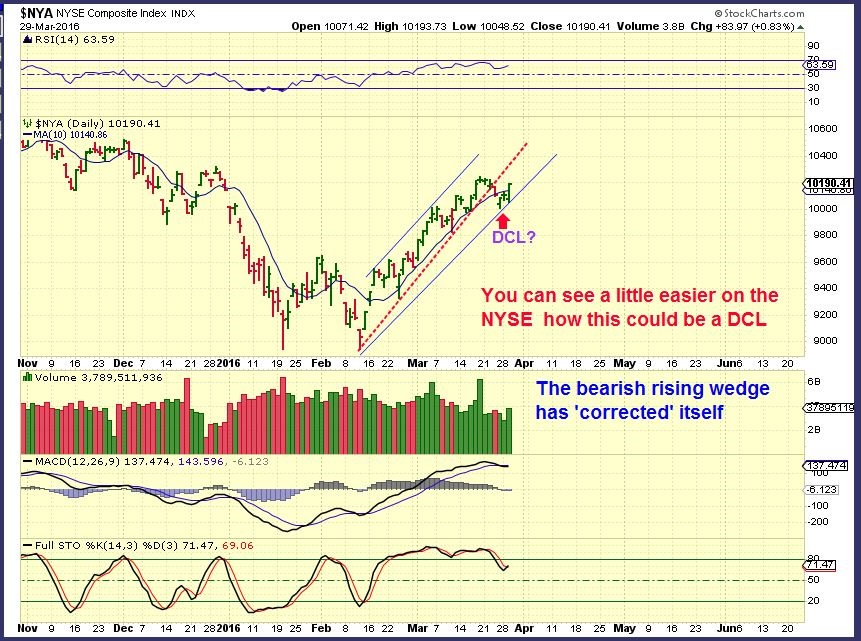
NYSE – You can see it clearer on the NYA chart. The dip corrected the rising wedge. It may be a little earlier than normal timing-wise for a dcl, but with such a Right Translated daily cycle, the dip could be a very shallow DCL and the strength could continue moving markets higher.
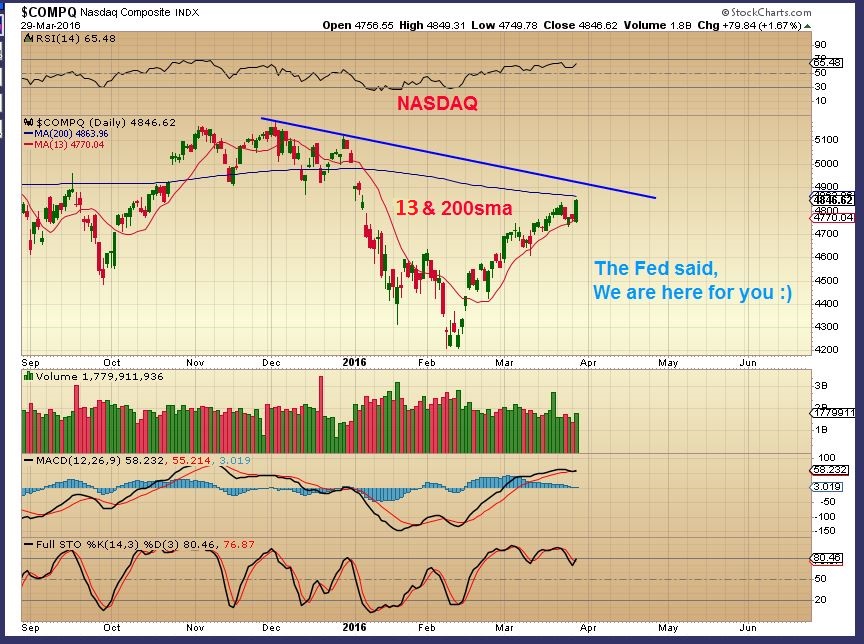
The NASDAQ – It has lagged a little, pinching between the 13 & 200sma. The Fed said that they are there and the markets reacted bullishly. The overhead trend line could break today.
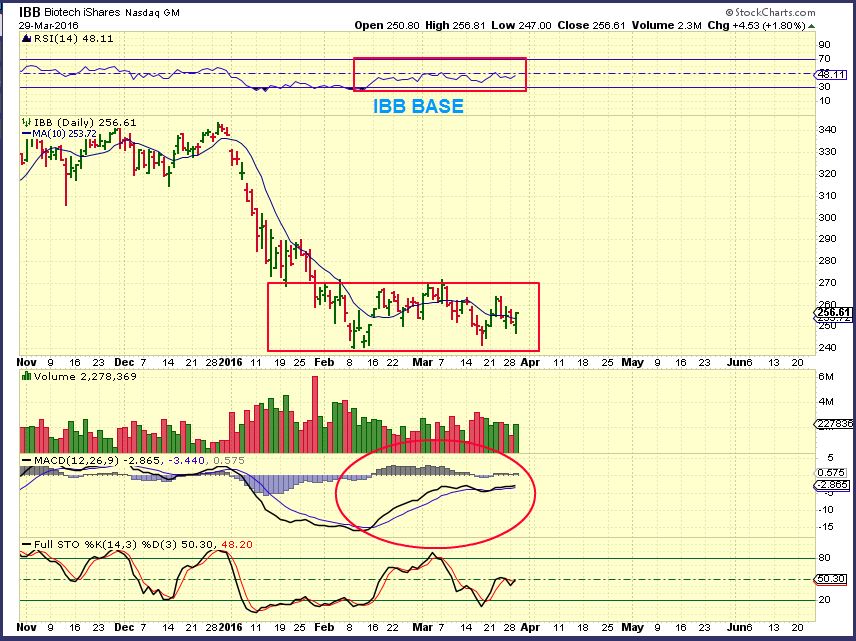
IBB – This was selling off Tues morning. Now it looks like it may be ready to start a bullish move higher out of this base.
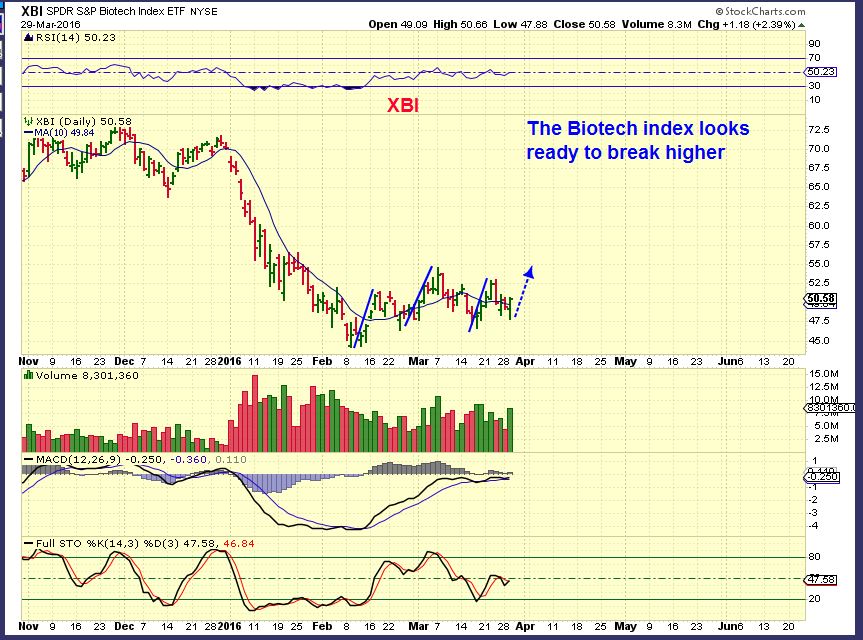
XBI – This was red all morning until FED YELLIN had lunch. Then we saw a bullish reversal.
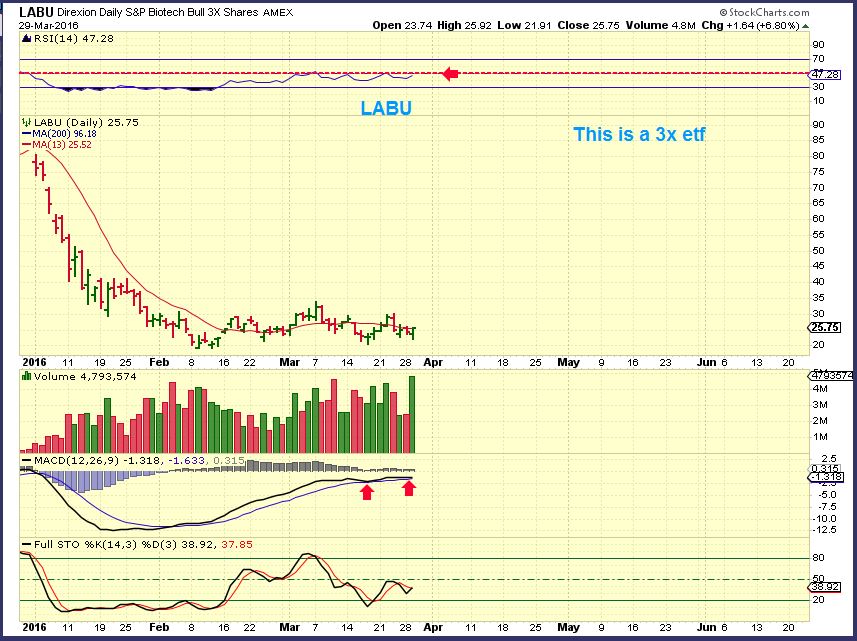
This chart of LABU is by request. So I request that you realize that this is a 3x leveraged ETF. It moves 3x what the IBB or XBI does. Notice that they were up about 2%, LABU was up almost 7%. This moves in BOTH DIRECTIONS, UP & DOWN, I think that it should only be traded by expereinced traders in front of their screens. You are on your own. This is like NUGT & JNUG when trading GDX & GDXJ.
 .
.
So – I looked at various charts to see if they looked bullish or weak. Many look pretty good. You can look up YHOO, AMBA, TASR, FB, AMZN, GOOG, ARWR, XONE, VJET, SSYS, ETC. ETC.
.
Do you remember when I pointed out how the USD has been reacting to the FED lately? I showed this on March 4th.The FED speeches have been dropping the dollar.
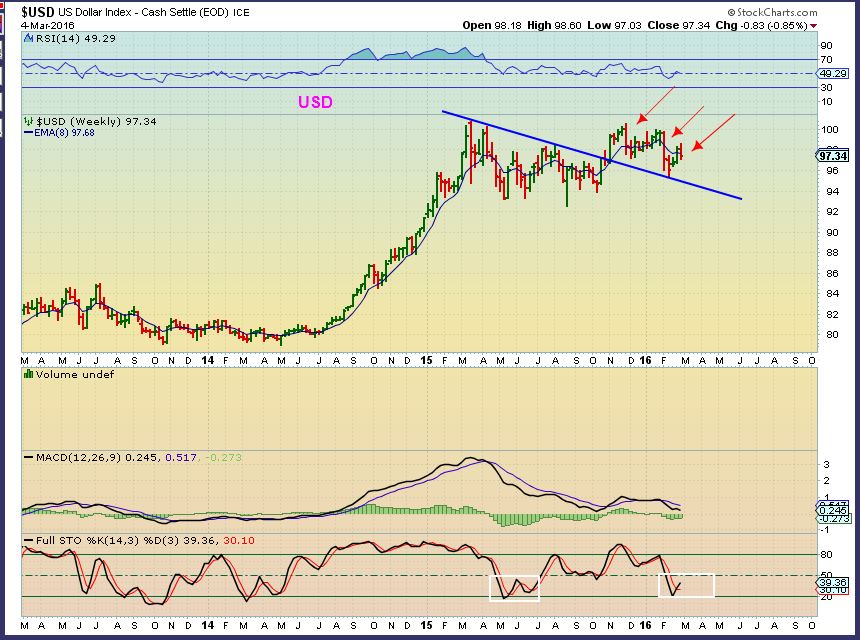
I expected our last FED mtg to drop the dollar , shown here on March 11, and it did happen.
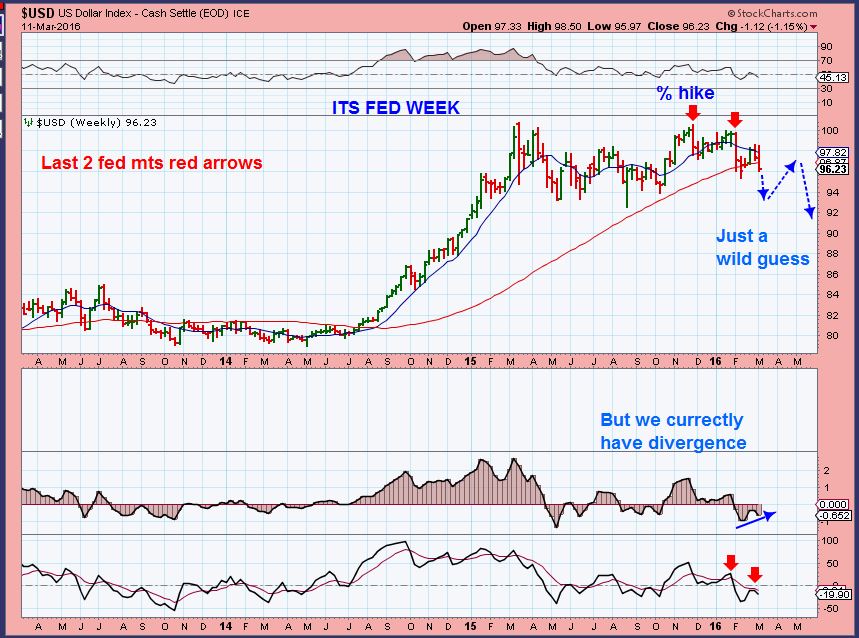
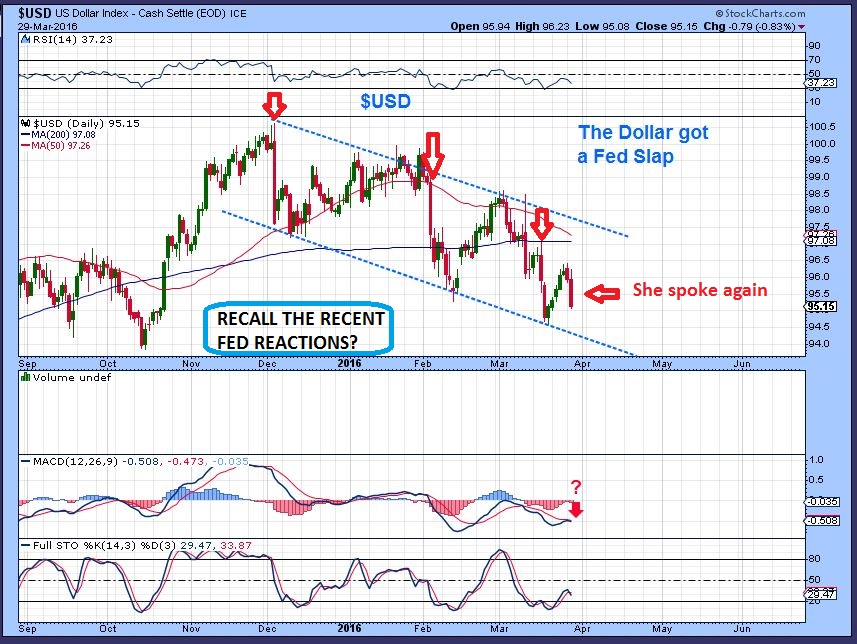
USD – Tuesday Janet Yellen started talking shop at lunchtime. Same results. If the USD breaks down here, couldn’t GOLD make that rush to $1300? I’d have to say that it is possible. If The USD holds that line, Gold may do something else ( Pop & Drop), so I’ll discuss it in the Gold section. Obviously nothing has become clear here in the middle of these moves with that FED luncheon .
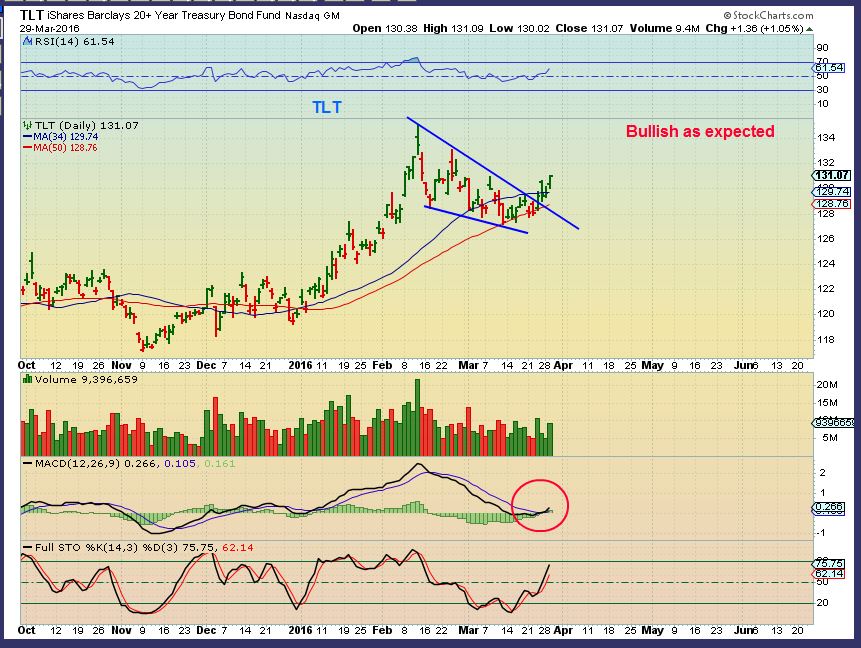
TLT – No change, Bullish as expected
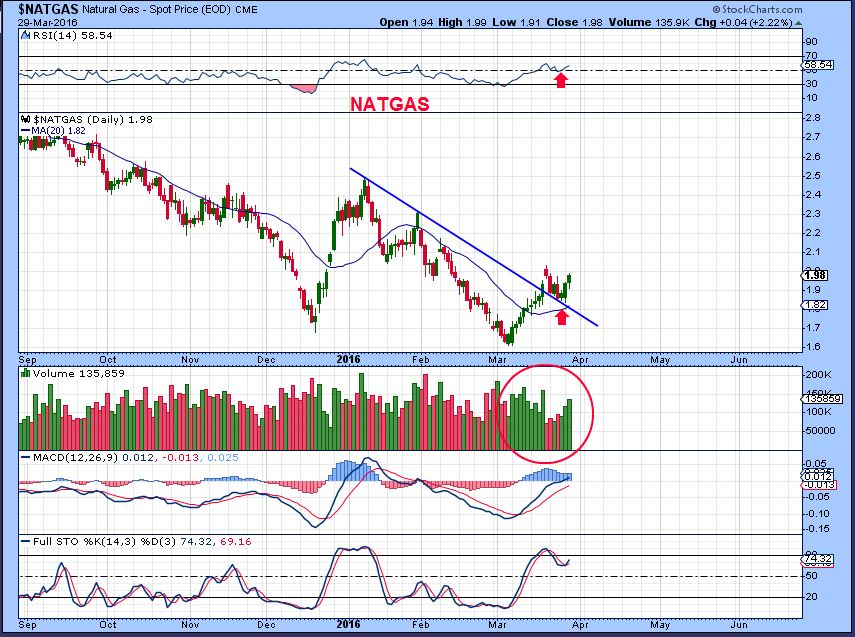
NATGAS – No change, this is what I have been expecting.
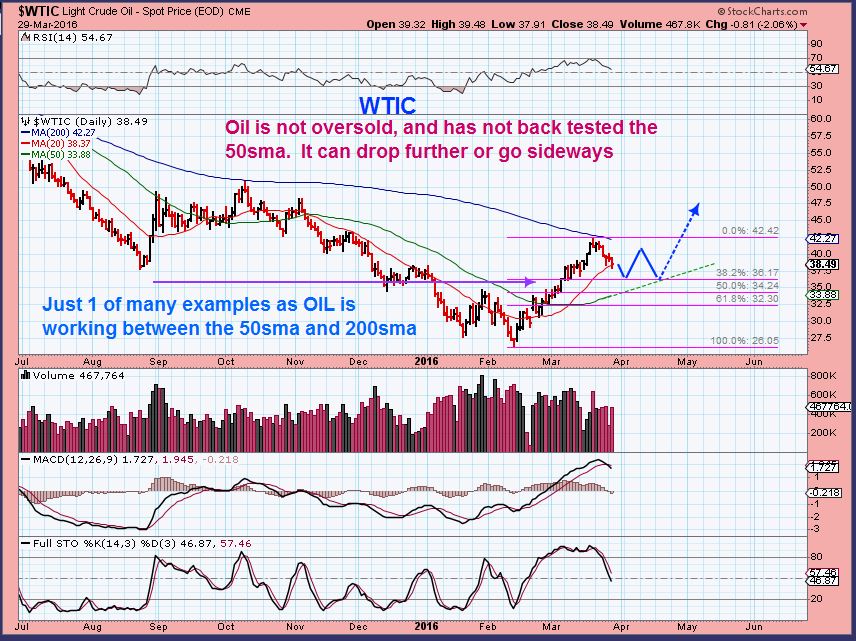
WTIC — No change, this is what I have been expecting. Oil cycles tend to run long as mentioned. See the weekend report for more oil charts. Even a drop to $36 or $34 Oil is not bearish, if the 20sma doesnt hold price up..
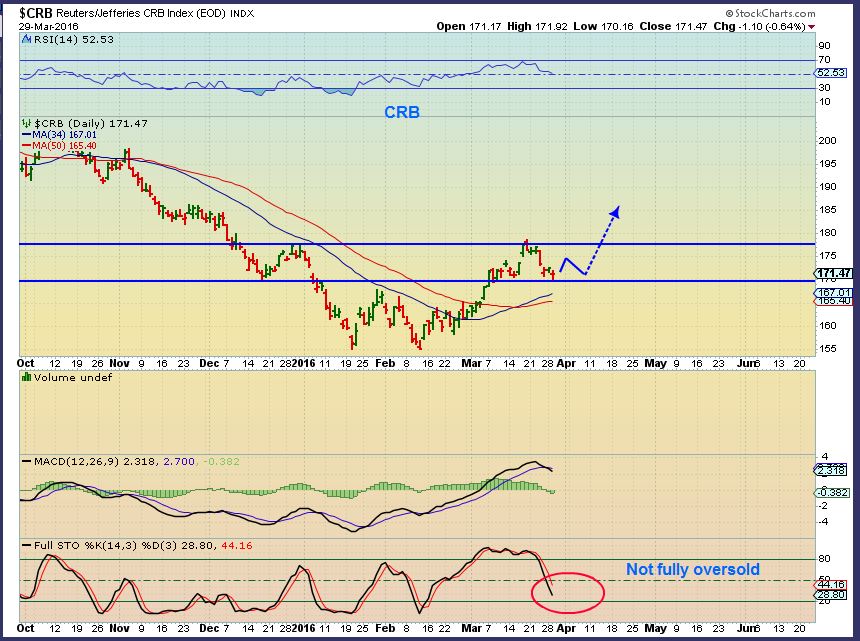
CRB – The little sideways move for the past week or 2 has caused it to go from overbought to just about oversold. I liked the continued set up in CLF, VALE, X, AKS, STLD, etc, so as mentioned in the comments yesterday, I added a bit more to my CLF and AKS. This is simply because so far ( famous last words) they are dropping in the a.m. and closing higher. That looks like accumulation.
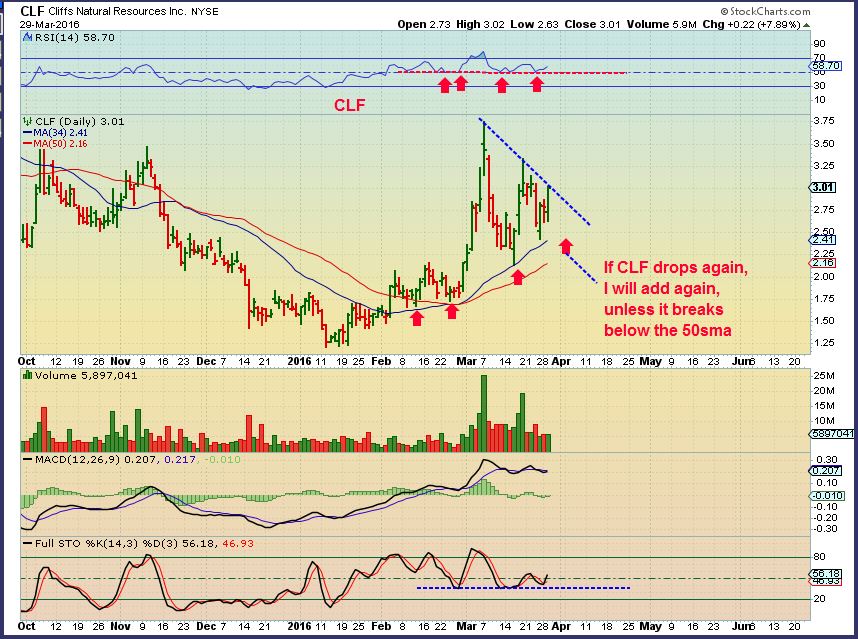
CLF – No break out higher. Volume still light in consolidation. I Added on dips.
.
GOLD – Did I mention that Janet Yellen started talking at lunch today?  I had no idea that she was doing a question and answer session.
.
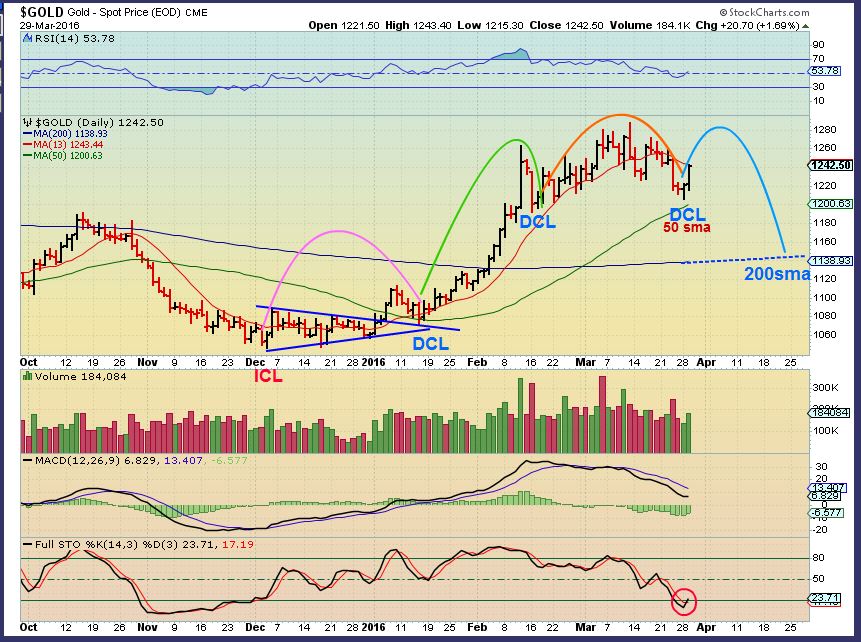
Its funny, this GOLD chart is from this weekend. I said to expect it to be tempting to jump back in, but that we should expect a little rally and possible H&S forming. I even said , “Do not get lured in” on this chart.

We saw a small reversal on Monday. On Tuesday a Yellen push and all of a sudden I wonder, “Was that a DCL?”. GOLD is oversold. So…
1. Look at that ORANGE DAILY CYCLES RISE. Pretty much sideways with POPS. It formed the head of the possible H&S. If you see type of move now, we’ll probably get another meandering rise to form a right shoulder and then a drop. I would love that, a drop to the 200sma for our next entry point.
2. We cant rule out a quick run higher if the dollar keeps dropping. Gold could break above $1300 and then fade too.
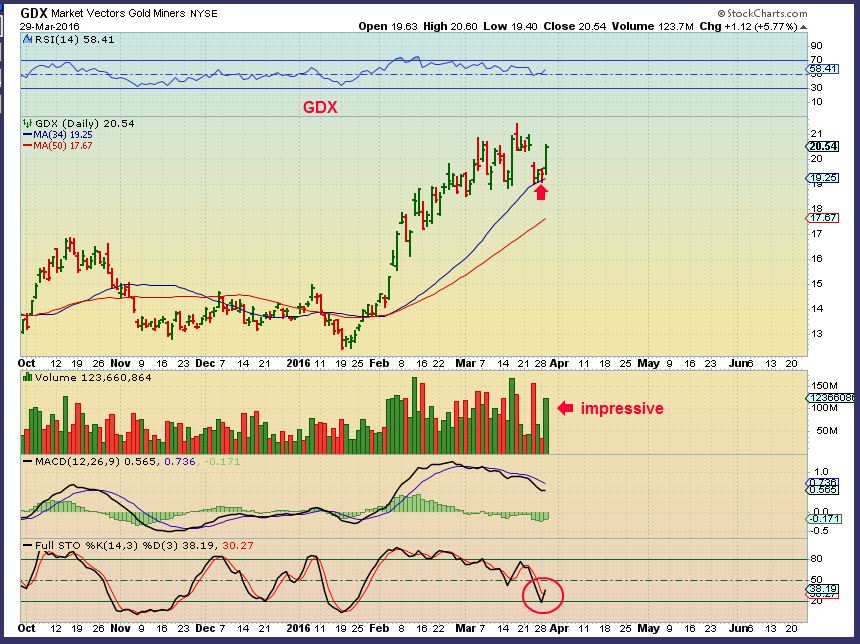
The interesting part about it is that many Miners do remain looking quite bullish (remember that they often do at tops) . GDX is now oversold and some individual Miners are still near their recent highs and just keep rising, consolidating, and rising. ( See PAAS, AG, GPL, etc). We still could get a failed daily cycle and then get our sell off lower.
GDX – Impressive move and it is oversold. Are Miners going to act stronger than Gold? There are some good set ups out there in individual Miners, and they are not overbought. Many have consolidated.
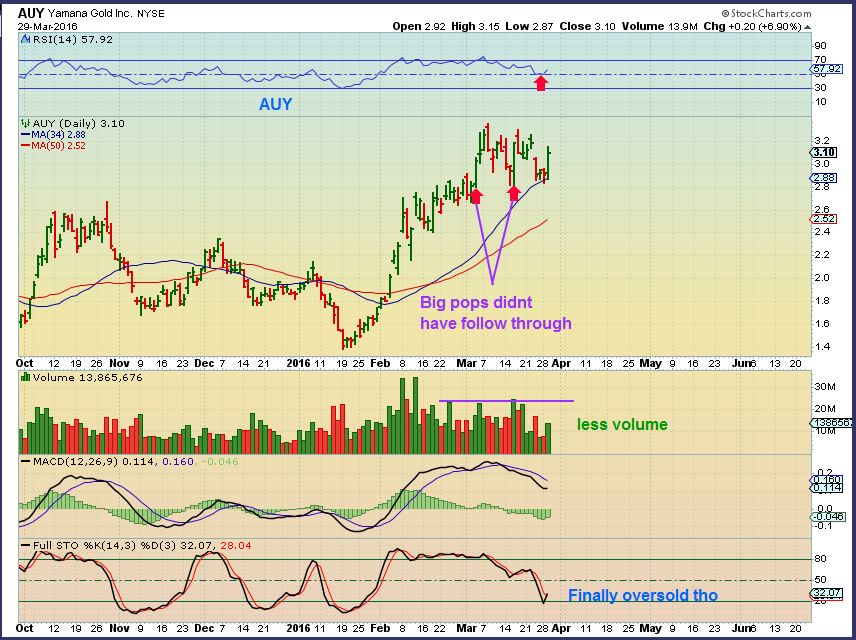
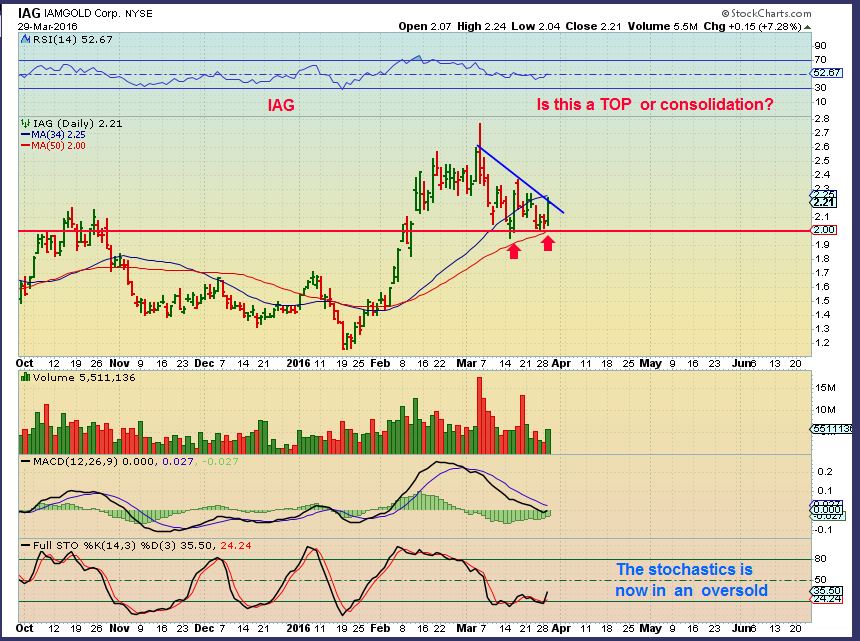
For safety sake – I still have to point out that some may be toppy. Look at AUY , IAG, GFI, etc for example. They have had big reversals that didnt have follow through. So I do see a mix of bullishness , yet possibly just a continued consolidation.
That said, Look at IAG on the 50sma. This actually looks consolidated to support and seems to be set up for a move higher. For Traders – Set ups like this could be considered lower risk, because you could put a stop under the 50sma if you bought it. ( It may just continue sideways – I still think it is early for Gold to continue higher, so I cant recommend a bunch of miners at this point).
For similar type consolidated set ups ?
look at SA . NGD & NG on the 34 sma. SWC & TAHO remain strong. EXK is not bad looking. Traders may scalp some good gains.
So when I look at the markets, they reacted bullishly to Fed Yellens luncheon. It MIGHT be a DCL, or it may just be an ending POP on the first daily cycle and then we get our dip to a DCL. We need time to see how this plays out. I had recommended that a rally would come out of recent lows in February, and then that we should be caution when that rising wedge was detected. I still think this is a traders market with recent set ups, but I’m not sharing buy & Hold set ups today for readers. Reacting to the FED is tricky. You can always get a knee jerk reaction for a day or 2 – Pop & Drop. If it’s a POP & RUN, then we might have been an early DCL and then you could still play it later.
For those TRADERS that like to look up charts, there are plenty of interesting set ups, but they have been a bit jumpy . BBRY, MRO -BAS – CENX- HSTM – MNKD? – AMBA- *TASR – FB -AMZN- GOOG- BITA – YHOO – ARWR- SBLK -TOO- SB, XONE/VJET /SSYS
.
SIDENOTE:
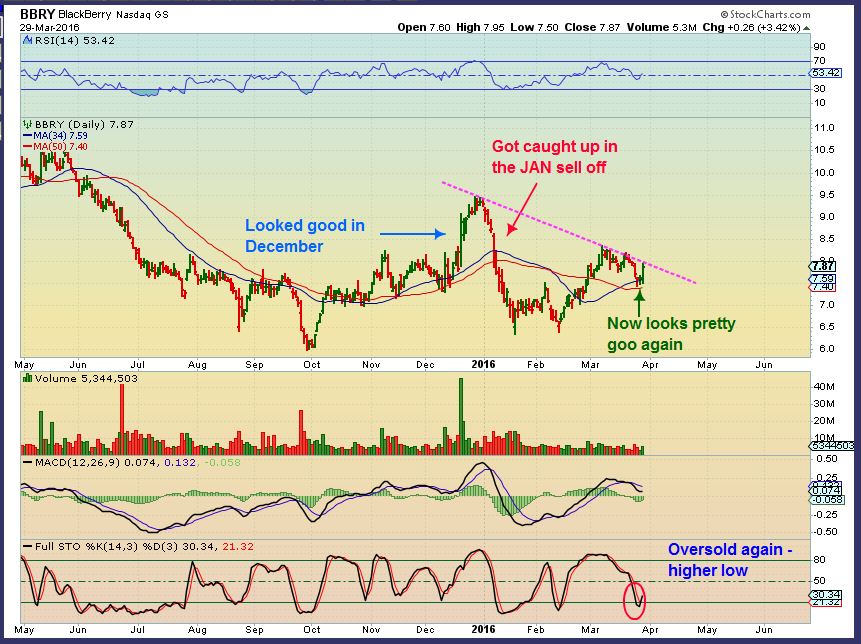
This is BBRY for example, and how I see it as bullish if we just had an early DCL in the markets ( Higher low). This could be a GIANT BASE after the recent correction. A break out here could run to $9.50.
.
So traders may find set ups to trade with stops close below recent lows. Gains can be scalped if the markets continue higher. I still like the commodities as lower risk, and BIOTECH is still near the lows , in a base. It too offers less risk because stops can be placed close below.
LONG TERM INVESTORS – Was that just a 2 month correction in a Bull Market or will our market dropping down continue? That is basically where we are now, at the critical point that I have been discussing. A break out to new bull market highs, or lower highs and lower lows continues? Time is needed to be sure.
.
So I look at the former flyers FANG. FB, AMZN, Netflix, Goog, etc. It is possible that their corrections are over and a bullish move continues. I definitely see that happening in some stocks like GE, FB, ULTA, NKE and UA. There are more that still look good despite the Jan correction.
Look at AMZN- read the chart.
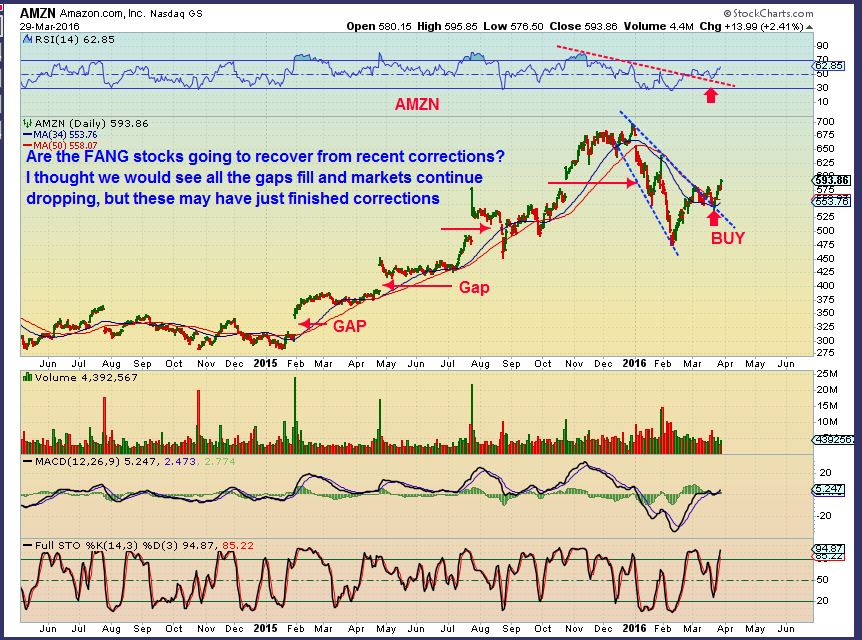
So I continue to monitor ‘current trade possibilities’ and ‘future investing ideas’ with these market overviews. Right now we are at a pivotal point and it takes time to know if this action from JAN – Now is part of a big correction in a Bull, or the start of lower highs and lower lows…a sell off. This all takes time, so while short term traders can still trade the moves, we watch for longer term movement to guide the longer term trades. Stay Tuned.
.
~ALEX
.


truely appreciate your effort and thought Alex into the complexities of the market. 🙂 I think yesterday underscores how going forward this summer, every fed meeting is going to cause jitters in the days leading up to every meeting (I’ve got my calendar marked) if they raise rates, it is going to suck liquidity out of the market and it will fall…eventually I think. The next meeting is not until April 26-27 so the SPY might be good for a run until the 21/22. The minutes of this last meeting are going to be released on April 8, so hold your breath that morning too and maybe expect wackiness on the 7th. You’d think she was Moses the way she moves markets.
Yes, you just reminded me that we have Fed Mtgs ( jitters) and then FED MINUTES released , possibly more reaction. UGH.
It’s a lot, but so far the charts / cycles / sentiment, etc have pretty much pointed us in the correct direction through out all of the moves over the last several months- even with the Fed being a bit more active…
Rising wedges, Bases and bottoms, cycle counts, etc all have helped us to time when rallies would come and when they might stall. ( Tops are much trickier than bottoms, since Tops are a bit of a process and bottoms seem to be easier to manage)
Even the possible knee jerk reaction yesterday possibly causing a H&S on Gold is pretty wild.
Smart money seems to leave a fingerprint for us to road map, since they seem to cause the bigger moves .
hiiiii CF .. miss me?
Kind of? You add a lot of good market ‘stuff’ to the board
… sorry.. I’ve been sooooooooooo busy skyping with Ken & Chris .. ive just been exhausted.. ;o)
#ICrackMyselfUp
DQ – interesting move off of the 50sma
really? did u JUSSSSSSSSSSSSSSSSSSST see what i posted on st?
been in it…
too funny… 🙂
ps. maybe it’s just Springtime and im ‘twitterpated’ as WiseOwl says — or maybe I’ve just run my head into the wall the allotted number of times…?? butttt .. i have to GiveItUp to chartfreak (oh my….i SWEAR I DIDNT EVEN MEAN THAT) giggle … as I have never been so at ease w/ my trading…
Props ChartFreak for being such a guiding force & teaching me much needed patience.(and discipline)
dang *&^%$!@! … im gonna have to go get that tat removed from myA$$ now… shoot …
https://youtu.be/WadHPTfxrPc?t=4
giggle…
oh thelma.. u r crackn me up…
hi all … 🙂
Dang Loiuse where you been? Thought I left you at the gas station.
nahh.. just takn a little break – enjoyin sights & sounds of spring… bluebirds are back & cardinals are mad crazy this year.. wow. Yesterday morn I woke up to 16 wild turkeys hanging out…
#MotherNature :o)
Cherry blossoms in full bloom here 🙂
awesome…. enjoy! 🙂
BTW did you hear the latest thoughts on oil out of Gartman’s mouth? I swear, I can’t decide if the man is a savant or is going senile…
http://www.cnbc.com/2016/03/29/gartman-forget-a-freeze-this-is-the-biggest-threat-to-oil.html
My gag reflex is too sensitive to watch him – lol.
I’m going to go into the wild speculation business too, just to get air time.
My wild speculation is : UBER is going to destroy the automobile business, and in turn that will hurt Platinum , because less catalytic converters will be needed. So my call is UBER is going to kill the Platinum sector. ( haha, obviously joking here)
LOL!!!! UBER is a conspiracy to take down the Chinese government– taxi cabs take the first hit and then the little Christmas tree air fresheners fall next, wiping out the Chinese work force which collapses the Chinese economy. Put that in your fortune cookie 😉
VALE broke out with strong volume
CLF broke & closed the gap. See if it moves higher. If so I think it is a break out and a buy (Downtrend line) .
HALO , ONTY, RPTP biotechs looks really nice, base-wise.
On many stocks, I usually try to wait after a gap higher open and see if they try to close their gaps in the 1st hr. Sometimes they close them mid day and then reverse higher (That mid trading day dip that we often see ). Either way, I add after a gap fill and reversal higher
I like these break outs in VALE & CLF. Vale shown below (refresh)
.
CLD, AKS, CZZ, and CENX All acting correctly too.
CLD may have finished its consolidation, but never hot the 50sma as expected. I’m seeing many use the 34 sma, and CLD did that
Also keep an eye on LGCY action
Watch the 34 sma on that one too. In fact, I’d use only the 34 sma until it recovers it.
IOC – Must have good news or earnings.
34? That’s a new one…, reasoning (if you don’t mind 🙂
Is that a question?
Well…., yes…. I’ve only heard of using 10, 20, 50, and 200 sma not 34,.. It’s like saying set your oven to 340 degrees in a recipe
13 / 34 is also a popular combo.
And set ur oven at 335 and add 3 minutes to your cooking time please 🙂
And then stick a fork in it.
yup : )
34? Ok.. That’s a new one. Reasoning?
It’s actually quite common.
if you scroll up in the report, you’ll see that I have been using it often. AUY, GDX it offered support.
In Tech analysis, using a 13 / 34 sma combo is common during pull backs Bigger corrections I use 10, 20 and 50sma
Large corrections in a bull run, 50 / 200 sma.
Look at LGCY with the 34 sma. It offered resistance and support over time ( the 20sma did at other points).
Thought you we’re using 13 and 34 coz they are Fibo numbers?
or are these commonly used by traders ?
Hi Ray – These are fairly common in trading as far as I know.
I also like BLUE (bio – risky follow at own risk with stop)
Alex, Could you take a look at KMI for me?
I dont know if you are holding it out of that base, looking to enter? So here is a chart.
.
It gapped open today, so it may fill that gap , since it is in a consolidation phase. Price is actually now right in the middle of that consolidation.
It is consolidating sideways after a gap open and run in February. Look at it on a 2 month chart to see that better.
The GAP open might fill, but it doesnt have to. The 50sma is also in that area.
.
I would buy it with a stop below the 50sma somewhere, but I personally would wait and see if it fills todays gap and keeps consolidating. I would wait to see if I could get in lower, and if it runs away with out me, I might jump in and scalp some on a break out. Its tough, to me it is in the middle of a consolidation.
Thanks for the input. I own KMI because Richard Kinder undid KMP [partnership] which I had inherited from my Mom. It was her favorite stock and she bought into Kinder’s “pipes” partnership and his dreams years and years and years ago. She would feel SO betrayed by his move. I had sold most of my shares many years ago and took great profits, but I held some in honor of my folks and I probably will keep it even though after the change over it dropped in half. I was deciding if I should buy some extra shares while it is low. Kinder was pretty brilliant over the years.
Interesting: 7,000 calls bought on VALE with 2018 exp, at $7 max strike.
Not by me! But somebody is betting some nice coin that Vale trades higher
I like it. The set up on Vale is good, because the volume is healthy as it breaks above that down trend line.
TCK & CENX also seem to have healthy volume at this point of the day
CLF broke out & re-entered that triangle like consolidation. I’d like to see it close above the down trend line by the end of the day
Yeah, rough give back this afternoon. I was all excited there for a few minutes. 🙁
Uranium ETF (URA) continues to claw it way back since the reopening of the Fukushima reactor in the Fall of 2015. They have scheduled four other reactors to reopen in Western Japan. since mid-January URA has been bouncing off the 20 SMA.
Looks like it wants to move higher. Watch the 200sma
NXE up 10% today
was 0.6 Jan 1st now 1.6
OIL is getting rejected at 39.50 would be really interesting at this juncture to see if SPY continues to react in tandem or if it decouples….. I kept looking at the all the green volume bars in the bottom of your second SPY chart in today’s report…….
Woosh … Right down thru 38.50. Oil is slipping
Now approaching 38… If it can’t bounce at 38… Then my best guess is that it goes all the way to 36
RIG doesn’t care.
Interestingly enough, the energy I was following didn’t care oil was up this morning THEN didn’t care it was down later. Now, that’s interesting!
And those would be? 🙂
Golly most of them that we’ve talked about here – OAS, BAS, DNR, WPX are still on my Watch List and all traded in kind yesterday. Others have been kindly ‘removed’
The inventory report was bullish, I was surprised by the reaction by oil. And the lack of reaction by some energy companies (as Bill and I discuss below).
One of my gold stocks Caledonia Mining CALVF has popped today. It’s had a few insider buys over the last week. Very undervalued and pays a strong dividend.
Nice chart, above all the moving averages. Financials aren’t bad. Nice dividend. I’ll look for a pullback.
Am I reading correctly that Caledonia Mining Corporation was founded in 1992, but the charts go back to 1986 where in the mid 90s it was over a $90 stock?
They did do a 1:10 reverse split a few years ago so maybe that price wasn’t adjusted for the split.
So far, LABU getting rejected @50 sma AGAIN. I would love to see this break to new lows and have it rocket back higher. False breakdowns are great trades.
Its going to pop soon. MA collision here.
couldn’t it drop?
Rob,of course it could, but if you look at the chart. there is very little room lower. The previous all time low is $19 we are at $25 currently. I just expect more upside. I think the sector is very oversold. Volume is going way up. We are right at the 20sma and 50sma. If LABU gets a break thru then it should run pretty good. If It can’t break thru, then we will probably re-test $19.
Bill, I hope it does pop. But it would be a MUCH more fun trade if it had a false breakdown first. The snap back rallies from false breakdowns are awesome. Thats one of the exceptions I have to price being above ma’s. A false breakdown gets bought as soon as it recovers broken support, regardless of where ma’s are. And the short squeeze above there can take price up in a hurry! Watching it for now, we’ll see what happens.
If you do end up seeing that, let us know (I still have on my watch list for re-entry, if it is right).
Will do!
Last false breakdown you bought did pretty good, right Cason?? Some miners had a double bottom, others a false break, and the rally higher was (still is) pretty fun.;-)
I should have taken the pop this morning. I didn’t realize that would be so dang short-lived. I thought we might break the base BUT I tightened my stop, I had been in the hole and I wasn’t going there again. Stopped out. 🙁 without my profits.
Natty’s pushing past that $2 dollar mark ….
Great job Alex
Thx RG!
Psst Alex….BAA put out ER yesterday 🙂 🙁 :/
You have to slog through it like a real miner and do some heavy mental lifting to find nuggets of info — hard to piece together — mixed picture