
Weekend Review Feb 28
We reach the end of the month on Monday, so Monthly charts will come in to play too. Right now we’ll take a look at how things are playing out using weekly and daily charts.
.
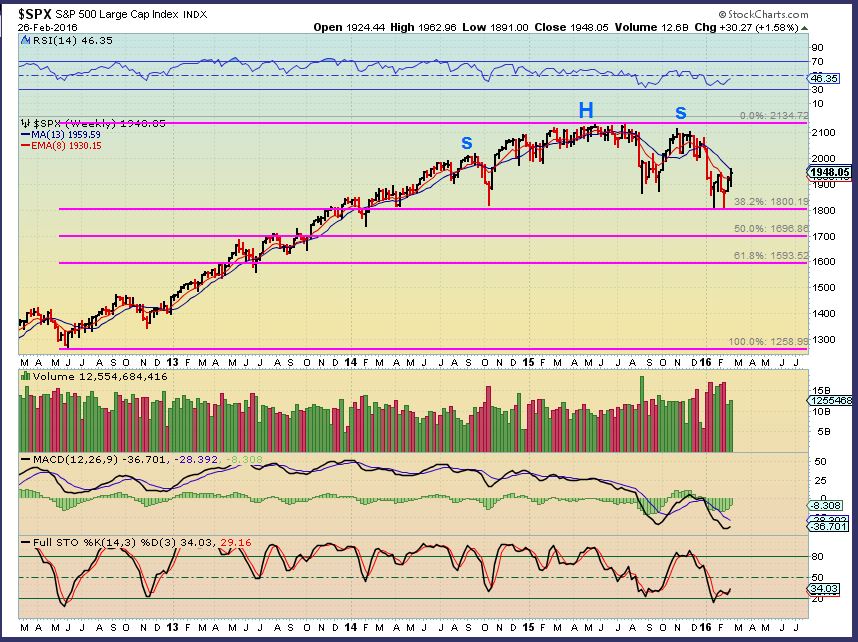
SPX WKLY – The pullback so far as been almost textbook at 38% from the 2012 lows. I’ve been pointing out a possible H&S pattern as it formed last fall, so we keep that in mind. I’ve been expecting a bounce here for weeks, and so far it is struggling with volatility.
BIGGER PICTURE
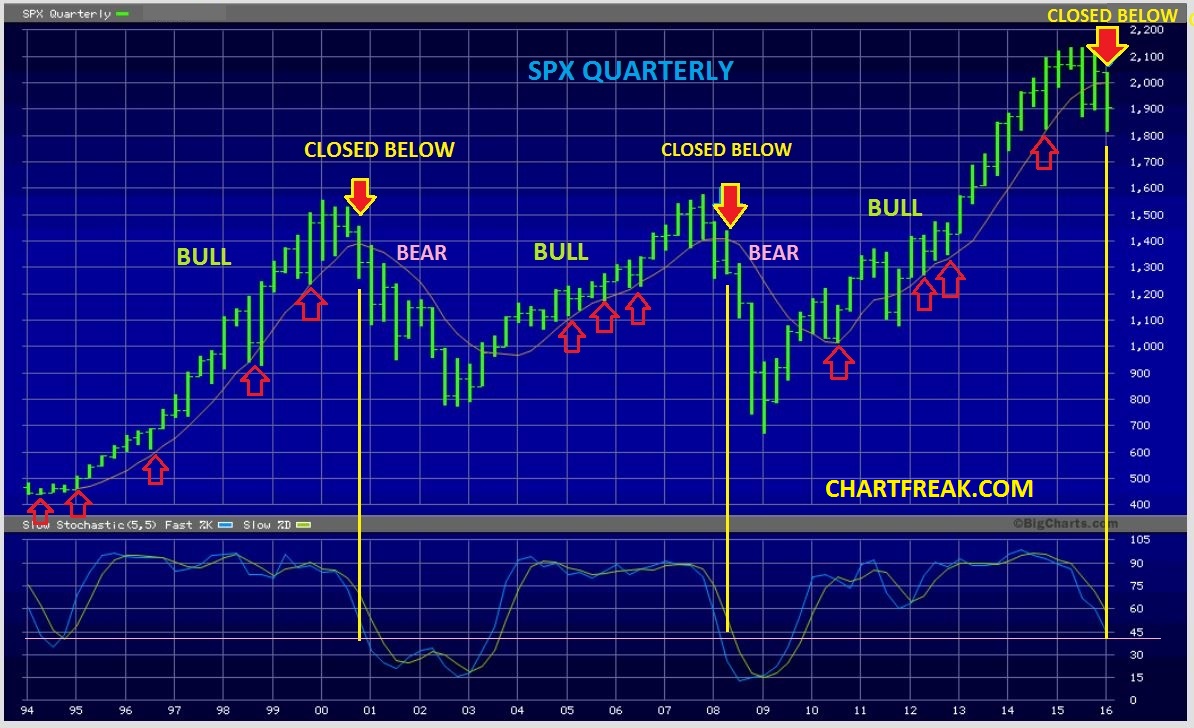
If you have been with me for 2 months or more, you may recall that I was looking at Quarterly charts too, for clues of a break down. This chart was posted saying that a close under the moving averages was a warning & I would keep an eye on it for.
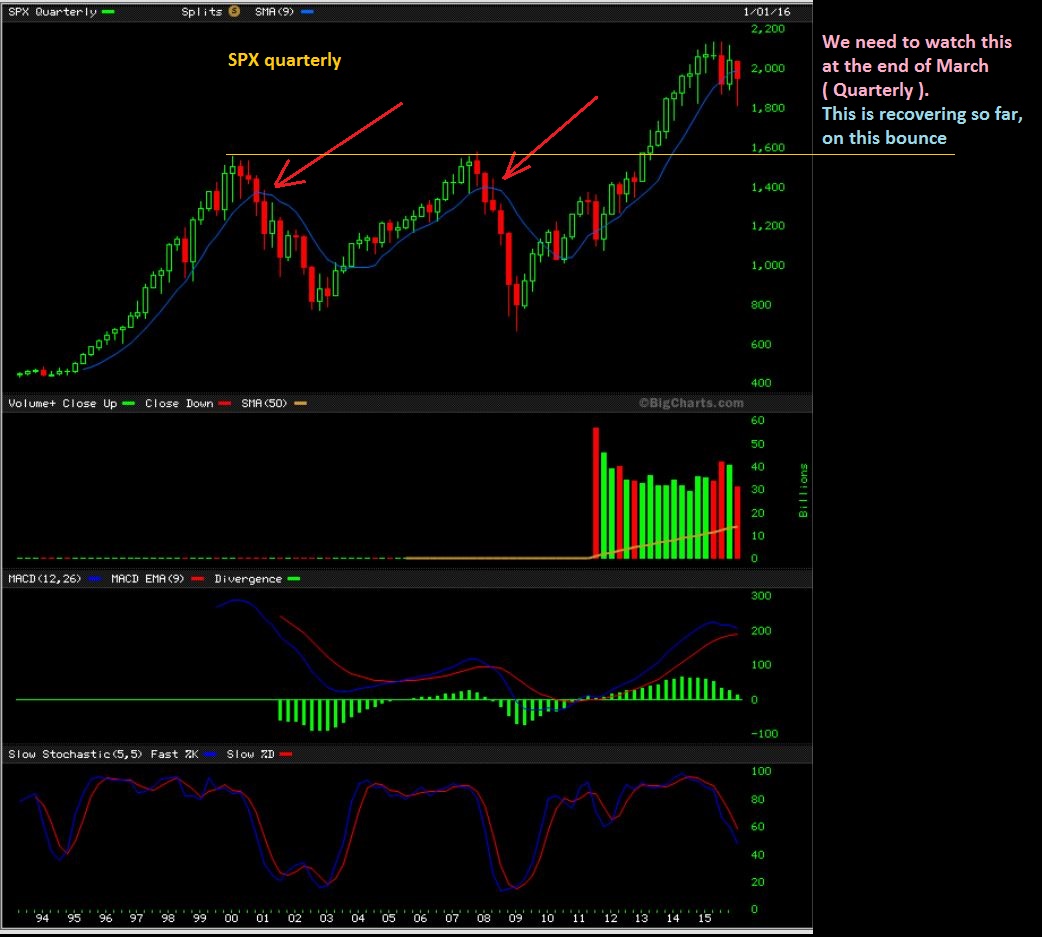
I just wanted you to see that that drop recovered on a quarterly basis. SO- If this holds by the end of March, we would actually have a possible recovery. This would just be a ‘handle’. I will be watching this at the end of March.
.
That is a worthy side note, but right now I still see concerning weakness.
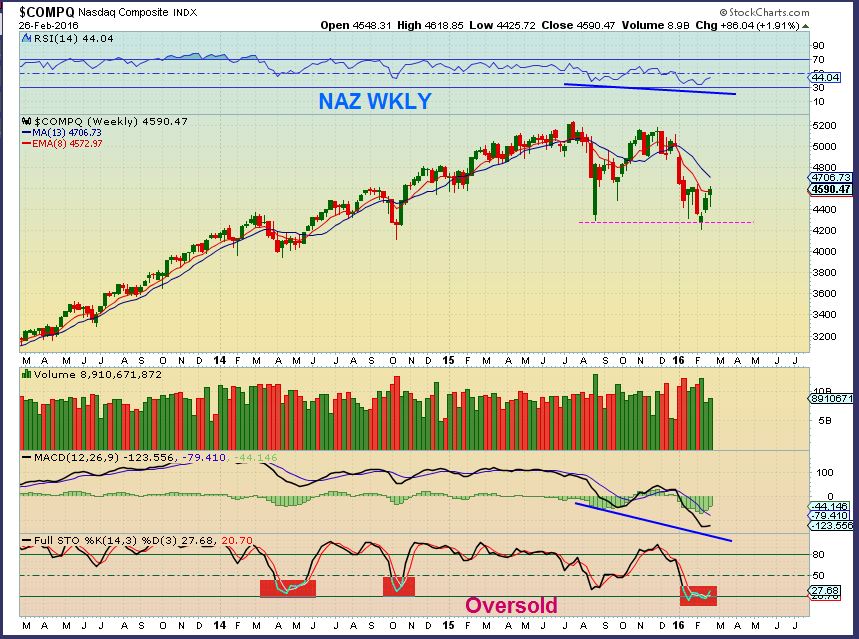
The NASDAQ has no divergence so far, as it struggles on the drop.
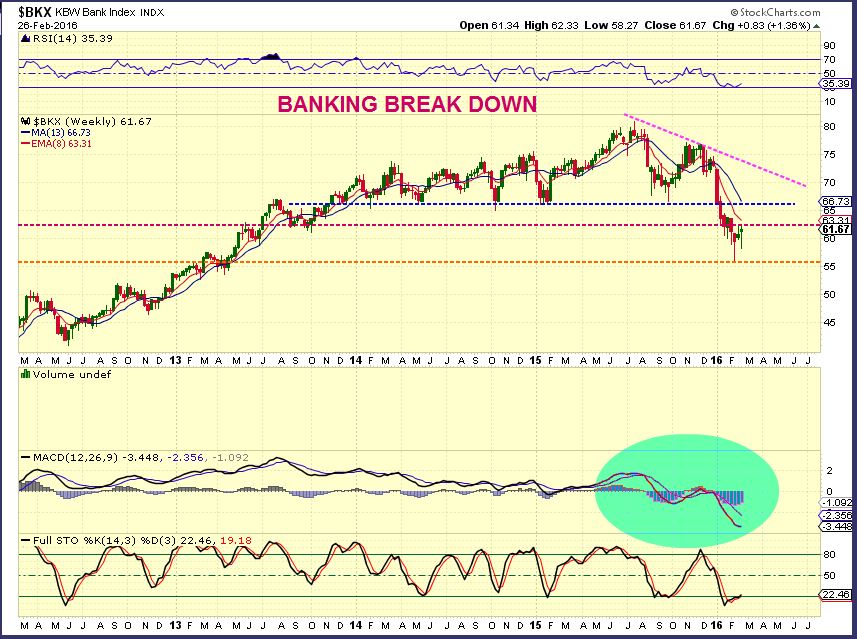
BKX – For 2 months I had mentioned that I am concerned with banking . I posted this a month ago.
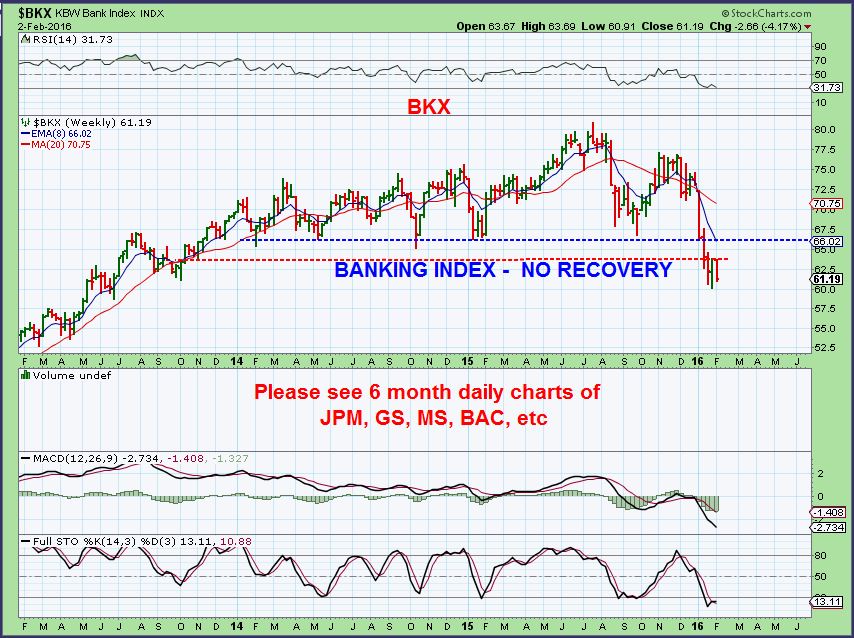
BKX– We still see no promising recovery in banking, but we’ll keep an eye on it. Strong resistance at the 66 area.
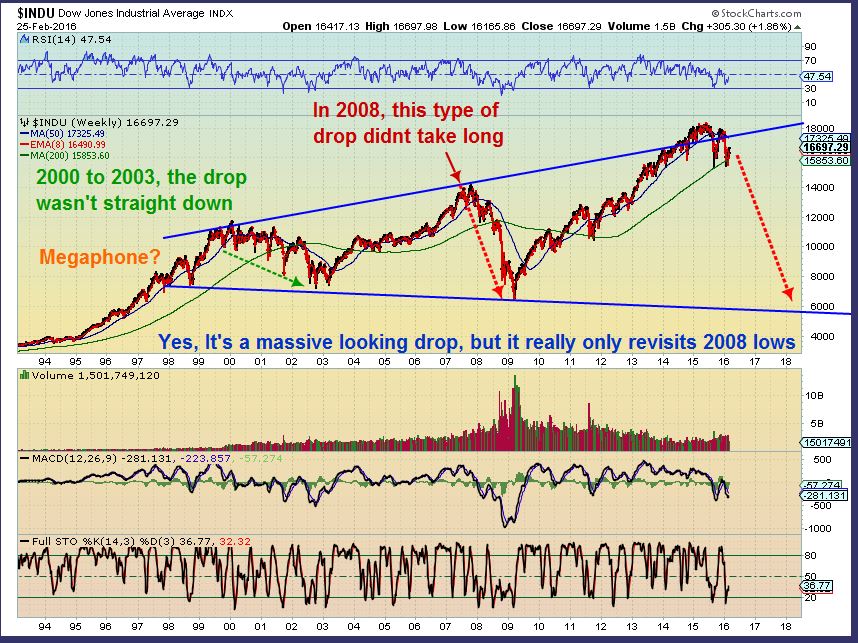
DOW MEGAPHONE? Just a thought. I know this looks like it would be a devastating crash, but it could slowly work its way down like it did 2000 to 2003, or it could get it done fast with a banking crisis like 2008?
.
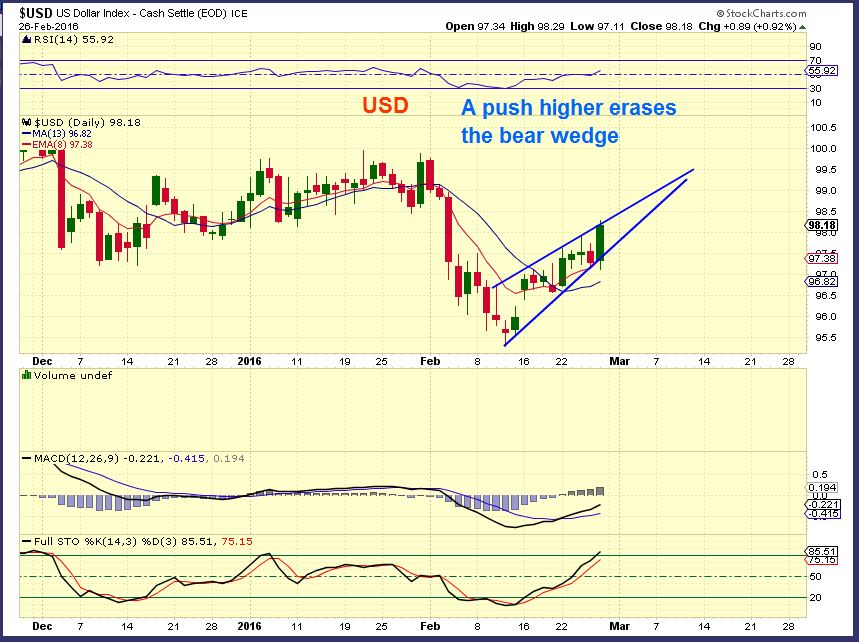
USD – I’ve pointed out a double top in my opinion. This would be (and has been) good for Gold.
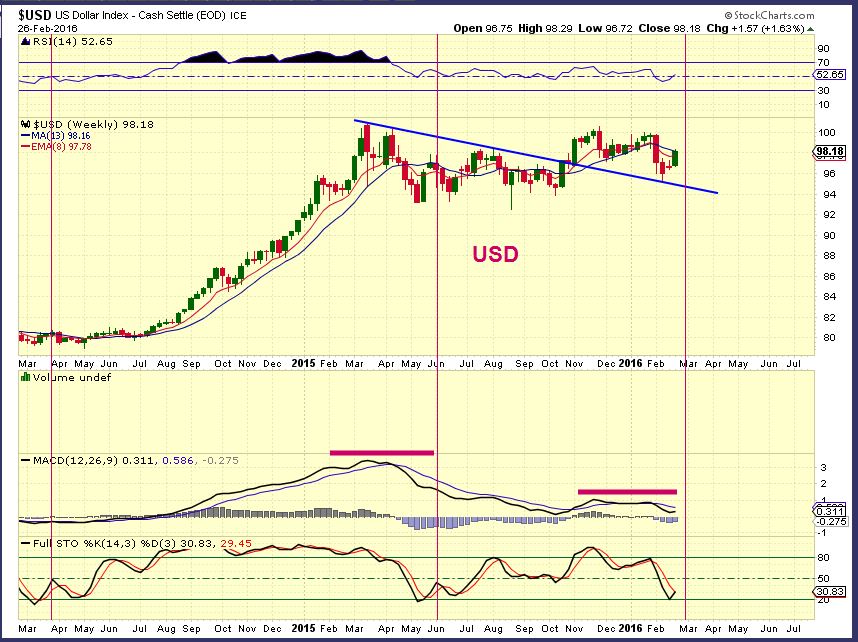
USD DAILY – Cycle-wise, the dollar is in the timing to roll over. If it breaks higher, it could become right translated. I look at the Euro and it looks ready to bottom, so the dollar should drop.
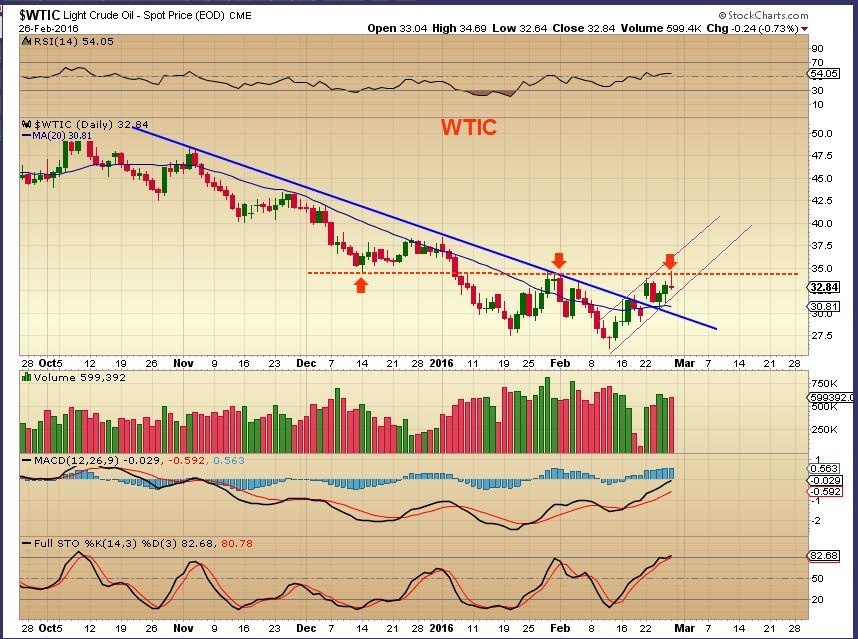
WTIC- I have mentioned that I think that Oil is bottoming here ( at least temporary). It is volatile and difficult to trade, until it makes a believable break higher.
.
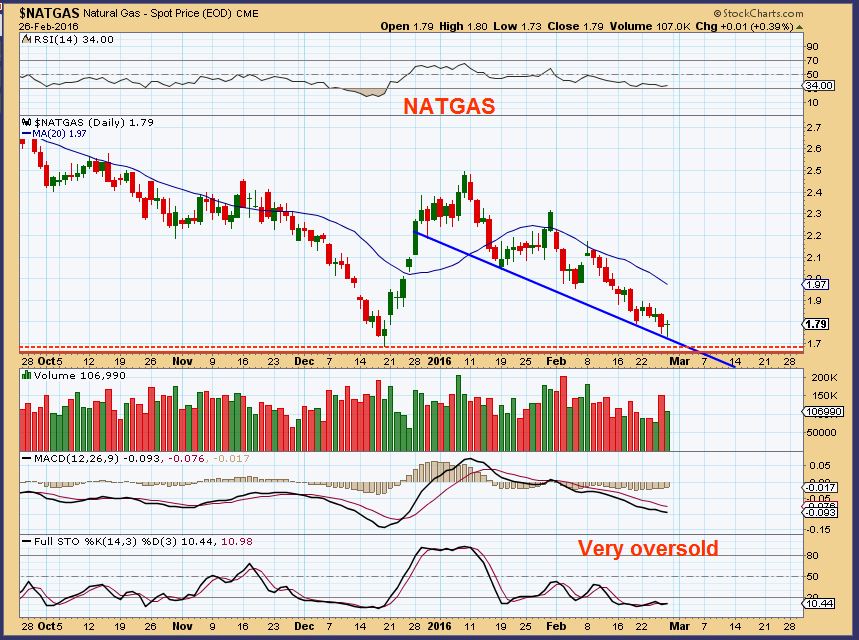
NATGAS – Oversold,but it just keeps dropping. It has been too difficult to trade, unable to catch a bid.
.
Precious Metals.
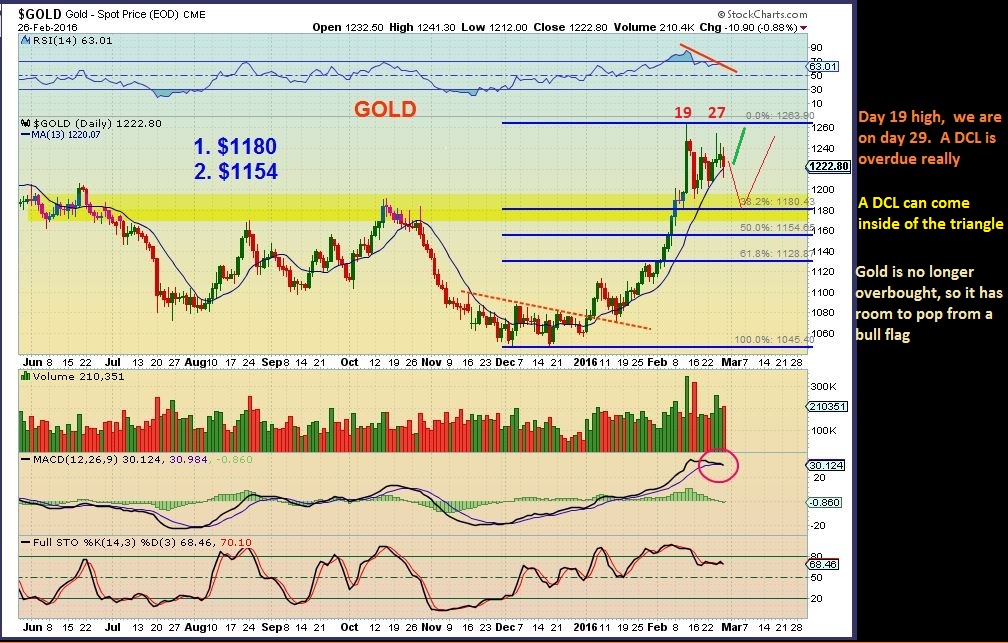
GOLD – Bullish so far. This is a ‘bull flag’ and can run higher.
I drew the next 2 charts up and posted it in the public report Friday.
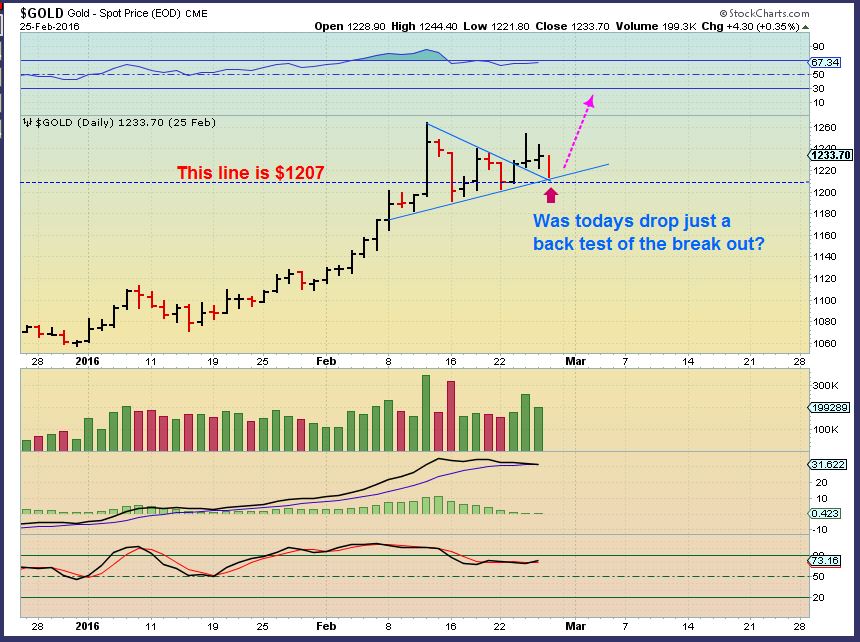
Or
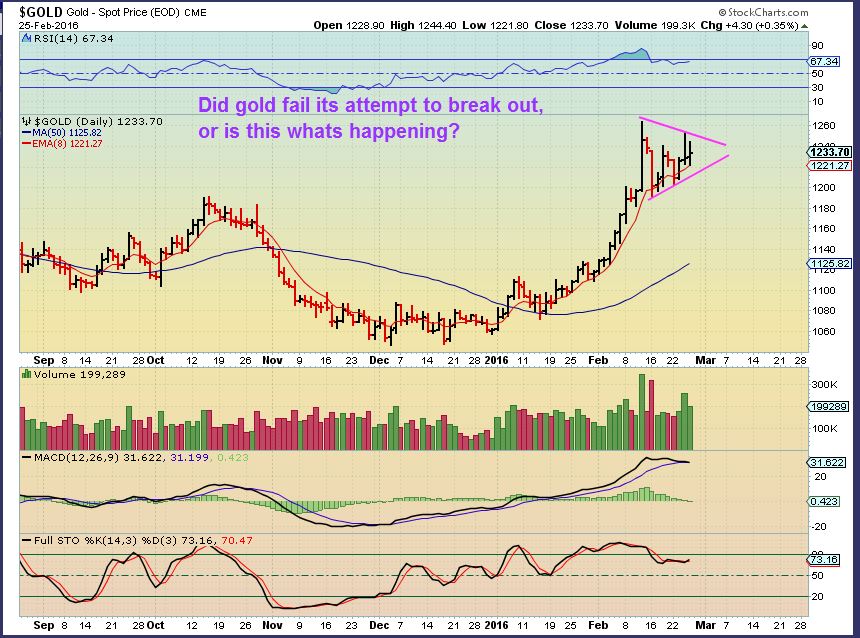
The weekly shows a possible larger bull flag.
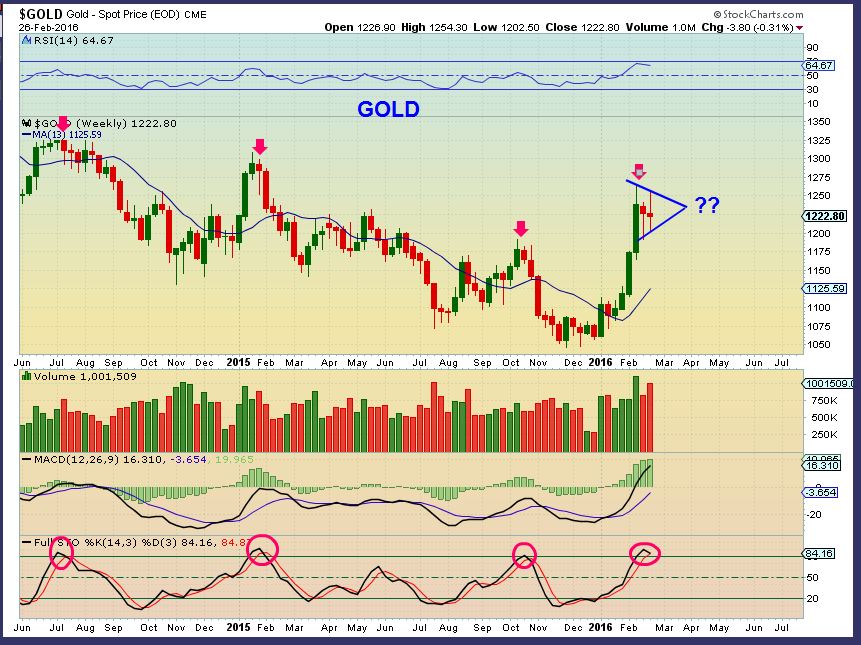
I will discuss the COT later
SILVER – Silver has under performed during this rally, silver stocks have not.This looks more bearish than Bullish honestly.
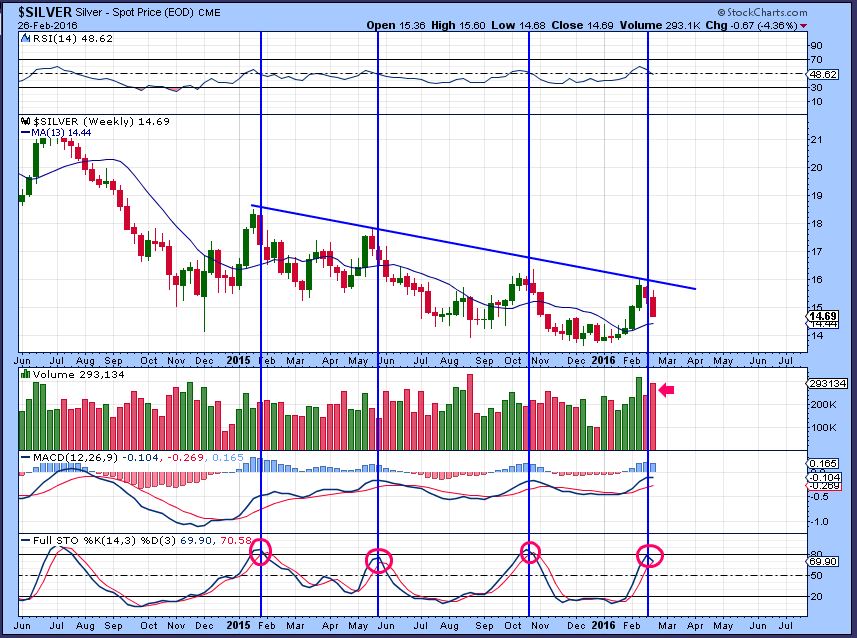
If you look again at the Gold Bull Flag, it could bounce around inside that flag, moving all the way up to $1250 area. As it does, you might find Miners holding up, and individual miners may even travel higher , showing their own strength, the way SBGL, HMY, etc have,
GDX– We are at the end of the month. This is beautiful for the longer term.
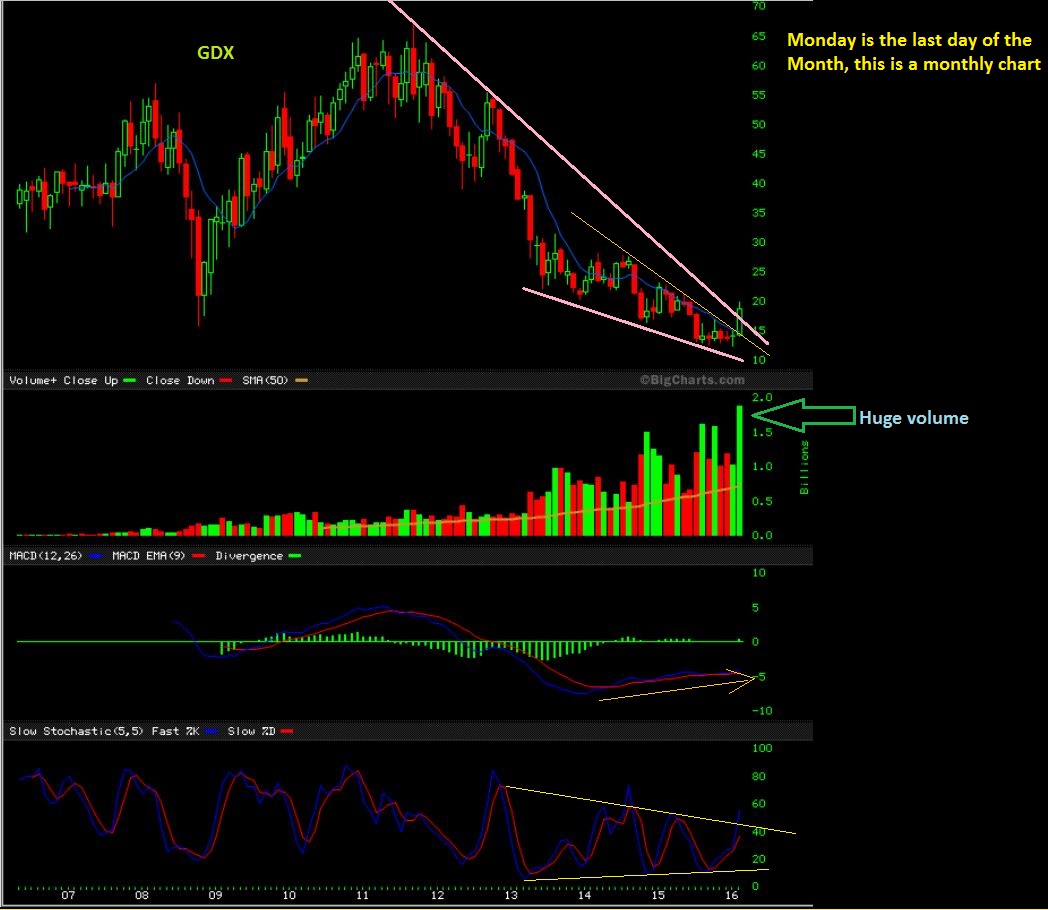
GDX DAILY – If Gold moves higher, Miners could too. This chart looks like it wants to pull back. It is normal to expect a dip here. Targets are shown, but this pattern could also turn into a running correction. They are uphill consolidation periods that relieve overbought conditions.
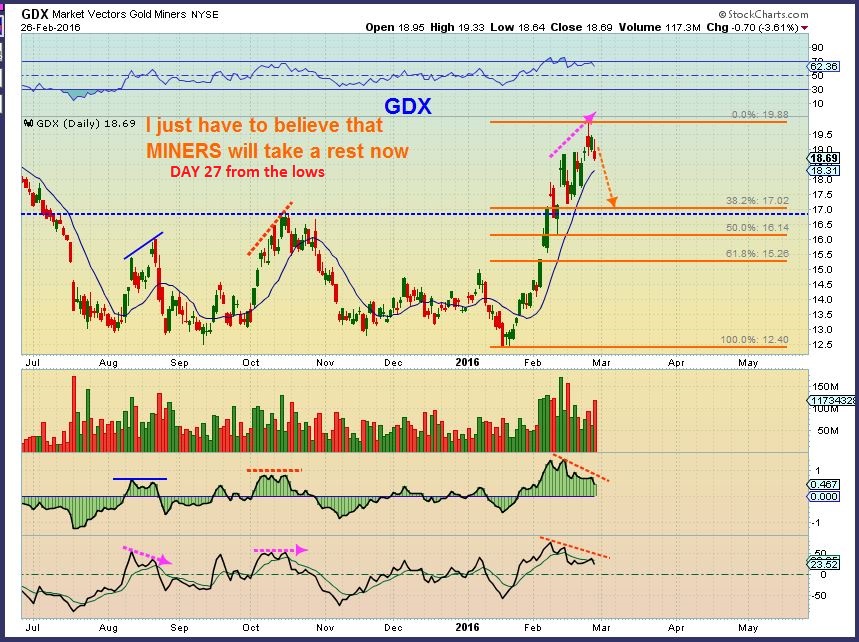
It is helpful to Study former lows and not guess at what we may expect.
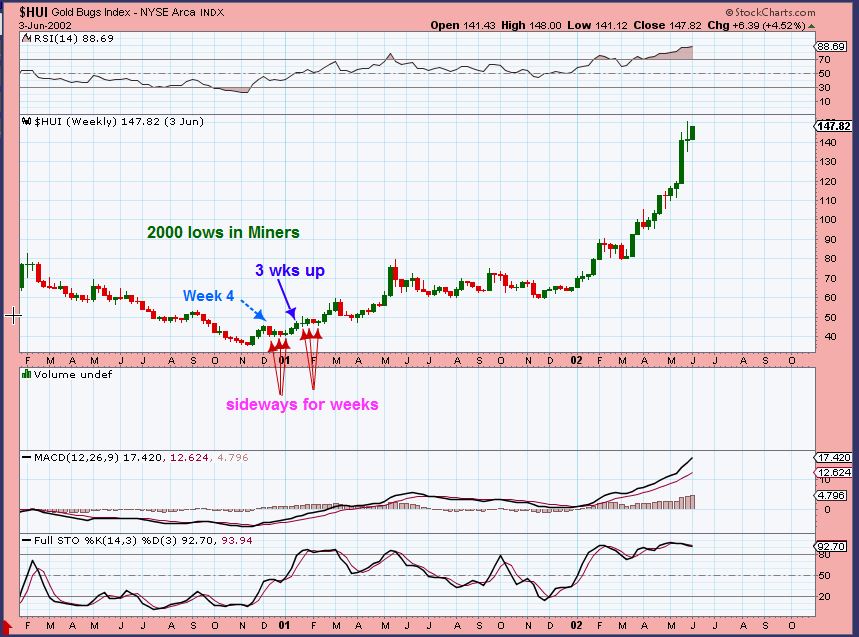
Here is something to consider. I see people who have missed this move dying to buy the pullback ‘this week’ … as though it will be easy for anyone to just buy and ride it for the second leg up. Markets do not always act as expected. Notice how the miners performed in 2000- 2001.
Very bullish looking , but notice that it had 3 weeks higher and then 3 or 4 weeks sideways, then a run followed by 4 weeks of sideways flagging. Also both NUGT and DUST would fail there, because it is a month of sideways. Could happen to us now ?  It could.
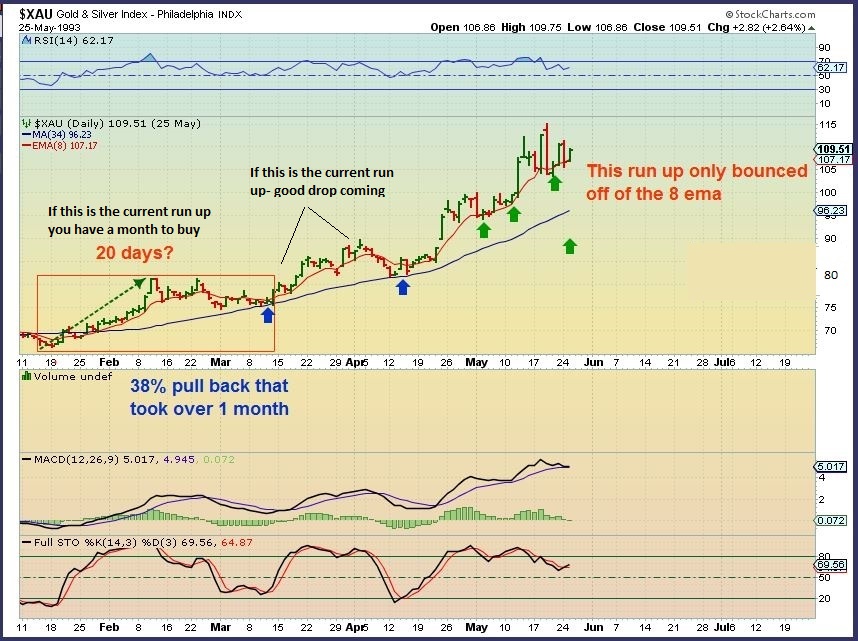
XAU 1993 – Study the move out of the lows here too. We see a nice 20 day run higher . It took 1 month to gradually pull back. Lows are just not that easy to trade.
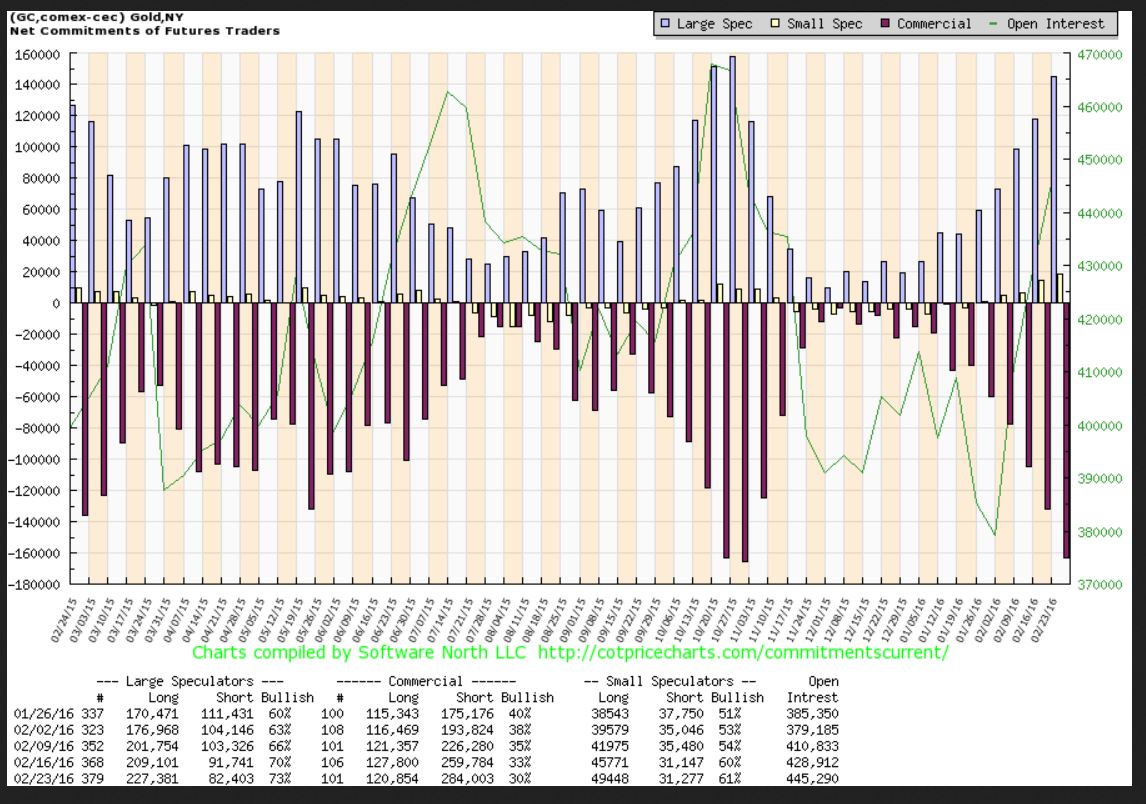
I wanted to point out that the COT has returned to where prior highs / tops came in. Many see that and call for a deep pull back right now.
Yes, That COULD indicate that a pull back is imminent, and it usually has in the bear market rallies.
Is this just another a bear market rally? Is it the start of a Bull? Does that affect things?
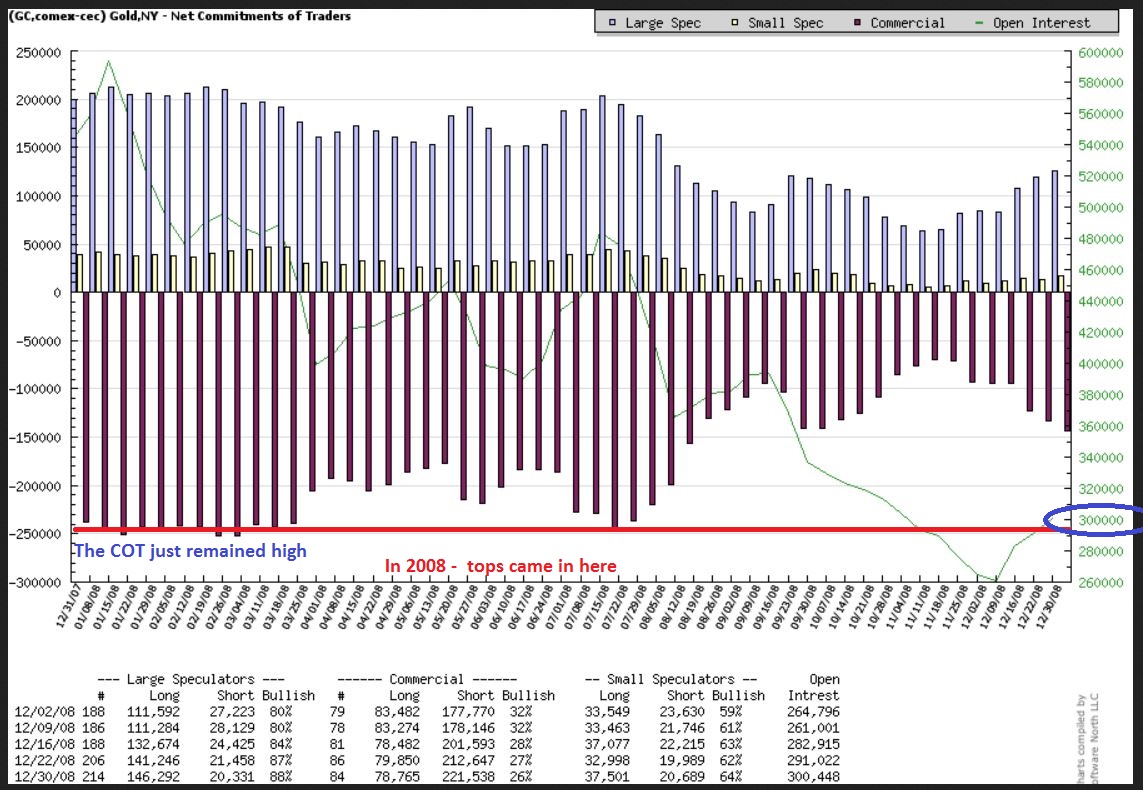
Notice that the COT in 2008 peaked as shown at former highs at the red line. Then Gold crashed down in 2008.
After GOLD bottomed and started running back up, the COT eventually reached those levels again in Sept 2009 ( And there were some dips along the way of course). Notice that the COT indicated that commercial shorts just remained at the level that prior tops formed for Sept , Oct, Nov. 2009 Was Gold crashing in those months?
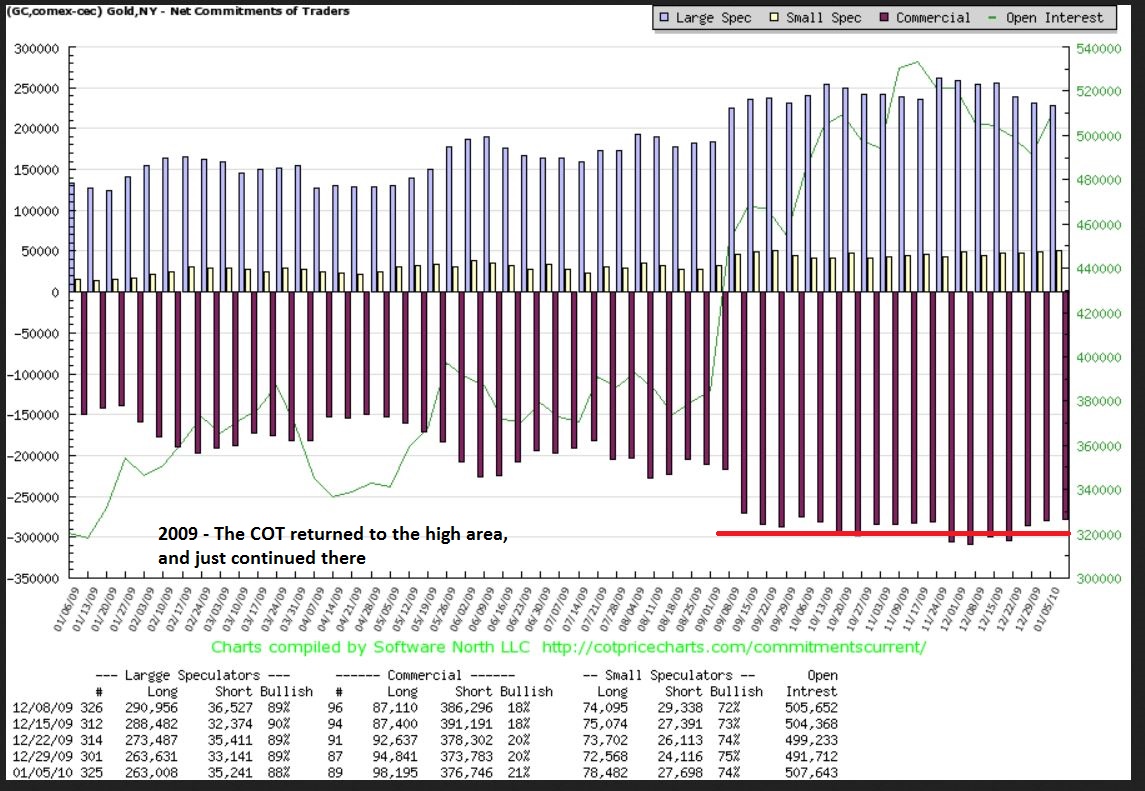
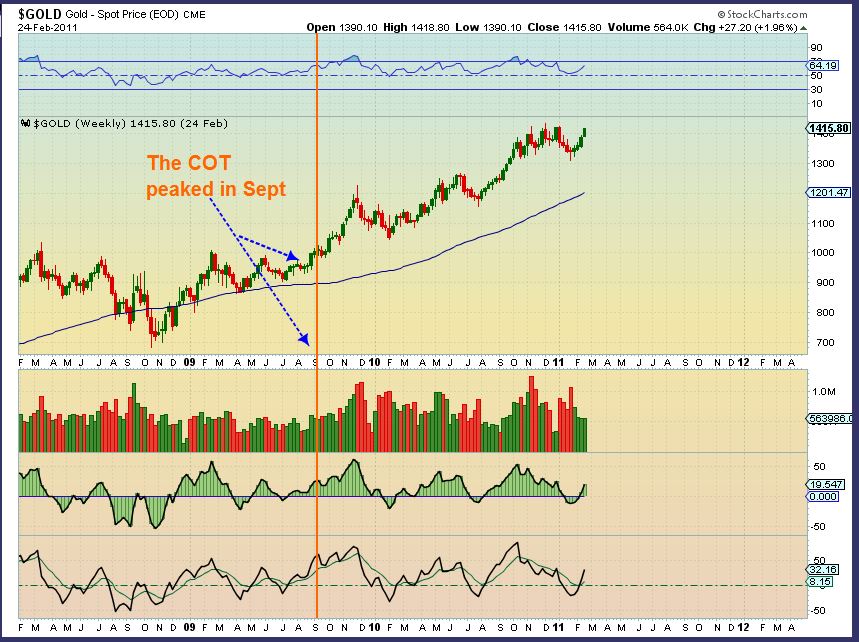
In Sept, Oct, Nov 2009 Gold just continued higher and higher. That is why I say that the COT is not an exact timing tool. I use it for bottoms more than tops. It just calls for caution at these levels, it alone is not a sell signal.
Monday we will see how the various sectors end February. I still expect higher prices in the equity Markets. Oil looks to be putting in a bottom, but it remains volatile and tough to trade. Precious metals are due for a rest, but there is no telling at this point if one will come now or will it be later? As shown, it could just meander sideways too, frustrating those that missed the rally. I have been pointing out individual Miners setting up as possible trades. I have mentioned that after buying the lows in January, it was best to sell partial positions to lock in gains, but hold some positions and watch the rising 8 ema. That has worked out well so far. You still have skin in the game as they say. Going forward we just have to see what the markets want to do. The story will be in the charts.
.
~ALEX
.
I’m going to release this at 8 a.m. and then go back and look for typos. It would take too long to proof read, and I want to give readers time to look it over before the market open.
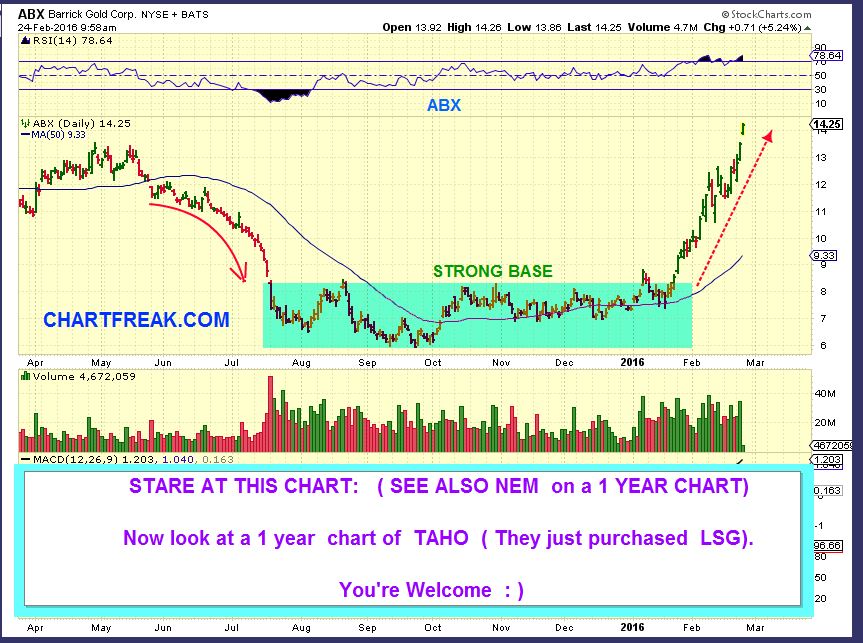
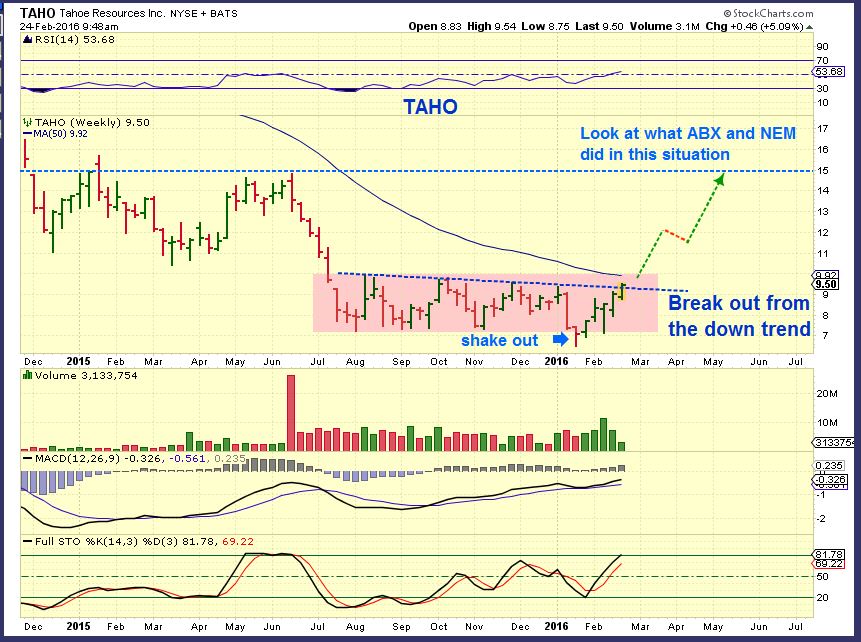
I mentioned that I liked what I was seeing set up in TAHO , the mining company that is buying LSG. LSG had bottomed in 2013 . I Didn’t say that it was a buy right now, it just ran a nice a-c = c-d move on the daily, but I do love the big picture set up if Gold has returned to its Bull stage. What did I like? Stare at this chart of ABX or also NEM. See the weekly base?


Something I have noticed on the COT. It usually takes at least 300,000+ contracts short (commercials) before and intermediate cycle tops. Even though gold is well above the October high the commercials still only have 283,000 contracts short.
And during bull markets is can require up to 350,000 contracts short before an intermediate cycle tops. The COT while not super bullish by any means, doesn’t look exceptionally bearish yet either.
And all of that is subject to change when conditions of the bull market change.
Its not a good timing tool, it’s just a cautionary flag
Is this a possibility: should gold continue to move higher now, these shorts shown in the COT report will have to cover potentially fueling a surprisingly big short covering rally past 1300 maybe to 1350. 1260 I would imagine is the line in the sand for those shorts?
I would never say never, so it is possible.
I saw something similar to what you describe occur in Silver before. The Silver COT was showing that commercials were holding very high shorts, but it was prior to the blow off top. It was a different ‘phase’ or time period in the bull, so I try not to compare different times, but it helps to know that it has happened.
Yes, I am thinking that the euro bottoms, the dollar tops and we can get a POP from the bull flag in Gold.
CDE looks like a bull flag, AGI looks like a bull ascending wedge, and many other bullish looking consolidations in Miners also are worth looking at.
yes…. pop pop
I’m watching the USD to see whether that scenario has a chance to become a reality. Seems to me a big drop in the dollar would be the fuel necessary to kick over the first domino i.e.. new highs in gold followed by a potentially large short covering rally.
Alex, you’re SPX quarterly chart seems to indicate further downside in the markets within the next several months. In closing you say “I still expect higher prices in the equity Markets.” Is that just a short term analysis in a bigger downtrend?
Yes
Good morning Alex.
Excellent report.
Although “that” is one Ugly A** SPX Weekly head & shoulder chart. 😉 😉
😉
Ken- Thx & Long time ,no post 🙂
Nice to hear from you again.
how about that fugly dow megaphone…gijoe 😉
Well Alex, “apparently” Maria does not appreciate your megaphone pattern……hmmmm 😉
au contraire mon frère …
*annnnd .. I don’t need ANY help getting in trouble with the big guy … Kennebunkport .. i can do that ALL by myself ;o)
😉 😉 lol
hahah.. instigator…
Hi-five to all my fellow owners of US Steel, X! Another great call, Alex!
Yes, worked out great. Didn’t look that way in the begging. Also, SWC performing. Thanks CF
I’m in with you both on those trades . Some Miners from a while ago and holding AKS too.
It kind of looks like the commodities are going to continue higher over time, but its a bumpy ride . I love that CENX move off of the lows.
DNR .. giggle
I like MDR
oh wow.. nicccceeee…
So you know, DNR missed their earnings.But the chart does look good. Looks to be breaking out.
Good morning, Alex –
Thanks again for your chart of SSRI last week and for your comment on PAAS
Re: PAAS, I notice that, depending on how one draws a trend line across the highs of late 2012 & mid-2014, it already has – or is working on – a breakout
Couple that with its good fundamentals & it could be a keeper for us longer-term investors!
Hey Cal,
I really liked that PAAS chart. If we have re-entered a bull phase to this sector, you’re likely in on the ground floor. The potential for the miners in a final phase of the Gold Bull is pretty huge.
Where is Carl? GSS 🙂
Here I am. Just woke up (west coast). Lots of volume on it today. Maybe it’s getting some institutional action.
: ) Thats a nice run higher. I’ve been watching it just tag the 8 ema and keep on moving higher. Knew you were watching it too ( I dont own that one 🙁 )
Hopefully BAA will do something similar.
Yes, I’m in that boat too
Also something is up with REE, now REEMF. Volume picking up. It’s pretty much one of the last rare earths still standing (barely).
I was watching REE before they delisted. I’m staying away from that one for now.
GSI (Steel – I think it did a reverse split last year) has some good action today, and NCQ is a copper play that has been moving nicely too.
I thinkk that I mentioned in the comments section last week that I really love flat bases, but in Energy it’s tough because the surprises have been to the downside on most eranings reports.
Well with the flat bases I mentioned NADL, ARP, PACD. PACD popped today, that is what I like about them ( I do not own it. I actually do not own any energy stocks at this time).
NADL missed earnings last week, PACD earnings Today. Must have been good.
This is some great charting. People would kill for this. Still in nugt from Friday at 52. Alex, Where would u set a stop loss ?
Thx Al,
I trigger all of my entries or stops / sells for NUGT using the GDX. Or if it’s just a trade, I scalp gains quickly and move on.
If I used the GDX , I’d look at the 8 ema on GDX, but a gap down after any overnight selling could take the gains away.
Funny, I’m still in DUST from Friday $4.36, should have sold Friday, hindsight! Arghhh. I still see some upside. I don’t think trading these leverages will be easy. Sideways chop. On the bright side one of us will make $$$.
NRA – that isn’t a stock ticker; it means NiceReportAlex!
Your HUI from end 2000 looks sideways on a weekly alright.
I zoomed in with a daily, and see a couple 50% retraces and a 90% before things started cooking.
Just an observation; hard to hang on for the ride if one is in “show me” mode; but good opportunities to get in if convinced that the bull run has begun.
http://stockcharts.com/h-sc/ui?s=%24HUI&p=D&st=2000-11-01&en=2001-08-09&id=p71050238556&a=447452737
Thx Irwin,
And Yes, if the bull has begiun, the wiggles will not matter by the end of the yr.
I mainly showed that sideways consolidation because in discussions with others I hear that it is going to be easy to buy NUGT on the next dip and just hang on to it for a couple of weeks. It may not be.
I like to show that while it is possible that we just pull back and then blast higher, we also might go sideways for weeks to prepare everyone mentally. That is not fun in NUGT or NJUG or options.
I hear ya!
I freely admit to having a gambling problem; that’s why I have a trading account. But I have never, nor ever will touch any triple cripple widow maker. Ha!
(dancing black widow GIF not included)
And ‘wiggles’ like that would sure be painful if you were the wrong way in a x3 leveraged ETF and even more so without a strict ‘stop loss’ policy. You consistently warn on both those counts Alex.
clever man
I fool some of the people, some of the time:)
signed: chartfreakrookie
Nice chart Irwin. Helps to get some great perspective on the possible size of corrections/pullbacks even in a major new bull cycle. And I hope you won’t mind but I’ve printed that off to add to my ‘chart collection’ as a nice reminder in the hope/expectation that we are indeed just starting another major new bull cycle. 🙂
Thanks – it’s just a hobby of mine.
Good hobby. 🙂
orrr addiction… depending how u look at it 😉
Definitely addiction in my case!! Lol 😉
“PASSION” would be the Polite way of Putting it.
-saw that word used in an advert I received in my mail today.
ahh.. yessss .. passion … that is correct.
hmm.. you don’t say…. 😉
Okay – what’s going on?
– markets breaking down and PMs flying away.
Alex, any thoughts on XLE? I’m playing energy through ERX, and it’s not acting like you’d expect with USO up 2%. Obviously spx not helping matters, but i’d like to your your take on it if you could. Thanks!!
Hey Peter,
Sorry , I was gone this afternoon.
I took a quick look at XOM & CVX and they look like XLE.
I’m not sure why they would be down when Oil had a nice day, but that bleeds over into ERX too. I did see many smaller Oil stocks popping ( NOG , HK, etc) so again- I dont know why the XLE is turning down today- I may take a look into it later, but I have some research to do in the metals markets too.
I appreciate it Alex! XLE has just been meandering fairly trendless under previous support. If you look at a daily you’ll see an ascending triangle between $58-$50 . It is struggling right at its downtrend line from the high last november. Bears slam it at the 50 sma, but it seems to bounce back up immediately. But bulls buy it, bears push it back. I have a target near $64 on a break of that triangle, but losing patience to be honest. Thats my take though, i’d love to know how you see it. Love your work,btw. I’ve been a sub before and cancelled only because our styles are different. But you really do a phenomenal job. Congrats!
I had the same question but no answers. ERX has traded pretty nicely against 17-17.4, hopefully that will hold. So, one of two things might be at play – SPY and friends may have sold off due to end of month – some were just squaring away positions, probably why it did well enough all day and sold into the close. If it reclaims the 50-day tomorrow, that would confirm this possibility. The other would be that energy knows that this is end of oil’s move up so folks are abandoning early. I hope that’s wrong!
Hey Cason! I actually stumbled onto something going thru the XLE weekly tonight. I still cant figure out how to post the dang thing on here though!!! :-/ I’ve been following what looks to be bullish action in XLE, but so far there hasn’t been any follow through. But the weekly chart has something that I just noticed that has me thinking we might still be right. The rest of this week will be the tell. But where the typical trendline(price peaks) still has XLE below it, I saw a trendline in the weekly that might have broken out last week, and backtesting that line this week. I’ll see if I can post it tomorrow. Interestingly, I use a 5,35,5 weekly macd setting, and also the standard 12,26,9, and BOTH are on buy signals. Also, when looked at from ERX perspective, price is right at its long term trendline from its all time high. Let’s see what happens, but a burst through there could get a pretty solid short covering rally. We’ll see… ps: did I mention the H&S in ERY???
Yeah, please post if you can. From phone tap and hold down on the image until menu comes up (like a ‘right-click’ on desktop mouse) then save image. Go to CF page and click the add image in lower left of dialogue box. Then find the photo you just saved.
Ok, I’ll chart ERY tomorrow to take a look. Would be good, energy has been tough recently.
Man that was easy!!!!!! Thank you! I will now bombard you with my energy charts!! 🙂
Man that was easy!!!!!! Thank you! I will now bombard you with my energy charts!! 🙂
That was XLE daily showing price still under trendline. Now here’s weekly with alternate trendline.
ERX weekly downtrendline…
ERY daily, with h&s and downtrend channels. A little messy with too many lines, but they’re there for a reason…
And now I’ll let you fine people sleep! Getting carried away with my new toy!!!!!! Thanks.
If only I was as good at trading as I am at tech. 😛
I’ve learned the hard way that I am more of a speculator/investor, than a trader. I am more interested in long term trends rather than short term stuff, too much noise in the daily wiggles. I focus mainly on weekly charts, with daily charts for clues to whats happenning beneath the surface. Thats why my style conflicts a bit with Alex’s. I look for bases breaking above their mov av, while Alex has no problem trading something from a low TO its mov av. But I think his reports are phenomenal. He has a great talent.
And I suck at tech!!:-/
Good evening everyone!! Pleasure to be here exchanging ideas with you! I have a question for whoever can give me a hand here… how can I post a chart off of stockcharts through my android?
Hello & welcome Peter peter cotton eater… sorry i don’t use stockcharts but do you see any option to ‘save chart?
Got it Maria!!! Cason helped me out there…super easy. Glad to be here, and great meeting you. I’m curious, where are you from, if you don’t mind me asking….??
Yes. . Saw that farther down. . Giggle.
Usa
You wouldn’t happen to be from south Florida?? I’m in Miami, thats why ask. Would love to meet up with other investors/speculators/traders near…
We have 4 seasons!!! Trust me, when you live in Miami, you know that summer.is so brutally humid and hot, you know the weather is perfect in spring and fall. And we have winter too, for about a week…. Have a good night Maria!! Thank u for your help! We’ll be talking often…
I am having a cupcake. With UWTI and X on top!