
Wash Rinse Repeat
Well, I had a weekend report with 32 charts and not much has changed in one trading day, so lets do a little review and then look at some trade set ups.
.
Last week we saw a healthy set up for a move higher
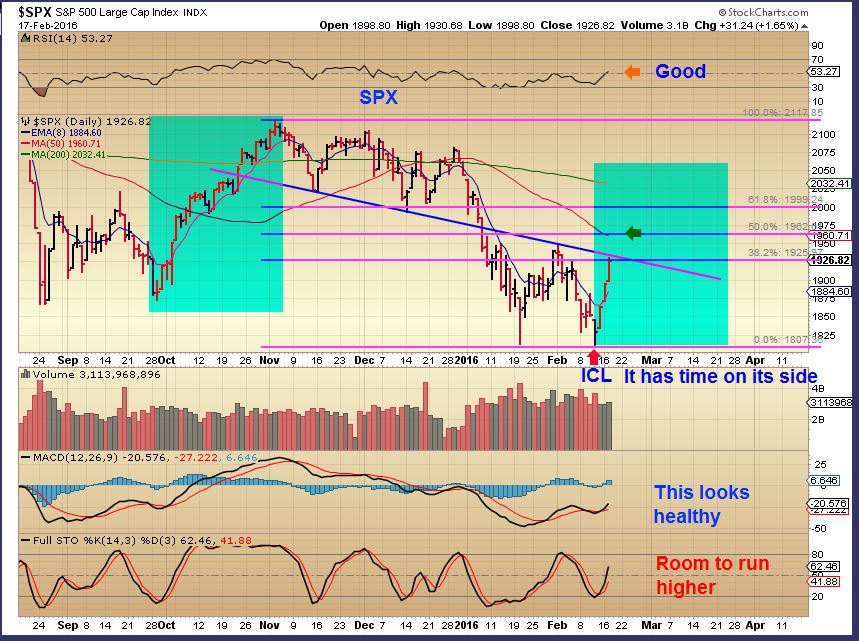
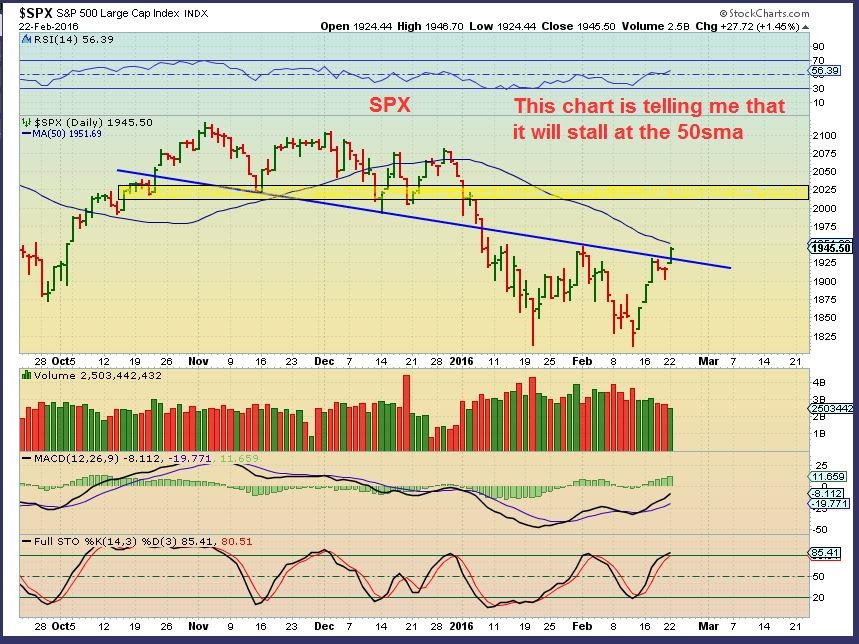
This week…
We may stall again at the 50sma the way I see this break out. The indicators remain bullish, the volume was light.
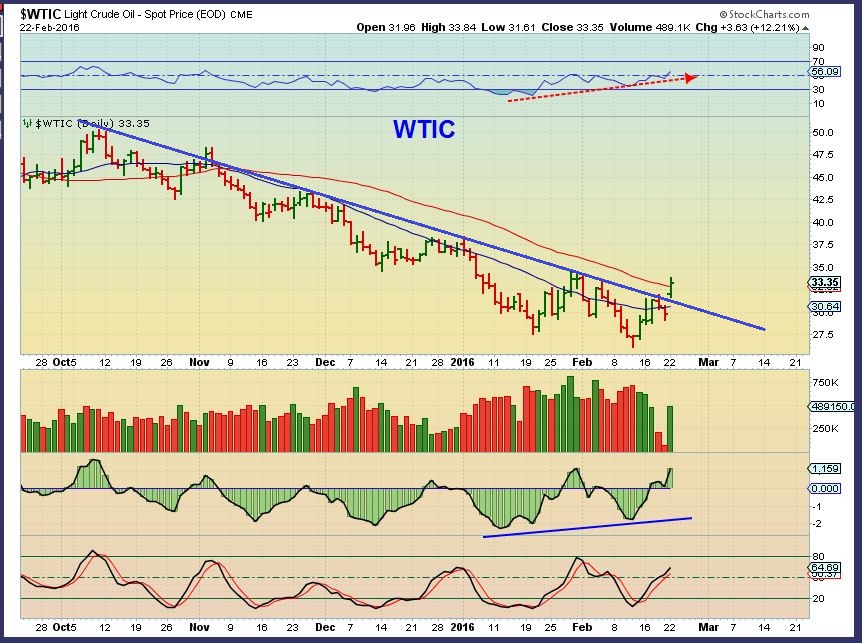
WTIC – Oil, no change from the weekend report, I’m still bullish.
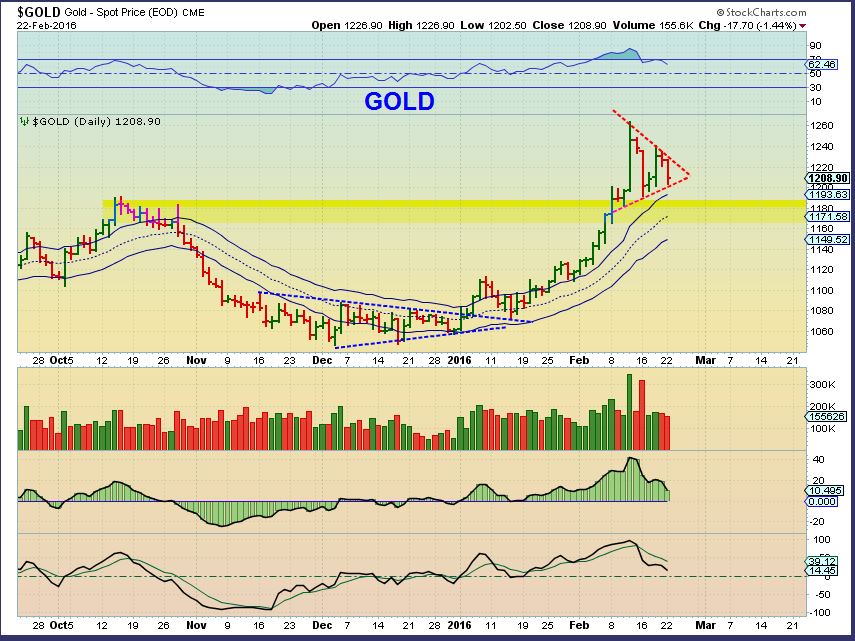
GOLD – No change. In this chart, I was discussing a possible flag formation after the strong run up, before there was a flag.
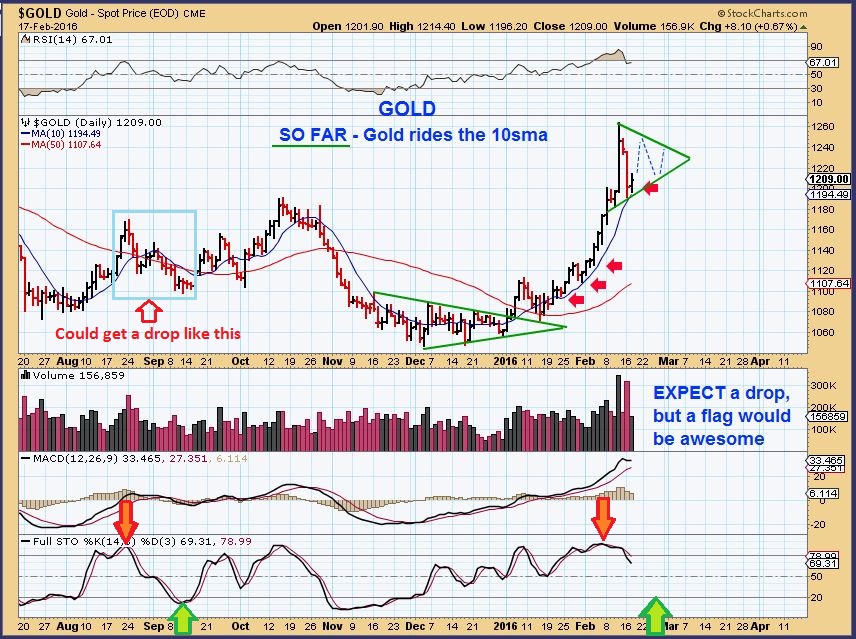
It has formed. I prefer a drop to $1180 though. A surge higher, a big drop, a surge higher , a big drop. Wash-Rinse- Repeat. It is known to be a bullish continuation pattern.
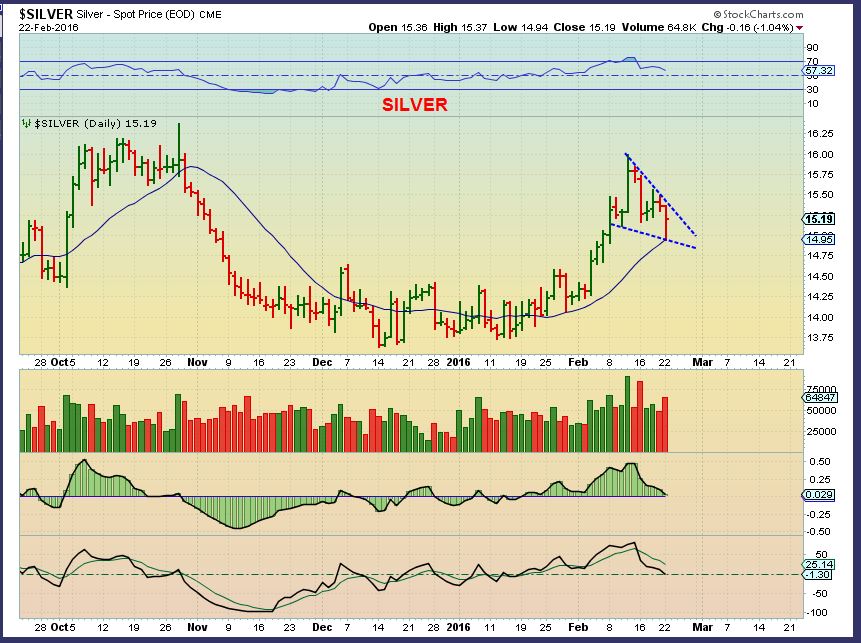
SILVER – This kind of looks ready to turn higher, as a wedge.
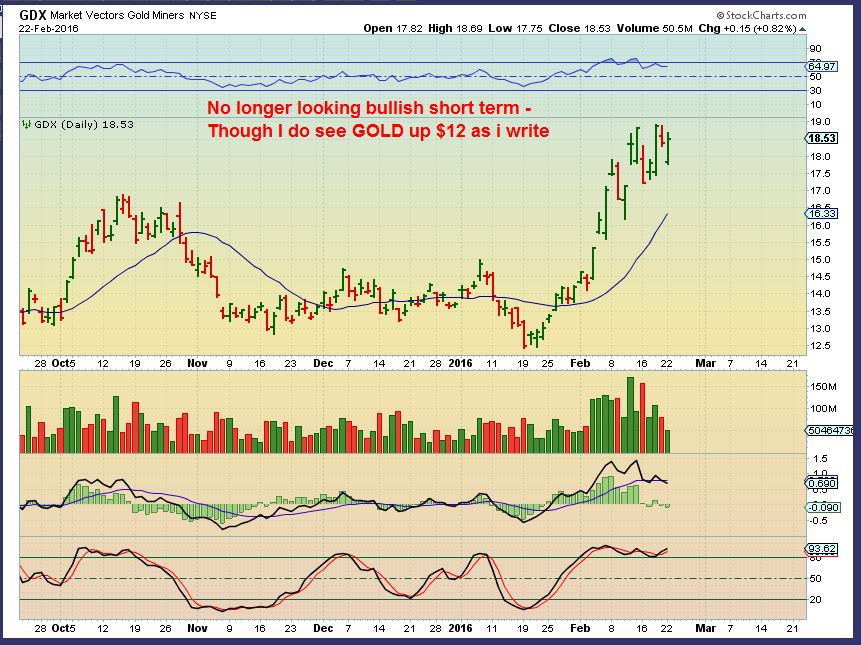
GDX – It looks ready to break out , but also had weak volume. That makes it look a bit tired to me, but that can change if Gold moves higher. Surprises have been to the upside, right? Wash- Rinse- Repeat.
.
As mentioned in prior reports, despite the movement of Gold , GDX, or other indexes, many individual chart set ups are acting correctly. This is encouraging, because I keep finding good looking set ups in Metals & Miners, and they break out even if Gold only goes sideways. As a learning Lesson, Lets look at some stocks playing out this way.
.
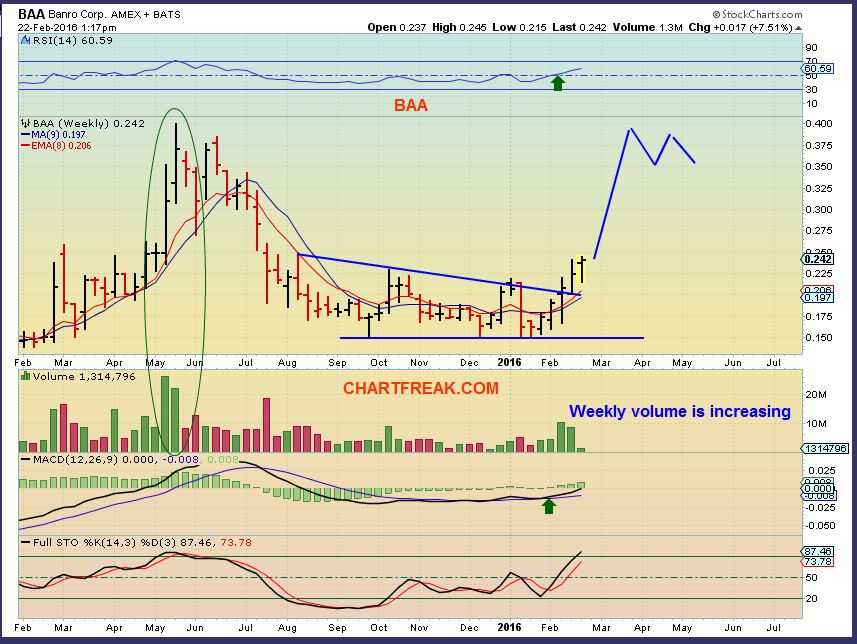
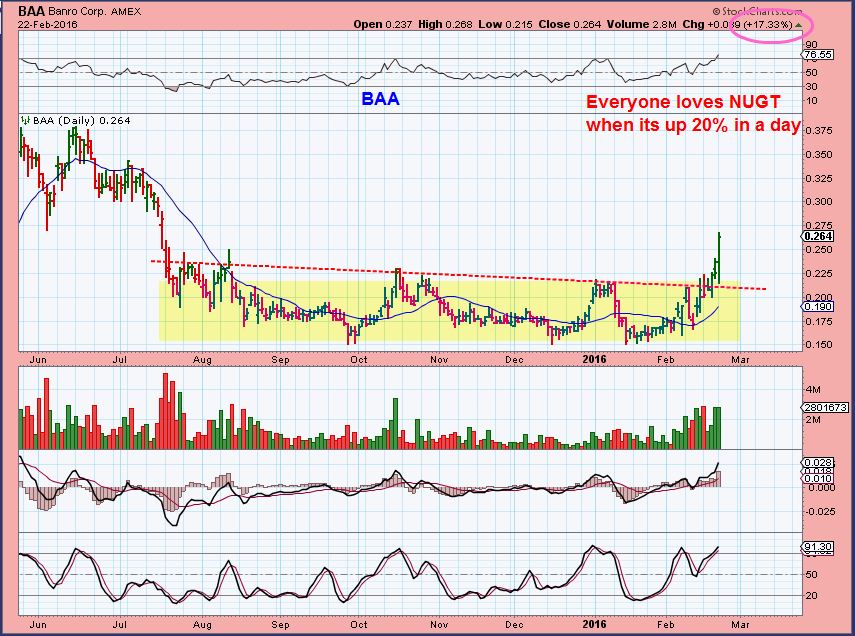
I’ve been discussing that base & set up in BAA since it re-gained the 10sma at 17 cents. It was up almost 20% Monday with Gold down.
.
BAA was only up 7% here, and this is what I expect in the long run.
.
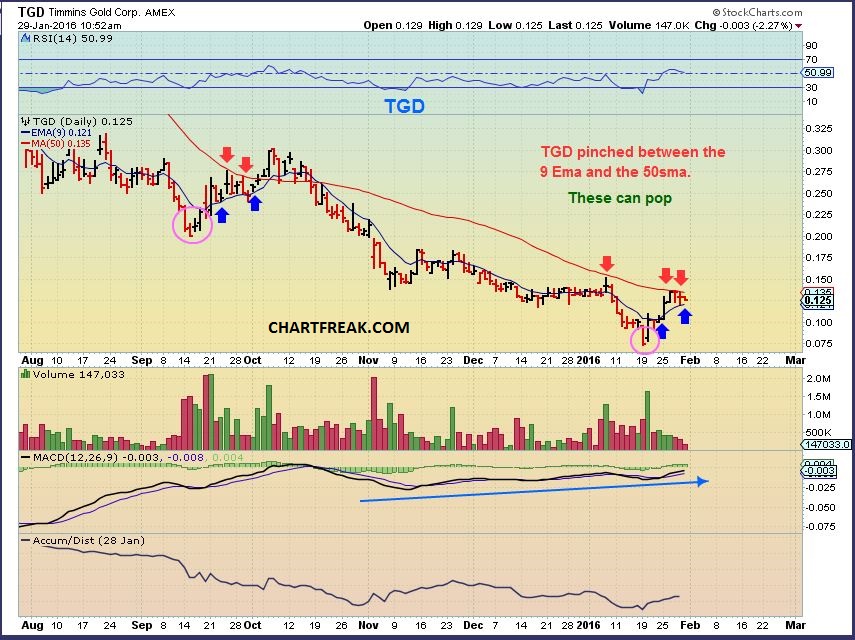
I want to point out that when conditions are favorable and you see a stock pushing along the 50sma, it may want to break out and run. I pointed this out with TGD ( Which has doubled since).
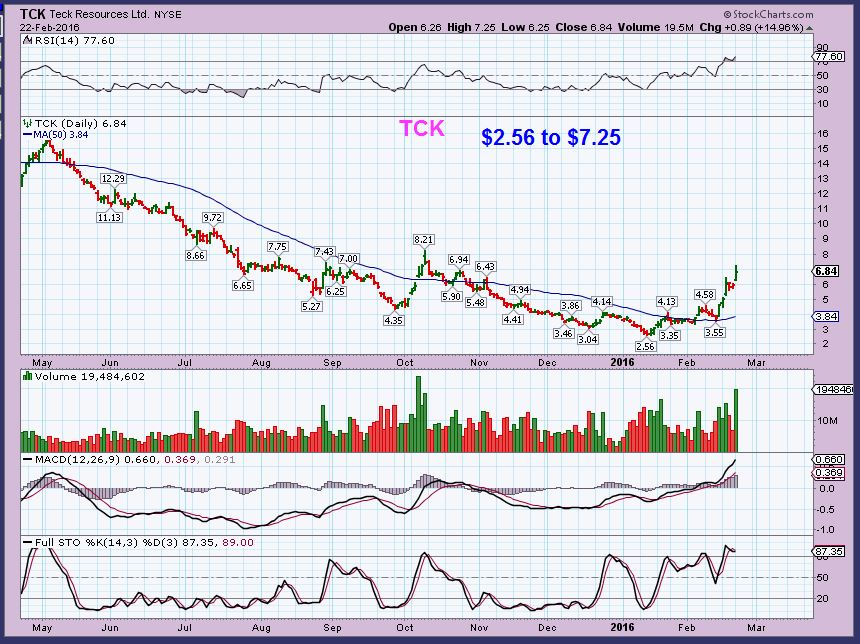
TCK was pushing on the 50sma for weeks at the end of January, broke out, back -tested that 50sma , and took off.
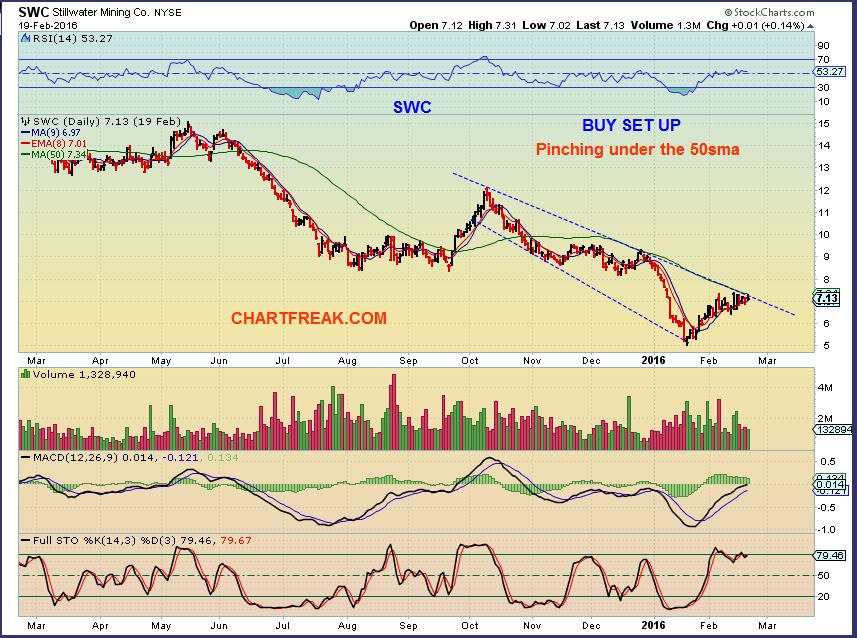
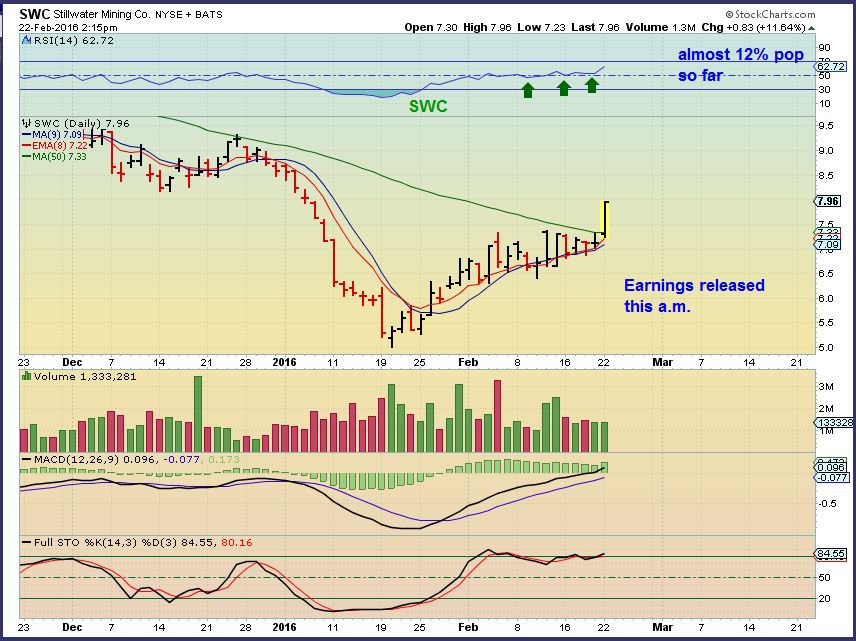
SWC was pushing on the 50sma for days. It’s hard to see here, because I drew a trend line on it.
I had mentioned last week that SWC looked like TGD, pushing under the 50sma.
.
SWC – Then I also mentioned in the comments Monday as it moved above the 50sma that it was a buy for this reason. I hope some were able to catch that. It released earnings and Popped. I expect it to run higher, even though it could back test that 50sma.
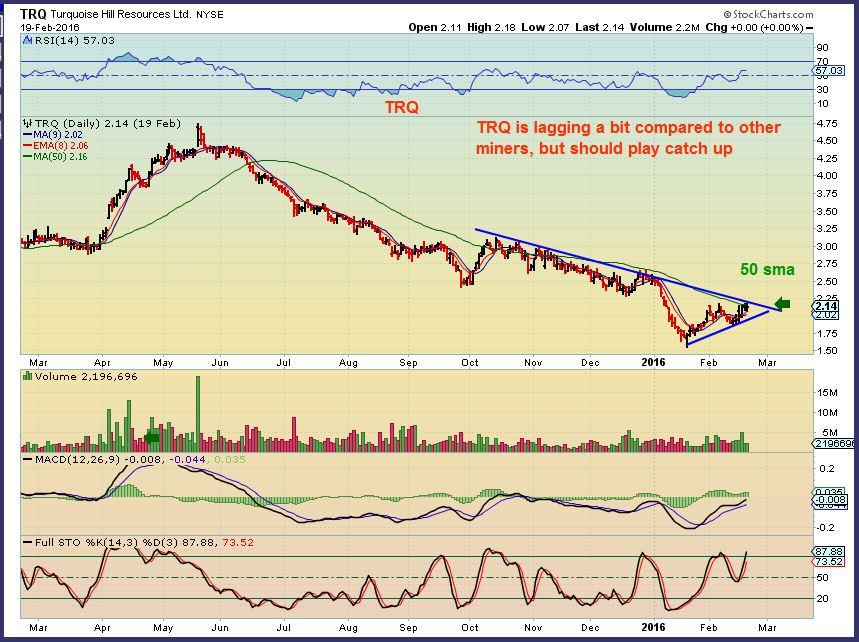
TRQ – Also mentioned last week, and was also pushing on that 50sma, and also broke out today ( not shown in this chart).
.
So as a review to show these set ups can play out over a longer period of time:
.
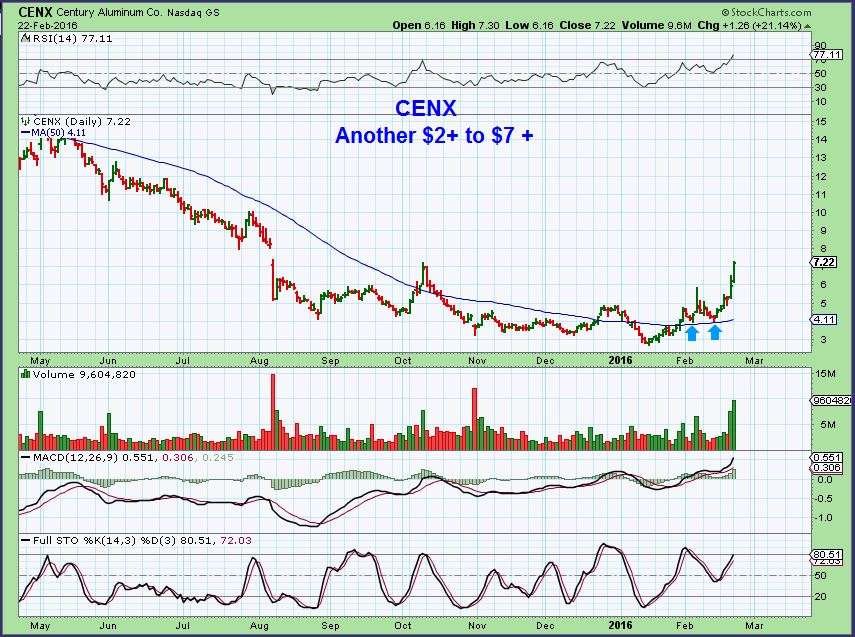
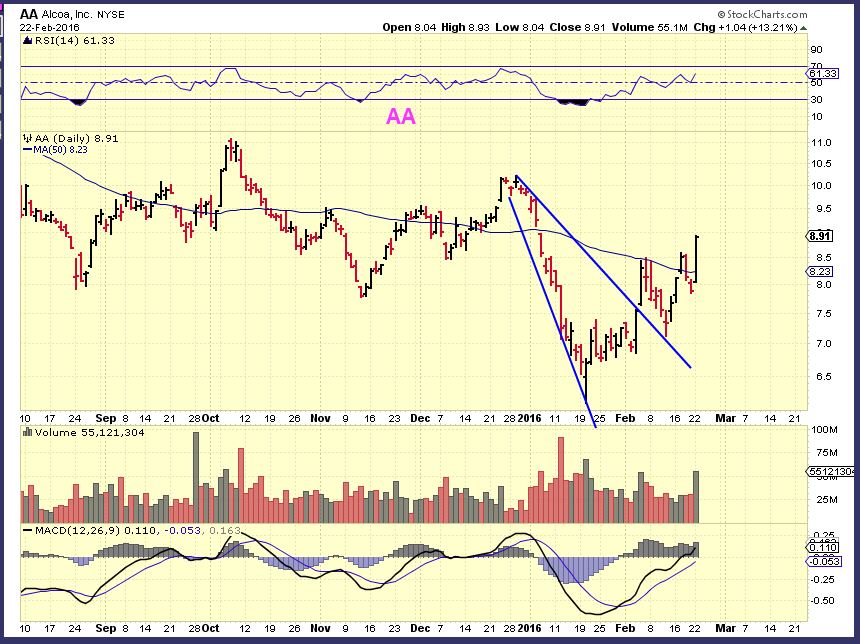
I have been mentioning that I expect Commodities to run and I pointed out set ups weeks ago in FCX, VALE, CENX, AA, X, AKS, STLD, etc etc . They move higher, pull back and worry people, then move higher again and again. A stair step higher.
CENX offered a nice 2nd buy at the 50sma ($4).
AA pointed out Feb 3, breaking out here.
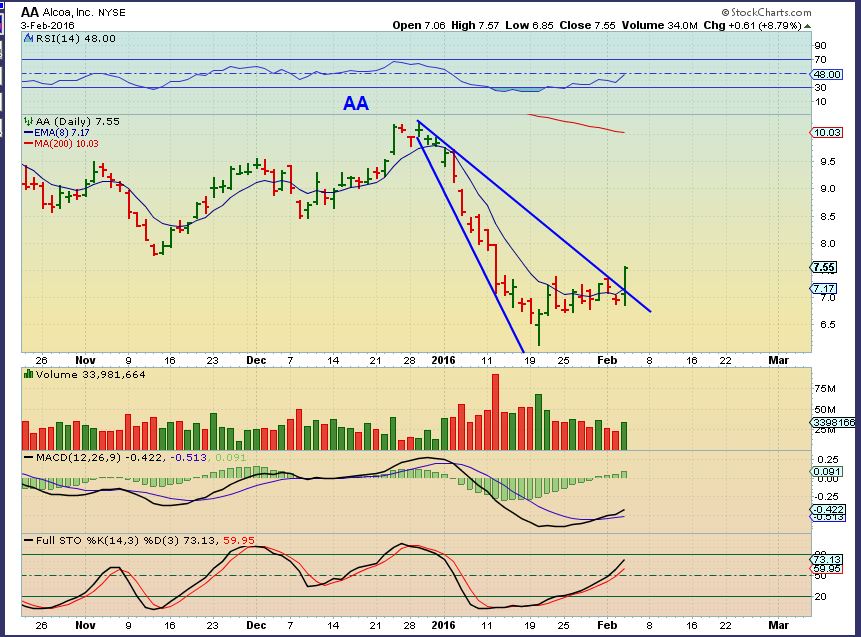
AA – Back tested that break out, but continues higher.
Now lets just post a couple more charts of interesting set ups in Metals, Miners, and Energy . Some can be bought when they pull back, others may be ready now. You could write them down and keep a watch list or maybe even take a small trade if the set up looks good.
.
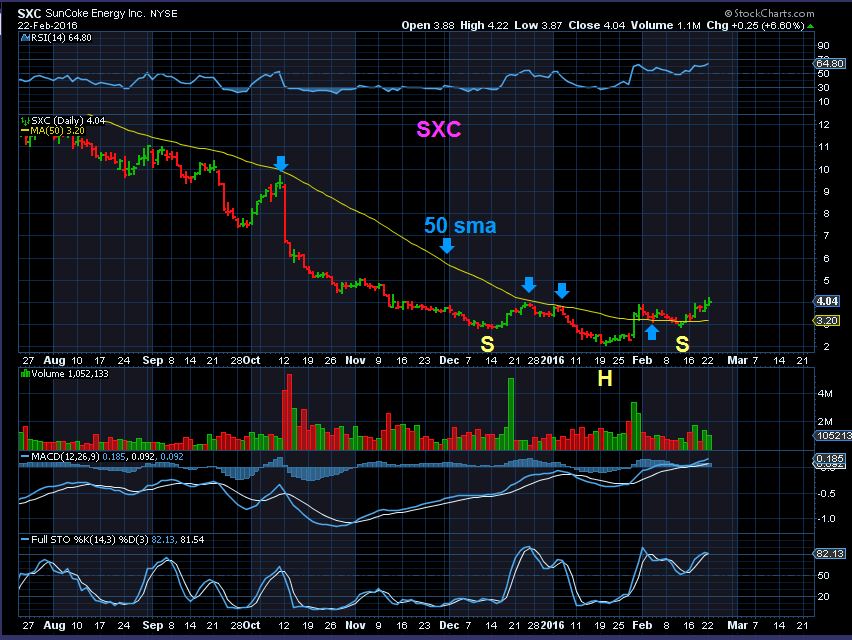
SXC – This has already doubled, but looks like it wants higher price. This could actually eventually run a lot higher. It might pull back to the 50 sma first, because the volume is slowing down.
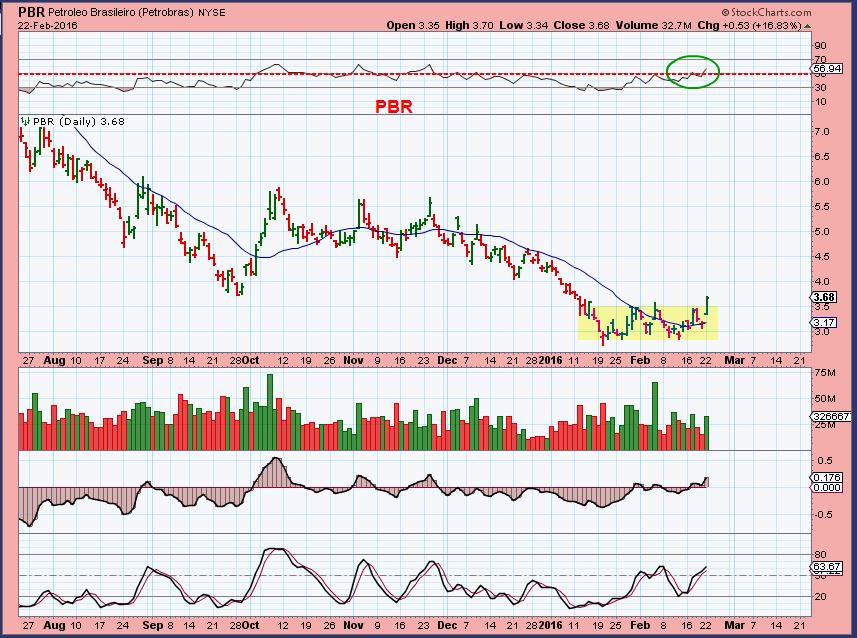
PBR – Break from a base, 17% gain Monday.
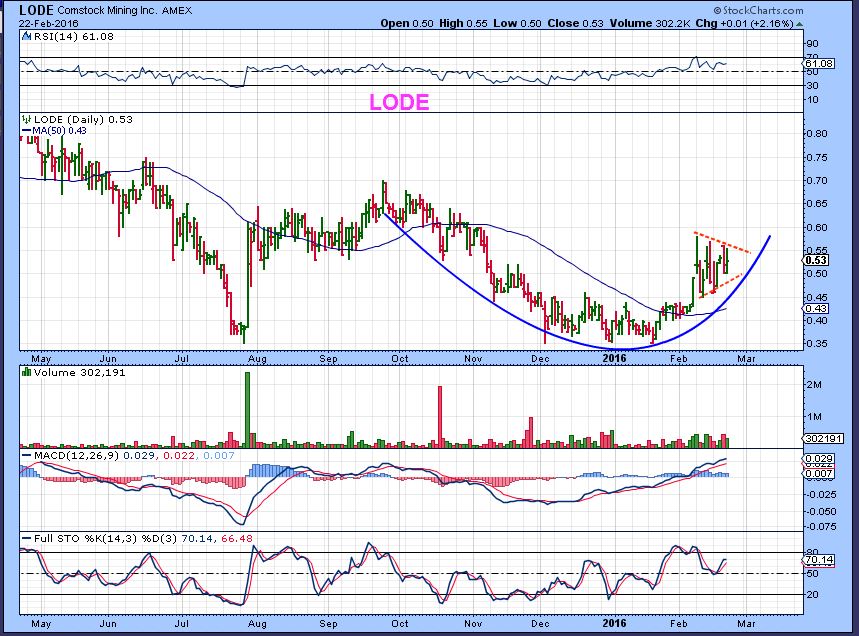
LODE – this is an interesting set up flagging.
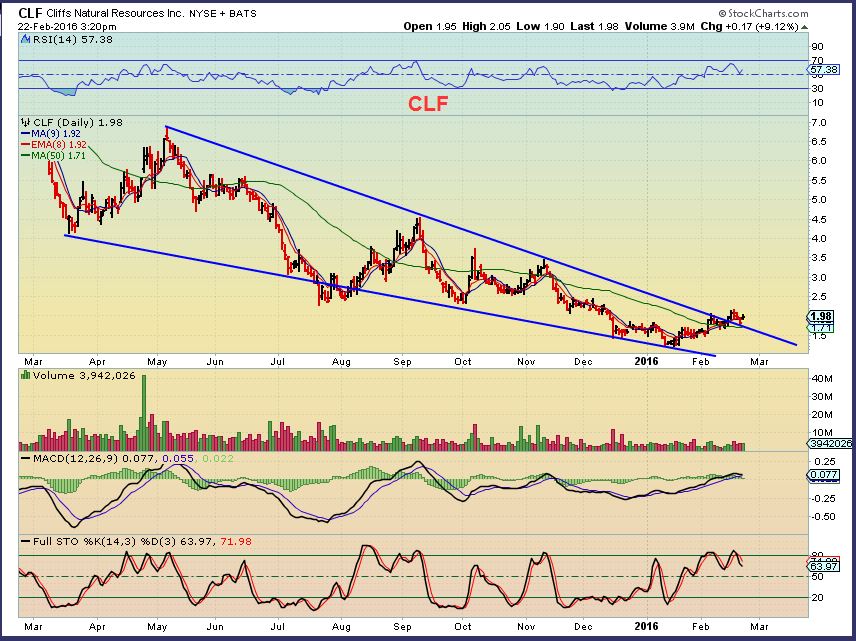
CLF – Its a $2 stock that was over $90 5 yrs ago! This could be bought now ( Not sure when earnings is off hand). CLF is quite a Popular company. Well Known in its sector.
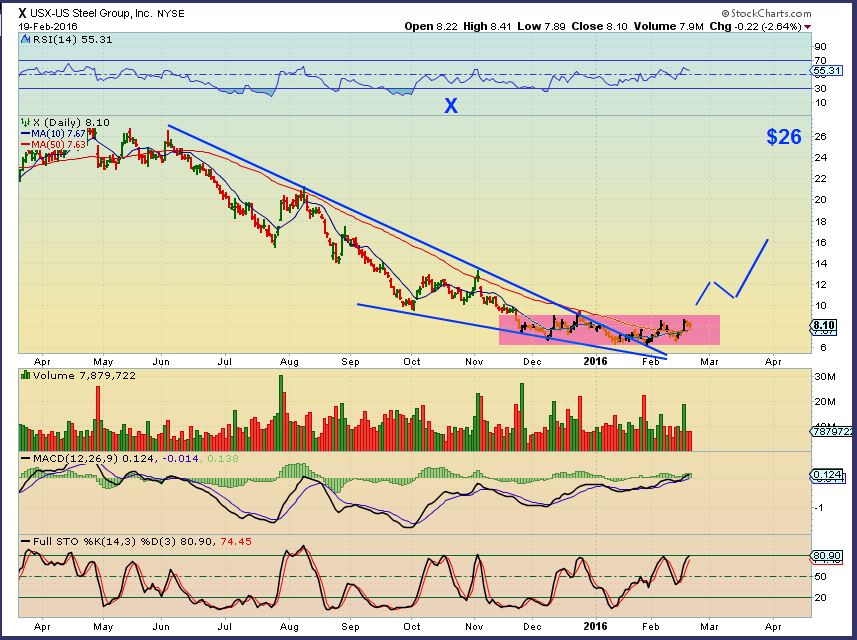
X – Steel stock shown here already in the weekend report. Nice base with good potential.
I’ve also been mentioning a few other areas of interest, but obviously I am trying to focus mainly on Miners and a possible 2nd leg higher when this one finishes resting, and Energy may really make some good moves for traders too. This is really a traders paradise with all of the different set ups that I can see. Even short term buy & hold investors ( 1 – 2 weeks holding) have been rewarded with FCX, VALE, CENX, etc.
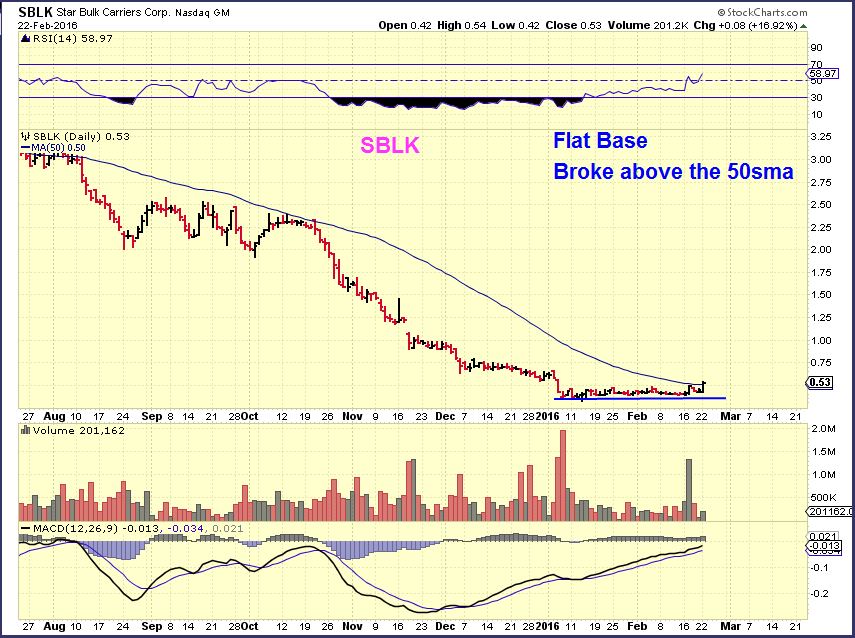
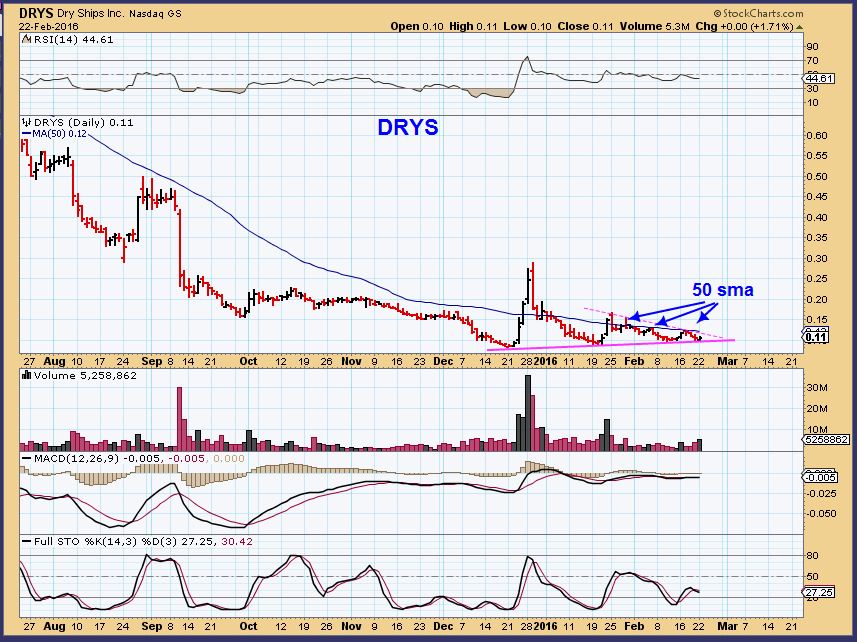
Outside of metals and Miners and Energy, I’ve noticed improving charts in some Solars, Shippers, and tech stocks. Too many to list in 1 report, but here are a couple of ideas. Consider these only for experienced traders, hopefully able to watch their positions if a buy is taken.
SBLK
DRYS
See also SB, NM, SOL, JKS, CHK . I’m looking at some energy stocks like PACD & ARP as flat bases, possibly ready to trade now.
So these are a few ideas. I may write a public report later today, and it will only include a couple of trade ideas. I may discuss FCX, VALE, CENX, and how they have performed. I usually wait at least an hour or so after the market opens to allow anyone here to trade in the morning first.
Fast markets, some nice set ups, decent moves, but please remain cautious and always be ready to sell if a position moves against you ( Use and honor stops). Also try to be aware of when company earnings are if you plan on holding a position for a longer period of time. Stay Frosty and best wishes!
.
~ALEX


Alex, what do you think about the last 5 minute volume Yesterday on RIG, XEL, POT
For one thing, when did RIG get to $8!
I’m not sure about that volume in RIG Friday and Monday. I see it all of the time in GDX and have heard 2 or 3 valid explanations, but I have no concrete proof of what causes it. Price hardly moves in relation to the size of the volume, so it may be accumulated during the day and added in at the end of the day? Not really sure.
Earnings Tomorrow?
Volume on UWTI is picking up huge the last two weeks
Alex I’m very anxious to see how GOLD plays out, same with the rest of the market, Monday was flat & boring. BAA looks very very appealing to me. I think I see how it opens and might jump in a the first dip, hopefully it won’t be late but ur chart does show promising uptrend. Thanks
Hi Al,
Gold has a way of acting whacky too, so I am interested in seeing how this plays out. By whacky, I mean it can form a flag, break out higher for 1 or 2 days, then just when everyone jumps in for another leg higher it drop down and tests the apex for 2 days , look like its breaking down, and then take off higher.
If you were abe to follow that, also picture it in reverse. Breaks lower, bounces back up, then dips again. Gold is usually a multi scenario possibility at turning points. Easier to call at the lows.
I like the potential on many of the smaller Miners if they can whether the bear mkt. BAA has good upside potential, especailly if it ever breaks above the 50 cent area. ( See a 4 yr wkly or monthly chart)
GUSH and KEG look like they are ready to move higher. KEG beat earnings. Big volume on GUSH building energy in the energy sector! 😉
The sirens song of Gush and NUGT, Catch it right and you get really quick gains. Catch it wrong and get chopped up.
It does look good though.
I have KEG down 15% pre-market , but no news, it may be a fluke pre-mkt false print.
Im showing it up pre market?
LOL . This is what I was looking at.
http://www.marketwatch.com/investing/stock/keg?mod=MW_story_quote
It’s only 18,000 shares at $0.23 ( $4000) so sometimes someone just sells a ‘lot’ and causes that.
Huge gap up on BAA!
Volume for the first 15 minutes is quite heavy too.
(I’m not hating it ) 🙂
SWC gapped up nicely too, dropped to try to fill it, and took off higher again.
Well X didn’t work out? Did you sell?
Im going to buy x probably today at close watching for a pullback if she continues down with new lows, I’ll wait
I think X will be a buy at the 50sma refresh
.
I just bought X
I hope it ( as a Steel stock) does for you what the aluminum stocks have been doing (CENX & AA) . The bases look good.
out of BAA for today, sold at .30, nice profit but she’s overbought now, strong resistance at .30, volume looks good tho. she could go higher, great call on that Alex. I liking X (US steel) 20 & 50 avg are about to meet, RSI looks great, ICHIMOKU cloud is thinning, she could pop up any day.
Agreed, looks to be a good entry point here. I think the low of the day is in. I bought a day toooo early.
I should have scrolled up here first 🙂 I just posted a chart on ur comments below.
Also , the FLAG in the LODE chart in the report today, its breaking out with volume too.
That’s why I came to Alex. Been following him for 7 months on stocktwitts and his timing is perfect. last year of trading, Timing was everything for me. But prior to 2015 it was easy to trade..volatility is a bitch.
I will hold MUX (up 6.06%), Alex showed some good technicals on the chart soo setting a stop loss and see what happens
Nice trade on BAA al. I’m not selling simply because some of these are exploding out of their bases and the pullbacks are only flags. See AUMN, VGZ, MUX, and of course DRD. HMY, etc
Yes, I am holding on to AUMN, MUX, DRD, HMY as my core long trem positions
I also have AUY, GPL and TRQ – Trying to figure out if I should hold or or sell it
I am getting tired of TRQ myself. I see other stuff rocketing , and this is just acting a tad lame, even though its light volume down today. I may just take the small profits and use the $$ elsewhere.
I know as soon as I sell, it will rocket higher, but I need to forget that emotional wish, and just look to see if my money would be spent better elsewhere.
words of wisdom… 😉
cute puppy btw
Thx – When I post an animal as an opening picture, I still get a txt from my mother saying the same thing. You beat her to it today. 🙂
She keeps track of my opening themes. lol
oh…. hmmmm … does she … ummm errr .. read the comments? 😡
L .. O .. L
LOL, Maria Censored!
oh my .. .im scared… ha ha ha
….
Ha HA- No.
She does not read beyond the public access area. She doesn’t understand Tech analysis, the charts are just pretty cool looking to her : )
Baa…is this a good long term hold? They have a mine in production which started production Jan 2016…just last month…
hi Hay
If the bull market has returned, I would think so. Look at that Huge beautiful base on BAA Wkly. Also, it did a bit of a double rounded bottom lows, so it bottomed in 2013 and seems to have just dropped there and bounced higher now too.
IF the gold bull has not resumed and this is just some crazy kind of short covering rally that lead to panic buying and then returns to selling , then it’s hard to say.
Sorry, I dont mean to be vague, just kind of a Bull / Bear Scenario. I own a Core of BAA in the 15 cent area. I bought it on the way up earlier this year, but sold that portion on the way down again.
Hay is for Horses…
Thx Trigger (Shane)
lol
sorry… all horse, lone ranger, tonto references are reserved for my bf ken…
Whoa!! … You started it.
Giddee up
giggle… cuz u wrote hay instead of jay …ha!
And I wrote WHOA…Like hold your horses 🙂
yeah.. i got that …
smooth …. like Santana ;o)
*ps. u know .. we actually used that .. a lot … not just as a cue to ‘stop’ but to ‘settle’ as in … “… shhhhh .. whoa boy …
i find myself still using it to this day, when ……
shoot.. gotta run
so for Baa baa black sheep… i was targeting .40ish as my 1st sell and watchn somethin somethin like this for a ‘path’ … approximately…
(anyone feel free to chime in… except no training wheel comments. (ahem u KNOW who u R) ;o) i did try & clean that up for u. i saw u askd for a baa chart a while back- apologies 4my tardiness)
https://www.tradingview.com/x/laR49faU/
I sold my BCEI earlier for a loss . The energy stocks are getting hit pretty good right now.
Hi Alex – I know that you had once mentioned that OIL ticker tracks very closely with Crude oil. Looking at this chart (REFRESH), its showing as in the 20s back in 2014 when crude was close to the 100s. Do you expect OIL also to have slippage over years ?
USOIL turning higher, good entry point!
Anyone have any thought on CIE? It’s having a decent day despite the weakness in oil and oil stocks today.
Released earnings yesterday.
Not sure if it s a bottom or not, but PKD looks good, and PQ having a good day despite Oil down too.
Thanks!
Hey Alex…Are you still ecpecting a dcl with a break of the trendline and the 10 day ma?
Hi Mickey,
I do expect that, but maybe I should go back and look at other powerful moves out of the lows and see if it was absolutely necessary in every case.
I have seen just a sideways consolidation that eventually reaches the trend line and the 10sma, so there is a chance of that too.
Thanks for that possibility. Waiting patiently to add. Wonderful information everyday. Thanks again
Thank You and I appreciate your being here.
Alex, is SPX getting rejected at the 50sma?
Yes, so far.
I was thinking this would happen. I pointed that out in the 2nd chart of this report, that it was likely due to the weakness that is developing, BUT … It might just be temporary. Like how some stocks crawl along under the 50sma until they can finally blast through it.
Give me a heads up when its time to go back to SPX, please. I have some 401k in cash. I want to time a return to the market if I can.
Long or short term?
I think I said it in a report when you were on vaca? Just that I think short term lows are in, I expected a rally (Maybe to the 200sma again?).
I expect markets to fail and fall, but if they broke out upside to new highs, that would change the out look.
Short term, 200sma is a target, okay. Do you expect a pullback tomorrow due to the 50sma?
Possible. SPY could finish filing the gap at the 8 ema, but it also could do that going into the close
I’m long UPRO here. Will scale out as we approach 200 day and start short – unless we close over 2000 with significant strength, but I still smell bear market.
Darnit! I didn’t see your comment on that until after the close yesterday. Did you notice that S&P cash never hit 50-day, was 6 points shy. BUT, DJIA and SPY ETF both hit 50 day to the penny. By the time I figured it out, missed my exit. Plan was hold to 200 day, but was going to trade around the core. Will be interesting how close 200 day gets to 2000 when we get there to see if they all intersect.
Bill, remember when we used to talk about Biotechs? look at EYES, ZIOP, PETX.
I remember and I was noticing EYES today as well as SNY and NVO. Starting to move higher.
Wow, I was looking at EYES when it was up 13% now 26%? Can we expect similar moves in the rest of the sector? REPH and NVO the only other ones up.
wow….
for somethin like this??
https://www.tradingview.com/x/e6Kg2vqn/
Yes, possible, but at resistance via your trend line
Odd question…..Anyone know if crude did a split or something? My charts don’t even show the low of $26.05 and close on Friday was $31.xx yet today its down 6% & still at $31.34 ??
Al, check my post from last night. March futures expired last night. We’re on April now. There was almost a $2 jump from Mar-Apr. But we lost every single cent of that today. Paying to roll contracts smoked USO.
Thanks Alex, I knew something was not right. I’m digging this site very much man.
Any chance that the ‘pullback’ on Feb 10th was the half way point and we’re in the 2nd half move already? This thing will not quit! Crazy, isn’t it?
That’s what I’ve been banking on with the staggered gdx to pog cycling
Really hard to be too bullish on energy still. Definitely a hot mess – international jawboning drive +/- 6% swings every day. API uber bearish tonight at +7.1M. It’s getting hard to trust the stats, it’s like Chinese PMI numbers! The swings are Millions and Millions of barrels in a week span, each direction randomly. It would be better if it would keep the long term in sight but the market moves on this each week.
Did anyone see the SGY earnings? Probably one of the worst reports I’ve read in my life. They are in a LOT of trouble. Closed at 1.42 today; this was a $10 stock just back in October!