
Mary, Mary, Quite Contrary, How…?
Even in the toughest of environments, we see seedlings take root and blossoms shoot up. We also see the same thing happen in the toughest environment in the markets. At the time it may seem quite contrary, but this is also how bear markets can turn into Bulls. Are we seeing that now? lets look at some charts…
.
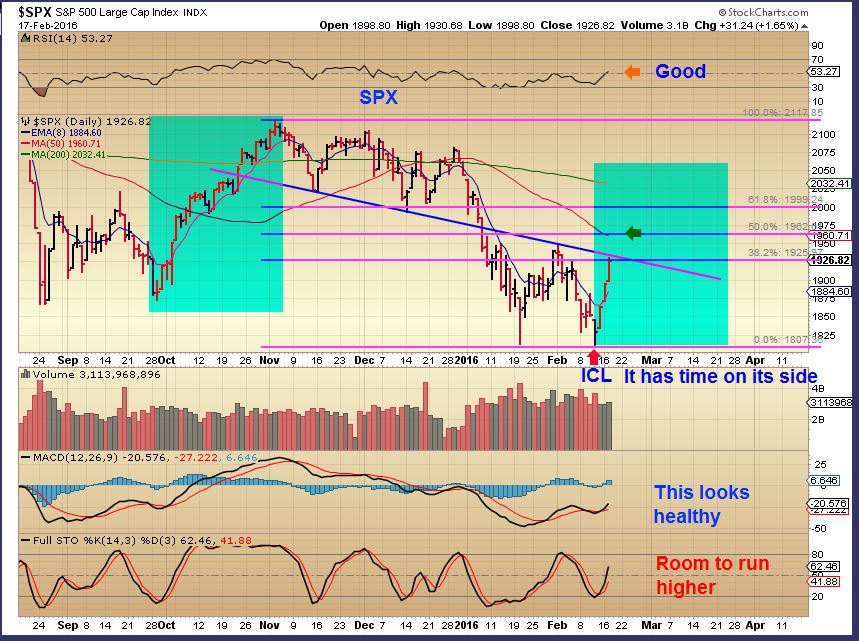
Starting with the SPX. We have expected this rally , but will it lead to new highs, or will it roll over?
.
I think that this move is just starting and it can last for a couple of weeks. Notice how the Rally in October didn’t lead to new highs and broke down to lower lows. We have lower highs and lower lows in the markets now. I have drawn in several resistance points and we will see how the markets react as time goes on. This is NOT near a point that I would short it. I would remain long, maybe lighten up in a week or so. The BLUE BOX is an idea of what we may see.
We will obviously discuss what’s unfolding as time goes on, but take a look at this…
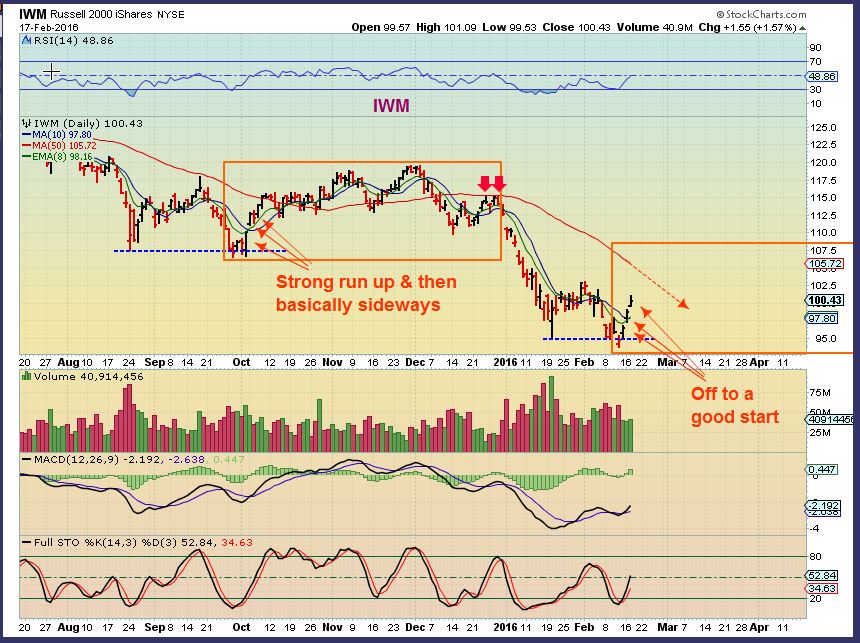
IWM – In October the IWM shot right up and when it got to the 50sma,, it kind of meandered along. If we start going sideways, there will be signs showing whether it is a consolidation readying to break higher, or drop.
.
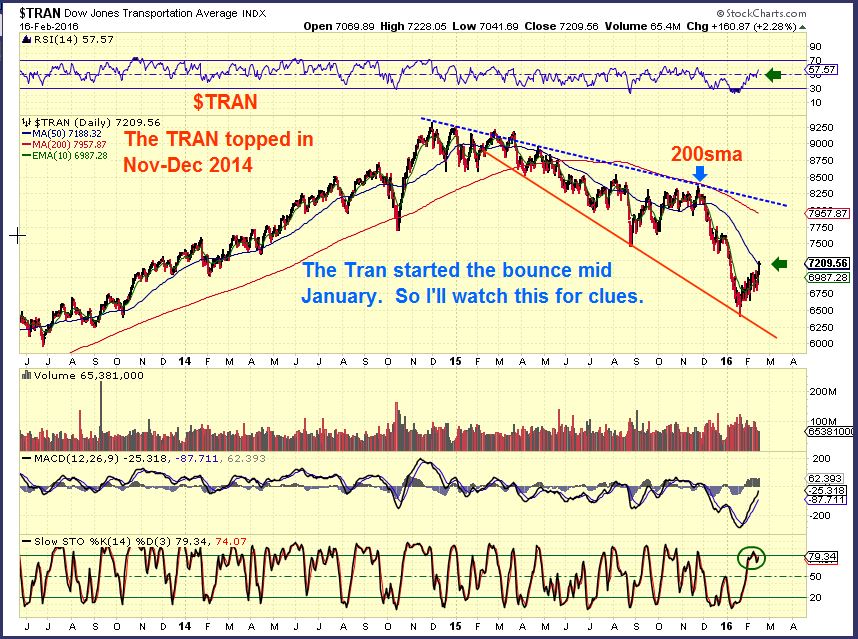
TRAN – I pointed out yesterday that the TRAN did NOT double bottom like the SPX, QQQ, DJIA, etc. It seems to be leading ( it did lead us down too). Would it stall here at the 50sma?
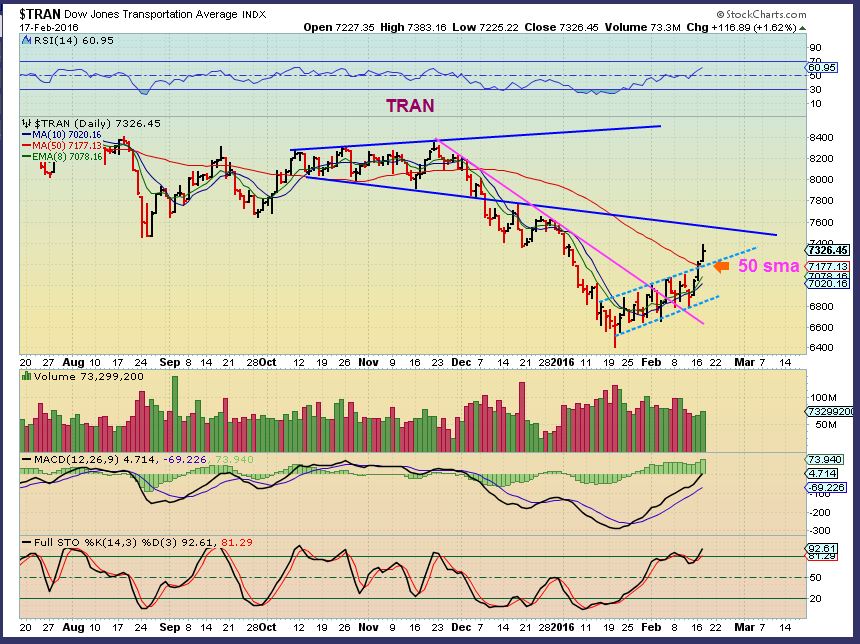
TRAN – The $Tran actually broke above the 50sma. It did get above the 50sma out of the Sept lows too. I re-drew the resistance for the next possible test, and the 200sma is quite a bit higher near 7950 .
.
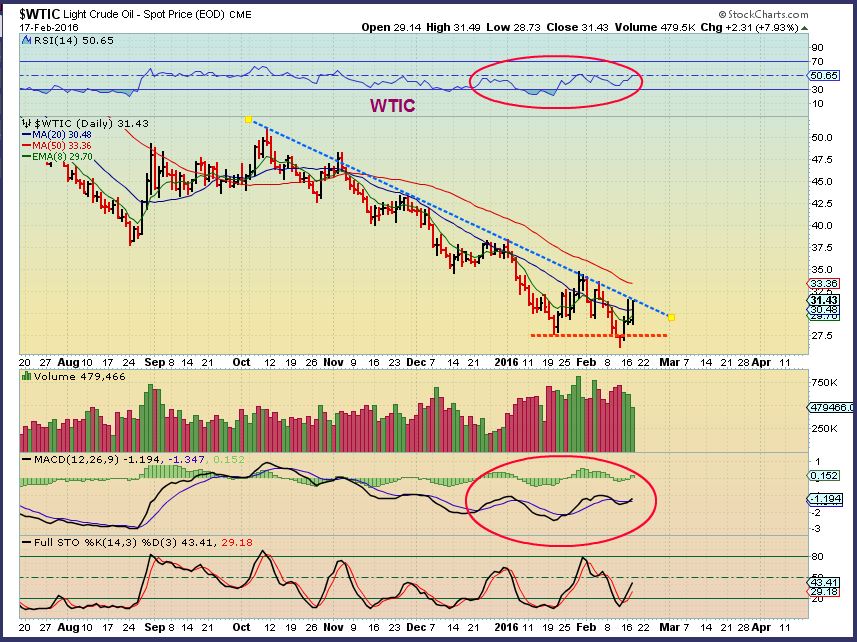
WTIC – In the last couple of reports I mentioned that the XLE is not breaking down and that I think OIL may be bottoming. My Nov price target was hit in the low $26 area. This is a bullish set up the way I look at things. A move over $33.36 put Oil over the 50sma for the first time since early November.
.
I mentioned CJES and WTI as possible set ups in recent reports. Energy stocks can easily jump 20% per day, but I still need to warn readers of the dangers in some of these companies. Some have pretty heavy debt and may actually go under in time. A long term BUY & HOLD may not be beneficial for some Energy companies. Trading a small basket, and small only positions for now, may work best as these base out or break free from bases.
.
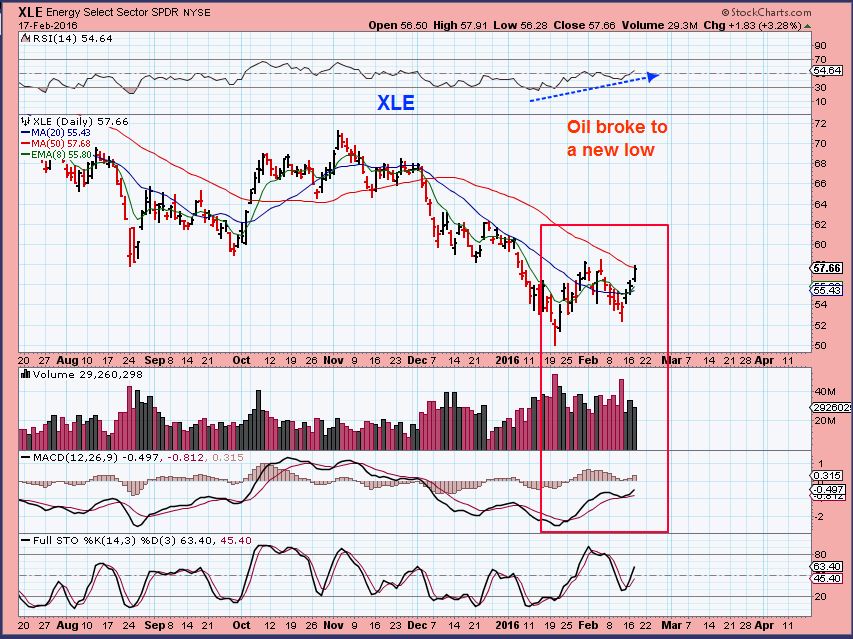
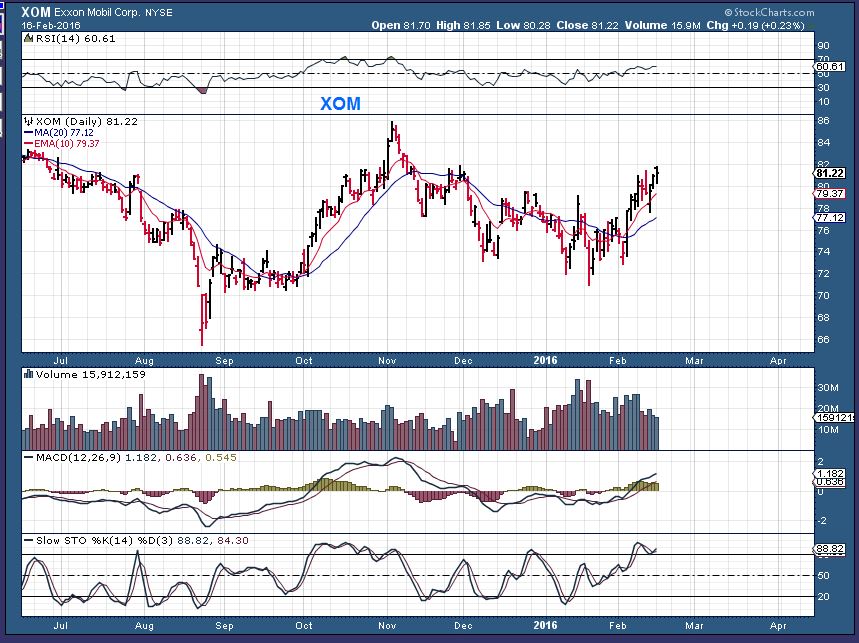
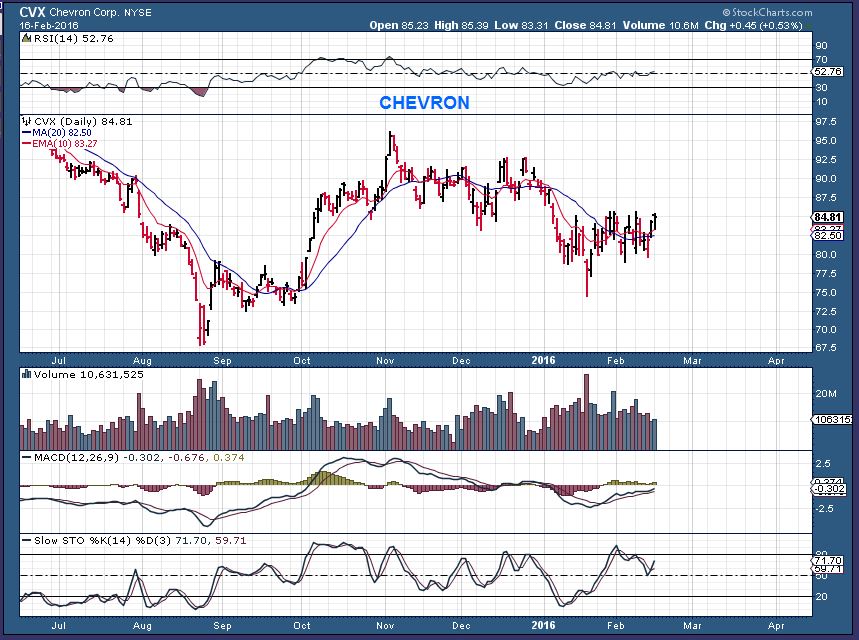
XLE– This is what I was pointing out recently as oil broke down. This is bullish. Yesterdays report pointed out XOM, CVX, and there are many more that are suddenly showing strength.
.
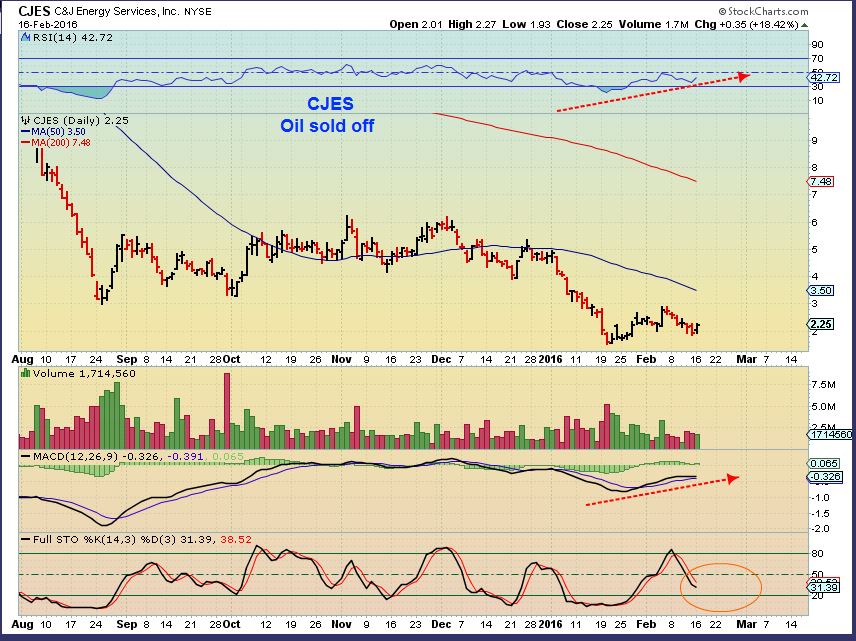
CJES from yesterday- a higher low when Oil broke down. You can see that a run to Dec highs is a ‘quadruple’ from the lows. This also could be a huge base. If it recovers, that weekly chart would be pretty bullish looking.
.
GOLD, MINERS
.
I have wanted to show different types of consolidation during this phase of the precious metals run. I showed in a past report the idea of ‘The Melt Up’. That’s a minimal pull back, where price only drops to the 8 ema and the run gets overly extended. I used this to show why it might be best to sell a portion of our positions and let the rest ride. I also have shown what a Deeper pullback looks like, to keep us alert to the idea that we can get a 50% pull back and it would be normal.
.
Now I want to show another Bullish side to the current set up. Not to confuse anyone, I think that we should EXPECT A DEEPER PULL BACK, but if the possibilities are there for a more bullish outcome, it is best to see it ahead of time to know what to look for.
.
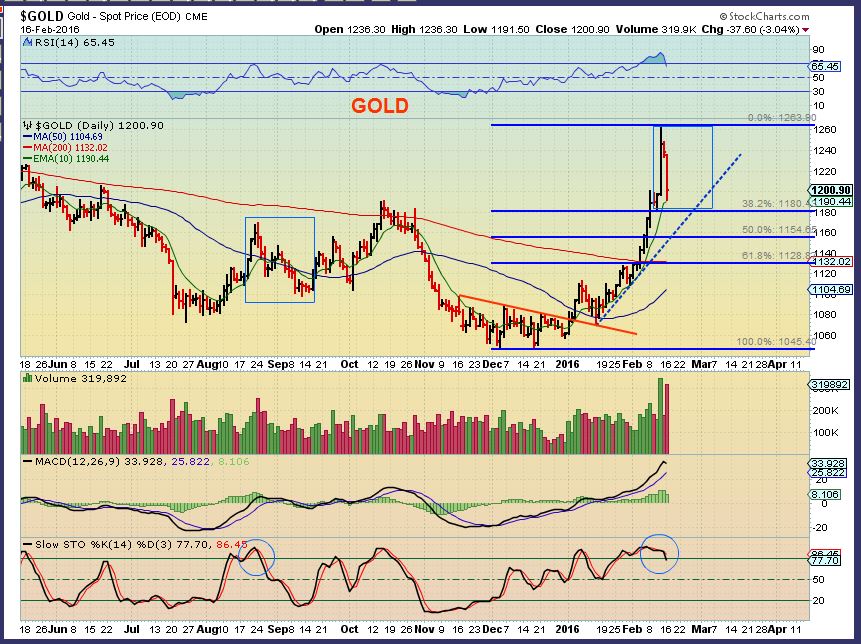
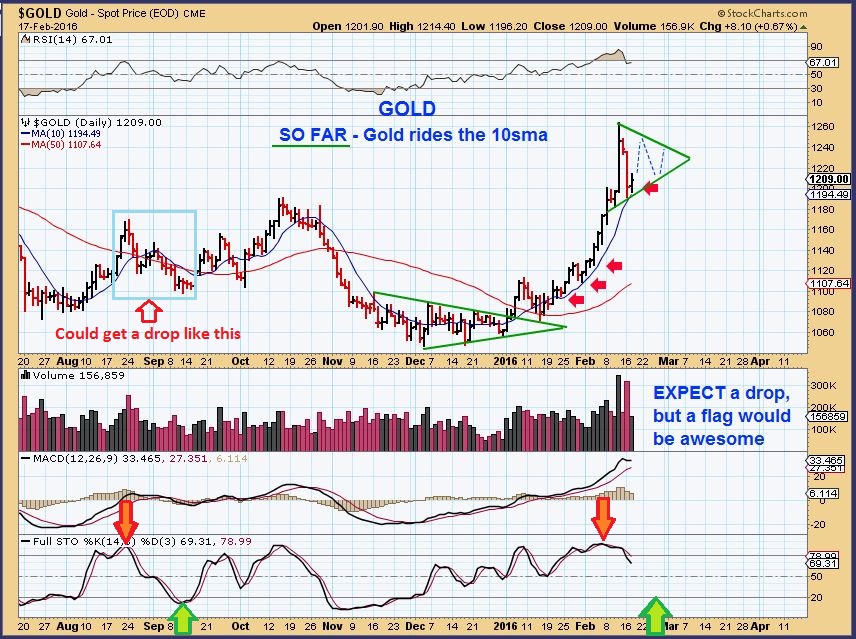
GOLD – Reminder that a pull back to $1180 or even $1154 is a NORMAL 38% or 50% retrace.
.
Gold – Again I want us to expect a drop, but we have all seen FLAGS form in bullish set ups too. We could get a multi day flag here. The Blue Box is a more likely scenario for getting back to oversold. That would include a bounce here and a drop to 1180.
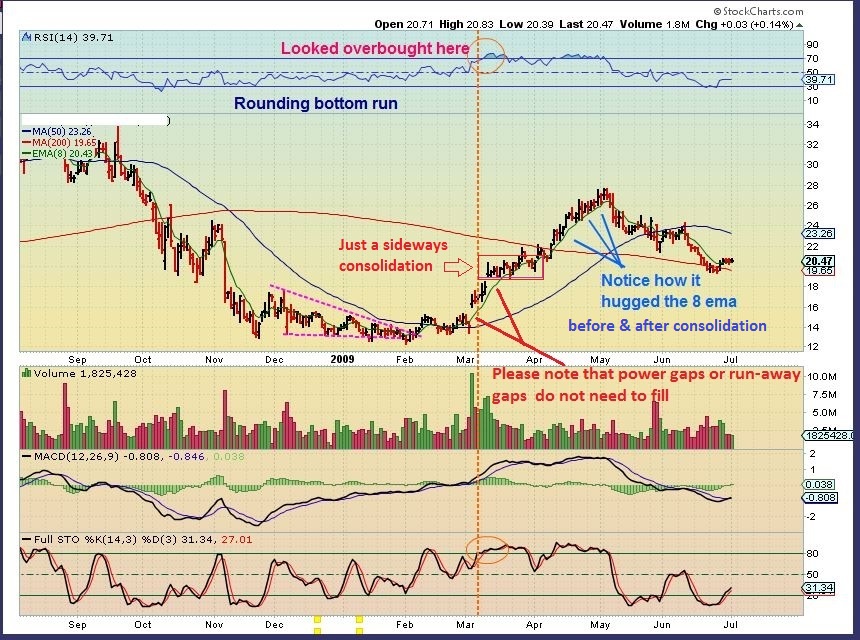
Now look at this round bottom that started as a triangle, similar to Golds base. It ran up, went sideways for 1 month, and then continued higher. We could just go sideways for a week or 2 to put in a stealth DCL.
.
GDX – This is where it gets really interesting. Look at ABX and NEM and they had a complex base just like GDX. They ran up and formed a cup, just about reaching the top of the left side. GDX would be about 1/2 way there, at a resistance point to the left where the arrow is. Could it just flag and move higher? We cant tell, but…
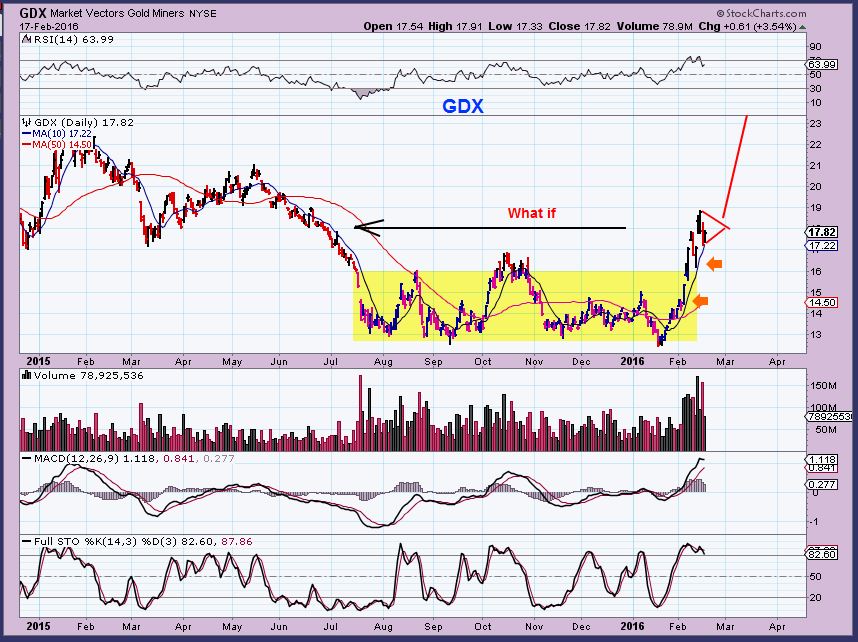
..But these type of complex bottoms often rally in that melt up fashion, leaving the majority behind. This is why I say that I am still trading laggers with bullish set ups. I dont want to be all cash, when there’s a sector that has been hot and isn’t pulling back much (yet). I still Use stops. Traders should be in front of a screen to monitor positions & Stay Frosty.
.
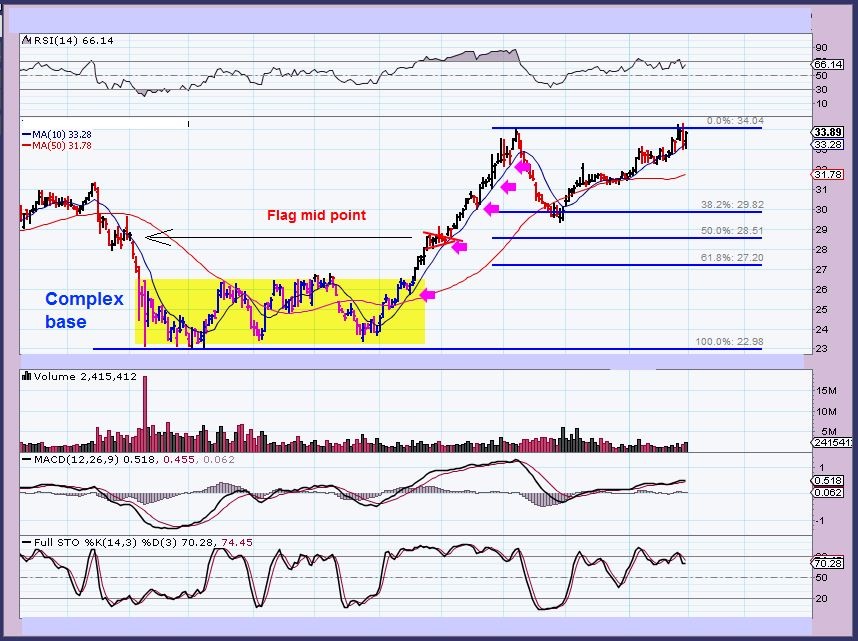
This is an example of a complex bottom just like GDX now. It paused for 9 days (2 wks) 1/2 way to the top, and then took off to new highs. Scroll back to the GDX chart above , then back to this one. Similar so far.
.
So I am NOT saying that we are flagging. I am showing all possibilities, and I do see some Miners that still look like they may want to break out higher. So we need more time in Precious metals to know how this will unfold.
.
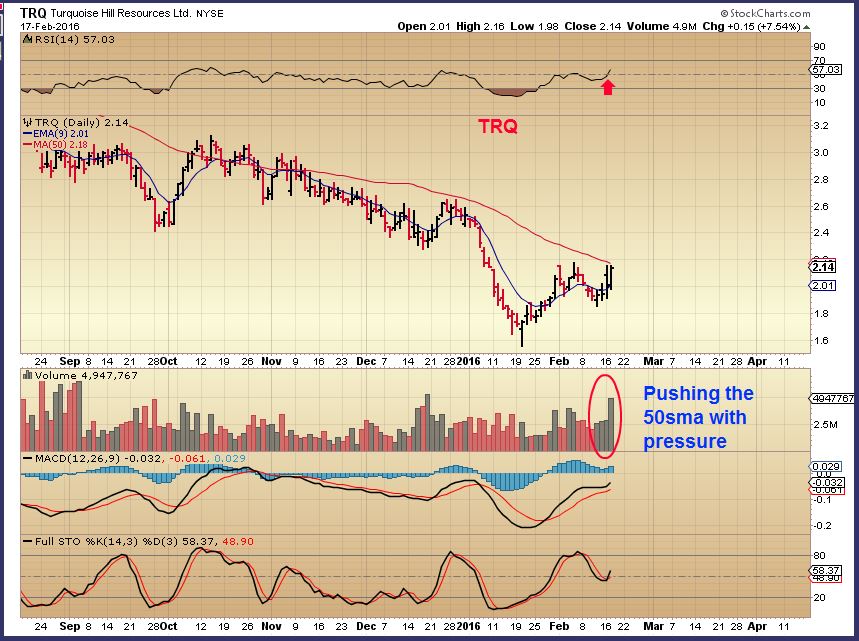
An example of a trade set up was found in TRQ, as mentioned in the comments Wednesday.
.
Notice that in January I pointed out the pinch with TGD in this pattern. TRQ is similar now. It is a pattern that I watch and buy under the right conditions, with a tight stop. TGD doubled from here.
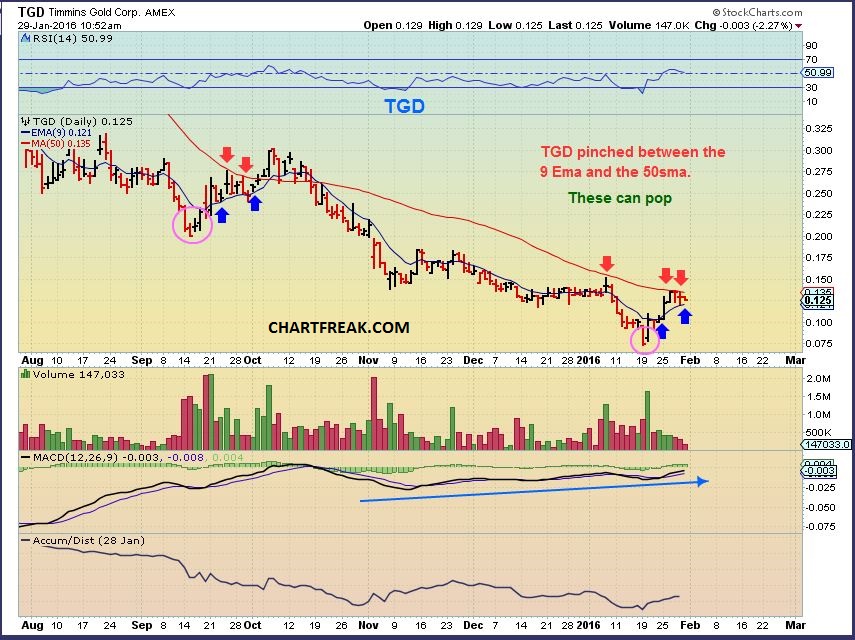
TRQ looks set up to break out. If it drops , I get stopped out.
SO the markets look set up to continue higher / sideways for possibly a couple more weeks. That could pressure Metals and Miners a bit. So far they have just moved sideways, but often they do that at tops before dropping into the DCL too. I do believe that buying opportunity is coming again in Miners. Oil looks to have bottomed for now too.
.
I want to release this report at 7: 20 a.m., and then I will add a few charts of the type of set ups that I look for as a trader. I will post in the comments section below the report when I have added some trade ideas. These trades are the type that can move big in both directions, so they may need close watching. Know what type of a trader you are. Thanks for being here and happy trading.
.
~ALEX
.
On Wednesday I was watching some Energy companies setting up nicely. Some have double bottoms with a higher low ( like the XLE), other held up strongly and formed bases like these 2 that I pointed out yesterdays report. Some of these that bottomed months ago may be Buy & Hold now if the lows are in for Oil.
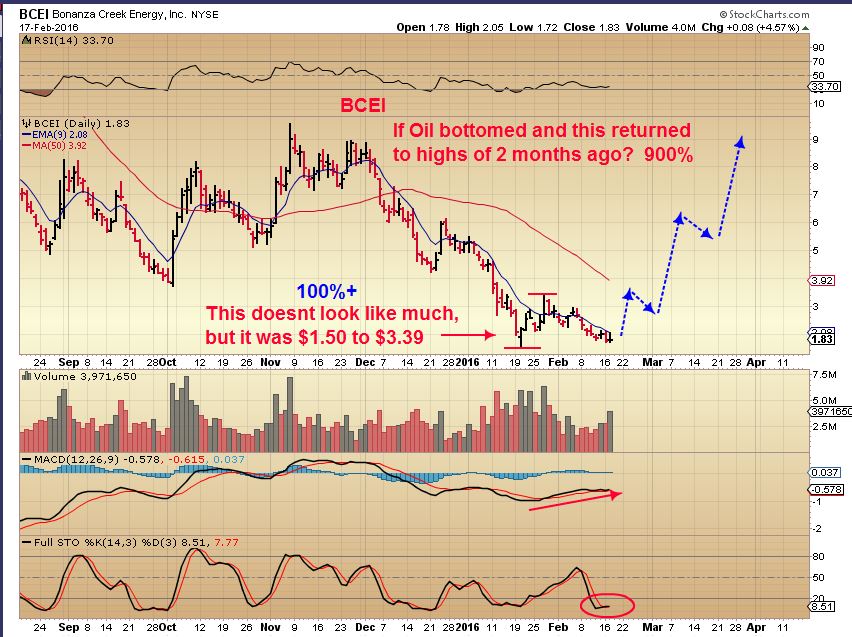
I dont want to get too crazy, but the potential in many of these Energy stocks is massive if Oil has bottomed and they return to former highs. Recently many trade ideas popped up in Energy stocks. I looked at AXAS, EOX, CRK, PDS, SGY, BCEI, ERF, SWN, LNG, ECA, CPG, OAS, etc., and found good looking set ups. I will mark up a couple of charts so you know what to look for. ALSO do not forget the commodity stocks that I have been mentioning ( VALE, FCX, AA, AKS, X, STLD, CENX, etc), they are acting correctly too.
.
BCEI – This is a double bottom with a higher low. It could be bought with a stop below recent lows. I just want to point out on the first 2 chart the crazy potential with some of these Energy stocks returned to former price . 800-900% from lows to Dec highs.
.
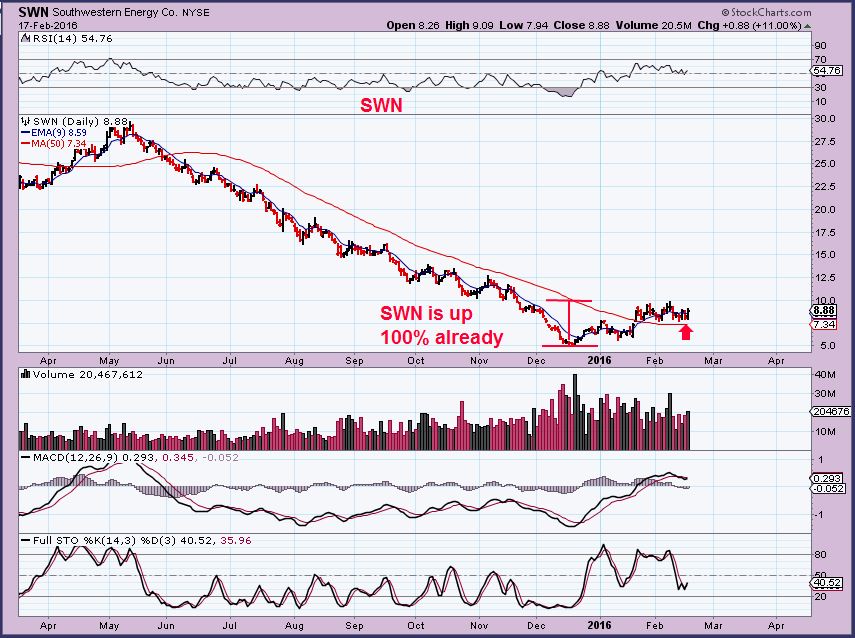
SWN – This stock bottomed and doubled already. It is consolidating above the 50sma. Look at the potential if this puts in a large round bottom.
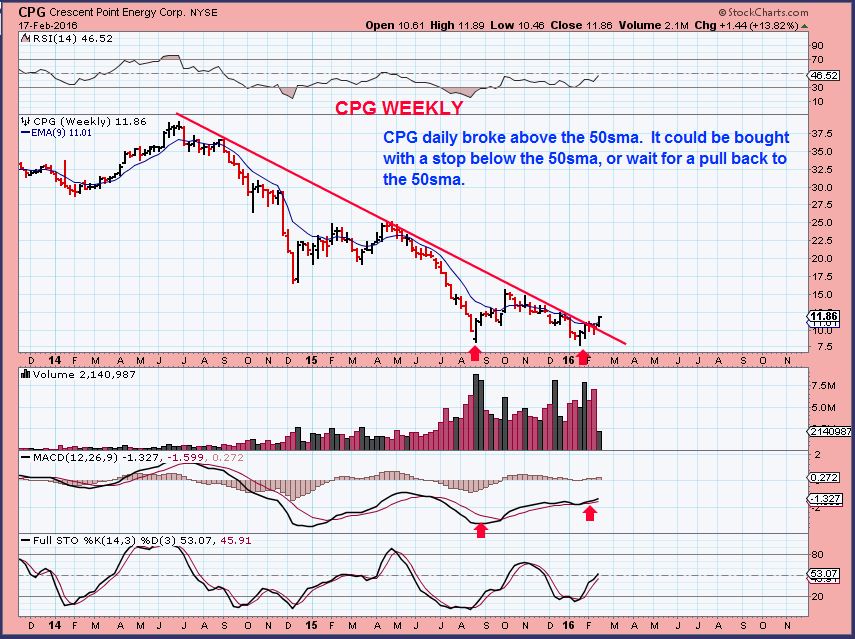
CPG – I also look at the weekly charts, and here we see a break from the down trend. On a daily chart it just broke above the 50sma.
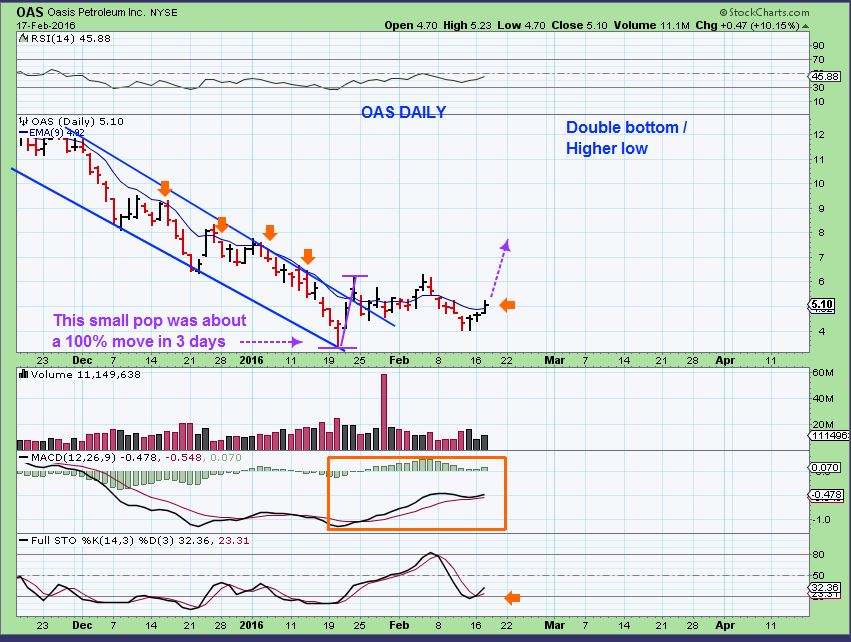
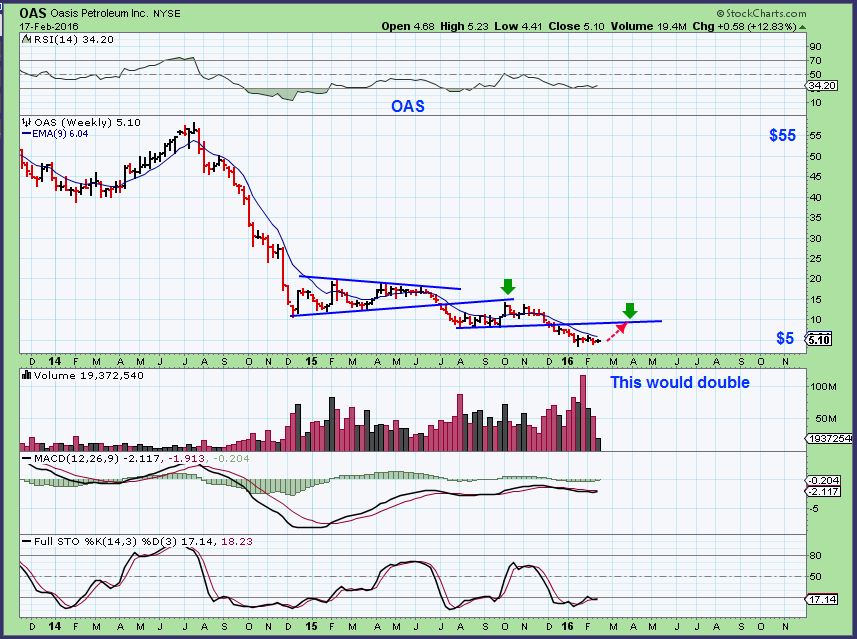
OAS – This looks to be shaping up too. The daily chart shows the set up, the weekly chart shows crazy potential if these get moving higher.
OAS WKLY


Thanks CF for keeping us safe and sane during this tough market period. I have to admit the last few weeks have turned me into a “scalpaholic”, after having gains taken away in last hour or two of trading many times. It’s working out well except things seem to be changing now and I might hang in longer for a while. I still am leary of holding overnight though. Thanks again for your daily outlook, and charts. Extremely helpfull and profitable. ; )
Hey Wishful –
I hear you. I am almost doing the same. I have been trading in smaller time periods, buying until I get a pop ( Maybe holding for a day or 2), and then switching to another trade. There are tons of set ups, but the volatilty can give and take. It does look like we may have more of a directional type move in Energy stocks , so I am looking that way. Miners are acting well.
And the VALE, FCX , CENX, AA, etc etc bottoms held nicely and are running? Nice.
I know what you mean! I’ve felt comfortable in miners recently without leverage b/c they keep riding up. But yeah giving back a winner is certainly tough!
ADDITIONAL CHARTS ARE POSTED
:o) fabulous insight on markets, energy, gold … thank u.
* FROSTY — even better ;o)
** love the sunflower seedling – so cute.
Hi All.. hope your accounts are growing nicely this 2016 .. woop :o)
ps. that BAA keeps poke .. poke .. pokin at that 200 day…
Hi Maria, Thx.
BAA – I know, it needs a good push. I think once it gets above that 200sma, it will psychologically look better : )
And then there’s AUMN. The little rocket ship that I missed. : (
ohhh myyy …..
Thanks Maria….all the best to you also!!
:o)
CDE playing giddy up again 🙂 AUMN – Ugh, beautiful.
NGD looks like it wants to break out
SSRI, PAAS, AKG, FSM, etc
Many good looking set ups in Miners, and thankfully SA is moving for Cason 🙂
That’s right! I’m out of SA right now (was a solid trade for me). I rode SAND over the 200-day and up to top BB and sold late afternoon. Holding NG still. Looking to add on pullbacks as I have some dry powder just waiting. Feel good about the ‘laggards’ – they have some room to run on RSI and on weekly also with stoch.
NG banged right off the 8ema to the cent this morning. It’s a buy on a pullback. Embedded stoch, RSI high but not overbought, BB curling up quickly
hi guys im new. been following alex for months on S.T. soI signed up, gold is a killing it
Hey Al !
Welcome aboard. It seems to be a little slow in here today ( In the comments section). If you look below prior reports we have 100 comments in a day at times. Not sure why its so slow here now.
Thanks for joining us and commenting. Out of curiosity , do you mainly follow Gold? Oil? or anything? 🙂
well … it’s beautiful and sunny .. sooo .. Ken is probably out making snow angels … chris – out hiking a cliff or chasing magpies … pecos bill is on vaca … u were prob tried driving your minibike to starbucks & are stuck in the snow….
… me … well .. a. im too shy to post in forums, and b. just tryn to let my runners run .. giddyup
Mini Bike? I went for a hike ( to the kitchen for a lunch break). 🙂
HA HA!!!
I follow everything but commodities are more predictable to me. For some reason gold right now is inverse to the stock mkt. Gold up stocks down similar to oil/stocks last month.
I tend to keep an eye on Commodities more too. I think 2016 is going to be a great time for this area.
I have had some large weekend reports on my big picture ideas, maybe if you get some free time in the next few weeks , you can go back and check them out.
You can scroll to the top of the page and look in the right hand side column for older reports.
Hi Alex – Any thoughts on GDX based on the movement today ?
Hey Goldsa,
Yes plenty, but there is nothing conclusive and there really wont be until it drops down into a dcl ( That didnt happen yet without a break of the 10sma and trend line. So this could melt up further and then drop or pop & drop, as we have seen in the past.
Its tricky. Melt up continuing? Consolidation? Everything is moving higher and they did have a chance to consolidate for a few days sideways. Individual miners can do whatever they want. DRD, HMY, SBGL , etc do not look like they worry about a DCL in GDX, right? So many of these miners could just run away.
As mentioned in prior reports, sometimes a real healthy run just rides up that 8 ema, so we could be seeing that melt up happening. As for GDX – When you think of timing for the Daily Cycle Low…we are in the timing for one.
don’t know how relevant this is Alex.. but GDXJ also today just completed a megaphone… was lagging behind the others,, now seems to have compensated to finish its pattern.
maybe some pullback now?.. im not chasing here unless we get a breakout (& retest) of that upper TL.
that leg up today could be completion of an expanding b-wave of an abc. (they say they’re common, ya know!)
.. amendment:
SOG is probably like the king and “…. in his counting house counting all hissss moneyyy ..” .. annd waves
*I added that last part…
thats weird.. thats is exactly what i was gonna suggest about BillyBoy (minus the ‘waves’ bit), when he went AWOL last week! (but i never got round to posting it)
… right here … sog .. .right here…. (me pointing to my eyes…. then back to your eyes… then back to…. 😉
always seems like the Twilight Zone with you M (or is it Cloud Cuckoo Land?.. i get mixed up)
lol… that’s the motion when two people are thinking alike.. pointing from my brain to yours….
yea.. that does sound kinda kooky doesnt it…? ha!
lol yep .. i know .. synchronicity!
… i like that word.. 🙂
They should write a song with that name, maybe even 2 !
… ur a genius… https://uploads.disquscdn.com/images/282d5903ed2a09b852b75515ce14a79113485be9360744ce8957fa1087f5c48b.gif
When I saw ’55 comments’ I had high hopes for substantive remarks. Nope. Hopes dashed.
All of these comments came after the jubilant run. As of Noon time, we had maybe 12? You’re just seeing the results of a POST gold run higher 🙂
The only point of my comment was to jab Maria and nothing else 😛
giggle..
*don’t make me post poledancingcatwoman.. .there are new subs here …
please do.. show them what they’ve let themselves in for
lol …..
hahah.. i can’t stop laughing … lol
lol.. you got me chuckling to myself now
I’d appreciate it if you connect the very top ticks on the Aug high and Oct high…that gives us a little more upside : )
Thanks
(sorry A wasn’t ignoring you.., your reply didnt show up until i refreshed when you’d gone)
yes, i did the closing price for top TL on first chart.. but thing is, Aug/Oct top tick highs TL gives same position for today’s high also.. so you’ll be getting no more upside from my charts!
although.. GDX still giving plenty of upside by either method… giving a more reliable signal for where the miners are at than GDXJ?
ps.. good call on UNG yesterday.. ratcheted down again today.. thx!
pps.. t’is quiet in here today.. even with Maria present
… u missed me… 😉
https://uploads.disquscdn.com/images/27d21c065465f0cc80f98f793bf1fd25ab85a1583534be2458b76679ff55992f.gif
im not getting any sound with that gif.. so it can’t be owt to do with you 🙂
Yeah, where is that “Nails on the chalkboard’ sound that I always picture – haha
:-O
https://uploads.disquscdn.com/images/899b352e7ca68ea179d56984a3d7930c7ac43f895190ce30095143f88ac47ac4.jpg
Thank you, Alex.
Action is nuts isn’t it? Every time I think we’re ready to really pullback, NUGT launches 20% again. Feels too dangerous for leverage up here to me, though. I’m afraid by the time I realize that it’s not going to pull back that I’ll have already missed the train!!
hello Al
welcome aboard the cha cha chartfreak crazy train… 😉
*crazy gains .. that is .. 😉
https://uploads.disquscdn.com/images/75aee3b5fe88d45f29742c14cf76254c6e429addc351b553f4d49ed88640134c.jpg
We missed U yesterday Crazy Maria. ( Crazy Gifs and pics, that is) .
Yesterday chat = so boring
AXU just ran from about 21 cents to 83 cents .
Hi Ho Silver.
Inrersting as silver continues to lag big sis, especially today.
You guys use a group app chatroom ? like groupme or slack just curious.
Wait never mind i just figured out how disqus works.it is a chartoom. Sorry. Had issues viewing on my phone
When you are logged in on a laptop, tablet, or computer- you also have the option of sorting the comments section. I choose Sort by newest, that way the newer posts go to the top.
I’d like to personally thank whoever that was that bought up EGI in the last 15 minute on a 5 minute chart.
It doubled the volume and pushed it right over that 200sma on the daily chart.
It went from up 7% to up 23 % : )
Nice, great move. I been riding NUGT since open and AUY from yesterday.Will hold overnight with stops. Just worried on jobs report tomorrow morning. It could dictate the markets direction
Nice Trade. I also grabbed AUY above the 50 and added above the 200sma. I have been trading and riding a core, as long as these keep melting up.
By the way – I never outwardly recommend NUGT here, but I do personally trade it , so when I say GDX or GDXJ, you can substitute it for NUGT or JNUG if you wish 🙂
…sneaky … (er)
Jobs report??
There is CPI, Consumer price index tomorrow (inflation gauge).
Good night all
I tried to sell ONE stinkin’ SA covered call (May 20 strike $9) asking $1.10 but no taker. That tells me a lot of traders are expecting heap big correction coming.
SA closed at $8.49 – and nobody wants it for $9 in three months? Wowsa!
I might buy your call tomorrow. hehehehe 🙂 Hopefully, we both win!
I’m imagining that we may still be in just the first DC (following this 1/2cycle correctionin with maybe one more day developing triangle) what should become a RTIC if we are out of the bear (:-O Any chance of that Alex?
I dont know if you are talking about Gold? GDX?
We are not in the first daily cycle of Gold, Gold bottomed Dec 3.
I do think that we are in the first daily cycle of miners, day 21. It is a R,T, daily cycle for MIners and yes, could become a R.T. I.C too.