
GOLD PART 1 – In Search Of A Bottom
I believe that Gold is in a 3 phase bull market, with 2 phases already behind us. After a 4+ yr bear market, there are finally solid signs of a bottom , in many different areas. There is no gain in clinging to a bias, that is how one loses money in the markets, but by gathering important relevant facts you can develop a check list and watch as necessary things begin falling into place ( or not). JUST THE FACTS. Currently I see things falling into place, indicating that THE bottom is either already in place, or very close. This bear market may be coming to an end, and catching the recent lows has already been very profitable. Riding a renewed Bull will be very rewarding. We will look at ” Just the facts” here in our extended weekend report. To the charts…
.
First a review of recent bullish expectation in Miners:
.
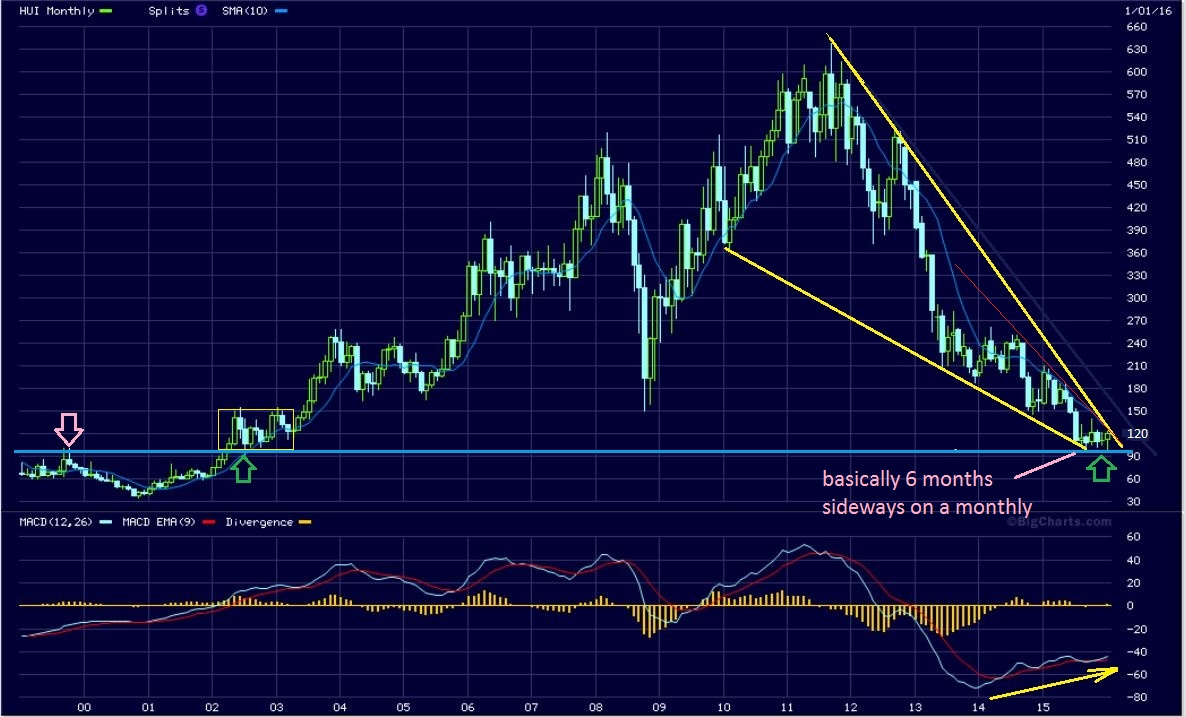
REVIEW– In the last 2 weekend reports we watched the HUI & GDX in the bigger time frame. This is a monthly chart of HUI, on the edge of an important break out. It has spent 6 MONTHS at the lows, a solid base on prior support. Today the HUI is near $150. A break out.
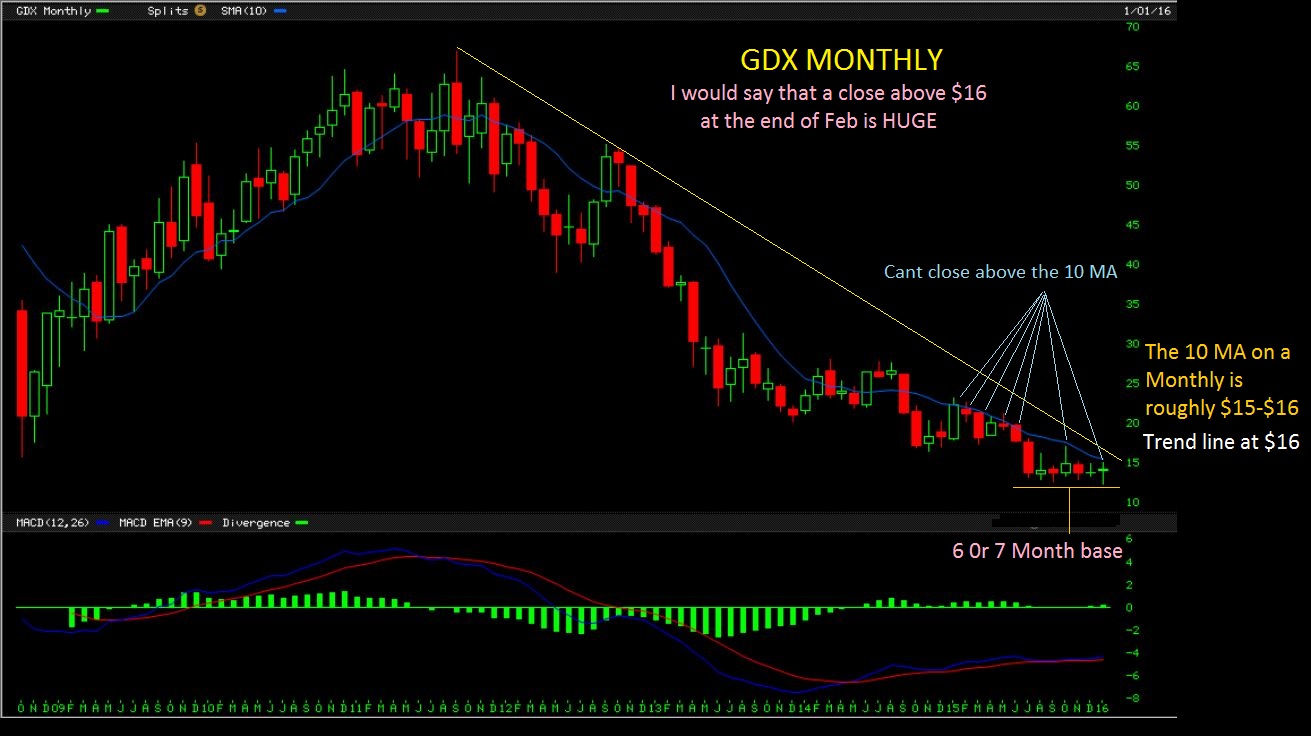
GDX reversed from below $12.50 and also looked ready to break out above from a 7 month base. Above $15-$16 is important. It is now at $17 as of Feb 5. 🙂
We need to look at a lot more than just the Miners and Precious Metals, however. Currencies come into play, along with a variety of other influences, so we’ll examine the Metals now, historically , and other factors that can indicate where we are in the process of a 3 phase bull market…
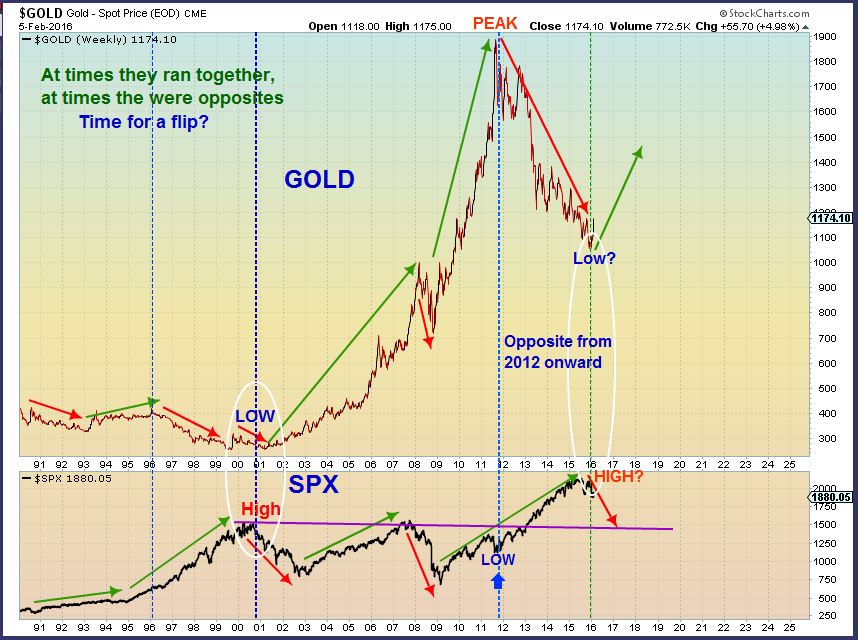
In 2000 the Markets topped and Gold bottomed, possibly being viewed as a safe haven. We could see that beginning now too. Think of how much Money will be flowing out of the recent market run up. It does NOT take much to move Miners if they become a safe haven bid.
.
I have said for a long time now that I thought that the markets were topping, and Gold could bottom. This was my JULY 24 chart, before the August Plunge. We see distribution, a wedge, and a rounding top.
.
So lets have a quick short term market review, and then continue with the Precious metals analysis . My thoughts in these areas have not changed much, so this will be shorter than normal.
SPX – The volatility continues. I mentioned at the strong reversal lows that I expected a multi week rally to suck in more “Buy The Dip” crowd, and then more downside. It has been 2 weeks, but I still expect a small rally and I still see this bottoming area as similar to the one we saw in August. Time will tell. I pointed the volatility at lows in Aug as similar to now in this chart last week…
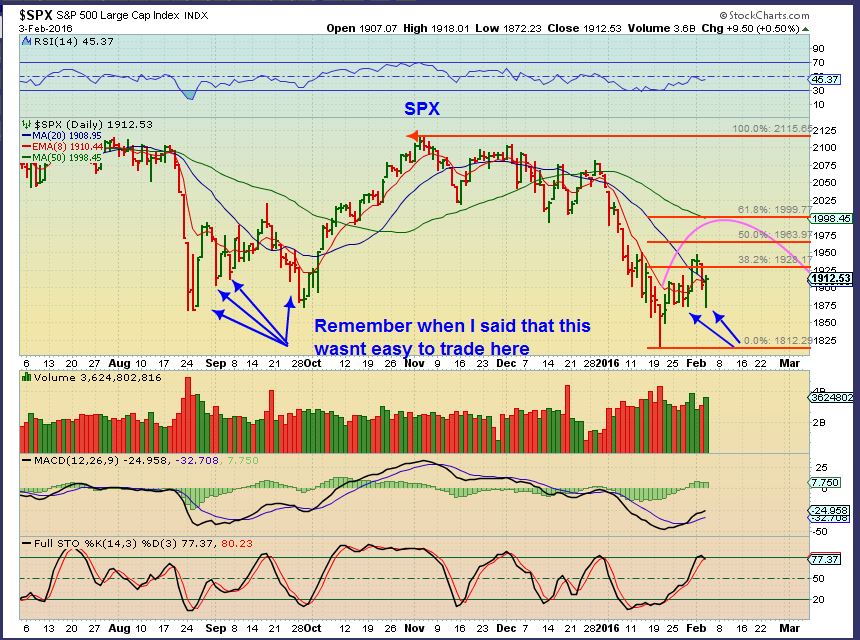
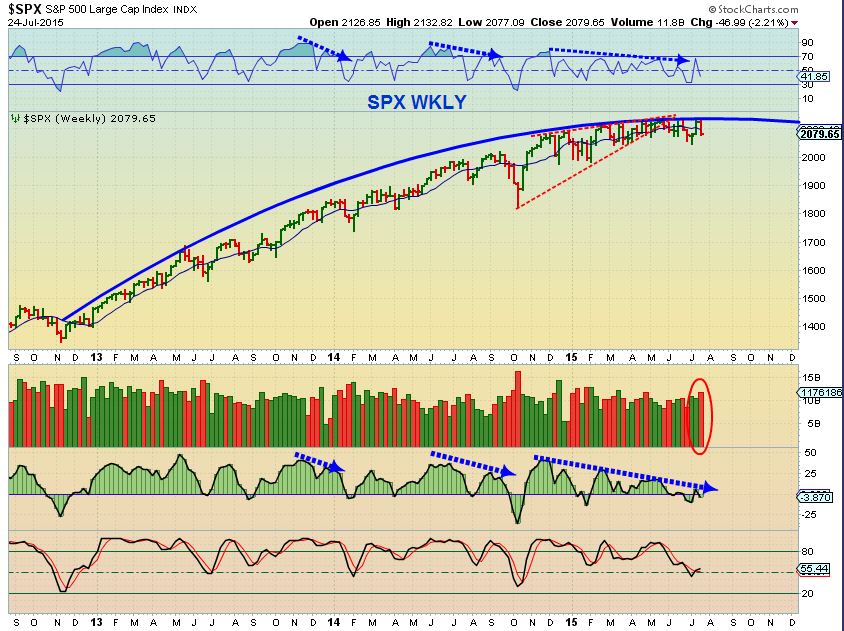
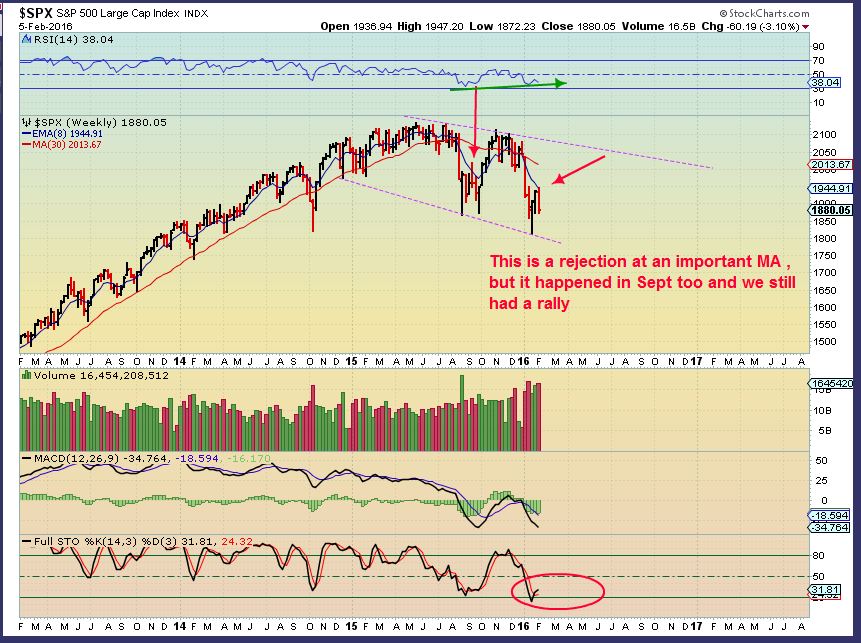
SPX WKLY – We still see trading volatility like last August. Since we broke the August lows, I believe we’ve started a down trend and this will roll over in time. (See past reports). Right now I expect a false rally soon, but the daily chart does look weak. I would be cautious / alert here until we get follow through. No short term trend is established.
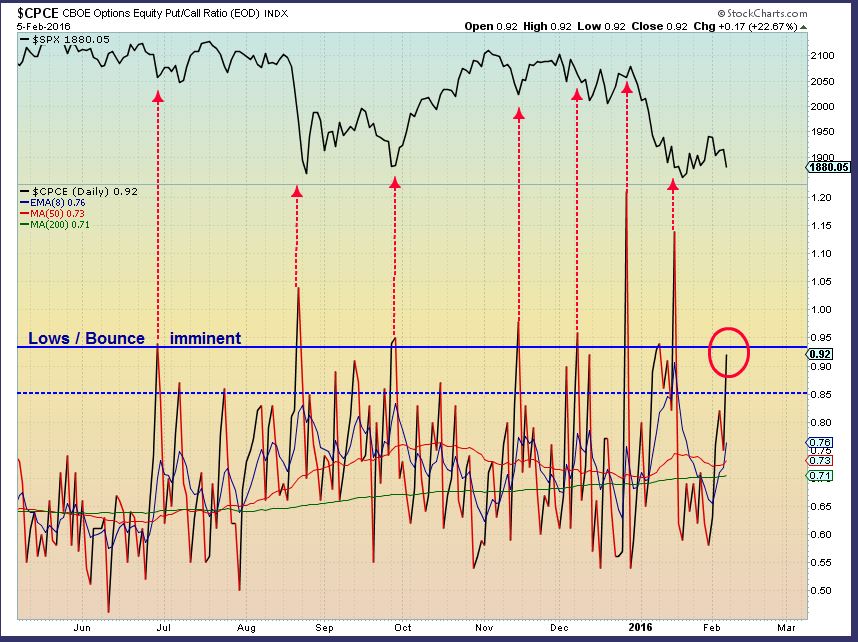
You may recall that I used this CPCE and 2 other charts to call the lows in the past. A high reading (near .90 or greater is when a low should be approaching.
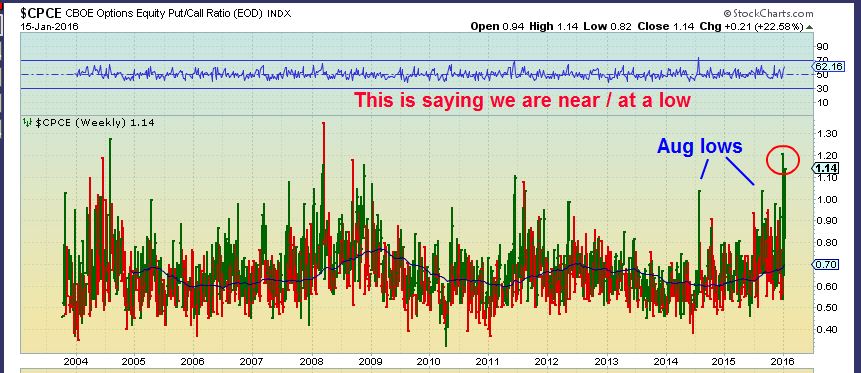
Current CPCE – 0.92. we look close to a 2nd low and then a move higher.
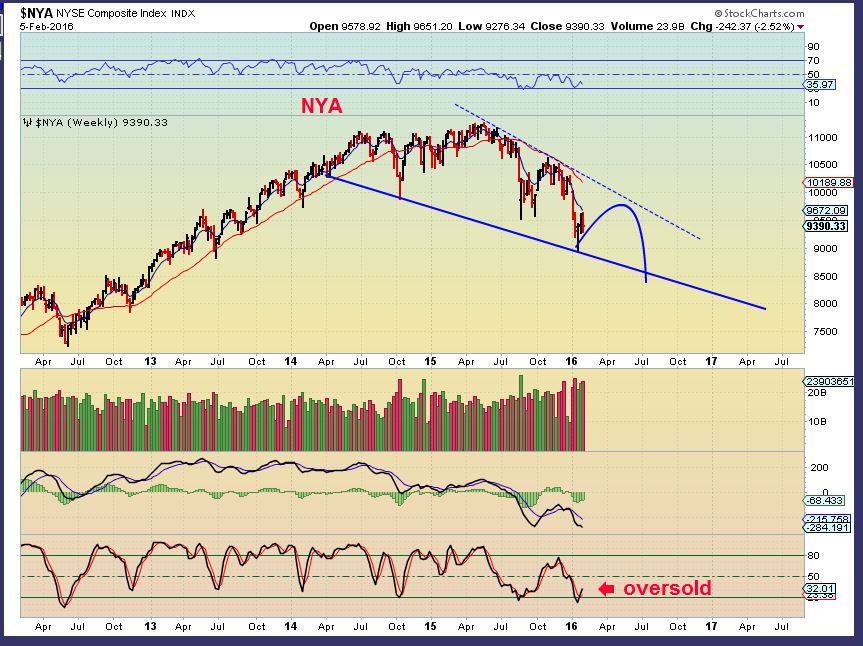
NYA– This is an example of what I tend to expect.
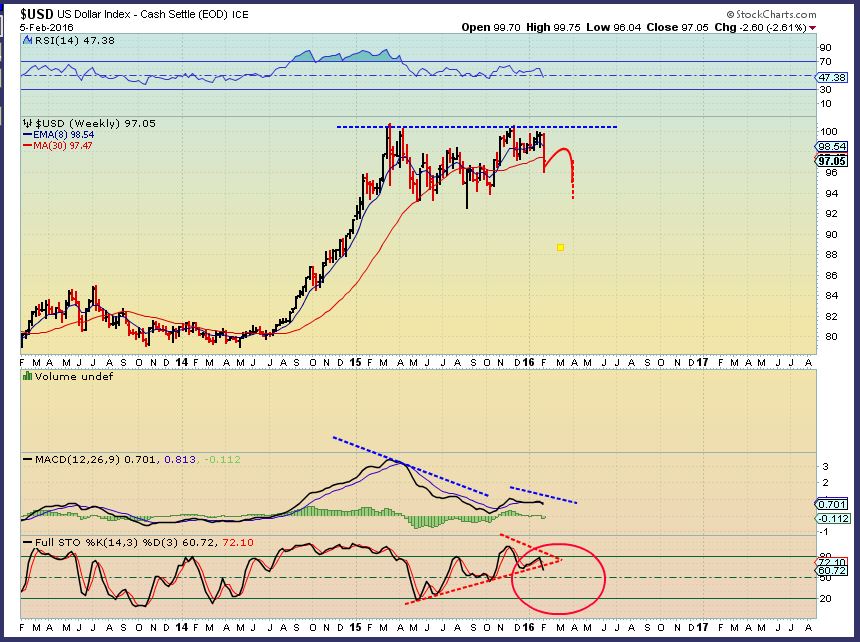
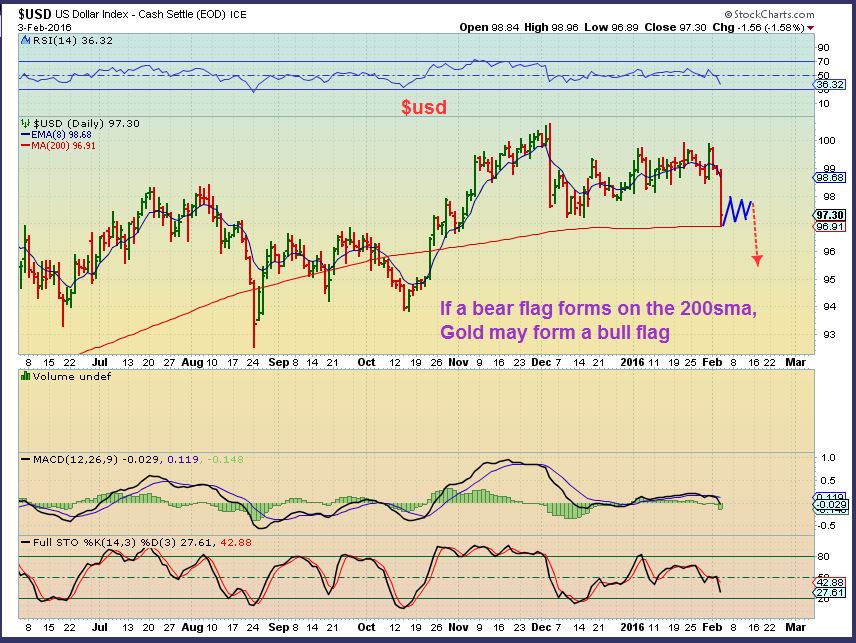
USD – I’ve been expecting a Top in the Dollar since last spring. Then in the summer I saw a possible double top forming. It may be in place. Done. A bounce & a drop may cause a pullback in Gold and then another leg higher.
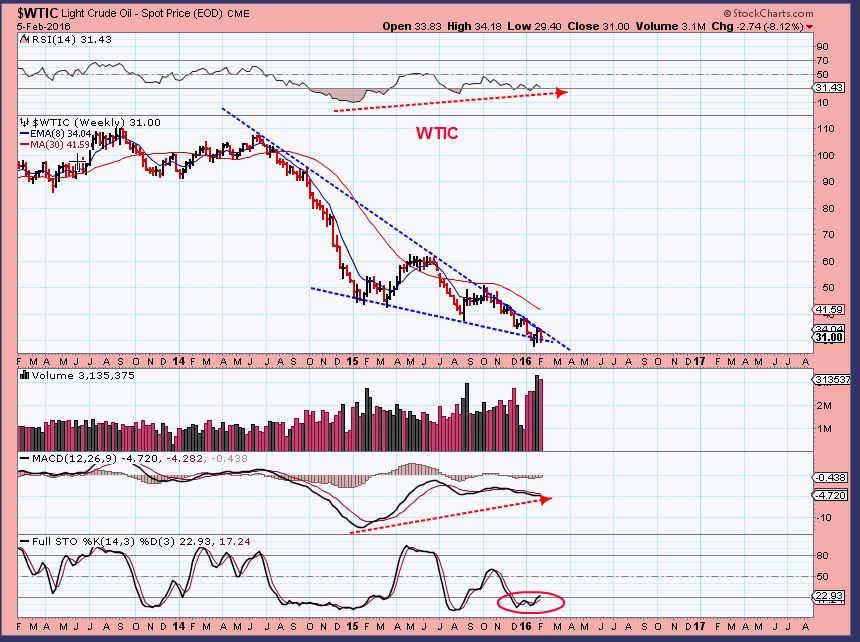
WTIC- This is still acting like a bottom, needs a bit more time to confirm in my opinion. It is a place for shorter term “traders” for now. Energy trades have been great %-Wise, but whip saw action is evident too. See the Thursday & Friday report .
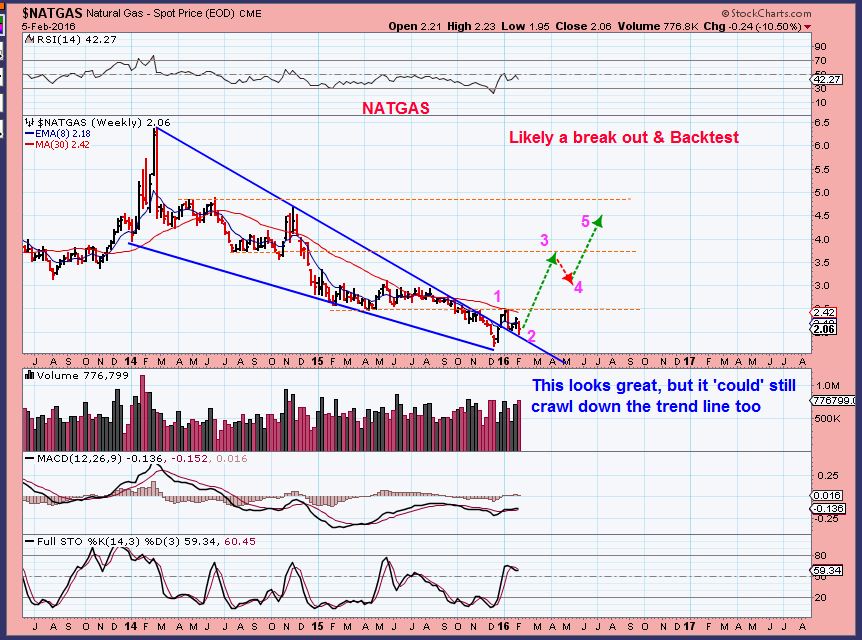
NATGAS – I still like the big picture. This is an estimate of a run higher, not an exact prediction.
.
This continuation in precious metals is going to be the brunt of our extended weekend report. 🙂
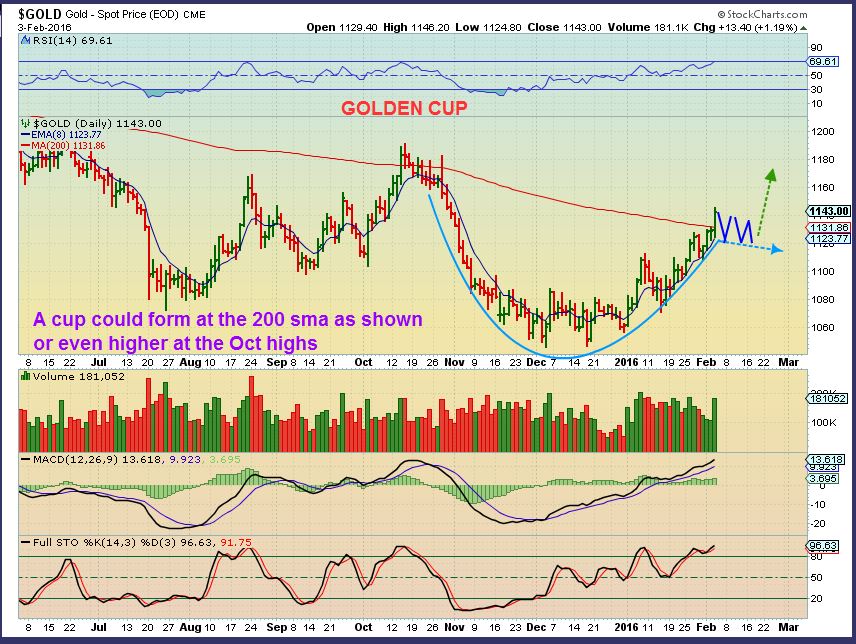
First we’ll just look at current charts, then we will dig deeper. I’ve been preparing mentally for a possible pullback. It is not necessary, and Miners havent pulled back in a big way yet. They are little rocket ships, so it may not happen in Gold either. If it happens I dont want people to think that Gold failed, so here is Gold currently being shown with a possible handle.
.
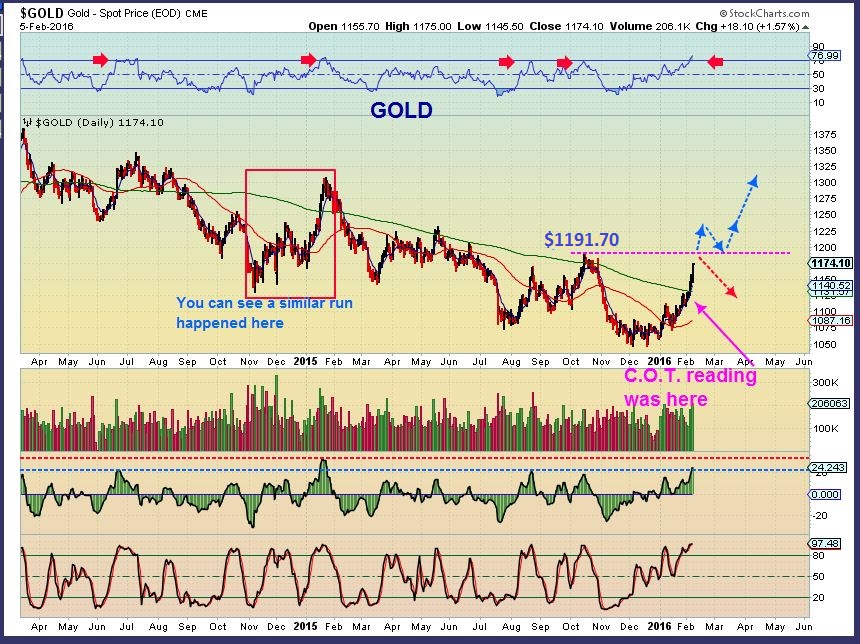
GOLD – We cant say that Gold hasnt rocketed up in the past, and current conditions are similar here to Jan 2015 (Red Box). Our cup could form a handle, or just keep going. A break above $1191.70 is a nice victory if you ask me. A change from lower highs to a higher high in Gold. There is no way of telling if we pull back first or continue onward at this point. I have mentioned riding your Miner positions up ( at least partial) with the 8 ema as a guide.
.
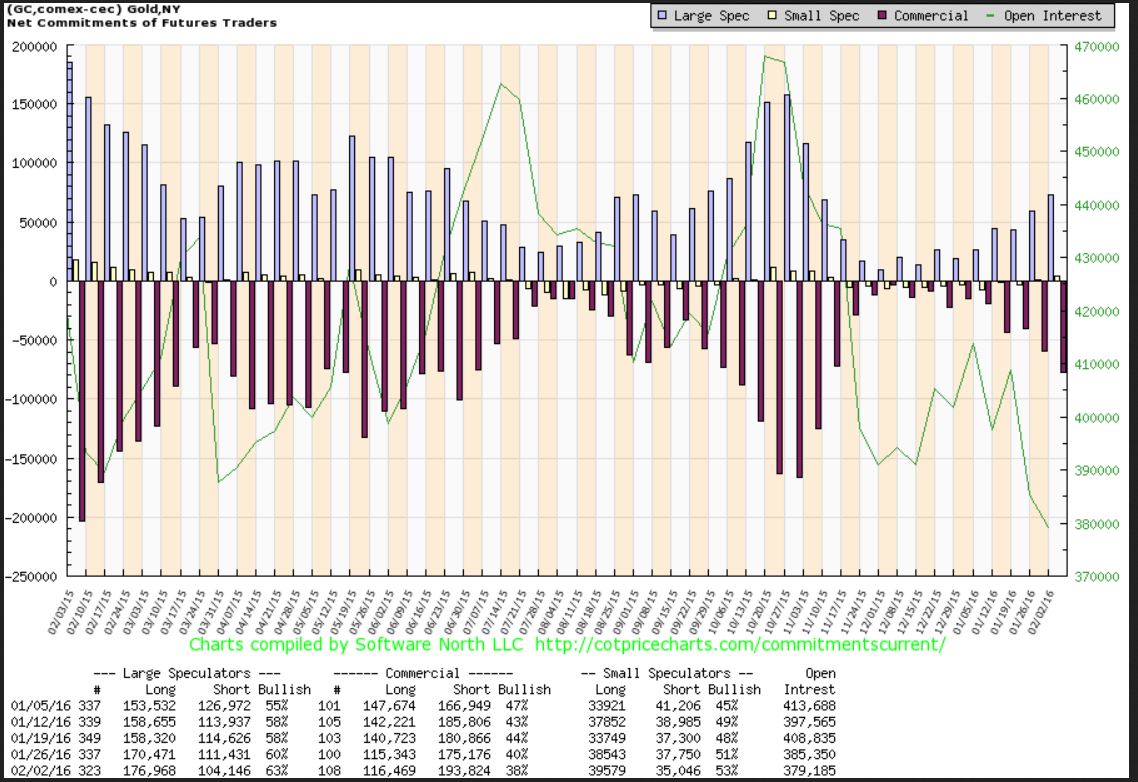
The COT has room before it reaches areas of former tops, but remember that this is as of Tuesday and Gold ran higher WED-FRI. I dont use this as a timing tool. It is a snap shot for Lows and Possible tops.
.
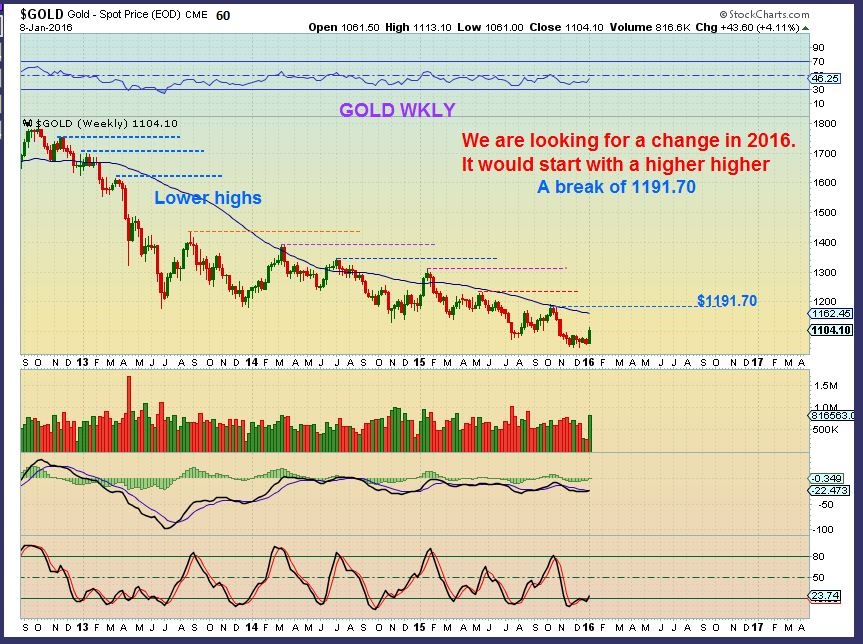
Gold wkly, When we were at the lows, I posted this chart Jan 8 showing that a break of $1191 .70 is the start of a big change. Higher highs.
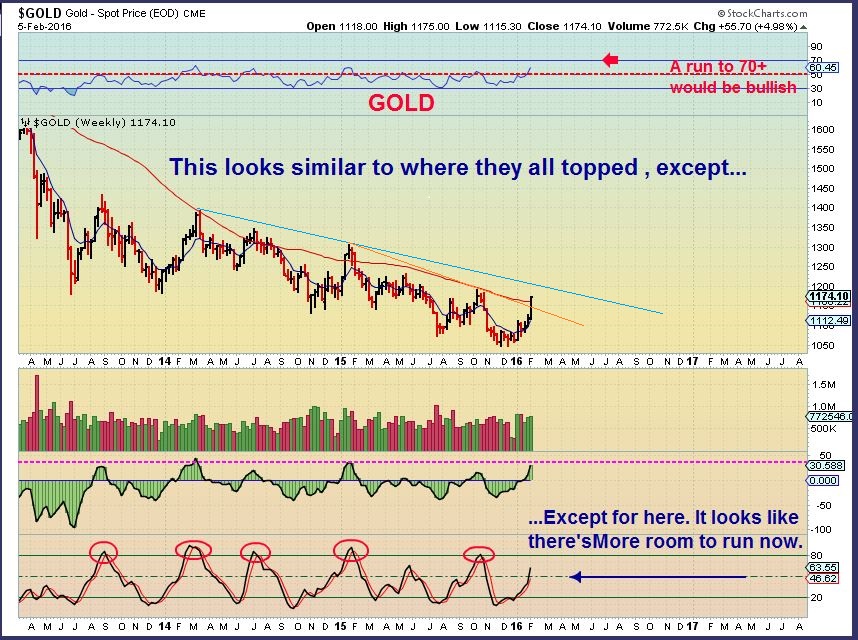
GOLDS WKLY chart – We have now hit $1175 and it is not overbought. It’s breaking out, looks strong, and there is a pretty big difference to Jan 2015 on that stochastics. We are so close to breaking the pattern of lower highs ( Downtrend). 
.
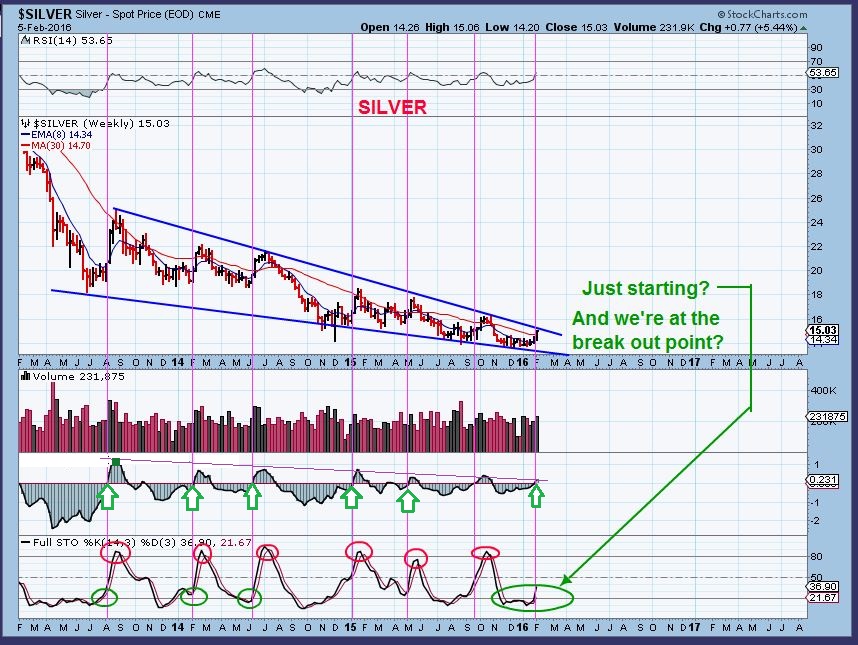
Silver Wkly FEB 5 – You will remember this chart ‘set up’ from the past 2 weeks weekend reports. Amazingly, Silver STILL looks like it is just starting to break out and take off upside. Silver stocks began to run very well last week.
.
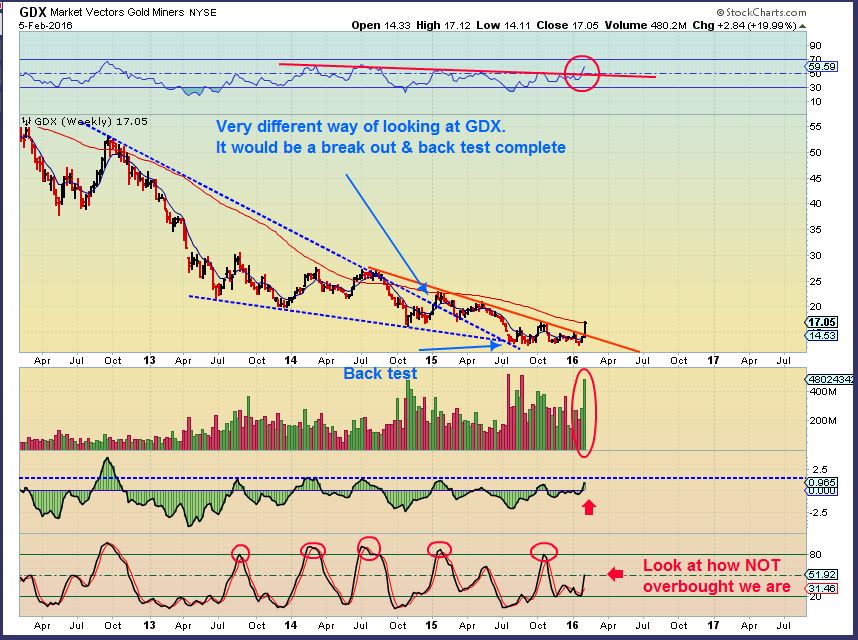
GDX WKLY – A huge run in Miners, yet we are NOT overbought here either. This has room to run and a move to $20+ is likely. There could be a pullback along the way, but it’s most likely a buy opportunity if we get one. This looks extremely bullish in many ways. Look at the Blue triangle. You can actually see a break out & back test in blue.
.
2 charts from Prior reports. I thought that maybe we could get a bounce & a flag in the dollar. If so, Gold could put in a handle on the cup. ( You can see from the chart above that GOLD hit $1175 this week, and that was with the dollar bounce). Interesting. Gold can now put in a flag down to the 200sma as a possibility.
.
This is where I will end part one of our weekend report, since it took a lot of time to put together. Why keep the readers waiting? This covers a lot about where we are now and how we got here, much of it as expected, and possible expectations going forward. Readers that have been here for a while know that early last year I had been pointing forward to the possibility of the Big Picture changing. It takes time to turn a big Ship 180 degrees, and the markets are like that Big Ship. Last Spring & Summer I had mentioned that we’d expect that the General Markets could start topping, though EVERYBODY was Uber Bullish then ( That wedge was playing out) . The USD was weakening and topping with indicators that I use, though most were calling for 120 $USD, and Gold & Miners should start bottoming along with Oil & Commodities. I also mentioned that GOLD does Not need to drop below $1000 to bottom, while everyone else that I saw was waiting to buy there. Most still are waiting for that, and they may be getting left behind.
.
In Part 2 I will share more analysis that details other research that I have been doing and why I think that the pieces are falling into place. We need more confirmation in some ways that only time will reveal, but things are definitely falling into place in a way that THE LOWS of the bear market in Gold , Silver , and Miners could very well already be in place.
.
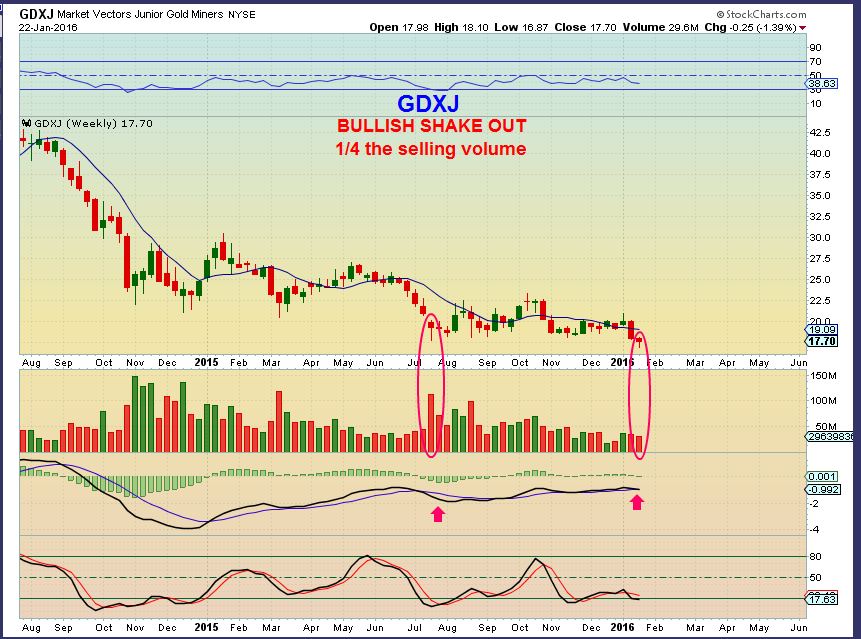
Imagine that, we may have caught THE LOWS with that Classic Shake out Stop Run. The gains so far have been great, but if the lows are in, this is only the very tip of the iceberg. 
.


Excellent Analysis Alex – Thanks for sharing. I have lost quite a bit of money in miners bear market and I do not want to miss out on the bull run. I know that you have been focusing on miners, but on Oil, do you think even if we have not bottomed 100%, could we still hit the $ 26 per barrel in oil ? Thanks and have a good rest of the weekend
Hey Goldsa,
We could hit the OIL $26 target , but we dont have to. The lows could be in with OIL.
My Target of $26.06 was given in November & was based on a Wkly price projection . It was calculated when Oil was near $42 and became a good warning of more downside. I’m not sure that it has to hit exactly since the oil contract rolls forward to the next month at times and could obscure things. We did drop into the $20’s and that may have been enough. I am not 100% sure, since I have really been focused on Metals and Miners the past 3 weeks,
Thanks Alex !
Goldsa, I have as well! It’s time to make it back, buddy! I’m looking at starting in on an oil position. Sure, we could test $26 again, but I think it will be quick! Did you guys see the rig report on Friday. WOW! It really went down – we’re going to start to seeing lower production.
http://seekingalpha.com/news/3086946-u-s-oil-rig-count-falls-31-seventh-straight-week-declines
Hi Cason – Thanks for sharing. I am long on USO (more long term investment). I hope oil soon breaks the 30s and get into the 40s and beyond
I have meant to thank you for all the feed back last week into “It’s when you sell that counts”
Meanwhile, go Peyton, but most of all let’s have an exciting game.
And lastly, don’t trouble your head about Gary… From two different points of view you have been on the same pog page forever. And he has personally shared that he’s hardly the chartist you are. 🙂 (One day he might even share that with you !) I suspect that your personable attitude has moved way more subs. over here than otherwise. Maria’s lightheartedness and humour helps as well.
Feel free to delete this post if once again I am awkward
Hey Beek, You are fine. He is fine too.
;o)
Alex-could you give us some examples of silver stocks you like? If we have seen the high in the USD then I would think that would have big implications for commodities as well as emerging markets. Is that in line with your thinking at this point?
Hi Mark,
It is in line with my thinking.
As for Silver stocks, when they are in a bull market, I study the fundamentals more. When they are in a bear market, I study chart patterns more. That means that I might think that AG is a great company fundamentally , but CDE might bounce higher %-Wise based simply on chart patterns ( EX: it sold off a lot more and will rebound more).
At this point, right out of the lows, I do not always find the Best companies fundamentally performing the best. So I usually grab a lagger and ride it higher when it plays catch up.
S&P, 4 hour chart. Two trendlines, the top one was what I was originally watching as the channel walking upwards. When it broke early Wednesday, appeared that all was lost on the bounce attempt. The bottom one comes from the lows and appears to have been broken Friday. Was it a shakeout or are we headed down? We might know tomorrow. If we aren’t above it quickly, a re-test of Jan 1812-1820 lows may be in order.
How about the miners? I expected another crappy Bear Market Rally and we ended up with this current rocket. How about that!! Sure wish I had jumped on earlier! Looking at the gold chart this weekend, see 1140 as the 8 ema and 1112-1110 also as 50day and 50% retracement support.