It Is Not An Illusion
I had this chart in my weekend report. After this weeks selling, it looks more and more like a reality, and not an illusion.
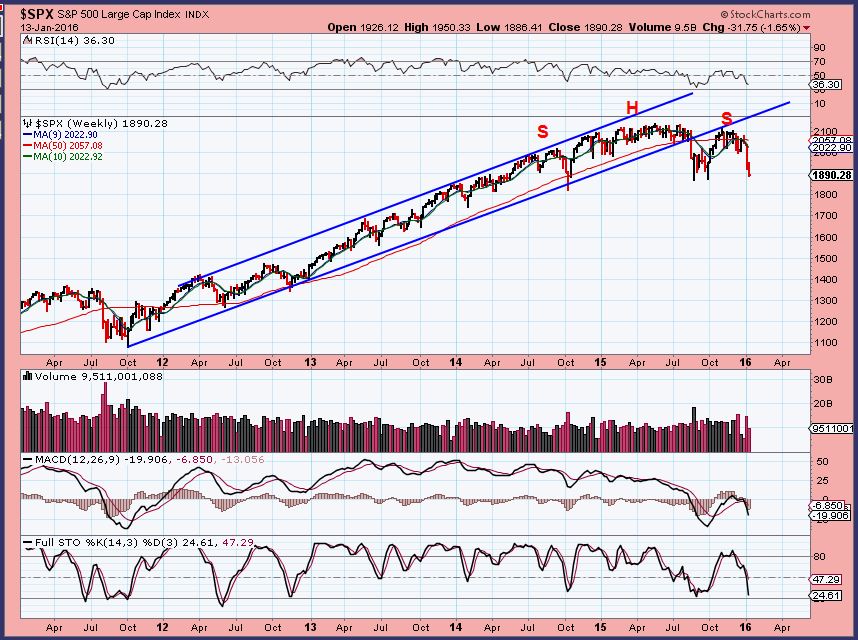
SPX CURRENTLY – I expected a bigger bounce this week, but the 2 day bounce was sold off yesterday. This is a break down and a back test.
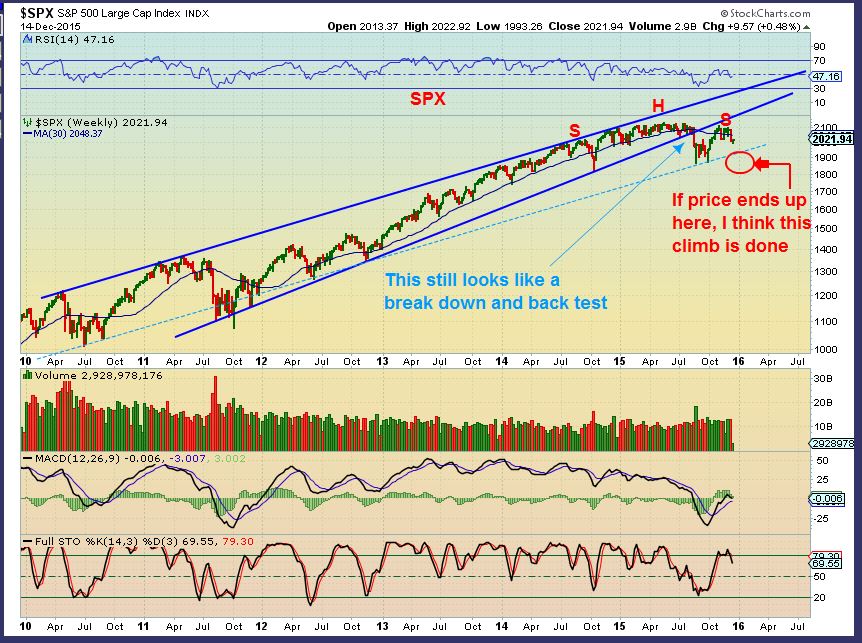
I did post this chart on DEC 14 warning that a drop to below 1900 was looking quite serious.
NASDAQ – markets were rejected at the 9sma yesterday. The Short term H&S pattern did reach it’s target, but CAN continue .
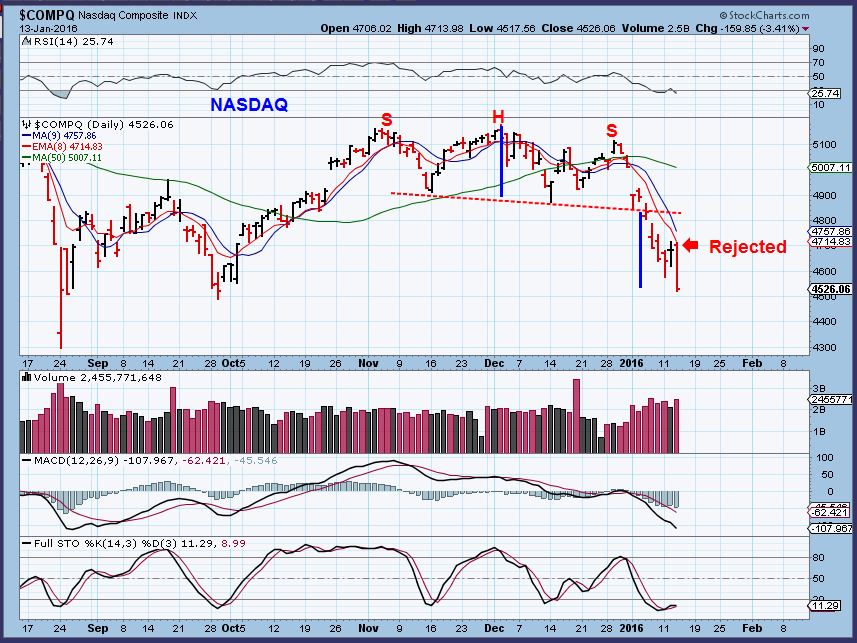
Shorting has always been tricky for me. I was looking for the bounce to move up convincingly to a resistance area, but it just continued down. IT would be best to wait and see what the next DCL ( or ICL) does at this point. I have mentioned some ETFs that you can use as a trader and I know that some here have. Congrats on a few nice trades. SDS, SQQQ, TZA, HDGE. I will discuss the markets more in the weeknd report.
.
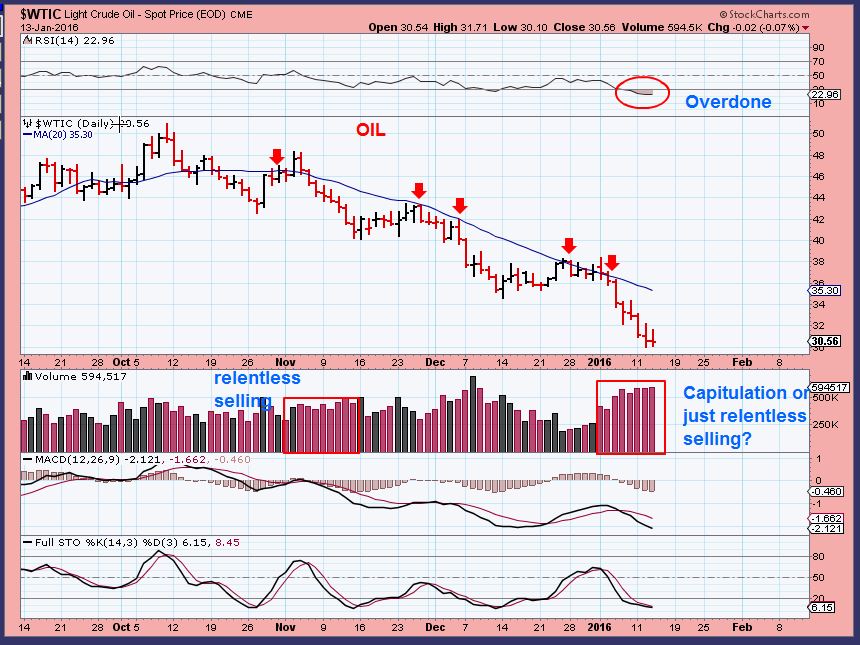
$WTIC – Oils break down may be a throw over type move, where it breaks down and recovers like a shake out.
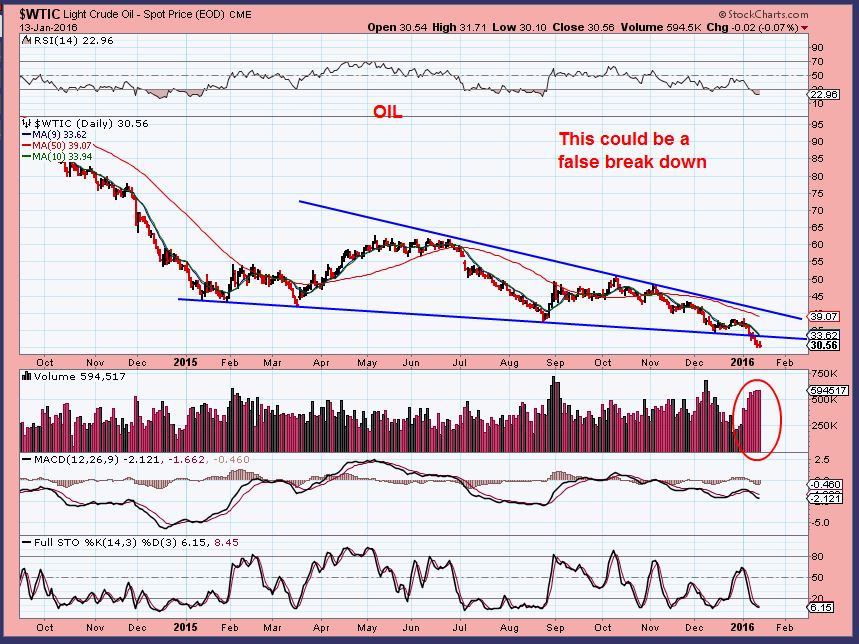
Traders have played oil stocks on the bounces, and some have popped 20% day after day, but this is only for those in front of the screens. Fast trades. Currently OIL is oversold and has capitulation type volume, so we may get a good bounce soon. As a reminder you can see that OIL has been capped by the 20sma. Those wanting a ‘safer trade’ in OIL can wait for a real recovery above the 20sma.
NATGAS – Didnt change much yesterday. Still healthy consolidating recent gains. No chart.
.
GOLD, SILVER, MINERS
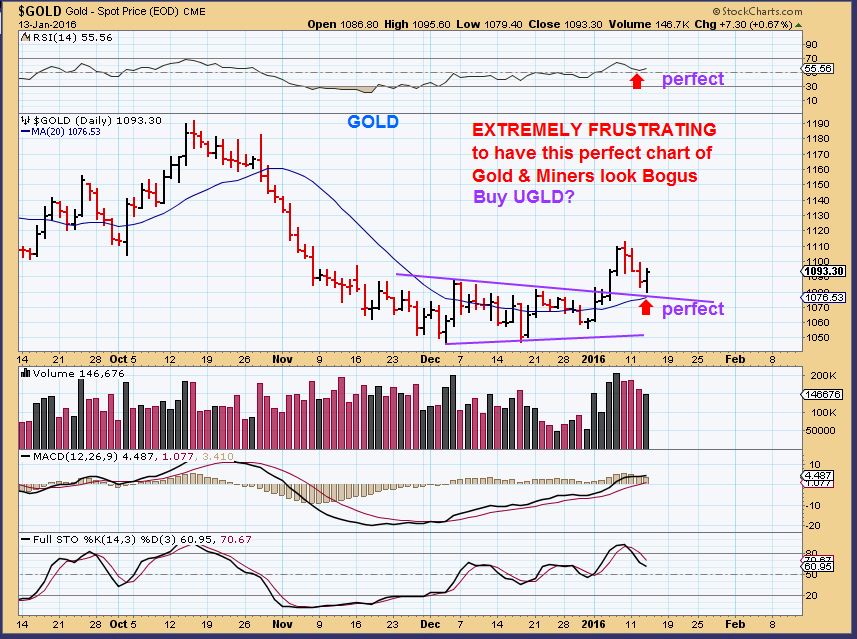
FRUSTRATING IN MANY WAY. THIS CHART IS BULLISH IN MANY WAYS, but Miners are lack luster. UGLD is a bullish ETF for GOLD if anyone wants to try a long Gold position.
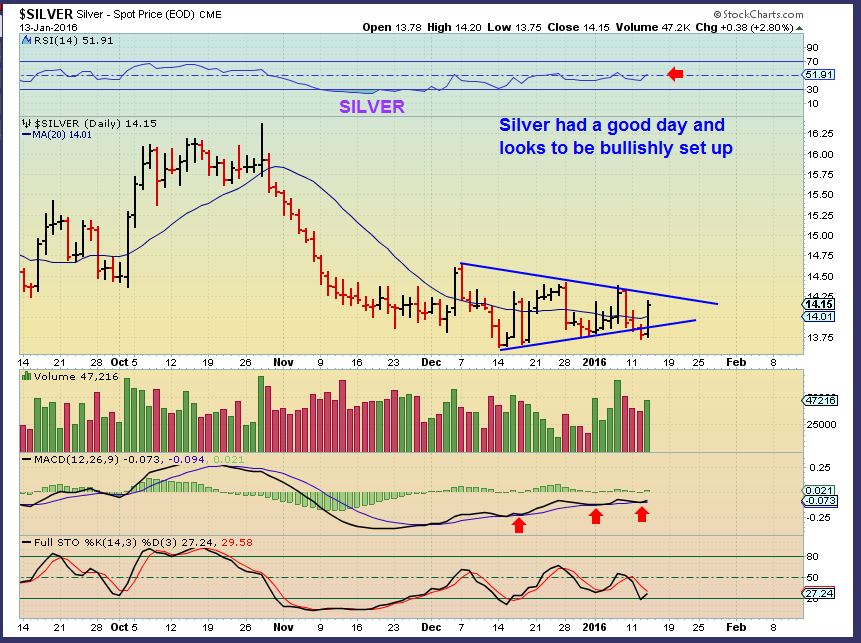
SILVER – Silver has been lingering at Lows, and yesterday it puts in a nice move higher. This chart would be considered Bullish at this point too, but again, Miners stalled below the 50sma which is around $13.84. If SIlver breaks out here, USLV is a 3x long leveraged position for silver, but Silver is VERY tricky until it breaks out & runs. Buyer beware!
GDX- So here it is. Gold has a very bullish looking chart, and GDX / GDXJ stalled under the 50sma. I drew a channel that shows that it isnt ugly bearish, but it needs to push higher really soon I.M.H.O. It is finally at an oversold point.
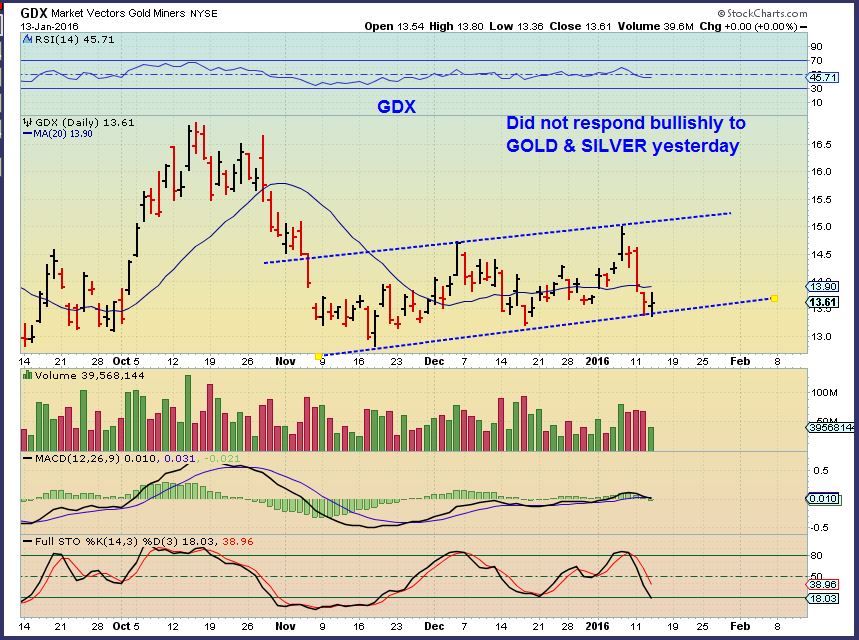
This is what I am going to look for. GOLD and SILVER were up nicely and GDX stalled. If GOLD and SILVER are RED today, can Miners can hold up above recent lows? Or will there be a continuing sell off into a dcl? Gold Green – Miners Red yesterday. I always feel that Miners lead the way, so the burst higher in Gold would be a head fake, but that GOLD chart looks near perfect, so there is some kind of an illusion here. A break above the 50sma in Miners soon is important and I’ll show you why. ( Read the chart) A break higher would be bullish.
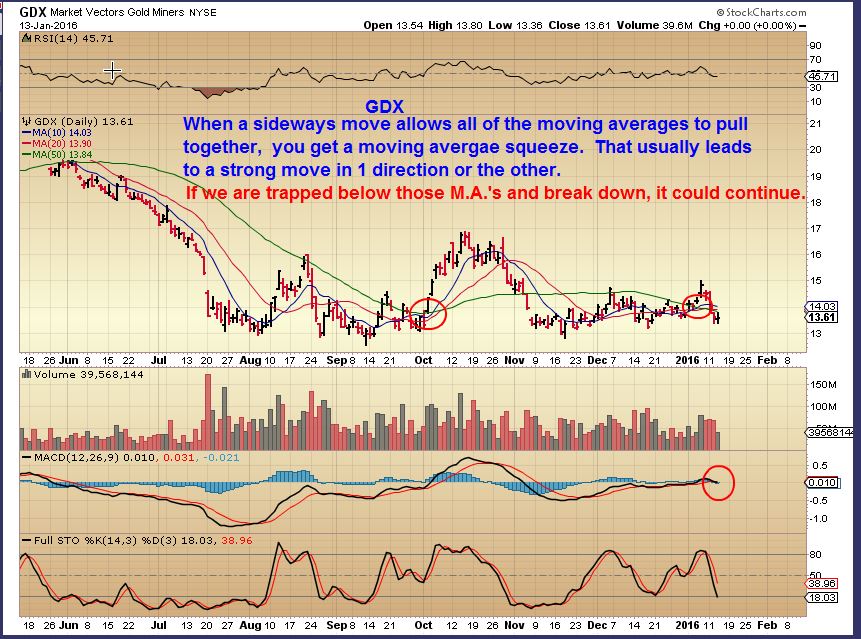
A strong break down from here would target $11. NOT my most likely scenario with the Gold set up and C.O.T., etc etc , but the Miners lagging is concerning and all things should be mentioned to avoid Bullish Bias.
I wanted to post 3 charts of some Gold stocks that did run nicely. I used to trade them earlier in the 2000’s when it was favorable to own AFRICAN MINERS due to the RAND VS USD . I studied the situation back then and found that they had their expenses & paid workers in the RAND (Cheap) , sold their Gold in $USD ( Profitable) . Cheap costs & High profits. It then became dangerous to trade African Miners due to things taking place over there affecting mining. Apparently, it is favorable again? You may want them on your list for a pullback.
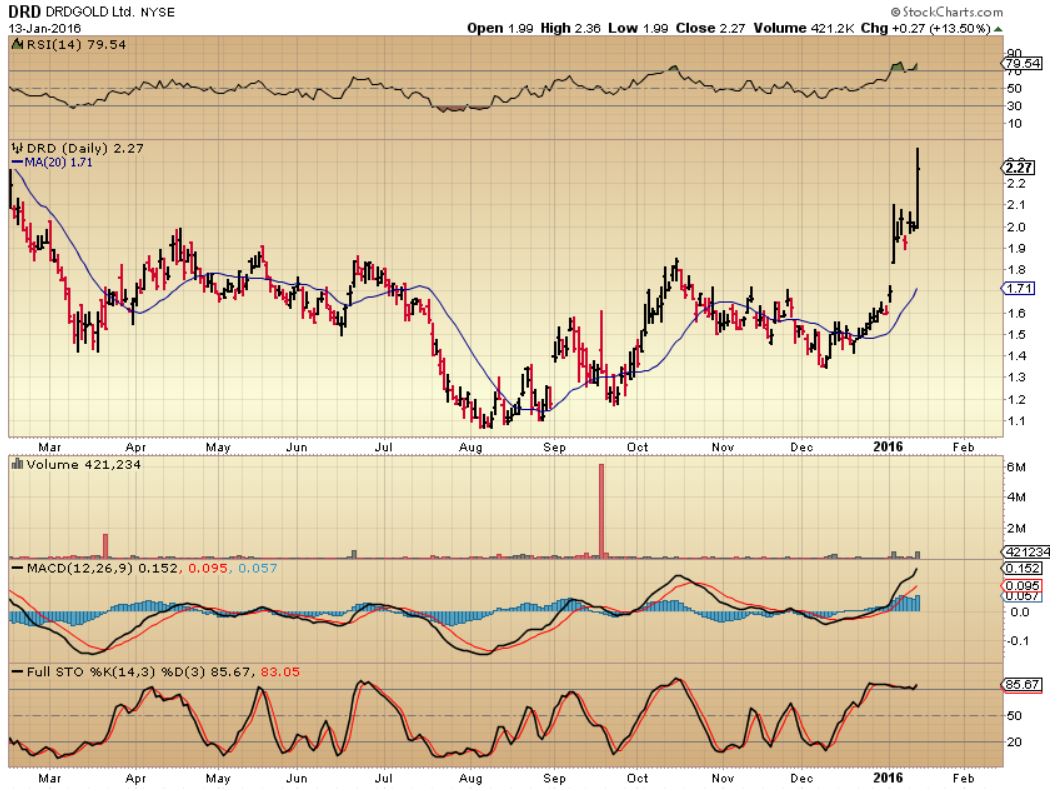
This was my chart of DRD posted here JAN 5. I was saying to watch for the pullback after such a burst higher …
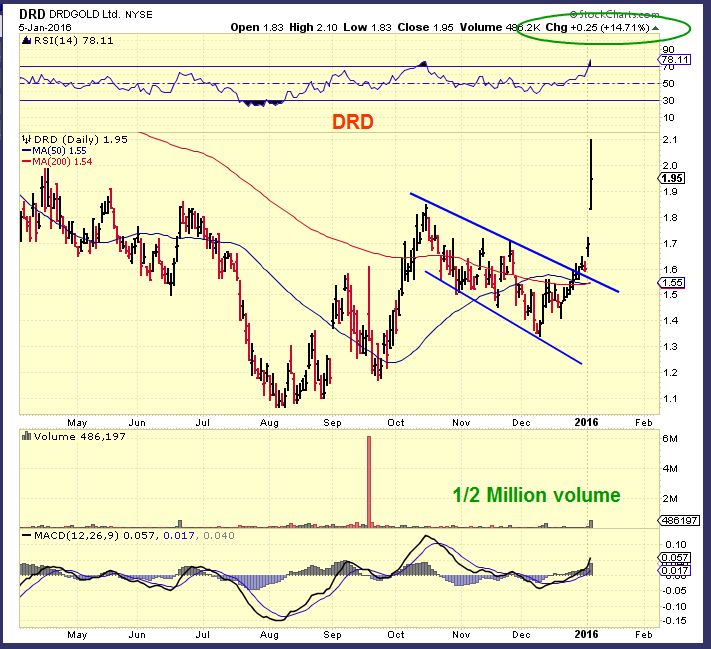
DRD – It formed a Bull Flag and broke higher yesterday. I missed it, but it could set up again over time .
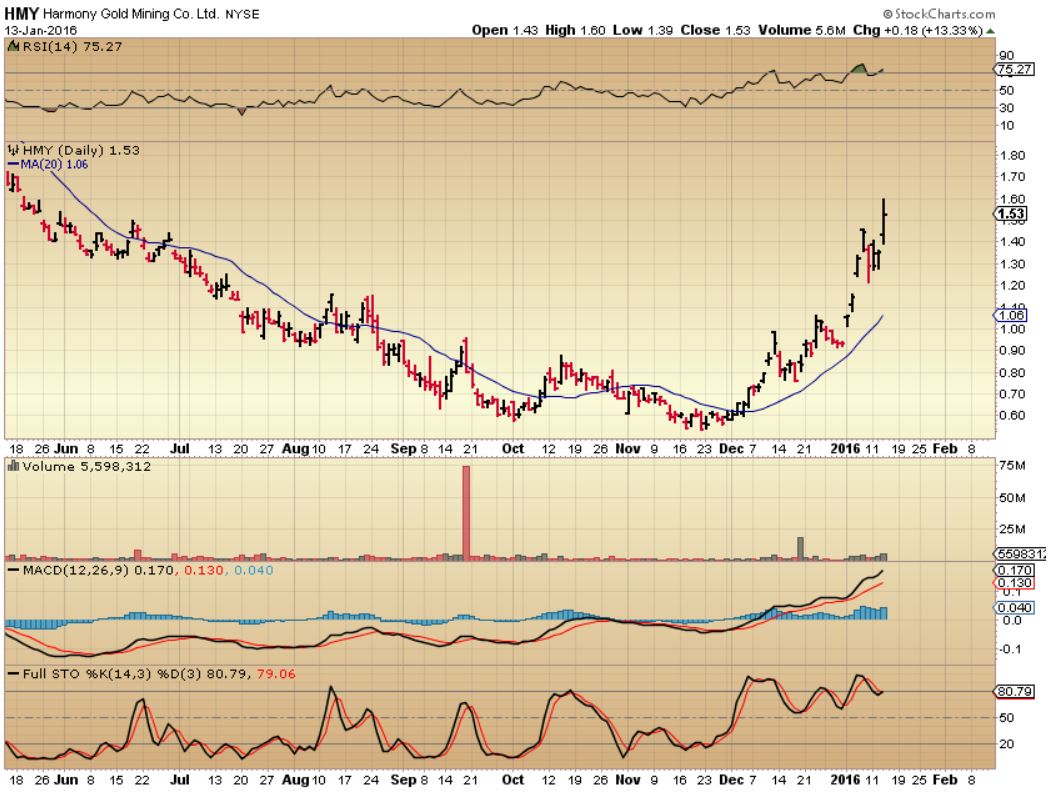
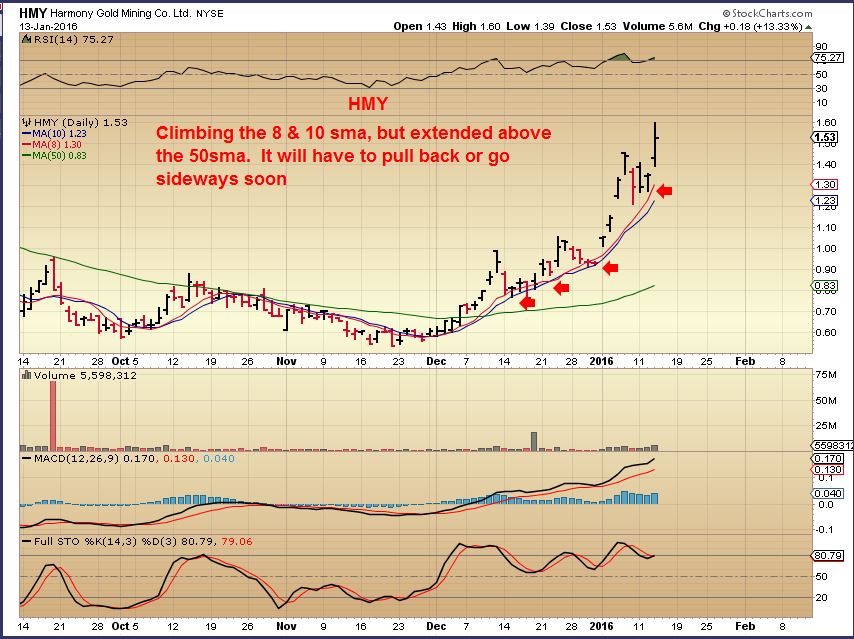
HMY- Also mentioned recently , also broke higher yesterday. Good for the watch list.
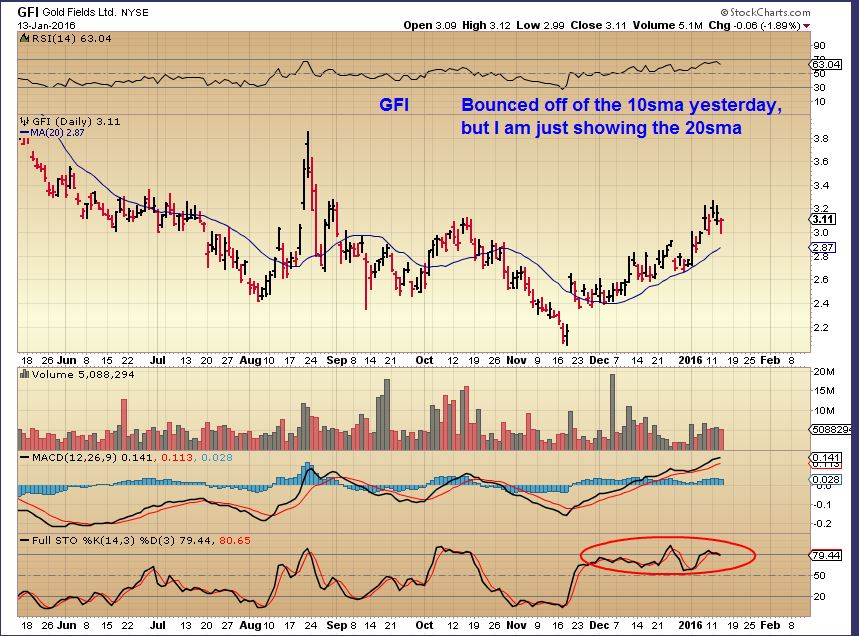
GFI – This is in the same group, so I am showing it here. It hasnt popped ( And may not) but it is climbing nicely.
SO trading is fast and crazy, I’m waiting for further clues so that I can enter a trade for more than a day or two. OIL may bounce here, The markets can drop straight down or stair-step around, NATGAS is falling to the 50sma at $2.20 (possible support for another trade higher). Some may take a trade there with a stop a bit below the 50sma.
I am interested in watching the precious metals from the sidelines for now and see how the current conditions resolve themselves. As I write, Gold & SILVER began rapidly dropping. Watch the GOLD/SILVER charts above for support areas and we’ll see how miners react. Sometimes just sitting on the sidelines until things become clearer can give one a clear head or piece of mind. We can wait for a good set up to take a trade that we can stay in for more than a day or two. Best wishes and thanks for being here!
~ALEX
It’s after 8 a.m. , I want to release this, I’ll go back and correct typos soon. Thx


I’m going to take a shot long S&P today, way oversold. Overall, I think we’re headed much lower, but expect 1867 Aug closing lows to hold. If small gap up closes and reverses this AM, that could be a buy. Low risk? No, but defined risk as stop out all below Aug lows, no questions asked, watch while in cash.
I stopped yesterday, flipped short with UVXY (the widow maker – stay away!), and cashed +10% by end of day.
If we do hit a major overhead like Alex mentions, I’ll head short as discussed.
Called, nailed, BUT I was stuck in a meeting and missed the trade! Ugh!! #Chasin’ItHigher #Comeonbaby recover and give us a nice short entry in 1-2 weeks!
SBGL .. thought on this.. thanks
Hi Ron,,
Thats actually another good one that bottomed in 2013. In fact, it ran REALLY WELL in 2013 when you look at a weekly chart, so It has ignored any ‘noise’ in the gold market and has run up nicely. I dont know much about the company itself, but the daily chart is good also.
It was stopped at the 200sma, and recently broke above. I dont know if you are looking to enter or own it? If I wanted to enter , I would look for a pullback, but if I was worried about it continuing to ignore noise and run like HMY or DRD? Maybe I’d take a small position and buy the dips. It is slightly extended, but so were DRD & HMY.
Refresh for a chart
.
GDXJ seems to be weaving around another wedge structure.
Apex at about 17.70…. possible target?
(btw.. thats Daily chart from march 2015 to now)
similar one for GDX.. apex at around 12.66
KEG, WOW
GG breaking to new yrly lows isnt helping GDX
DSX … hmmmmm
Salt, NM, SB , SBLK same sector
GSI 2 month chart ( Was that a split??)
omg… gulp
no
http://us.rd.yahoo.com/finance/news/rss/story/*http://finance.yahoo.com/news/general-steel-skyrockets-announcing-divestiture-184216175.html
drys… wow – i cant believe that’s a penny.. i swear i was just trading that in the 3s
interesting tho .. and LEI .. just watchn
Seabridge Gold (SA)
I’ve been looking everywhere for bad news on this one, but can’t find any – other than the usual TROLLS at yahoo!
Hard not to buy, knowing that it will likely pop 15% before markets open, on a +$10 gold morning.
I sit and watch:(
(2-hour chart – refresh)
yup… i was watching as well.. blew right thru…
im content waiting watching…. listening …
#crazyMarkets
#FullLengthEpicMovie
Yeah, I’m watching the 200sma as a support for SA ( $6.61) , but Miners seem to be dipping into a DCL.
Glad I got out at 8.92 last week. I was upset that I was early. Now, I just glad I took my chips when I had them!
I was watching GFI ( GDX and a few others) for divergence on a short term chart ( 5 minute) , GFI had strong divergence so I watched it tick by tick and all of a sudden a huge bullish engulfing on large volume ( refresh) .
Refresh for a chart -No recommendation, but as a trader , that is something that I look at.
GDX was similar at $13.08 $13.10 area .
.
….
ps. #ULuvIt (my gifs)
That reminds me…look at the opening theme imagine. That is not a GIF, its a still pic. It is holding perfectly still, but when I stare at it , it looks like it has spinning wheels to me.
#crazyillusion
yes i plan to … tonite – no time now – used to get books of those back in 90s — used to FRAAAA EEEEEEKE me out – magicMushroom type stuff.. whew…
ps. i used to LOVE those newton balls too… (yesterdays pic)
It’s all i keep thinking about…need to get one for my office ….
hehehe you love balls. (sorry, couldn’t help it)
It’s got heavy volume on the 3 minute flag, so it may fall apart now
NG broke the 200sma and recovered. Even the good ones are tumbling to day
SA, NG, HMY, DRD, RIC
RIC is dropping to both the 50 & 200sma. THAT should hold, right? : ( Maybe not
GPRO chart is rather amazing.
u mean GoPoo? 😉
sheesh look at CRK .. i fell asleep waitn on that one – #dumb
ohh, quite the double bottom, but will it last.
Check out LEI, that one actually remained normal on its correction
i mentioned LEI earlier…
oh yeah – i didnt scroll down that far
tempted 2 take a bite of that crk .. watch tomoro see if that 1.15 1.17 holds…?
I hear that CRK is addicting
giggle
CLNE usually not far BeHind either …
u didnt answer me on CRK … (note the ? at the end) 😉
idk if u remember, but back in the day on ST i would say .. hmmmm .. to something.. and u would just write “NO” … lol
#hilarious
NO
..
So Gold continues looking for its daily cycle low. When these things break down, they just get ugly until the lows are in.
#Minersleadingyesterday should have known
Stopped out of UGLD today. 🙁 Maybe it was too tight and breaks up today, but I don’t like miners here and uncertainty everywhere. I didn’t want to risk a larger loss, so I took my lumps and went home.
Pull up a chart of GFI with a 20 sma
Yikes! nasty gap from 2.36 to 2.22
Do you worry about those?
I always keep an eye on Gaps, but sometimes large bullish gaps open like that do not get filled for years.
If I had a stop in place below the 20sma ( Which is supporting price so far) it would never affect me.
Makes sense. Thanks.
interrrrresting
and… SA .. is it really a coincidence that it’s closing in on the 50 ANNND the invalidation point of the 4th wave …..
hmmmmmm….
https://www.tradingview.com/x/FbOfbbNy/
I dont know what you mean by the 50? Did You mean the 200 sma when you said the 50?
the pink line… giggle
sorry – i should have specified on the 3day or weekly — i flip back & forth betwn daily, 3day, wkly — it helps me synthesize information for the counts…
(dont ask — let’s just say I’ve come to trust the little man behind the curtain to just work his magic crunching all the data as fast as my eyes can take it in) ;o)
Yeah, that’s on a weekly, SA now a buck and light change below 50-day on daily. If you want to chart near-term momentum on a weekly switch to EMA-13 vs. 50-week – that’s too slow of an indicator for miners.
Crystal ball saying GDX low in, near term……….
yeah… show ..uh nmd
where’s that DUST harmonica u were swinging around… does it look anything like this?
or should i meet u over there in TV….
https://www.tradingview.com/x/JpQg1P26/
Perfect
i only see a dust chart from 1 mnth ago… is that it?
On TV? No many more recent ones.
I’m staying away. I don’t see the risk/reward right now. This week was brutal and expected. It’s like flipping a coin right now!
SPX:
I’ll be getting itchy finger syndrome to buy HDGE if SPX retraces 50% of it’s Happy New Year drop.
http://stockcharts.com/h-sc/ui?s=%24SPX&p=D&b=6&g=0&id=p77164501418&a=440989258
Expect a GIF shortly for that
lol… i told u i was #workn
You are assuming!
Nice Chart, Irwin. I’ll probably start at 1980 and pile completely in by the 50-day SMA which I expect to continue to move down below 2040 by the time we get there. How quickly at which point will be determined by what we see on the way up!
Alcoa (AA) is a screaming buy right here! At least to my limited knowledge
CENX too…In Technical analysis, if it closes like that, it is.
FCX has capitulation volume. Is it commodity time to run ?
I cant believe that Vale is at $2!
Its times like this you need to be really liquid. They all look good. I have no idea why they are all so low? I think of them more as general market companies not commodities.
wow… indeed.
so sexy
What! Vale is at 2$!)?
ps. DUST also have this alternate (see pinky wink path)
https://www.tradingview.com/x/KlhILuK5/
Nice, you’re using candle patterns. Lets see, who else does that? Hmm
oooh boy.. NADL… sheesh
NADL, KEG – Boom!
If you bought the gap open down in THTI , you would have had a 300+% gain in 1 day . Crazy stuff.
I was just watching REXX and it just popped pretty big.
ETE – that chart shows potential
I’m gone for the night – have a good night all!
Nat gas anyone? I didn’t like it slicing through the 50 like it didn’t care. Yes, must the consensus but still had a -168 draw with more cold to come next week. I think the next 2 weeks will show solid withdrawals. Looked like it was on sale to me. I’m in. I wanted to buy it when it took off, and now finally my patience has paid off!
Anyone knows what time are the option expiries today?
Is it affecting GDX and GDXJ?
End of day – options pit will close with market today at 4PM Eastern. Monthlies for Jan all expire today. It’s not a quad witch or anything, but you can expect higher volatility and higher volume. Yes, includes GDX/J.
Not certain on futures, haven’t checked recently.
NEW POST – DIQUS is delayed in the email alert
About 3 more minutes until my account implodes….