
Fast Trades
Just a Quick market review and then I want to discuss some fast trades for those that like to trade, but aren’t ready to buy & hold quite yet.
.
SPX – I discussed the reversal and likelihood of that low to be in place for a bounce / rally. Thursday did put a swing low in place and the timing is right for a low. We do not have a break above the 10sma as confirmation yet , so the safer trade lies ahead, but some may have wanted to buy the swing based on timing, and place a stop below the Wed lows.
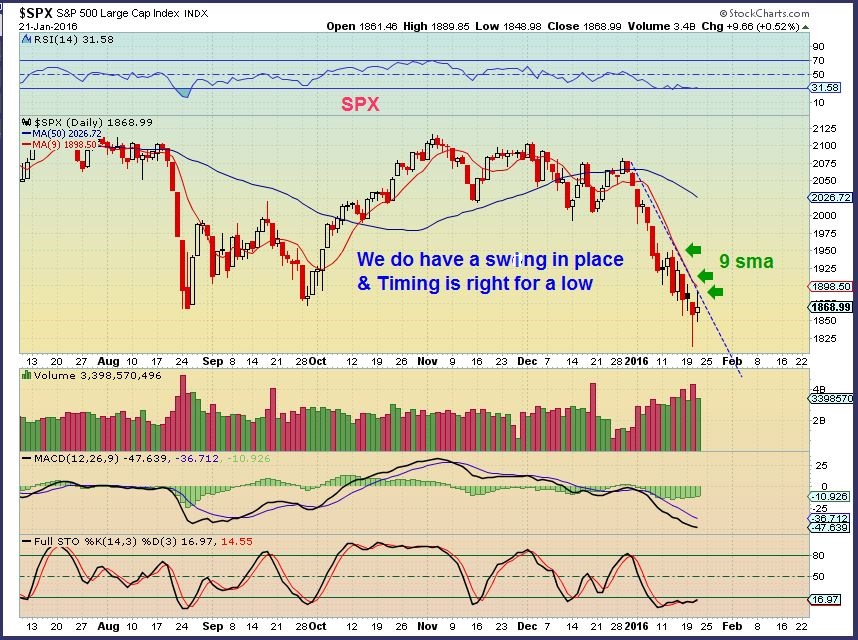
SSO, TQQQ, etc can be traded coming out of the lows, with a stop just below recent lows.
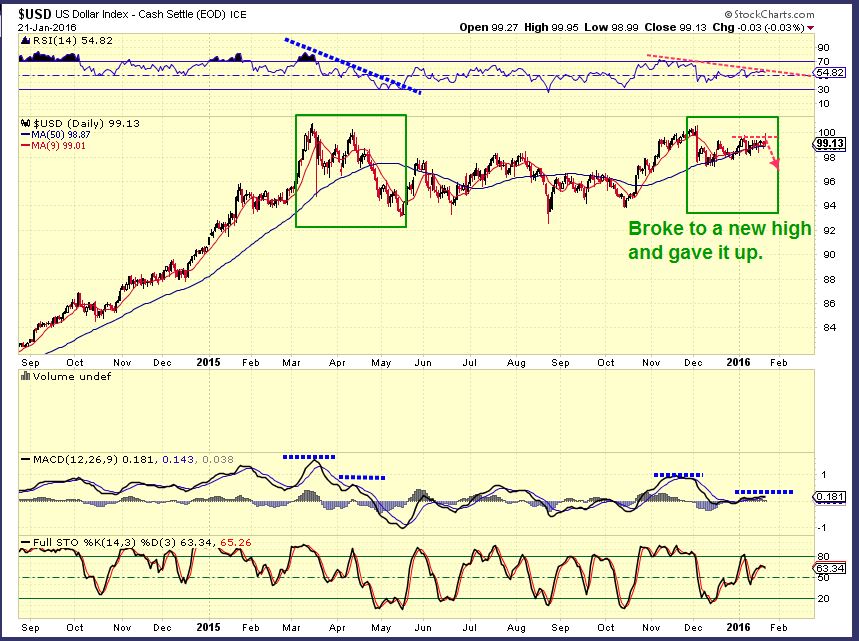
For quite some time I have discussed that I expected a double top in the dollar on a weekly , and this pattern to play out on a daily. My Dec chart below showed the similarities of the March Peak and the current one, with a final break higher before possibly rolling over.
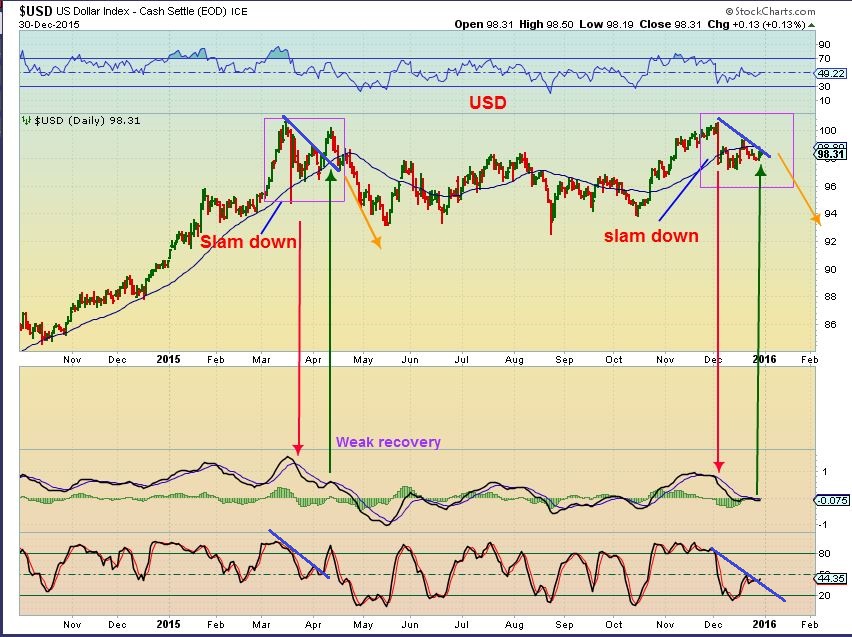
The pattern is playing out as expected so far, with a lower high Thursday & reversal. The USD today looks a lot like the double top at the March highs. A drop in the dollar should help Gold / Miners.
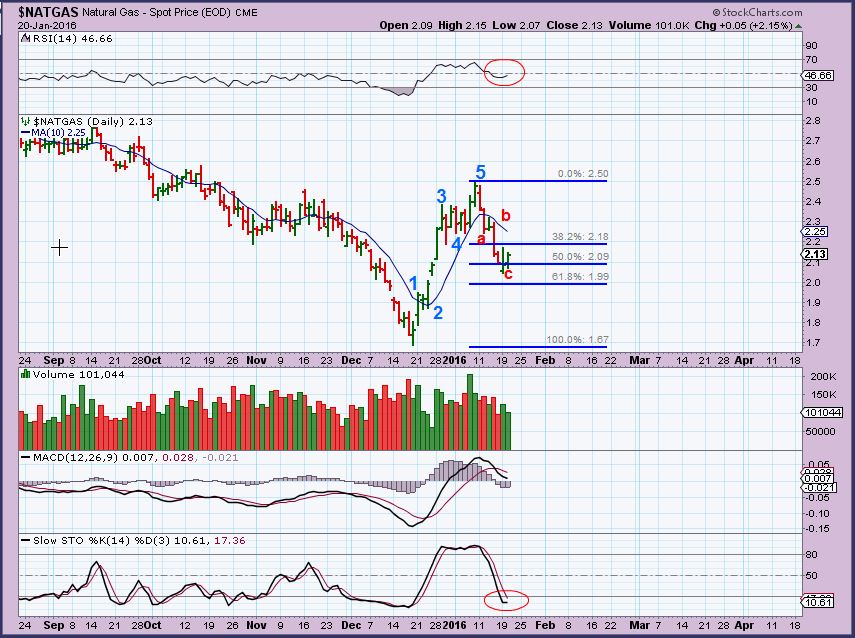
My NATGAS chart from Yesterdays report. No change yet, but we dont want to see a bear flag form here, we want upside movement soon.
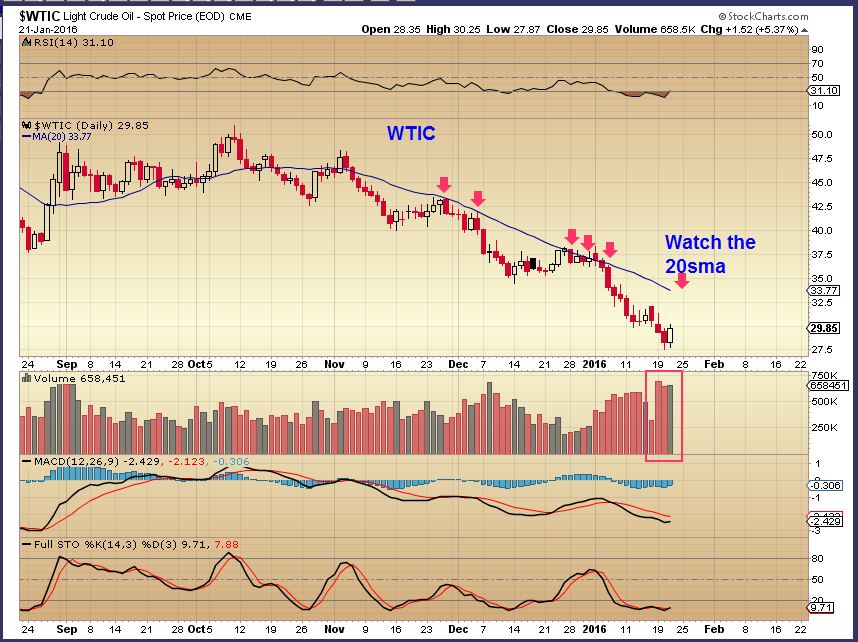
WTIC – I think that this is a swing low with capitulation volume. I have pointed out that these daily cycles run up to the 20sma and find resistance until we get the ICL (LOW) . We have a swing low in place and MANY MANY Energy stocks took off. Is this an ICL or DCL? Timing would say 1 more daily cycle could occur before a final low closer to Early Feb, so we’ll watch how this plays out. Watch that 20sma and we’ll discuss it as we go. I will discuss trading energy stocks at the end of the report.
GOLD & SILVER have not changed, see yesterdays report.
GDX- We do have a swing low, but no break out above the 10sma. I still expect higher prices with Gold & Silver, so why is GDX lingering at the lows? I just want to point out that it has behaved this way in the past before moving higher. It has lingered at prior lows, so we will watch for an upside burst.
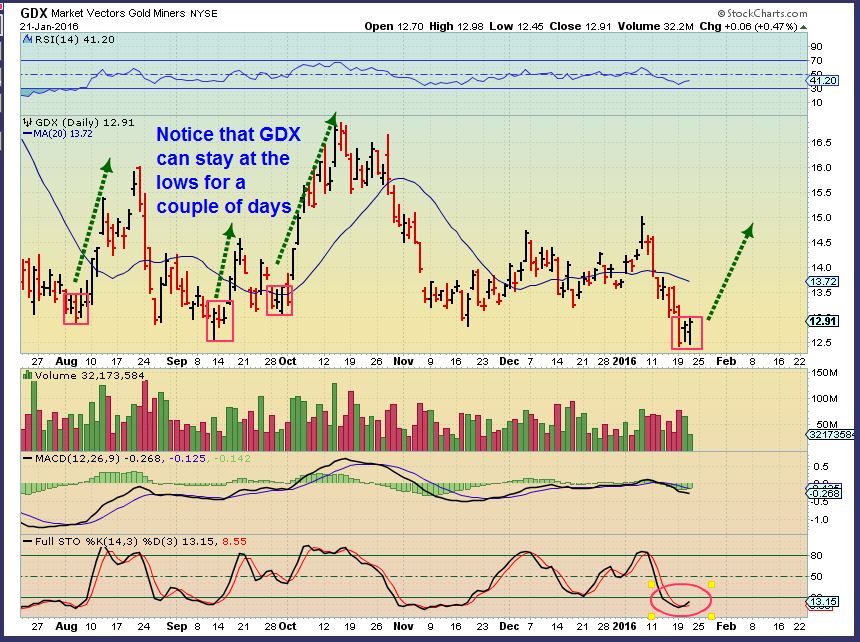
I took positions ( I dont ever recommend NUGT , but I took a trade in NUGT Yesterday) with the additional ‘Gap Fill’ Thursday – I pointed out a gap fill in Thursday report. It seems so low risk with lows right below, so I will keep a stop below the 19th. Many are getting bearish on Miners with this pause , and that is what we want to see at lows.
.
I wrote about “reversals” in my report too. I mentioned that the safer trade is buying the follow through above the 10sma, because many reversals fail on the way down until you get to the real lows of an ICL or even a DCL. We are seeing deep sell offs, but I believe we are at least at short term lows for OIL. ICL or DCL remains to be seen, but even DCL’s have made it up to the 20sma, and energy stocks have made rather huge gains for FAST TRADERS.
Lets discuss those trades for experienced , fast traders. These may be only 1 or 2 day trades for some.
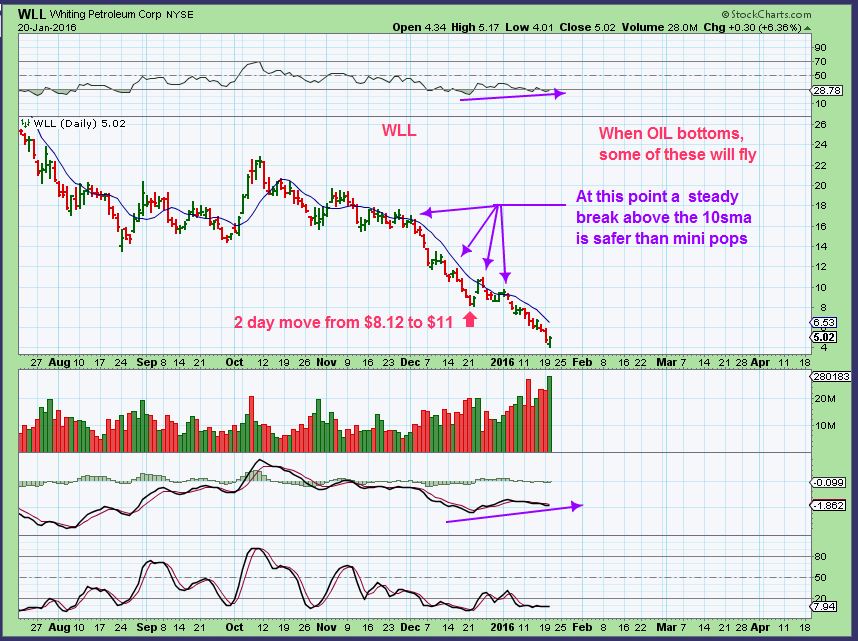
WLL – Yesterdays report I was showing fast the 1 or 2 day gains can be ( $8 – $11 in 2 days), but they still lack follow through above the 10sma until lows are in. On the reversal in this chart, it could still POP to the 10sma and gain 20+%, notice the positive divergence in the MACD & RSI. That is a big 1 day gain.
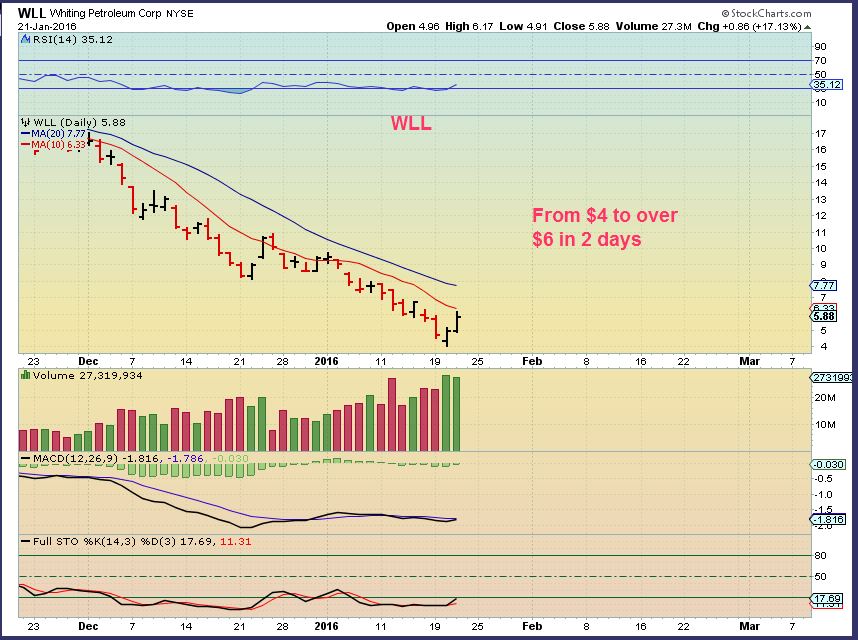
WLL – And it did gain another 20% Thursday, yet remains very oversold. If Oil continues higher, these trades could run even further, so I wanted to discuss these trades – BUT – know yourself and your trading ability. This isnt buy & hold yet, in my opinion.
These types of trades may not be for those who are not in front of a screen all day. These trades can be fast and may need your attention if they turn against you. Its a trade where you jmp in and try to scalp a part of the pop higher that may be only short covering. I just need to put this warning here so that everyone doesn’t feel comfortable that Alex said I can make 20% a day on each trade. NO. These are risky trades until OIL really shows proof that even temporary lows are in. Even then, some of these companies could go bankrupt or have other issues, but for those watching trades, you can often enter near the lows and grab a quick short covering burst higher.
lets review a few things that I look for.
1. For example : The WLL chart above shows the Bullish divergence that I prefer to see.
2. I also want to see the whole sector moving together, not just 1 or 2 stocks popping.
3. I like to see a deep sell off to oversold and a reversal that takes back at least 1/2 of the candle at the lows. I usually buy that reversal for a trade – often if the divergence is there and the sector is due for lows like Energy.
Lets look at charts.
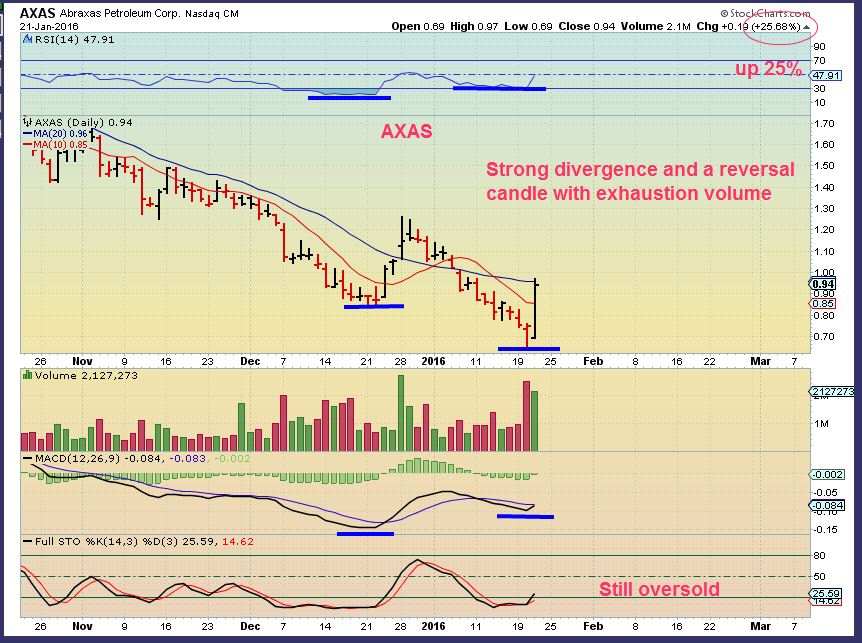
AXAS, Look at that Divergence and the reversal candle Wednesday, and OIL was deep in its count. I missed the reversal candle as a buy, but I bought it when it went green Thursday a.m. for a follow through trade. There are others…
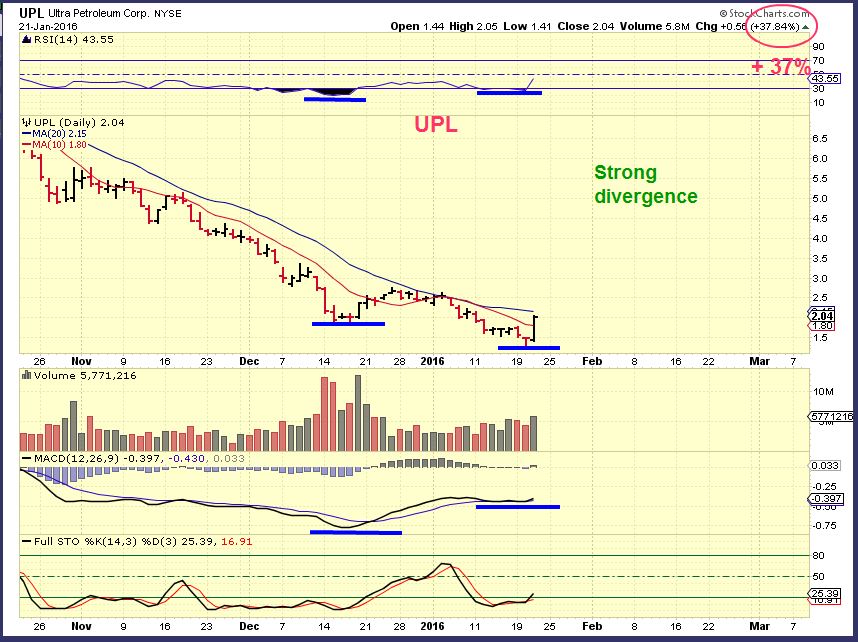
UPL – Same divergence, lower lows and the MACD higher. This was 1 reversal day off of the lows and then a pop, so this might have a more upside if OIL keeps moving higher.
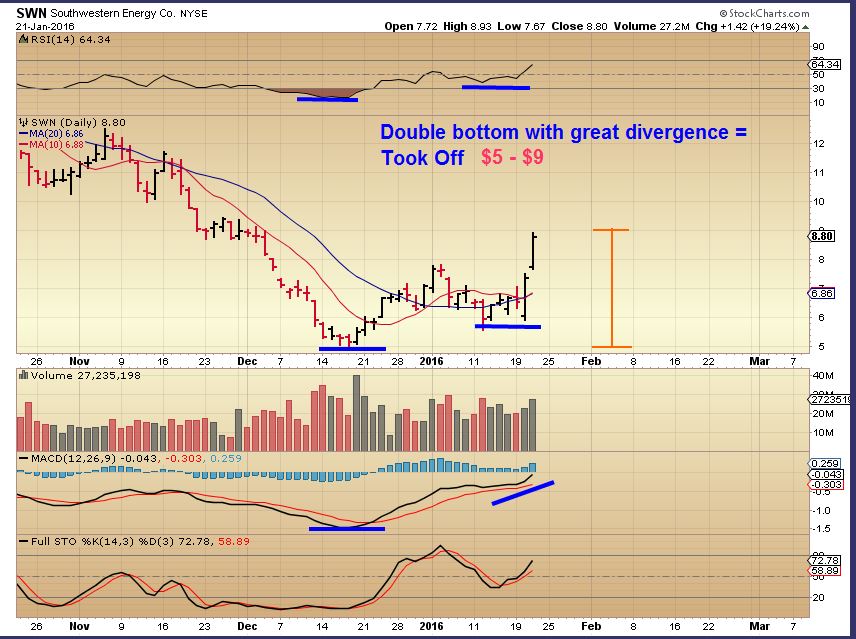
SWN– This had Amazing divergence and a higher low, and now has strong follow through
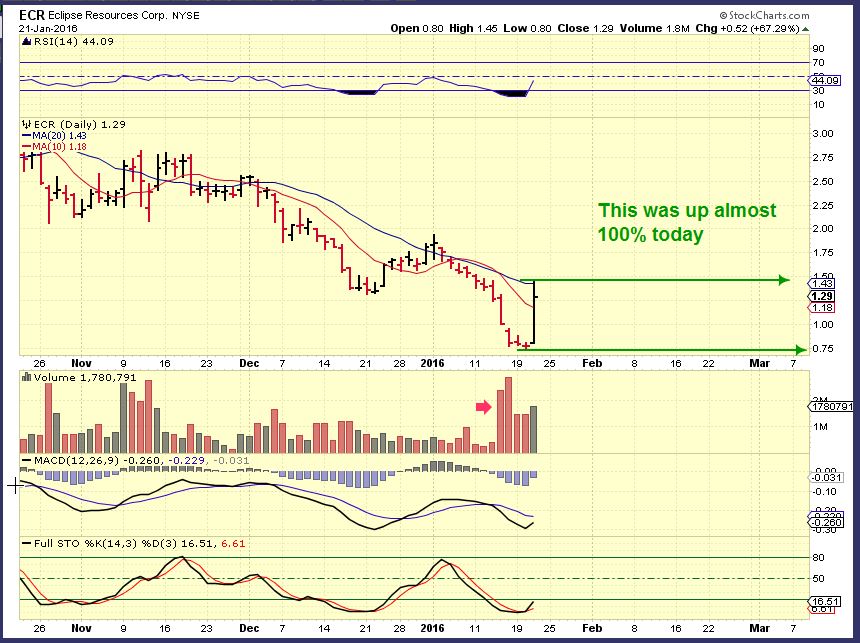
ECR – Divergence & Capitulation volume lows. Little reversal candle and then a Big Pop. These could be short covering, so this gives you an idea of what to look for. The reversal candle before the pop.
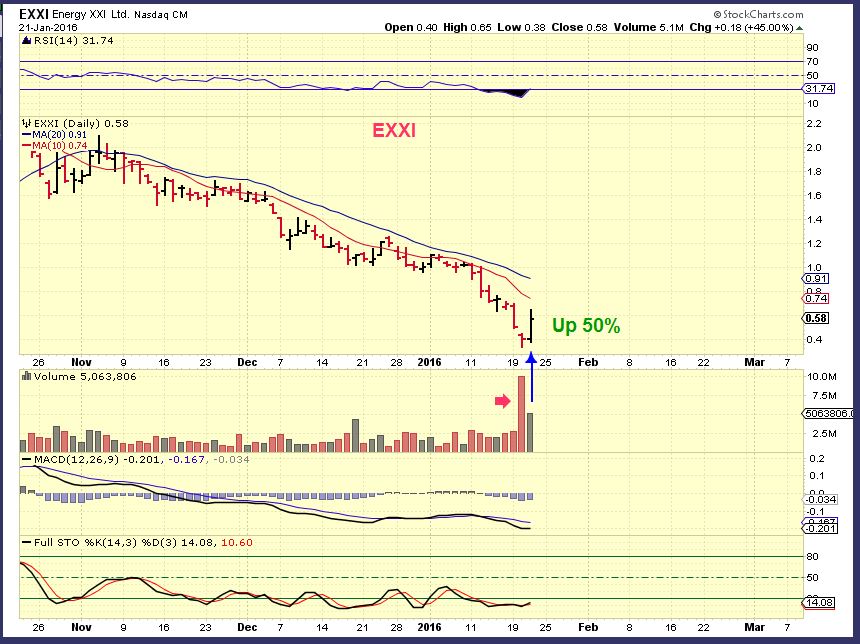
EXXI – That capitulation selling into a reversal candle at the lows produces a good short covering pop when the sector turns. This has no divergence, so I’d be cautious here. These often tun down at the Moving Averages & base out.
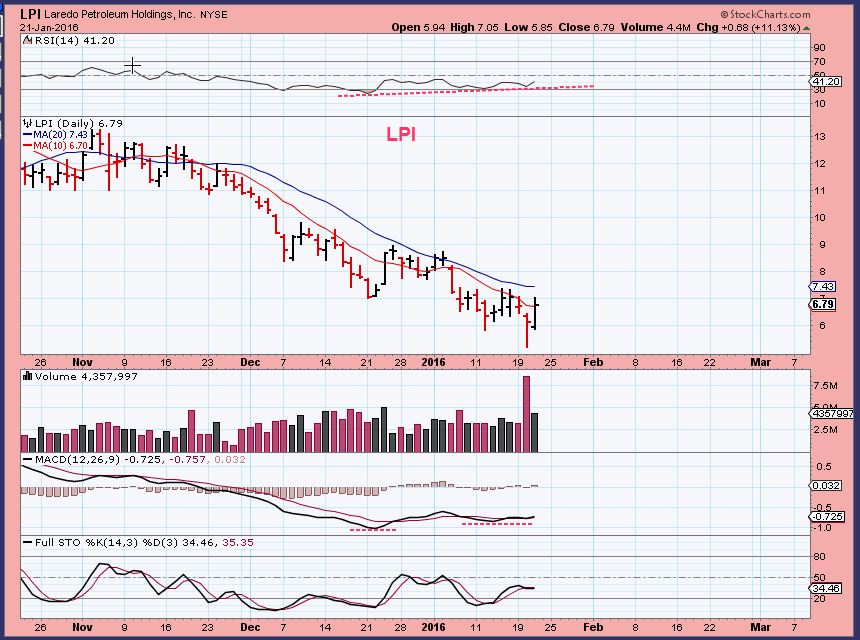
LPI – This had a reversal candle with High volume & a bit of divergence. If OILS lows are in and it moves higher for a few days, this could continue higher .
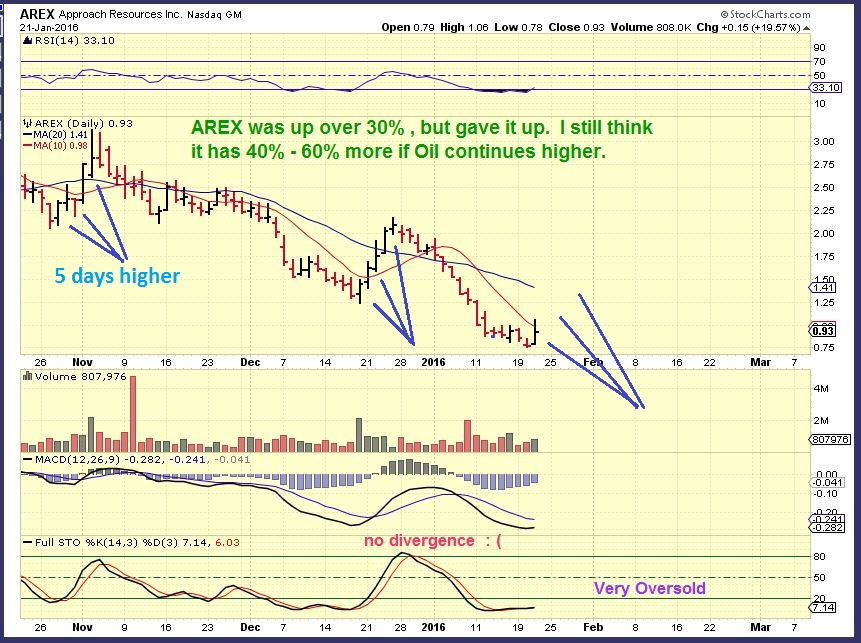
AREX – Recently Arex moves higher for 5 or so days at a time in the past. This was just day 1. This is a buy candidate for that type of trade.
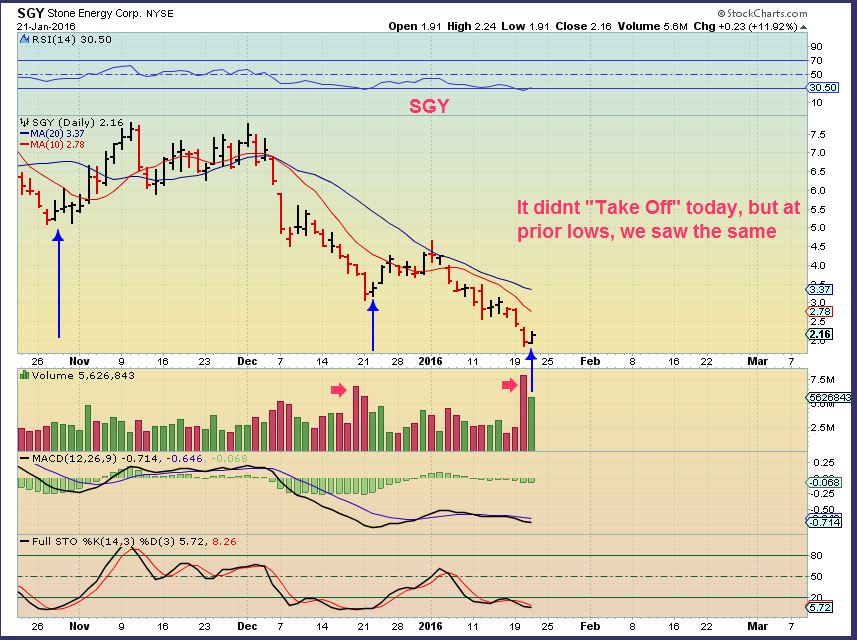
SGY – I’d still buy this with a stop at the lows. This could be just starting to move too. It doesn’t look like much, but went up 12%. The blue arrows are showing that the 1st day of the run pops up and doesn’t close at the highs (Sells off into the close). That was fine, it still ran higher for a couple of days.
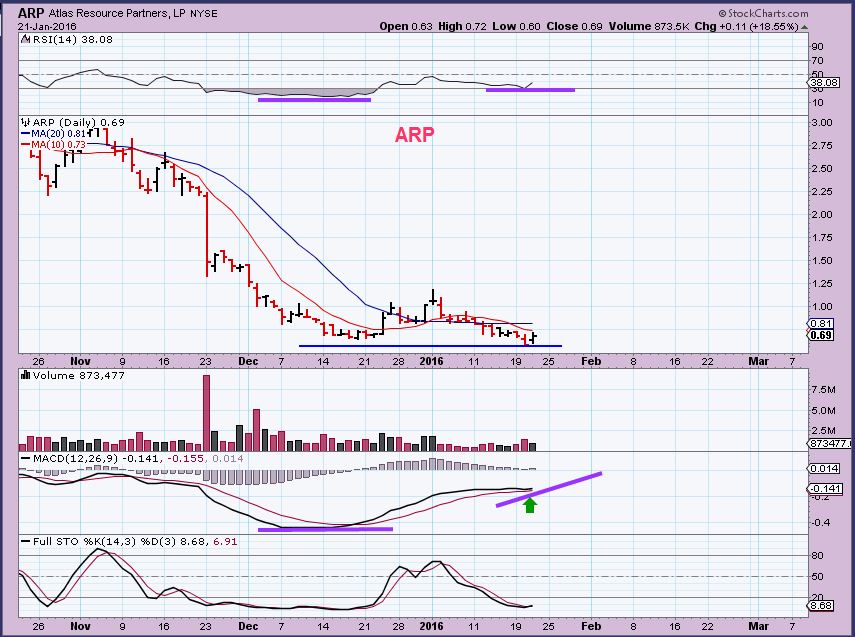
ARP – This tiny move looks like nothing , right? Up 18% ! Under $1 and some do not like that, but this looks set up to move. Double bottom lows with strong bullish divergence and still oversold. I would buy this with a stop under the lows. Just a trade, and yes these are all risky with fundamentals being weak after this sell off.
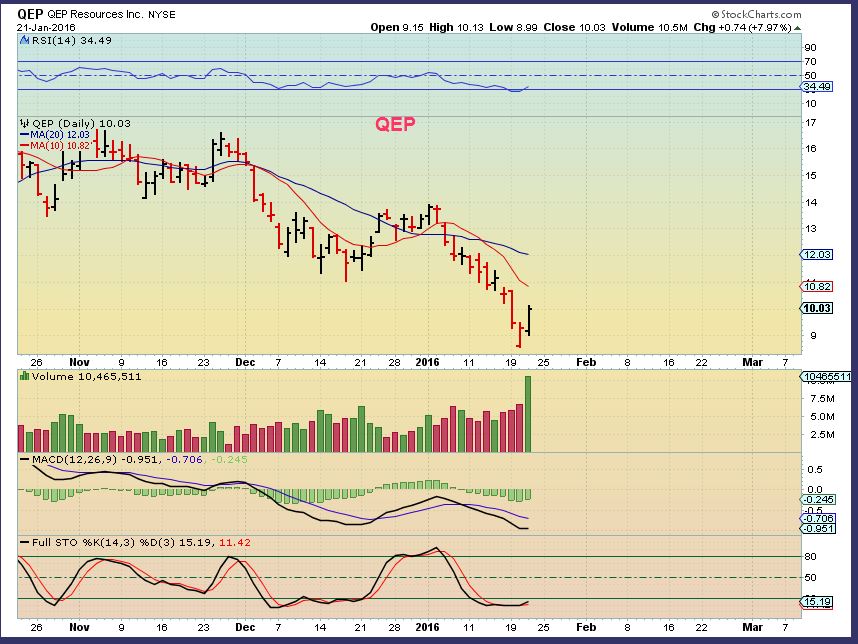
QEP – Nice pop, Strong volume off of the lows. Problem is that this one in the past Popped and went sideways, and popped and stalled etc. Tricky. In Dec when Oil bounced, it did move from $11 to $14. Good volume.
*********
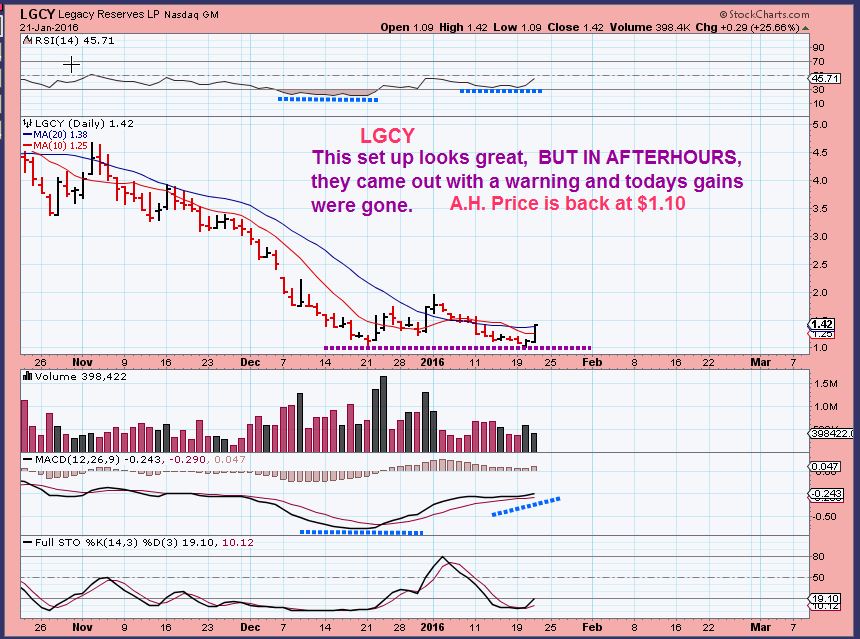
LGCY – A WARNING NOTE: This one has a perfect set up, strong divergence! I think I would have bought this one, but….They had news in after hours and it gave up the whole 25% days gains. It is back at $1. It’ll be interesting to watch this one Friday . THIS is why I feel these trades are risky and only for experienced traders. They need constant attention.
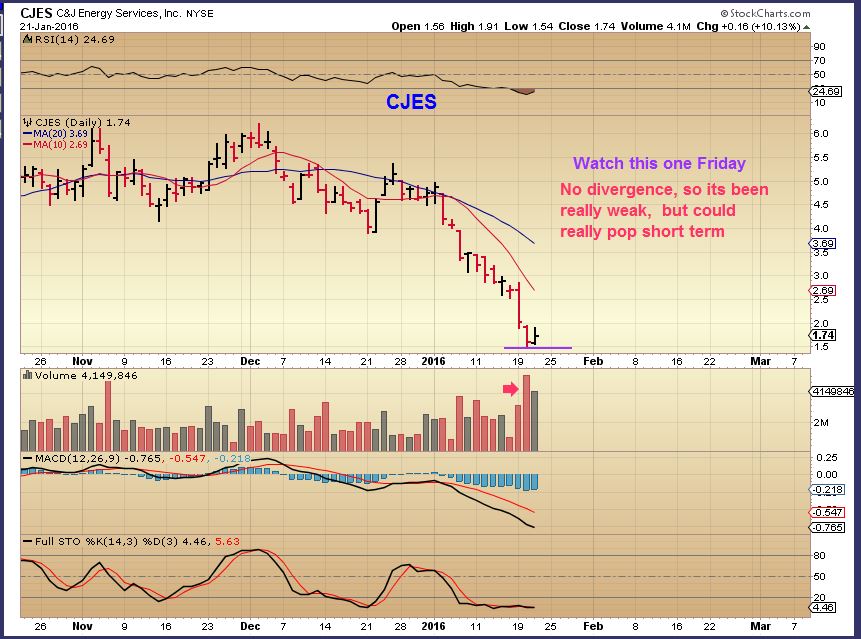
CJES – I look at a set up like this and I usually pass on it. Good capitulation lows and reversal, but it’s just not the best set up. Why? It has no divergence and the MACD is bearish. It still may bounce 50% or more, since it is so oversold. Actually a POP to the 10sma near $3 is almost a double, right? I do like to see a bit more of a bottoming process and divergence, but this could V-Bottom. It could be bought with a tight stop.
You can see how quickly these moved , rising 10%, 20%, even 50% as the day went on. I showed REXX Wednesday and pointed out almost a 100% intra-day move. What did it do Yesterday?
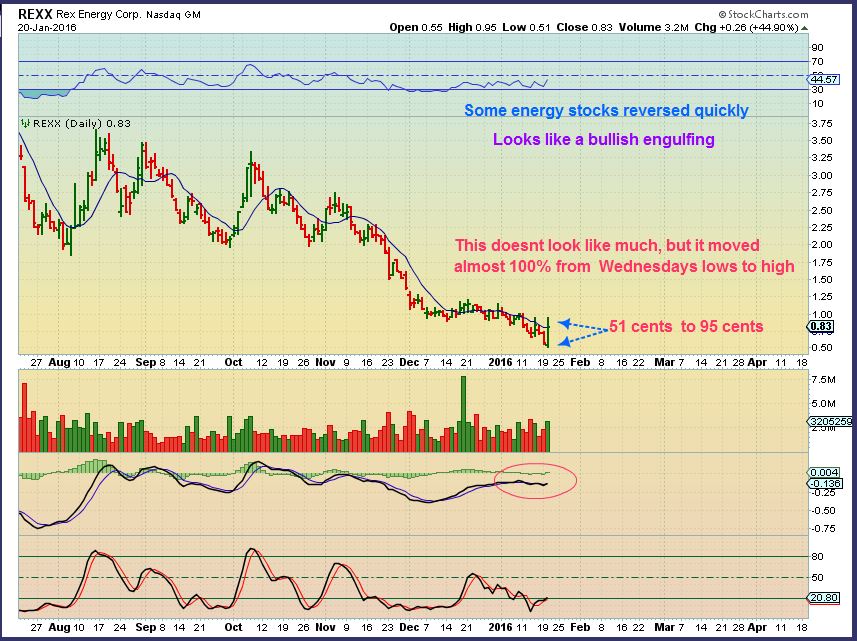
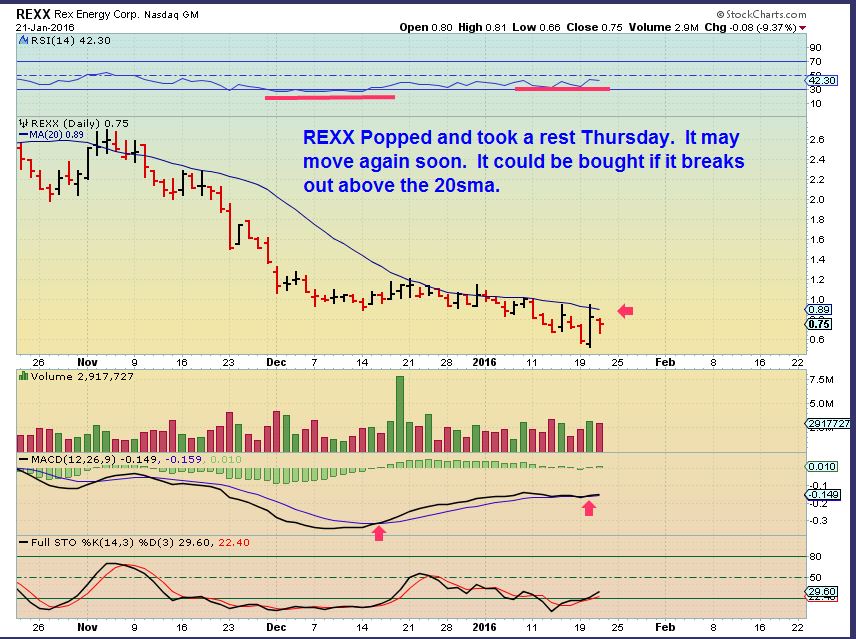
It stalled while all the others ran. This could have been bought anticipating that it will pop again, or a break above the overhead Moving Averages could still be bought.
I like BBEP right now too. I bought it yesterday but I didn’t sell it.
.
SO REXX shows us that some that POPPED on Thursday may stall or even pull back today. Those may be opportunities to try to catch another Pop on Monday. I just wanted to point this out because if OIL put in a Low here ( Even just a DCL ) It can rise to the 20sma or go sideways for a week or so. That can allow some FAST trades in Energy stocks for experienced traders watching their positions. I look for those coming right out of their lows . Since these are moving up 20-50 % in a day, you can scalp some quick trades while waiting for OIL to show what type of lows it has put in place. SOME may want to buy & hold for a few days, but remember LGCY, you can see that a little bad news took those gains back quickly. This may not be BUY & HOLD yet for some, but also these may run higher for a week in stair step form. Also using tight stops may repeatedly stop people out. I use mental stops and watch my positions until I get some breathing room.
I just wanted to share this idea with the fast traders. We may have a few more Pops in energy stocks, and some may move for a week or two. I think the lows are in for the markets too, confirmation is a close above the 10sma. I also still see GOLD & SILVER as bullish, I want to see Miners start moving higher. See yesterdays report . It is very difficult trading right now, so CASH may be best for some until we get a little stability and lows that seem a bit less shaky. I’ll cover more in the weekend report.
~ALEX
Follow me on this TWITTER account for ‘alerts’ when I release premium reports only.
https://twitter.com/ChartFreakAlert


CF, If the market lows are in, as you say, and gold is moving higher, then we should finally see a good pop in the miners! yes,
Damn, I put all my cash in the miners. Its tough watching the GUSH train leave without me.Wow crazy good energy sector.
That reminds me that we saw something similar in Energy ? Miners February was a nice run in all the energy stocks, then Miners ICL came in March. I remember jumping from Energy to Miners, but I also remember hanging on to some energy trades too long and giving the gains back.
Hi CF – Still thinking that GDX could be a low risk buy ?
Hi GOLDSA,
I’m in it, I’m bored , trying to be patient, so yes, If GOLD & SILVER would get some upside action, I think it’s low risk…but if too much time goes by, it’ll be time for Gold to seek out a DCL and I’ll have to cut it loose. My auto Stop is below recent lows.
Sorry for the latish reply, I’m in & out today. I have family visiting.
Daily chart looks like a bear flag possibly, with light volume on the rise, so GDX needs to POP HIGHER really soon.
it did recover your 12.92 target though
MGN! Took a small position on its recent correction . Guess I should have bought more. Something is going on with that one.
Nice pop there Carl.
I wonder what that’s all about?
Dunno. But look at how it traded before the most recent correction. Went from about 20 cents to 60 cents in a week. Then took over two weeks to correct back to 27 cents. Now moving higher again.
Some news today that their NYSE compliance plan was extended through March.
I looked at that yesterday, because its in my Miners list and had a nice %- Pop yesterday too. Pull up the chart with only a 50sma. Kind of a perfect landing, huh?
A nice little pop in silver. I wonder if this one can gain some traction!!?
well that took a bit of a whack on the head..
Just a little! The wheels are spinning but still no traction!! 🙁
Darn! Thought that could be something.
$silver may have lost the 50sma, but is still currently (as i write) sat at 27sma & 26ema positions on the daily .. nicely above a thick cord of clustered MAs, which are now starting to point up
URRE looks like a buy
UEC and DNN started to pop.
I was looking at shippers today too.
DRYS, TOO, TOPS, NM, SB, etc etc all popping out of lows at once.
Sold AWK today. Really hate selling what is probably my best investment. But it’s 16% above the 200 day moving average, and my mood has changed from “buying the dips” to “selling the rips”.
http://stockcharts.com/h-sc/ui?s=AWK&p=D&b=6&g=0&id=p72151847285&a=442025938
That has been a beautiful uptrend. Selling today was reasonable, and maybe you can get back in later if it pulls back on light volume. . This one didn’t really get hurt in the market sell off. Probably because the needs of their services dont go away in a recessionary environment.
Not that we are entering a recession, just that the pull back in markets didn’t affect that company. It did a nice consolidation. Looks like a CUP & High handle on a 6 month chart.
Yeah, Irwin, I’d keep this on the radar. Defensive stocks will probably out-perform for awhile. If we get another big downdraft momentum stocks could take it on the chin again. AWK could be a good place to park.
Thanks Cason.
Yes, I’ll be watching for a return to the 50 day moving average to reload; keeping in mind CF’s reminder about pull-back on light volume.
Haven’t bought any HDGE yet; if SPX can get close to it’s 50 day, it may be time to buy HDGE.
Forget who it was that suggested SPX could run to 2000 (now 1907); that would be a wonderful place to short (I think).
Have a great weekend, everyone!
Originally, 50 day was about 2040 on S&P cash but headed down quickly . 2023 today’s close. I don’t think we get 2040, but maybe 1970 or slightly above. I’ll be quick to hedge when I see it. I would like to see positive weeks first.
Just thinking out loud here – Scanning some of these energy stocks
Many have jumped up and bumped against one of their moving averages and find resistance there. They pull back. SO if you are scanning them, you can use the 10,20,& 50sma for starters and see how price reacts there. At times I use the 13 & 34 moving averages. Different stocks seem to be affected by various m.a.’s – so I try a few.
If they hit the moving average, drop for a day or two, they then MIGHT break through if their sector is moving higher or has bottomed for a week or two.
See charts below ( There will be 2 charts as an example).. In the future REXX could be bought if it pops AND CLOSES above the 13 SMA for example, or closes above an upper trend-line (not drawn).. It has not closed above the 13 sma yet.
.
Alex, ERY up $5 from Wed lows, almost 40%. Btw the NYSE 30:1 washout bottom and crude Feb contract expiration, seem to have positive momentum now.
ERY Cason?
Heck of a keyboard slip, eh? I edited the post above to correct. Thanks! Glad I’m not in that one, eh? No postion.
I think the bounce sticks this time. I did fall for two false starts. 1) Wed was more oversold than other times this year 2) didn’t fade today’s rally, today was first gap n’ Go. 3) closed week over 9 EMA, 4) check out the VIX. It really didn’t move down yesterday, today it got whacked. Also XIV didn’t move yesterday, today it flew. What does that mean? That VIX futures fell as well, not just spot VIX, so that is a confirming signal.
Long TNA.
Novice traders, like myself, may find 4-traders dot com useful
Right now I’m looking at the page for AWK.
http://www.4-traders.com/AMERICAN-WATER-WORKS-COMP-2989352/?type_recherche=rapide&mots=awk
> the little chart on the right side shows support and resistance lines
> the trade rating is 3.5 out of 5 stars
> the investor rating is 2.5 out of 5 stars
> short, mid, and long-term trends are all bullish
> EPS estimates for 2016 look healthy
> relevant tweets are shown; ie, today Ralph Acampora tweeted, “Do you want a stock making an all-time new high? American Water Works (AWK).”
> and lots of other info.
Oh crap – I just realized that the above post about “4-traders” likely falls under the category, “other competitive services”, which is a no-no; even though it’s a free site.
CF, feel free to delete the above. I’d do it myself, but I don’t think it’s possible.
Sorry:(